1. Introduction
Various scientific techniques are required to determine the manufacturing techniques and conservation conditions of cultural heritage. In particular, for multilateral recording and imaging from the external surface to the inside of an artifact, nondestructive testing techniques employing electromagnetic waves (e.g., X-rays, ultraviolet rays, infrared rays, terahertz waves, and microwaves) and visual inspection processes are essential. Nondestructive testing techniques are widely employed in structural integrity assessments in mechanical and civil engineering as well as the analysis of cultural heritage (e.g., earthenware, ceramics, murals, and stone pagodas). Various studies have reported the discovery of new feature information that could not be confirmed using only the human eye [
1,
2]. Most previous studies primarily focused on two-dimensional image analysis using a single technology [
3,
4,
5,
6,
7], and even if three-dimensional (3D) shape information was acquired, the results were frequently dependent on external surface information [
8,
9]. This is apparently caused by the limitations of applied technologies and the complexity of data processing techniques.
Recently, various scanners and computer image processing algorithms have been developed [
10,
11,
12], and 3D digital technologies are becoming increasingly ubiquitous, enabling the stereoscopic recording and data fusion of cultural heritage [
13,
14,
15,
16,
17]. Three-dimensional digital technologies are mainly divided into optical scanning and X-ray computed tomography (CT) techniques depending on the type of the physical energy source used and the corresponding light reflection or transmission response. Optical scanning acquires information about the external geometry of an artifact using reflection data by employing a laser or structured light sources (with white or blue light), and X-ray CT determines the internal geometry of an artifact as tomographic information through the transmission properties of X-rays [
18,
19,
20]. Both scanning techniques have considerably different purposes; thus, it is important to select an appropriate technique based on the required precision of the external geometry and internal structure.
Both technologies have excellent applicability and high resolution. Thus, they have been extensively employed in conservation research for a long time, for instance, for the documentation of archeological sites and artifacts, shape analysis, condition diagnosis, digital restoration, and reproduction. In particular, X-ray CT is actively employed for applicable artifacts because it provides vital information for the interpretation of cultural heritage production techniques and the institution of conservation plans [
21]. Thus, optical scanning and X-ray CT are excellent technologies that have led to important discoveries and contributions to the conservation of cultural heritage.
However, the purposes and results of the two technologies differ distinctly. These variances lead to valuable interpretations when the technologies are individually utilized; however, much greater synergy is attained when complementary data are combined. Specifically, digital recording data can be enhanced if the external surface information obtained via optical scanning and the internal shape constructed via X-ray CT are combined into a single 3D model. For this purpose, multifusion technologies that synthesize different types of digital images have been utilized in the medical [
22,
23] and industrial fields (e.g., mechanical and civil engineering) [
24]. In addition, fusion image results with high accuracy have been reported [
25,
26,
27,
28].
A study on 3D imaging modalities that fuse internal and external shapes has also been conducted in the domain of cultural heritage [
29]. This article presents the overall workflow for aligning 3D optical scanning and X-ray CT mesh models and their interactive visualization. However, it is difficult to apprehend the deviation in the registration accuracy when using the two technologies. It is also difficult to understand the merging process. In addition, research is scant despite the need for 3D modeling and documentation that combine internal and external shapes of diverse cultural heritage objects.
In this study, we performed mesh-based convergence modeling of a replica of a prunus vase from the 12th century Goryeo Dynasty in Korea by combining optical scanning used to precisely record the external surface and X-ray CT used to determine the internal geometry to obtain a single 3D model. To achieve this, the dimensions and shapes of the individual models were first stereoscopically analyzed. Then, the X-ray CT model was aligned with the optical scanning model with high dimensional accuracy. Finally, the registration accuracy was quantitatively analyzed through the visualization of the root-mean-square (RMS) deviation for the overlapping areas of the models.
2. Material and Methods
The target object is shown in
Figure 1. The opening (i.e., the spout) of the vase is small and low, slightly widened outward, and partially damaged or missing. In addition, the upper part of the vase body is wide, and the lower part becomes increasingly concave. The lower part of the spout and upper part of the heel are decorated with a lotus flower pattern, and there are clouds and cranes on the entire surface of the body. Notably, the design expressing the cranes’ flying directions has the effect of extending space in all directions.
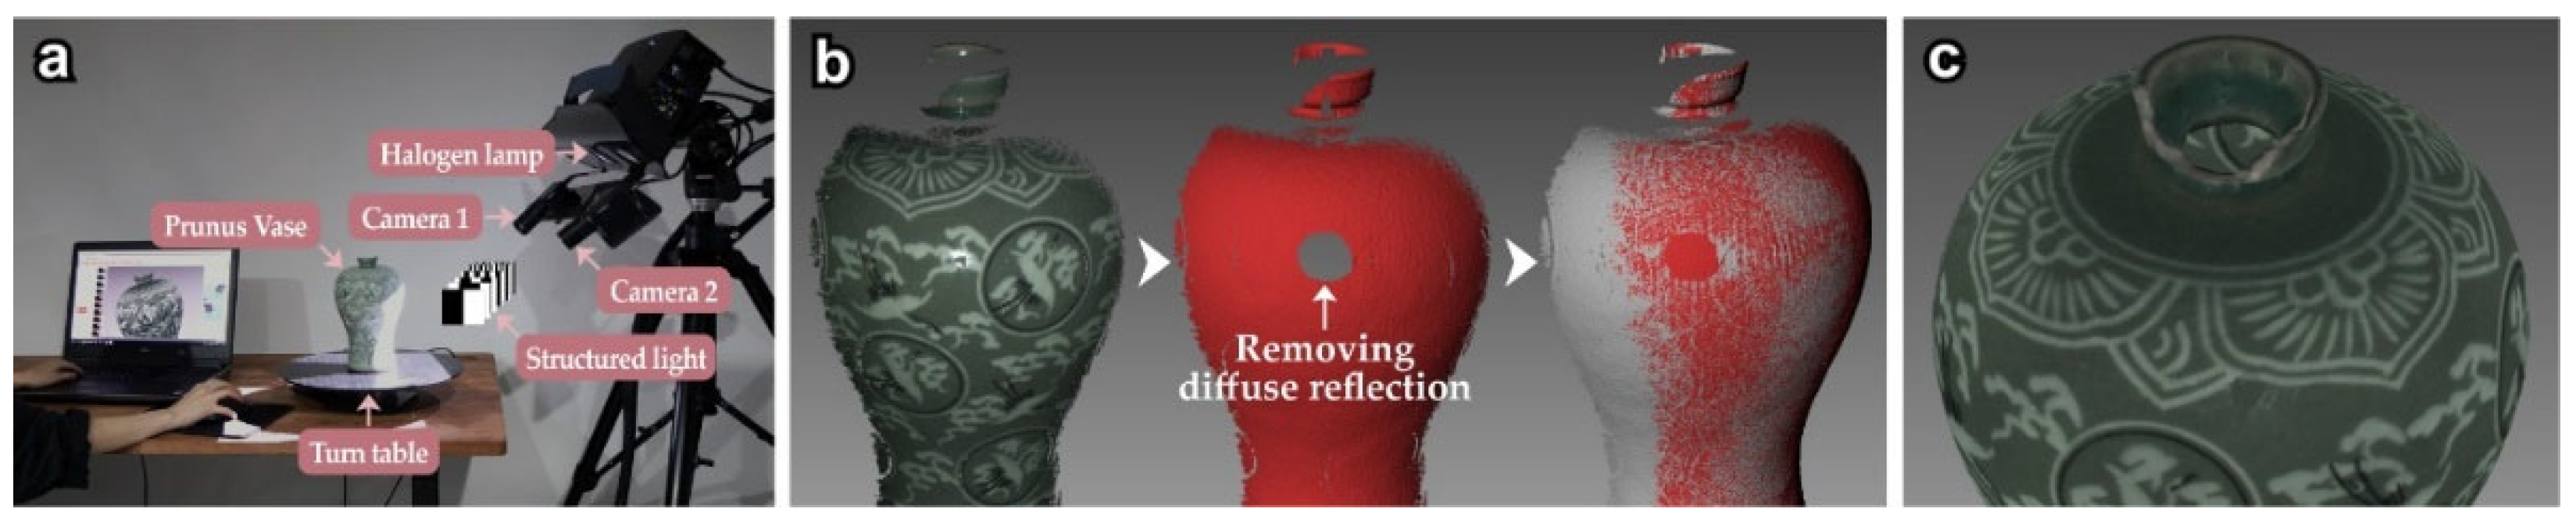
High-resolution optical scanning was performed to precisely determine the external geometry of the vase (
Figure 2a). The scanner device (HDI Advance R3X, LMI Technologies, Burnaby, BC, Canada) used for data acquisition employed the stereo vision method, wherein two high-resolution cameras capture white structured light projected onto an artifact to create a 3D geometric model. This device can scan at various resolutions by adjusting the distance between the camera lenses. In this study, two lenses with a focal length of 16 mm and separated by a distance of 400 mm were used. The point spacing indicates the distance between points in a polygon mesh created through the 3D scan. In this study, the scanning accuracy was 65 μm and the point spacing for a single scan was 0.25 mm.
Notably, raw data acquired via high-precision optical scanning do not have the same coordinates; thus, postprocessing is required to create a single 3D model, which has been reported in many studies [
30]. Generally, this process involves aligning, registering, merging, filtering, and texture mapping; however, in this study, the filtering process was prioritized to remove registration errors and the unique diffuse reflection features of the artifact (
Figure 2b,c). Only misaligned raw shape information was provided by each image acquired via the on-site scan. Therefore, the raw scan data were processed to complete the model. The reliability of a 3D model depends on the registering and merging results based on the iterative closest point (ICP) algorithm, and registration is the most important stage in scan data processing. Therefore, registration was accomplished with an average overlap ratio of ~60% and within an error vector of ~50 μm. Then, RGB textures were mapped to the final polygon mesh model after adjusting the brightness and chromaticity of the colors identified during the scan. The FlexScan software 3.3 (LMI Technologies, British Colubia, Canada) was employed to postprocess the acquired scan data.
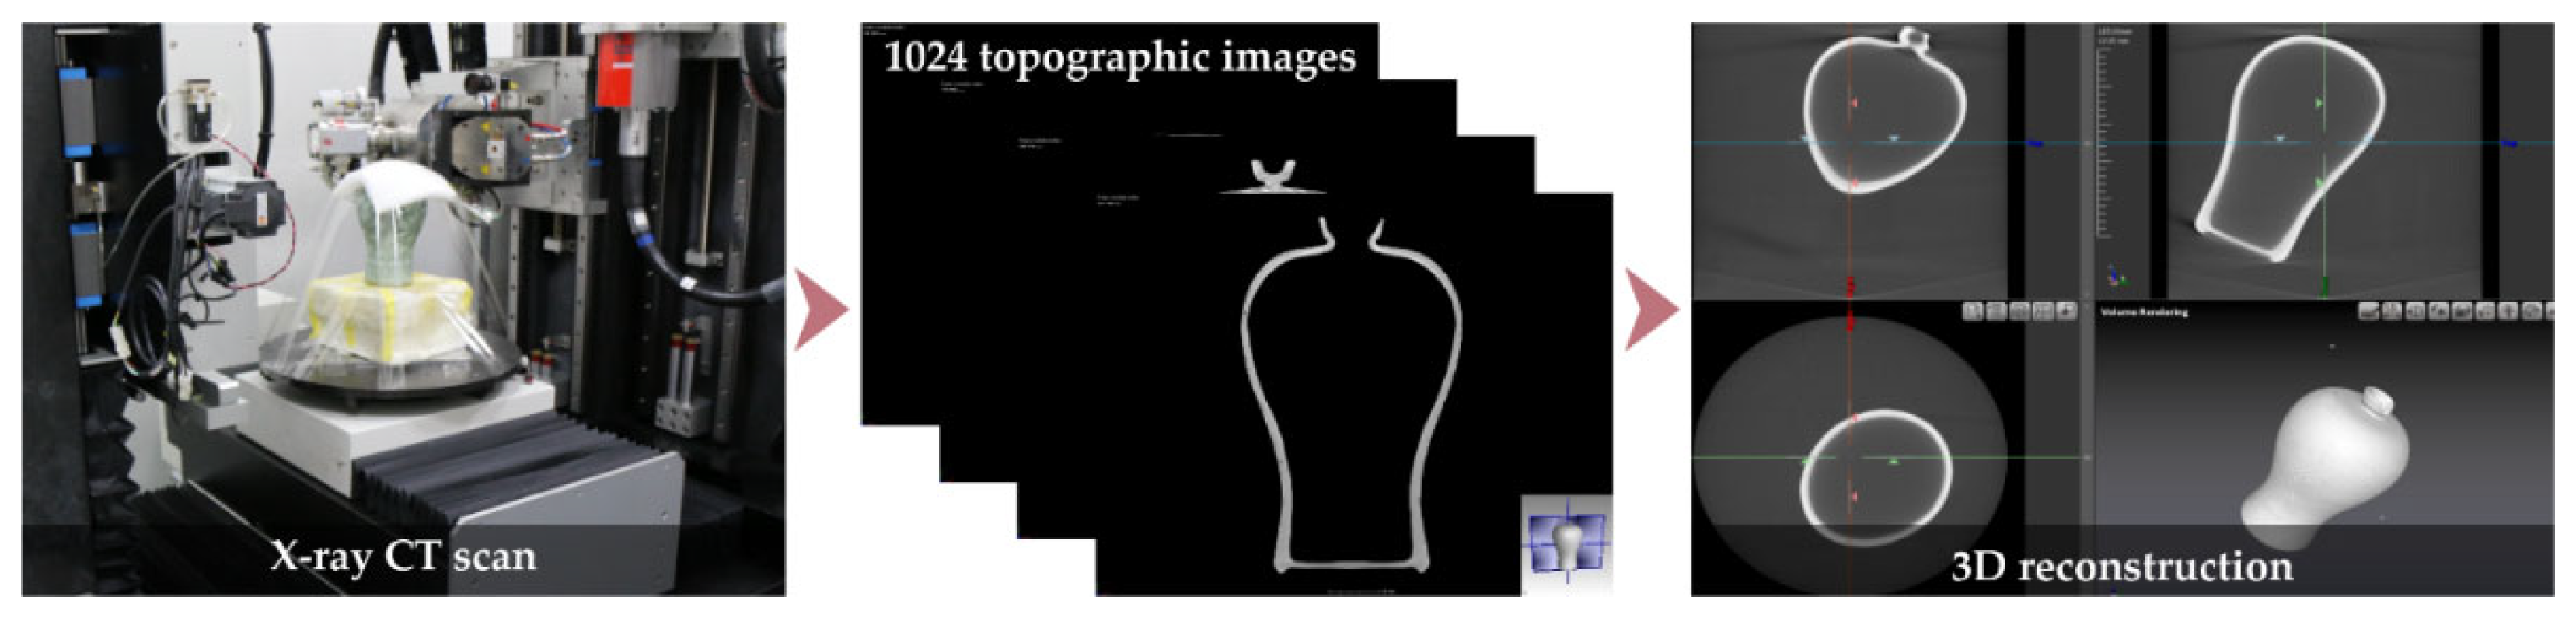
Although the precise external geometry and color of the vase were recorded through optical scanning, the internal geometry data could not be acquired because the light source could not reach inside owing to the vase’s narrow spout. Notably, effective stereoscopic and multifaceted digital documentation of the vase was only possible if the entire internal and external geometries were recorded. Thus, X-ray CT was employed to obtain information about the internal shape of the vase (
Figure 3). Notably, X-ray CT emits high-voltage radiation; hence, it was employed in a special room with lead shielding, and the acquired cross-sectional images were postprocessed in a general laboratory environment.
The X-ray CT imaging equipment was a Bright 240/450 dual CT scanner (Dukin Corporation, Korea) equipped with a high-output dual tube. The imaging conditions were as follows: voltage = 220 kV, current = 150 μA, power = 44 W, and focal spot size = 2.0 μm × 2.0 μm. The dimensions of the image detector were 410 mm × 410 mm, its pixel size was 200 μm, and its spatial resolution was 130 μm. Under these conditions, 1024 tomographic images with a resolution of 2048 × 2048 pixels were acquired. A CT algorithm based on X-ray transmittance (material density) was used to reconstruct the individual tomographic images into a 3D model with a single voxel of size 260 × 260 × 260 μm3. The VGSTUDIO MAX software (Volume Graphics, Heidelberg, Germany) was used to operate the CT scanner, perform 3D reconstruction, and conduct image analysis.
The final 3D model was obtained by combining the internal and external surfaces of the vase determined via optical scanning and X-ray CT, respectively. The optical scanning and X-ray CT models had 5,000,000 and 100,000 high-polygons, respectively; hence, high-specification hardware and long processing times were required for registration and RMS deviation calculations. Therefore, the polygons of both the models were decimated to 20,000 via mesh optimization. The 3D mesh models acquired via optical scanning and X-ray CT had differences in fine dimensions; hence, the X-ray CT model was aligned and registered with the optical scanning model with high dimensional accuracy. To improve the registration accuracy of the two 3D models, nine points on the spout with prominent morphological characteristics were selected, and the ICP algorithm was employed for registration (
Figure 4).
The registration accuracy was evaluated via RMS deviation analysis and visualization [
31,
32,
33]. The RMS value was obtained by taking the square root of the mean value of the squared deviations. The RMS value is commonly used when the difference between the estimated or predicted values and the observed values is considered. The lower the RMS value, the more accurate the prediction. A perfect prediction model has an RMS value of zero. This value is easy to interpret because it expresses the difference between model-predicted and actual values as a single number. It is widely used for image analysis because each numerical value can be visualized [
34,
35,
36].
The Geomagic Control X (3D Systems, Rock Hill, SC, USA) software was employed for the registration and deviation analysis. The hardware PC used (OMEN 45L GT22-0001kr, HP, Palo Alto, CA, USA) had an Intel Core i9-12900K CPU, a Geforece RTX 3080 graphics card, and 32 GB of DD4 memory. The overall registration and deviation analysis took <30 min. Further, merging was performed to convert the two 3D mesh models with secured registration accuracy into a single 3D model. In principle, this process was designed to establish the optical scanning mesh model with high resolution as the base model and supplement the internal shape model obtained using X-ray CT. The Geomagic Design X (3D Systems, Rock Hill, SC, USA) software was utilized for convergence modeling.
3. Results
3.1. Geometry Analysis
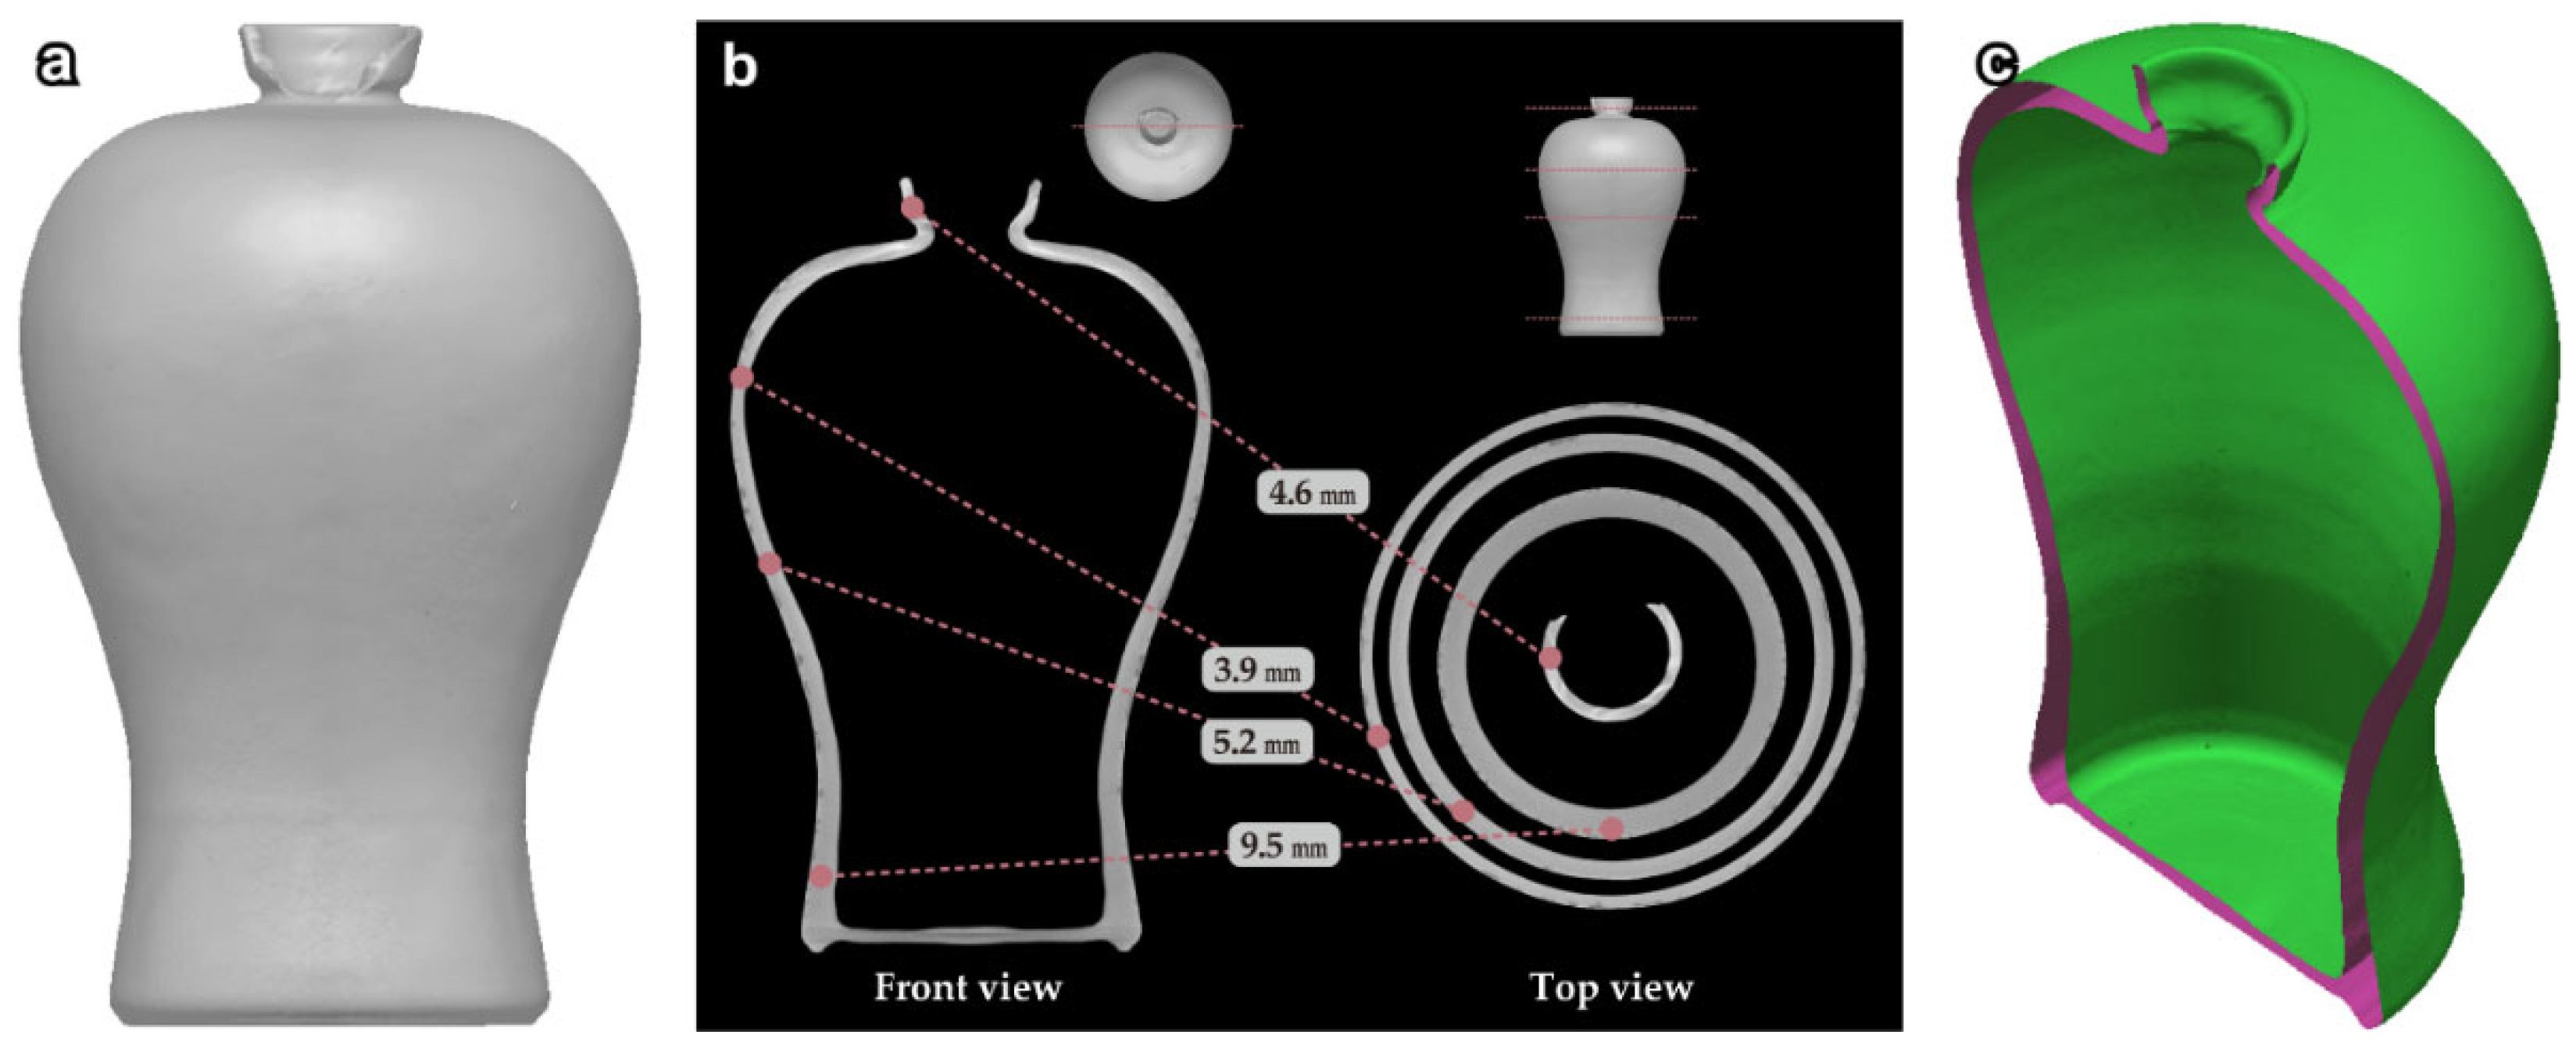
The optical scanning result of the vase was digitized into a high-resolution mesh model with an average point spacing of 0.21 mm and 4,338,126 polygons. The dimensions of the model were 133 mm (width) × 133 mm (length) × 213 mm (height). The surface texture and detailed patterns of the vase were well expressed, and glaze cracking caused by the firing process was clearly visible (
Figure 5a). The RGB texture was mapped after removing the diffuse reflection areas, and the real colors were well represented (
Figure 5b). Despite showing a precise surface shape, the optical scanning model was unable to represent the geometry of areas where light could not reach. As observed in the 3D cross-sectional view (
Figure 5c), the thickness and internal shape of the vase were not recorded.
Hence, X-ray CT scanning was performed to record the internal shape. The X-ray CT model showed the internal thickness and shape information effectively, compensating for the limitation of optical scanning. Based on thickness measurements through sampling analysis, the spout thickness was determined to be 4.6 mm and the upper, middle, and lower body parts were 3.9, 5.2, and 9.5 mm thick, respectively, with a tendency of thickening downward (
Figure 6a,b).
Next, acquired X-ray CT data were converted into a mesh model based on the surface determination (i.e., thresholds) between the material and air layers (
Figure 6c). This data conversion process resulted in the inclusion of 569,791 polygons in the X-ray CT mesh model, with an average point spacing of 0.80 mm. In particular, this model had a closed structure with no unscanned areas throughout, providing sufficient surface area (147,987 mm
2) and volume (395,123 mm
3) information.
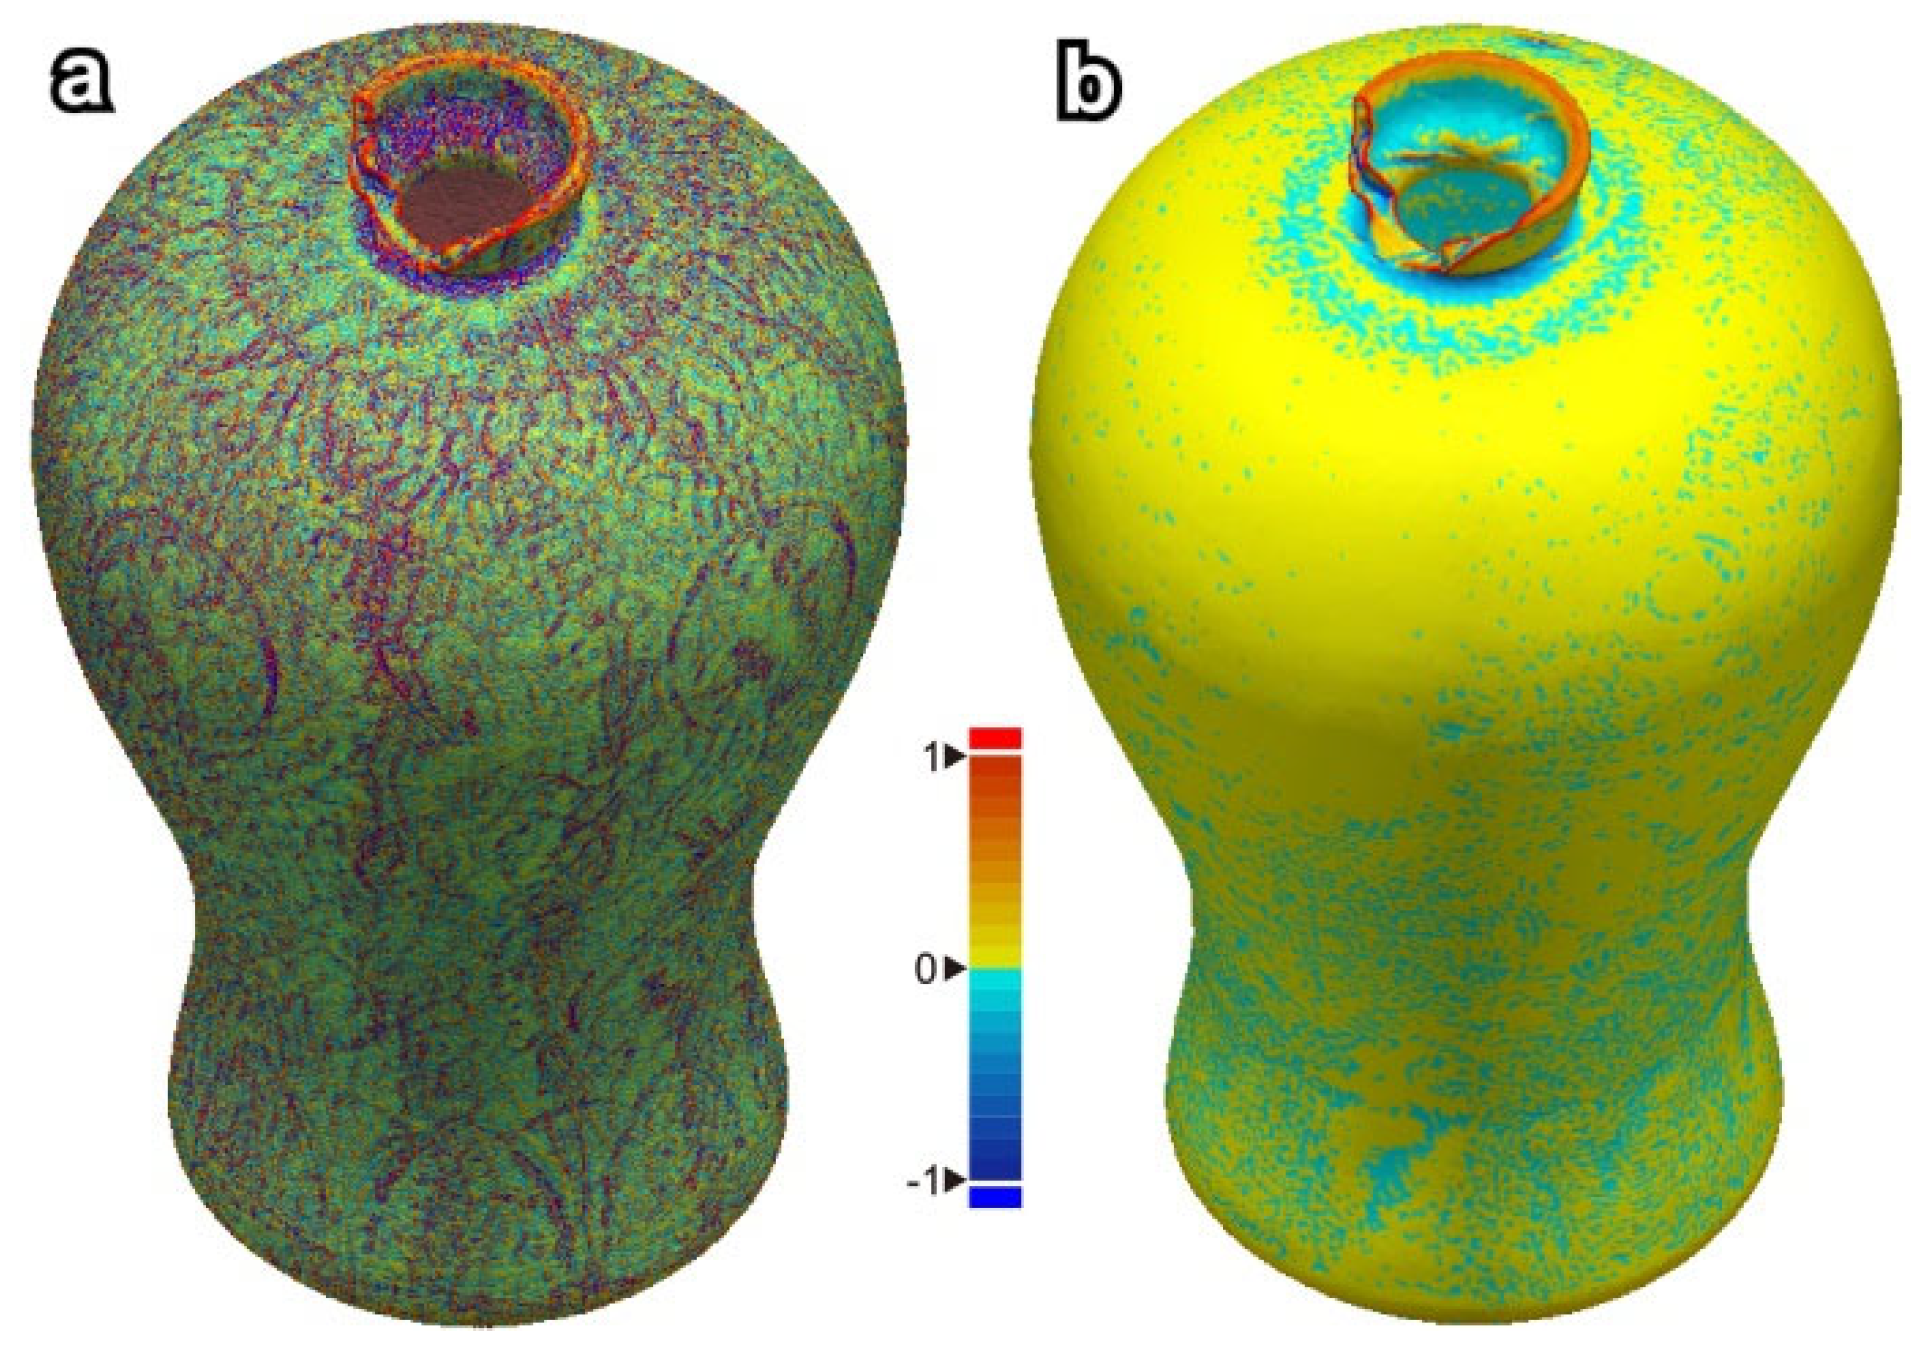
As X-ray CT reconstructs a 3D model using tomographic images, it has the disadvantage of low precision and poor material texture representation of the external surface. As shown in the 3D voxel and polygon mesh models acquired from the X-ray CT data, the glaze cracking and inlaid patterns, which were well visualized in the optical scanning model, were not represented well. In addition, in the curvature mapping results, the optical scanning model exhibited clear changes in the curvature values depending on variations in the surface microtexture (
Figure 7a). The X-ray CT model showed a considerably lower curvature range of ±0.41 and a near-zero curvature for the body, which indicated that the surface features were not well represented (
Figure 7b).
3.2. Registration Accuracy Analysis
Optical scanning and X-ray CT differ in terms of the fine dimensions of 3D models owing to their different light sources and data acquisition methods [
37,
38]. In this study, optical scanning showed a higher dimensional accuracy because it directly acquired geometric information via triangulation [
39,
40]. Hence, to perform 3D convergence modeling, it is necessary to analyze the shape difference and registration accuracy of the two models in advance. In this study, the registration accuracy was examined by aligning the optical scanning and X-ray CT models, followed by the visualization of their RMS deviations.
For this analysis, the X-ray CT model with a low point spacing was fixed as the reference model and the optical scanning model was set as the analysis model. Then, the 10 most prominent common features of the two models were selected, aligned, and registered using the ICP algorithm. From the registered 3D models, we found that the overall size of the optical scanning model was larger than that of the X-ray CT model; the X-CT model exhibited larger dimensions only in the upper part of the body. Upon analyzing the points where the two models showed large geometric differences between them, the average distance was found to be ~0.3 mm and the largest distance was found to be 0.5 mm (
Figure 8).
A deviation analysis was performed for the overall geometric difference between the optical scanning and X-ray CT mesh models to calculate the minimum, maximum, and average deviations as well as the RMS deviation (
Figure 9). The results demonstrated that the two models deviated by ±0.5 mm, and the average deviation was 0.07 mm in the (+) direction. The fact that the average deviation between the two models was along the (+) direction indicates that the optical scanning model (i.e., the analysis model) was geometrically larger than the X-ray CT model. In addition, the 3D model that mapped the RMS deviation effectively represented the geometric differences depending on the location of individual polygons. The average RMS deviation was found to be 0.13 mm.
This deviation cannot be easily attributed to a single factor. X-ray CT can cause errors in the cross-sectional image depending on the direction of the light source and the scattering effect of the material during X-ray transmission. In addition, dimensional differences with respect to optical scanning results are inevitable because the surface is determined through cross-sectional images. Furthermore, the different curvatures and complex geometric information of the optical scanning and X-ray CT models affect the registration process. However, this RMS deviation is smaller than the point spacings of the optical scanning and X-ray CT models; hence, the deviations would not have a notable impact on the merging process. Therefore, mesh-based convergence modeling was subsequently performed.
3.3. Mesh-Based Convergence Modeling
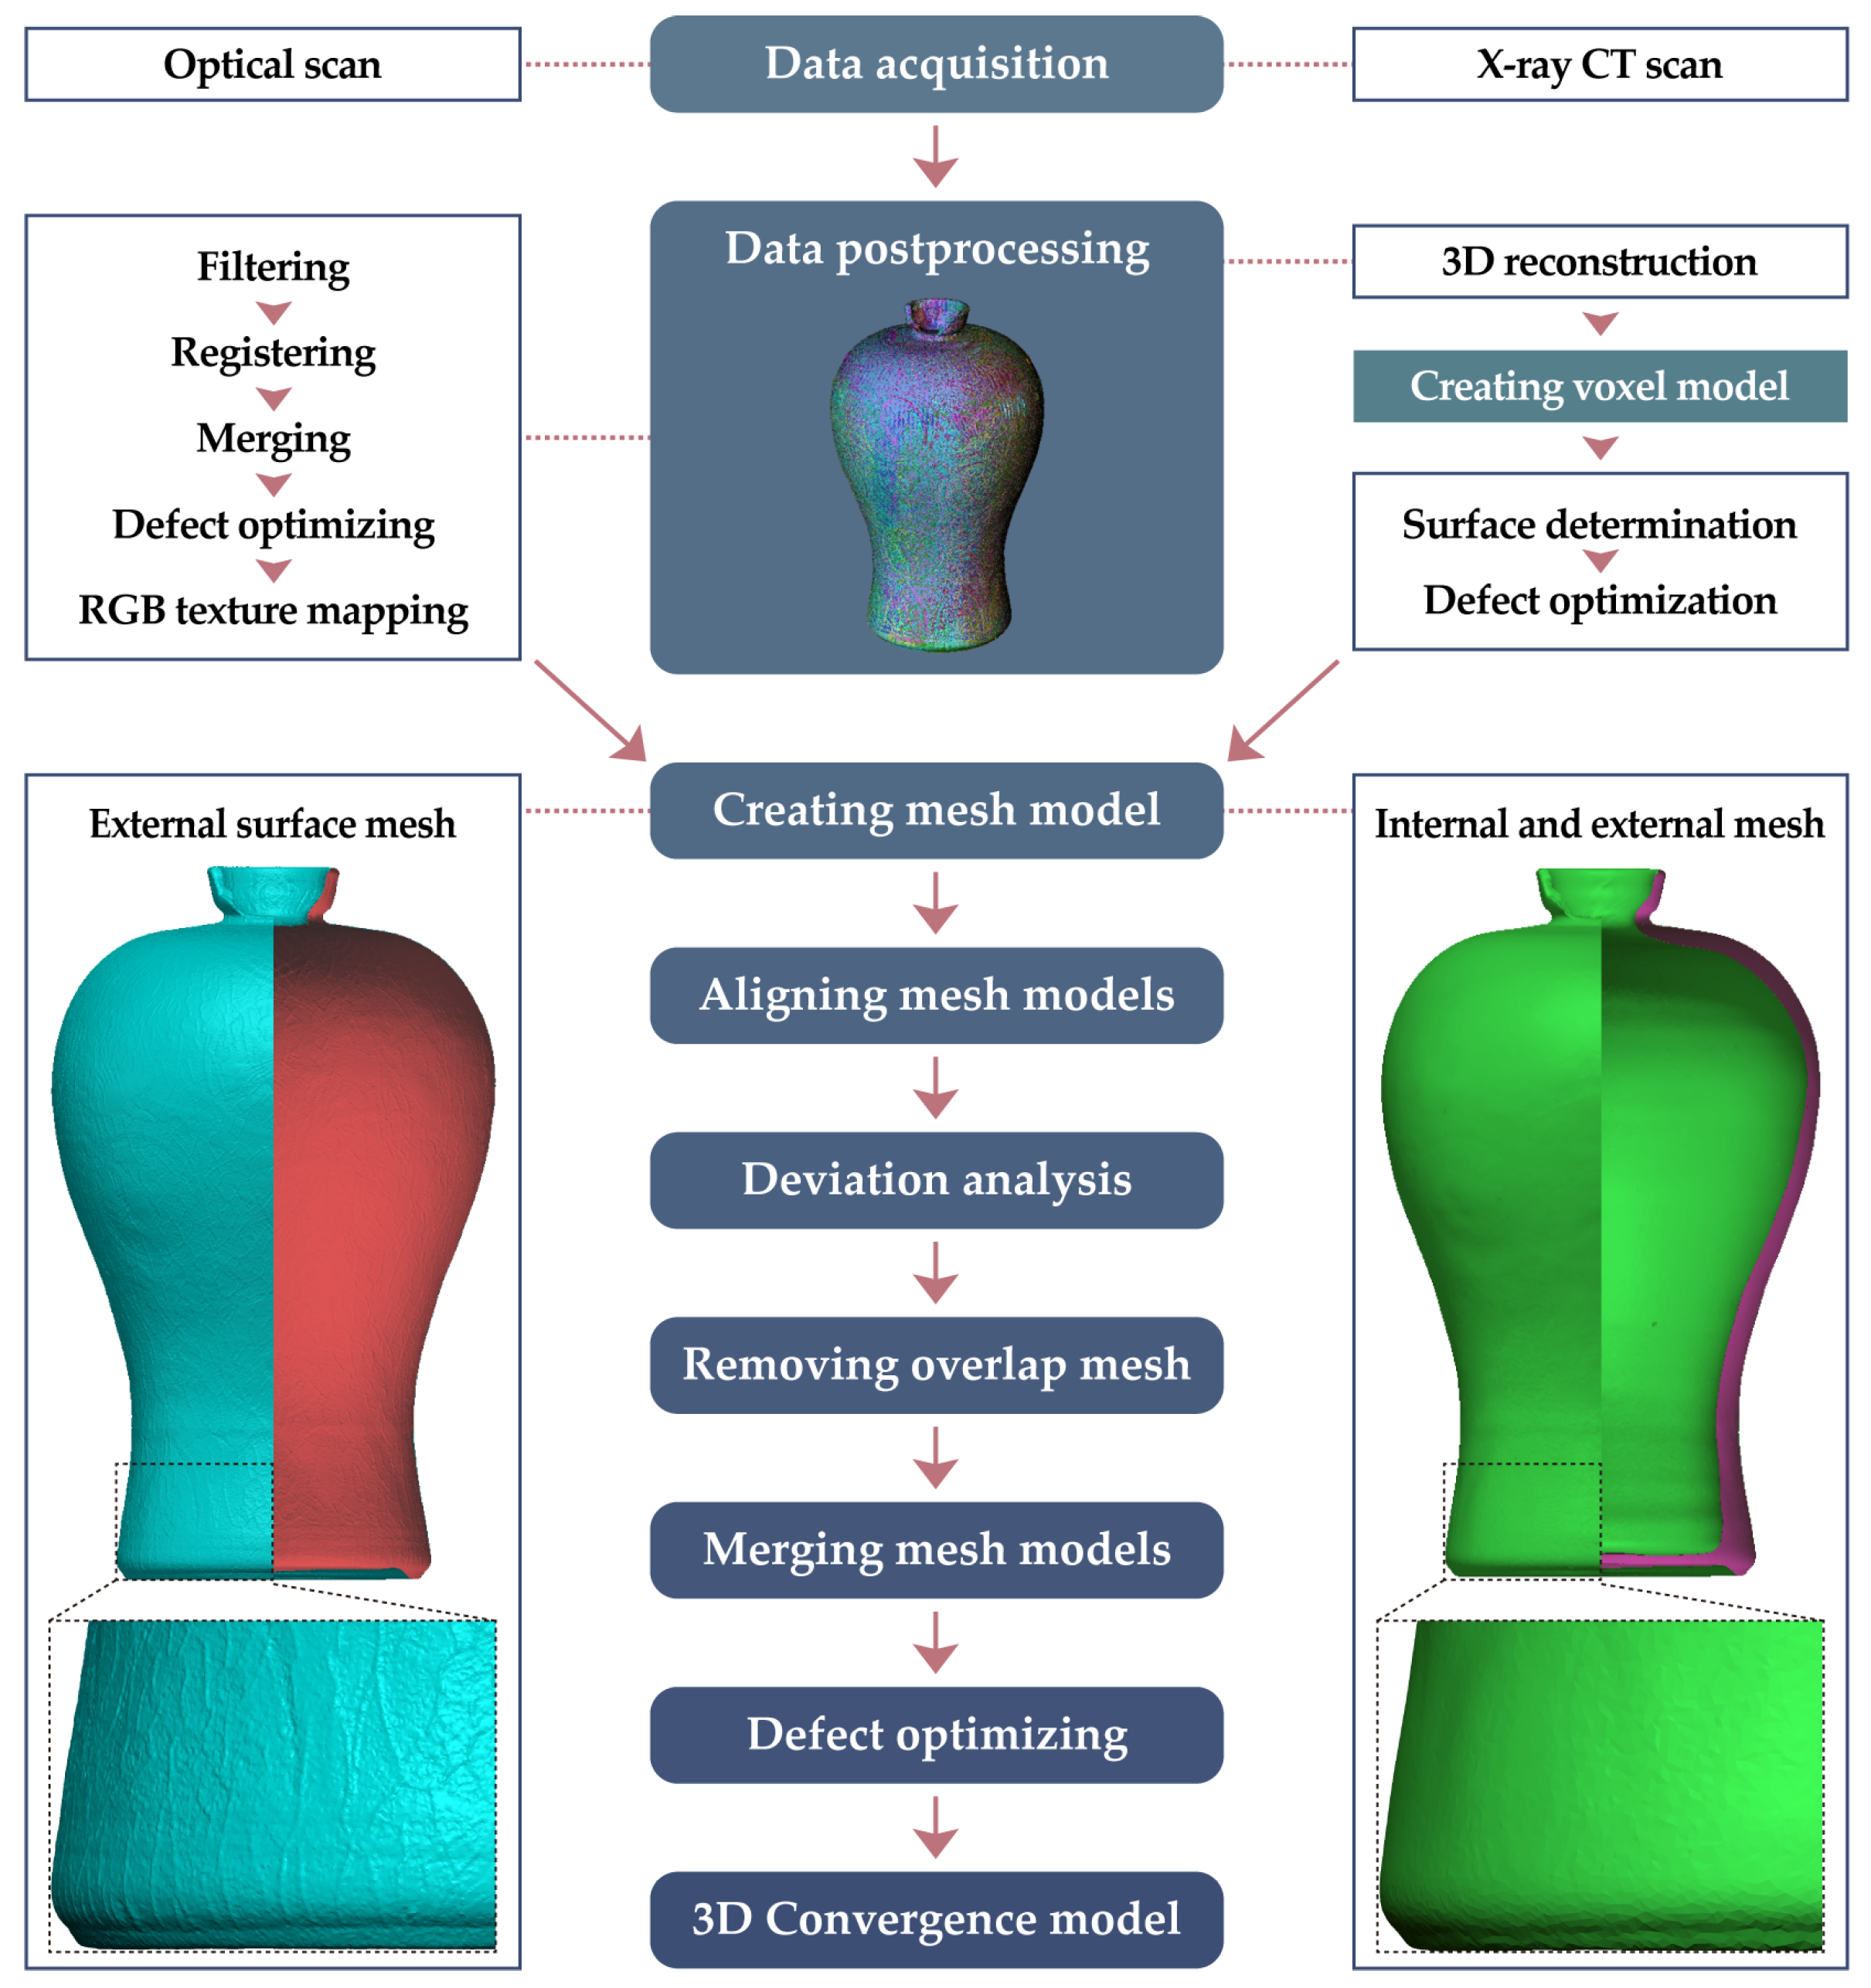
The optical scanning model of the vase demonstrated excellent external surface texture and color information; however, the internal structure could not be digitized. Meanwhile, X-ray CT modeled the entire internal and external geometries but exhibited limitations in terms of representing the unique surface texture and color of the vase. Hence, mesh-based convergence modeling was performed to create a 3D model of the vase that precisely exhibited the external surface and internal structure. The workflow of mesh-based convergence modeling is illustrated in
Figure 10.
During mesh-based convergence modeling, the external geometry of the optical scanning model was utilized as much as possible and the unscanned internal geometry was supplemented using the X-ray CT model to minimize data interference caused by the overlapping of the two models. Consequently, a high-quality converged model was generated by removing data with low precision and dimensional accuracy. The external geometry of the X-ray CT model was removed from the overlapping areas of the aligned mesh models.
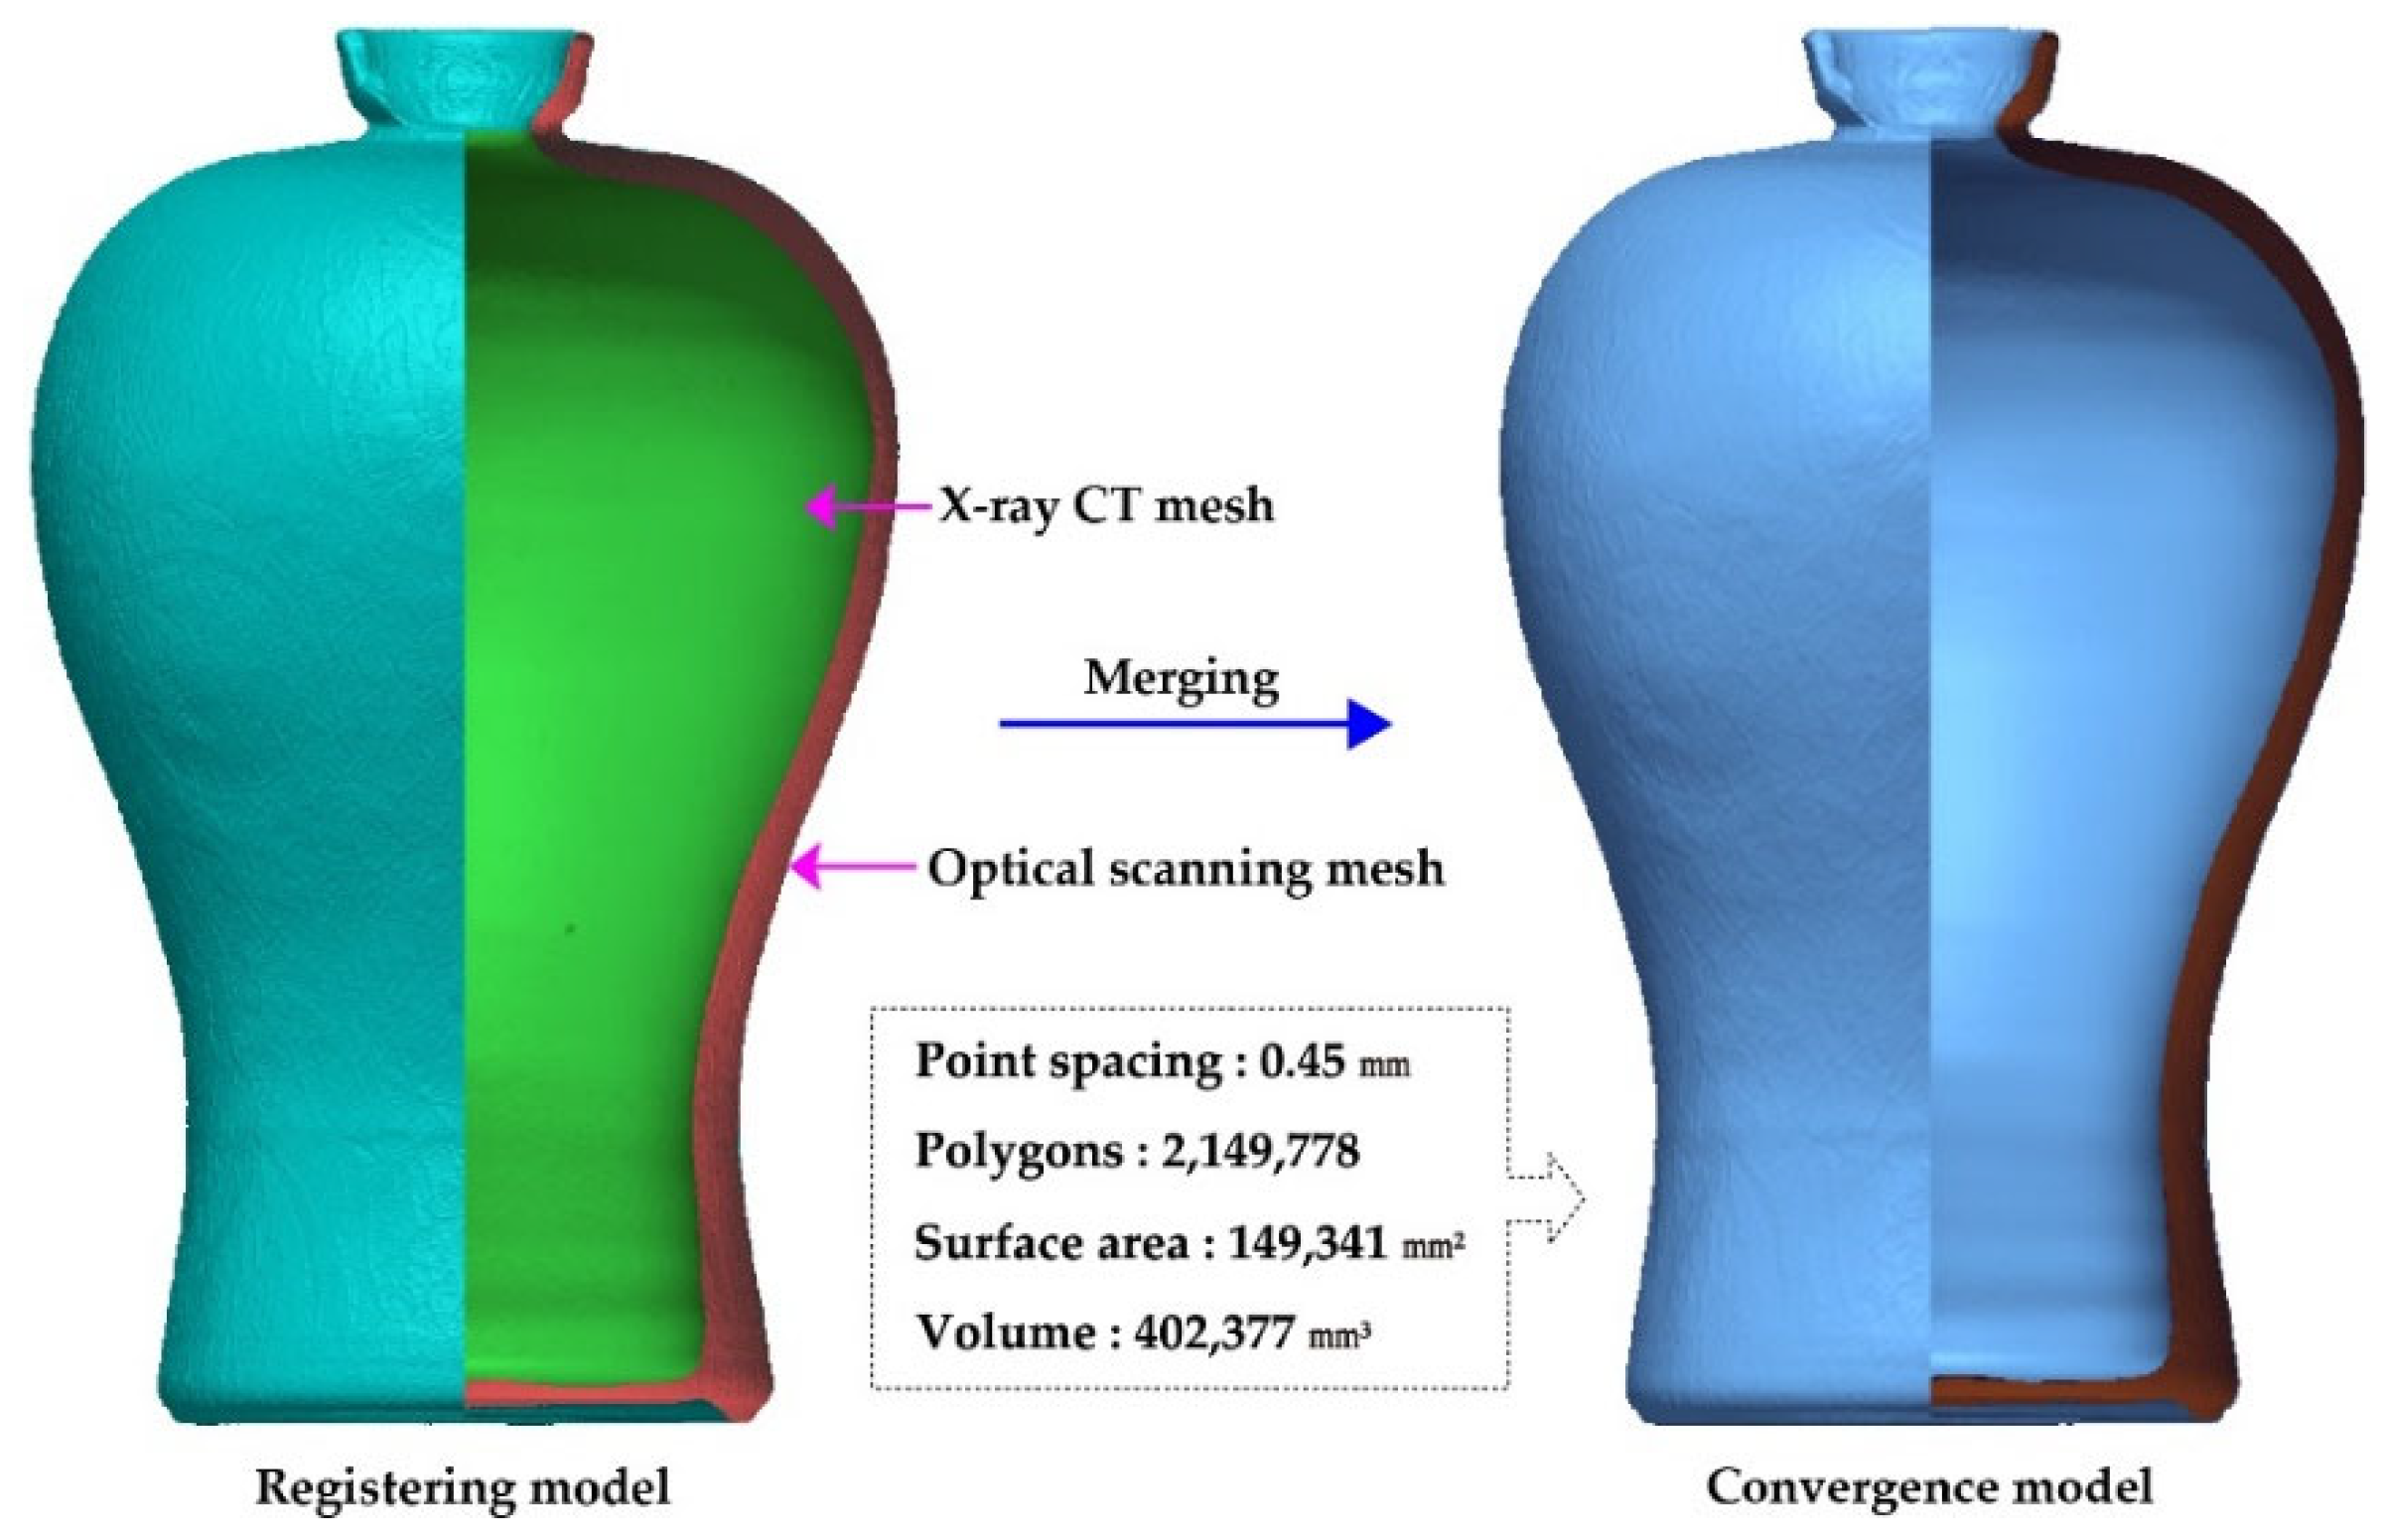
The X-ray CT model of the interior and the optical scanning model of the exterior—with removed overlapping areas—were converted into a single mesh model through merging. Then, through mesh defect optimization, a 3D converged model with an average point spacing of 0.45 mm and 2,149,778 polygons was obtained (
Figure 11). The surface area and volume of the converged model were 149,341 and 402,377 mm
3, respectively, which were 0.9% and 1.8% greater than those of the X-ray CT model, respectively. This is believed to be a result of incorporating the volumetric characteristics of the optical scanning model, which had a large external shape.
4. Discussion
For the 3D digital recording of cultural heritage objects, it is critical to select an appropriate technology considering the purpose, scope, object size, and required representation resolution [
41]. Although there are cases where digital recording achieved using only a single technology is feasible, in most cases, the best results are achieved when various technologies are integrated in a complementary manner [
42]. In particular, 3D convergence modeling is common when data fusion with photogrammetry is actively employed to counter the poor accessibility of 3D scanning technology or enhance the realistic effects of RGB textures [
43,
44]. Both 3D scanning and photogrammetry are optimized to acquire high-quality data based on the external geometry of the target object. Nevertheless, both technologies show drawbacks in digitally recording internal shape information that cannot be observed by the human eye. The use of X-ray CT is essential because information on the internal shape of an artifact is critical for archeological interpretation and conservation research.
In this study, convergence modeling was performed to merge the optical scanning and X-ray CT models into a single 3D model. The optical scanning result of the replica of the prunus vase was a high-resolution mesh model with an average point spacing of 0.21 mm. The surface material texture and real color of the vase were well reflected; however, the thickness and internal geometry were not accurately reflected. To overcome this limitation, X-ray CT scanning was performed. In particular, the internal surface was converted into a mesh model with an average point spacing of 0.80 mm via surface determination processing.
The 3D mesh models obtained via optical scanning and X-ray CT were different in fine dimensions; hence, the X-ray CT model was aligned and registered with the optical scanning model with high dimensional accuracy. Then, the registration accuracy was evaluated through deviation analysis and visualization. The results demonstrated that the two models showed deviations within ±0.5 mm, with an average RMS deviation of 0.13 mm. This RMS deviation was smaller than the point spacings of the optical scanning and X-ray CT models, indicating that the deviations had no significant effects on the merging process. Subsequently, mesh-based convergence modeling was performed.
Convergence modeling utilized the external geometry of the optical scanning model as much as possible and supplemented the unscanned internal geometry using the X-ray CT model. To minimize geometry interference caused by overlapping areas of the models, the external surface of the X-ray CT model was removed, and the model was merged with the optical scanning model to obtain a single mesh model. Through mesh defect optimization, a 3D convergence model with an average point spacing of 0.45 mm was obtained. The convergence model showed the external geometry of the optical scanning model, exhibiting a volume higher (by 1.8%) than that of the X-ray CT model.
Our results showed that the internal structures of cultural artifacts that cannot be determined by optical scanning can be determined using X-ray CT. To improve modeling effectiveness, digital documentation based on a single method can be augmented with multiple technologies. Notably, 3D convergence modeling can be employed in various applications, including the digital shape analysis, simulation, restoration, and replication of exhibition content. Therefore, transitioning to fusion modeling using RGB textures and voxel information is necessary in the future.
Based on the findings of this study, we propose four main future directions to advance 3D convergence modeling: (i) Validate the convergence modeling technology for artifacts with various shapes. This study, being exploratory, focused on a prunus vase replica with relatively simple geometry, which limits the generalizability of the method. Future research should include application cases involving complex-shaped artifacts to demonstrate the broad applicability of the convergence modeling technology. (ii) Develop a method that includes RGB texture information. Colors acquired by optical scanning techniques have low resolution and are difficult to manage; hence, it is necessary to develop a mesh-based texture fusion modeling method that utilizes RGB textures obtained from digital photogrammetry. (iii) Develop a methodology to map RGB textures to an X-ray CT voxel model because the model contains rich information about the artifact shape. These features are highly correlated with the surface color information. If considered in future research, such methods are expected to advance 3D convergence modeling, contributing not only to the multifaceted recording of cultural heritage but also the interpretation and research of cultural heritage production techniques. (iv) Leverage machine learning in convergence modeling. Machine learning can play an important role in combining data acquired through various methods, such as 3D optical scanning, X-ray CT, and photogrammetry, to create a more accurate and comprehensive fusion model. In data collection and integration, feature extraction and modeling, and model optimization and improvement, convergence modeling, and machine learning can show synergy in efficiently processing and utilizing complex 3D datasets.
5. Conclusions
This article proposes a convergence modeling method that models the internal shape information of artifacts, which cannot be modeled by optical scanning, using X-ray CT. The high-resolution optical scanning mesh model (with a point spacing of 0.21 mm) is set as the base model, and the X-ray CT mesh model (with a point spacing of 0.80 mm) is used to provide the unobtainable internal shape information. In particular, the accuracy and reliability of the converged model are validated by quantitatively analyzing and visualizing the registration error (average RMS deviation = 0.13 mm) between the optical scanning and X-ray CT mesh models.
The proposed method records the internal and external geometries of an artifact as a single 3D model; it also enables various stereoscopic analyses. Hence, it increases the objectivity of the interpretation of cultural heritage production techniques. In addition, the proposed method is noteworthy because it leverages multiple complementary technologies and expands the digital documentation process that was earlier focused on utilizing only a single technique (e.g., optical scanning). The convergence modeling results acquired using the proposed method can identify the overall structure of the target artifact; hence, we anticipate that the method can be utilized for various applications in cultural heritage conservation.


