Article

Experimental Stabilization of Clay Soils in Cartagena de Indias Colombia: Influence of Porosity/Binder Index

by
Jair de Jesús Arrieta Baldovino
1,*,
Ramon Torres Ortega
1 and
Yamid E. Nuñez de la Rosa
2,*
1
Civil Engineering Program, Universidad de Cartagena, Cartagena de Indias 130015, Colombia
2
Faculty of Engineering and Basic Sciences, Fundación Universitaria Los Libertadores, Bogota 110231, Colombia
*
Authors to whom correspondence should be addressed.
Appl. Sci. 2025, 15(11), 5895; https://doi.org/10.3390/app15115895
Submission received: 28 April 2025 / Revised: 19 May 2025 / Accepted: 22 May 2025 / Published: 23 May 2025

Abstract

:
In response to the need for sustainable soil stabilization alternatives, this study explores the use of waste materials and biopolymers to improve the mechanical behavior of clay from Cartagena, Colombia. Crushed limestone waste (CLW), ground glass powder (GG), recycled gypsum (GY), xanthan gum (XG), and the combination of XG with polypropylene fibers (XG–PPF) were used as stabilizing agents. Samples were compacted at different dry densities and cured for 28 days. Unconfined compressive strength (UCS) and ultrasonic pulse velocity (UPV) tests were conducted to assess the strength and stiffness of the treated mixtures. Results were normalized using the porosity/binder index ( η / B i v ), leading to predictive equations with high determination coefficients (R2 = 0.94 for UCS and R2 = 0.96 for stiffness). However, XG-treated mixtures exhibited distinct behavior that prevented their inclusion in a unified predictive model, as the fitted exponent x in the porosity/binder index ( η / B i v x ) differed markedly from the others. While an exponent of 0.28 was suitable for blends with mineral binders, the optimal x values for XG and XG–PPF mixtures were significantly lower at 0.02 and 0.03, respectively, reflecting their unique gel-like and fiber-reinforced characteristics. The analysis of variance (ANOVA) identified cement content and compaction density as the most influential factors, while some interactions involving the residues were not statistically significant, despite aligning with experimental trends. The findings support the technical viability of using sustainable additives to enhance soil properties with reduced environmental impact.

1. Introduction

Soil stabilization is a key practice in geotechnical engineering to enhance the mechanical performance of problematic soils like clays with low bearing capacity, high plasticity, and sensitivity to moisture changes [1]. Portland cement (PC) and lime are commonly used binders due to their effectiveness; however, their production entails high energy use and substantial greenhouse gas emissions. Producing one ton of cement emits about one ton of CO2, contributing to nearly 8% of global CO2 emissions [2]. Moreover, impacts such as groundwater pH alteration have prompted the pursuit of more sustainable alternatives [3].
In this context, various alternative materials have gained prominence, coming from industrial by-products or solid waste, such as fly ash, slag, residual limes, marble dust, and recycled construction materials, including glass powder, gypsum residues, and limestone waste [4]. These materials not only reduce the use of cement and associated costs but also promote the circular economy by reusing waste that would otherwise end up in landfills [5,6].
Among these by-products, limestone powder waste (CLW) and other stone industry-related residues—such as marble dust—generated by the crushing, polishing, or cutting of natural stone blocks, have shown promising results in soil improvement. Various laboratory studies have demonstrated that their incorporation significantly enhances unconfined compressive strength (UCS) and reduces soil deformability, with increases of up to 88% in strength and reductions of 32% in deformation [7,8,9]. When combined with lime, strength can increase by up to 59% [10]. Moreover, their use has proven effective in reducing plasticity, improving dry density, and optimizing the volumetric behavior of clayey or silty soils [11]. Roman et al. [12] demonstrated that the porosity/volumetric cement content ratio (η/Civ) can predict both UCS and small-strain stiffness (Go) in CLW-stabilized mixtures, providing a rational tool for the design of stabilized soils.
On the other hand, recycled glass powder (GG) has been proposed as a sustainable solution due to its pozzolanic reactivity, which facilitates the formation of cementitious gels in alkaline environments. The use in expansive soil reduced plasticity by up to 80% and significantly improved compaction and strength. An increase of up to 240% in pre-consolidation pressure and a six-fold improvement in CBR was observed with 16% SLGP. The formation of C-S-H and C-A-H compounds strengthened the soil structure. The optimal dosage was 16%, achieving enhanced geotechnical properties and environmental sustainability [13,14]. Studies have shown that mixtures including between 5% and 30% of GG can significantly reduce porosity and increase UCS and indirect tensile strength, with improvements of up to 56.8% and porosity reductions of over 50% [15,16]. Furthermore, the porosity/binder ratio (η/Biv) has been used to model mechanical behavior and mass loss during wet–dry cycles, providing an effective method to estimate the durability and strength of GG-stabilized mixtures [17]. Fine GG particles have also been shown to double the UCS of expansive clays and reduce the required thickness of subgrade layers in road structures by up to 63% [18].
Recycled gypsum (GY), derived from plasterboards, phosphogypsum, or flue gas desulfurization gypsum, has also been used as a stabilizing additive. Its calcium sulfate content facilitates cementation reactions in the presence of activators such as lime [19]. Although its use entails technical challenges—such as moderate solubility or the formation of expansive products under certain conditions—several studies have demonstrated its effectiveness in improving clayey soils by increasing UCS, reducing swelling, and enhancing volumetric behavior. For example, mixtures containing 30% GY and 4% lime have reached UCS values above 1.5 MPa, meeting the requirements for use as pavement subbase [19].
Recent studies have confirmed that GY plays a key role in enhancing the strength of cement-stabilized clays through the formation of pore-filling ettringite, which contributes to a denser and more homogeneous soil matrix [20]. Additionally, its application in geotechnical engineering has proven beneficial not only for mechanical improvement but also for reducing environmental impact, despite its low global recycling rate [21]. However, its performance under environmental stressors such as freeze–thaw and wet–dry cycles is highly dependent on the presence of cement, as GY alone does not provide sufficient durability in aggressive conditions [22].
Among bio-based stabilizers, Xanthan gum (XG) has attracted considerable interest due to its biodegradable nature, energy efficiency, and low carbon footprint. This extracellular biopolymer, secreted by Xanthomonas campestris, improves soil cohesion by forming viscous bonds between particles, generating dense and resistant matrices [23,24]. It has been demonstrated that even at low concentrations (0.25% to 1.5%), XG significantly improves UCS, stiffness (UPV), and tensile strength, especially under longer curing times. SEM analyses have confirmed increased matrix densification, and the porosity/binder ratio (η/Biv) has been shown to be an effective indicator of mechanical behavior, with a reported characteristic x value of 0.04 for XG-treated soils [25,26].
According to Baldovino et al. [25], the combination of XG with polypropylene fibers (XG–PPFs) represents a synergistic solution for soil improvement. While XG acts as a cohesive agent filling voids, the fibers provide mechanical reinforcement, distributing randomly and preventing weak planes. Recent studies show that the combined use of 1–5% XG with 0.5% PPF increases strength by more than 50% and improves stiffness by up to 63%, depending on compaction level and curing time. These improvements have been verified through UCS, UPV, and microstructural analyses [25].
The present study aims to compare the mechanical properties of strength and stiffness of clayey soil from Cartagena de Indias (Colombia), stabilized using two different approaches: (i) the incorporation of construction waste materials—crushed limestone waste (CLW), ground glass powder (GG), and recycled gypsum (GY)—combined with Portland cement (PC), and (ii) the application of xanthan gum (XG), both individually and in combination with polypropylene fibers (XG–PPFs). Geotechnical and physicochemical characterization tests were performed on the materials, and cylindrical specimens were prepared using different mixtures. These specimens were cured for 28 days under controlled laboratory conditions and subsequently subjected to unconfined compressive strength (UCS) and ultrasonic pulse velocity (UPV) tests to evaluate their mechanical performance. Additionally, the porosity/binder index (η/Biv) was calibrated for each mixture, with the aim of developing a comparative and predictive tool for assessing the geotechnical behavior of soils treated with different stabilizing agents.

2. Materials and Methods

The experimental program of this study is structured into four distinct phases. The first phase outlines the origin and geotechnical characteristics of the materials used, including both the natural clay and the stabilizing agents. This phase includes the classification of the soil, determination of its index properties, and basic characterization of the additives. The second phase focuses on the preparation and factorial design. Cylindrical clay specimens were compacted with different stabilizing agents—crushed limestone waste (CLW), ground glass powder (GG), recycled gypsum (GY), Xanthan gum (XG), and Xanthan gum with polypropylene fibers (XG–PPFs)—and then cured in a moist chamber under controlled conditions for 28 days. The third phase involved the execution of mechanical tests, specifically ultrasonic pulse velocity (UPV) and unconfined compressive strength (UCS), to evaluate the stiffness and strength behavior of the stabilized mixtures.
Finally, the fourth phase complements the experimental program with an ANOVA-based statistical analysis to identify the factors significantly affecting the strength and stiffness of the stabilized blends, supporting the interpretation of additive type, cement content, and compaction density effects.

2.1. Materials

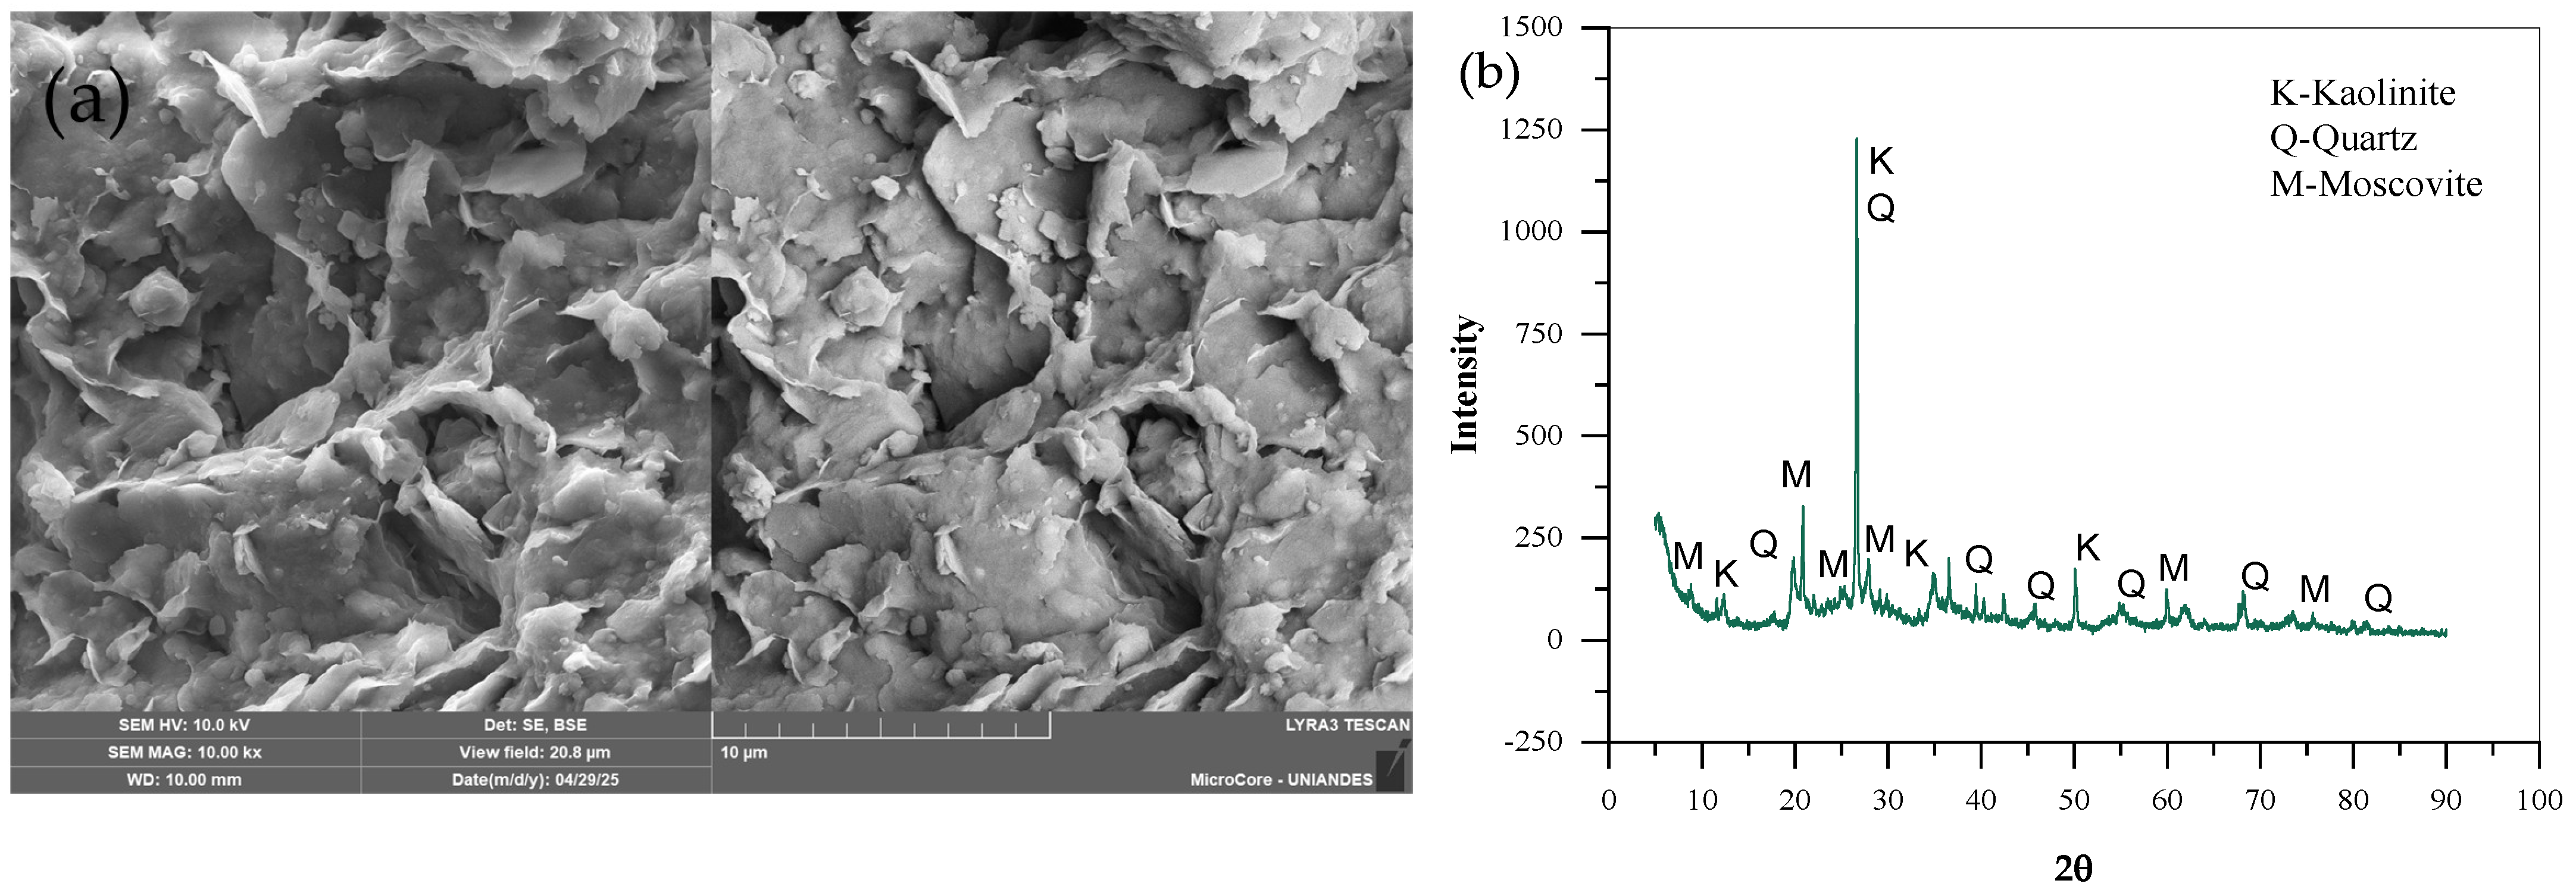
2.1.1. Soil Sample: Clay

The soil used in this study was collected from the northern area of Cartagena de Indias, Colombia, at coordinates 10.537000, −75.462016. It corresponds to coastal deposits with moderate susceptibility to erosion, mass movements, and landslides, and exhibits moderately dispersive behavior [27].
Following field collection, the soil underwent a comprehensive characterization process that included laser particle size analysis, specific gravity determination, Atterberg limits testing, chemical composition analysis, and microstructural evaluation. The results of these tests are summarized in Table 1 and Table 2.
Additionally, Figure 1 presents the grain size distribution curve of the soil obtained through laser diffraction analysis using the Honeywell Microtrac X100 laser diffraction (Microtrac, York, PA, USA) system equipped with the Microtrac SRA200 accessory. A sodium hexametaphosphate solution was used as the dispersing agent. as well as a representative photograph of the material in its dry state. According to the Unified Soil Classification System (USCS) [28], the soil was classified as a low-compressibility clay (CL). The clay’s colloidal activity, determined according to Skempton’s criteria [29], was calculated as 1.60. The soil was composed mainly of kaolinite clay minerals (Figure 2) [27].
Table 1. Results of the geotechnical characteristics of the studied soil [6,25].
Property of SoilStandard/ReferenceUnitValue
Activity of Clay, A [A = PI/(% < 0.002 mm)]Skempton [29]-1.60
The specific gravity ( G s ) ASTM D854 [30]-2.8
Plasticity limit (P.L.)ASTM 4318 [31]%26.05
Plastic index (P.I.)ASTM 4318 [31]%15.95
Fine Sand (0.075–0.425 mm)ASTM D2487 [28]%12
Silt (0.002–0.075 mm)ASTM D2487 [28]%78
Clay (<0.002 mm)ASTM D2487 [28]%10
Mean Diameter (d50)ASTM D2487 [28]mm0.011
Effective Diameter (d10)ASTM D2487 [28]mm0.0021
Uniformity Coefficient (Cu)ASTM D2487 [28]-7.14
Coefficient of Curvature (Cc)ASTM D2487 [28]-0.96
USCS ClassificationASTM D2487 [28]-CL
Optimum Moisture ContentASTM D1557 [32]%18.20
Maximum Dry Unit Weight ( γ s m a x ) ASTM D1557 [32]g/cm31.76
Table 2. Chemical composition of soil sample (% by weight) [25].
MaterialsSiO2Al2O3SO3K2OCaOFe2O3TiO2LOI
Soil (CL)6621.143.130.90.31.6
Figure 2a displays the soil morphology, characterized through scanning electron microscopy (SEM) using the LYRA-3 dual-beam SEM-FIB system, manufactured by TESCAN (Tescan Orsay Holding, Brno-Kohoutovice, Czech Republic). Additionally, X-ray diffraction (XRD) analysis (Figure 2b) was carried out with a Shimadzu XRD-7000 diffractometer, equipped with a 60 kV source and 3 kW power capacity.

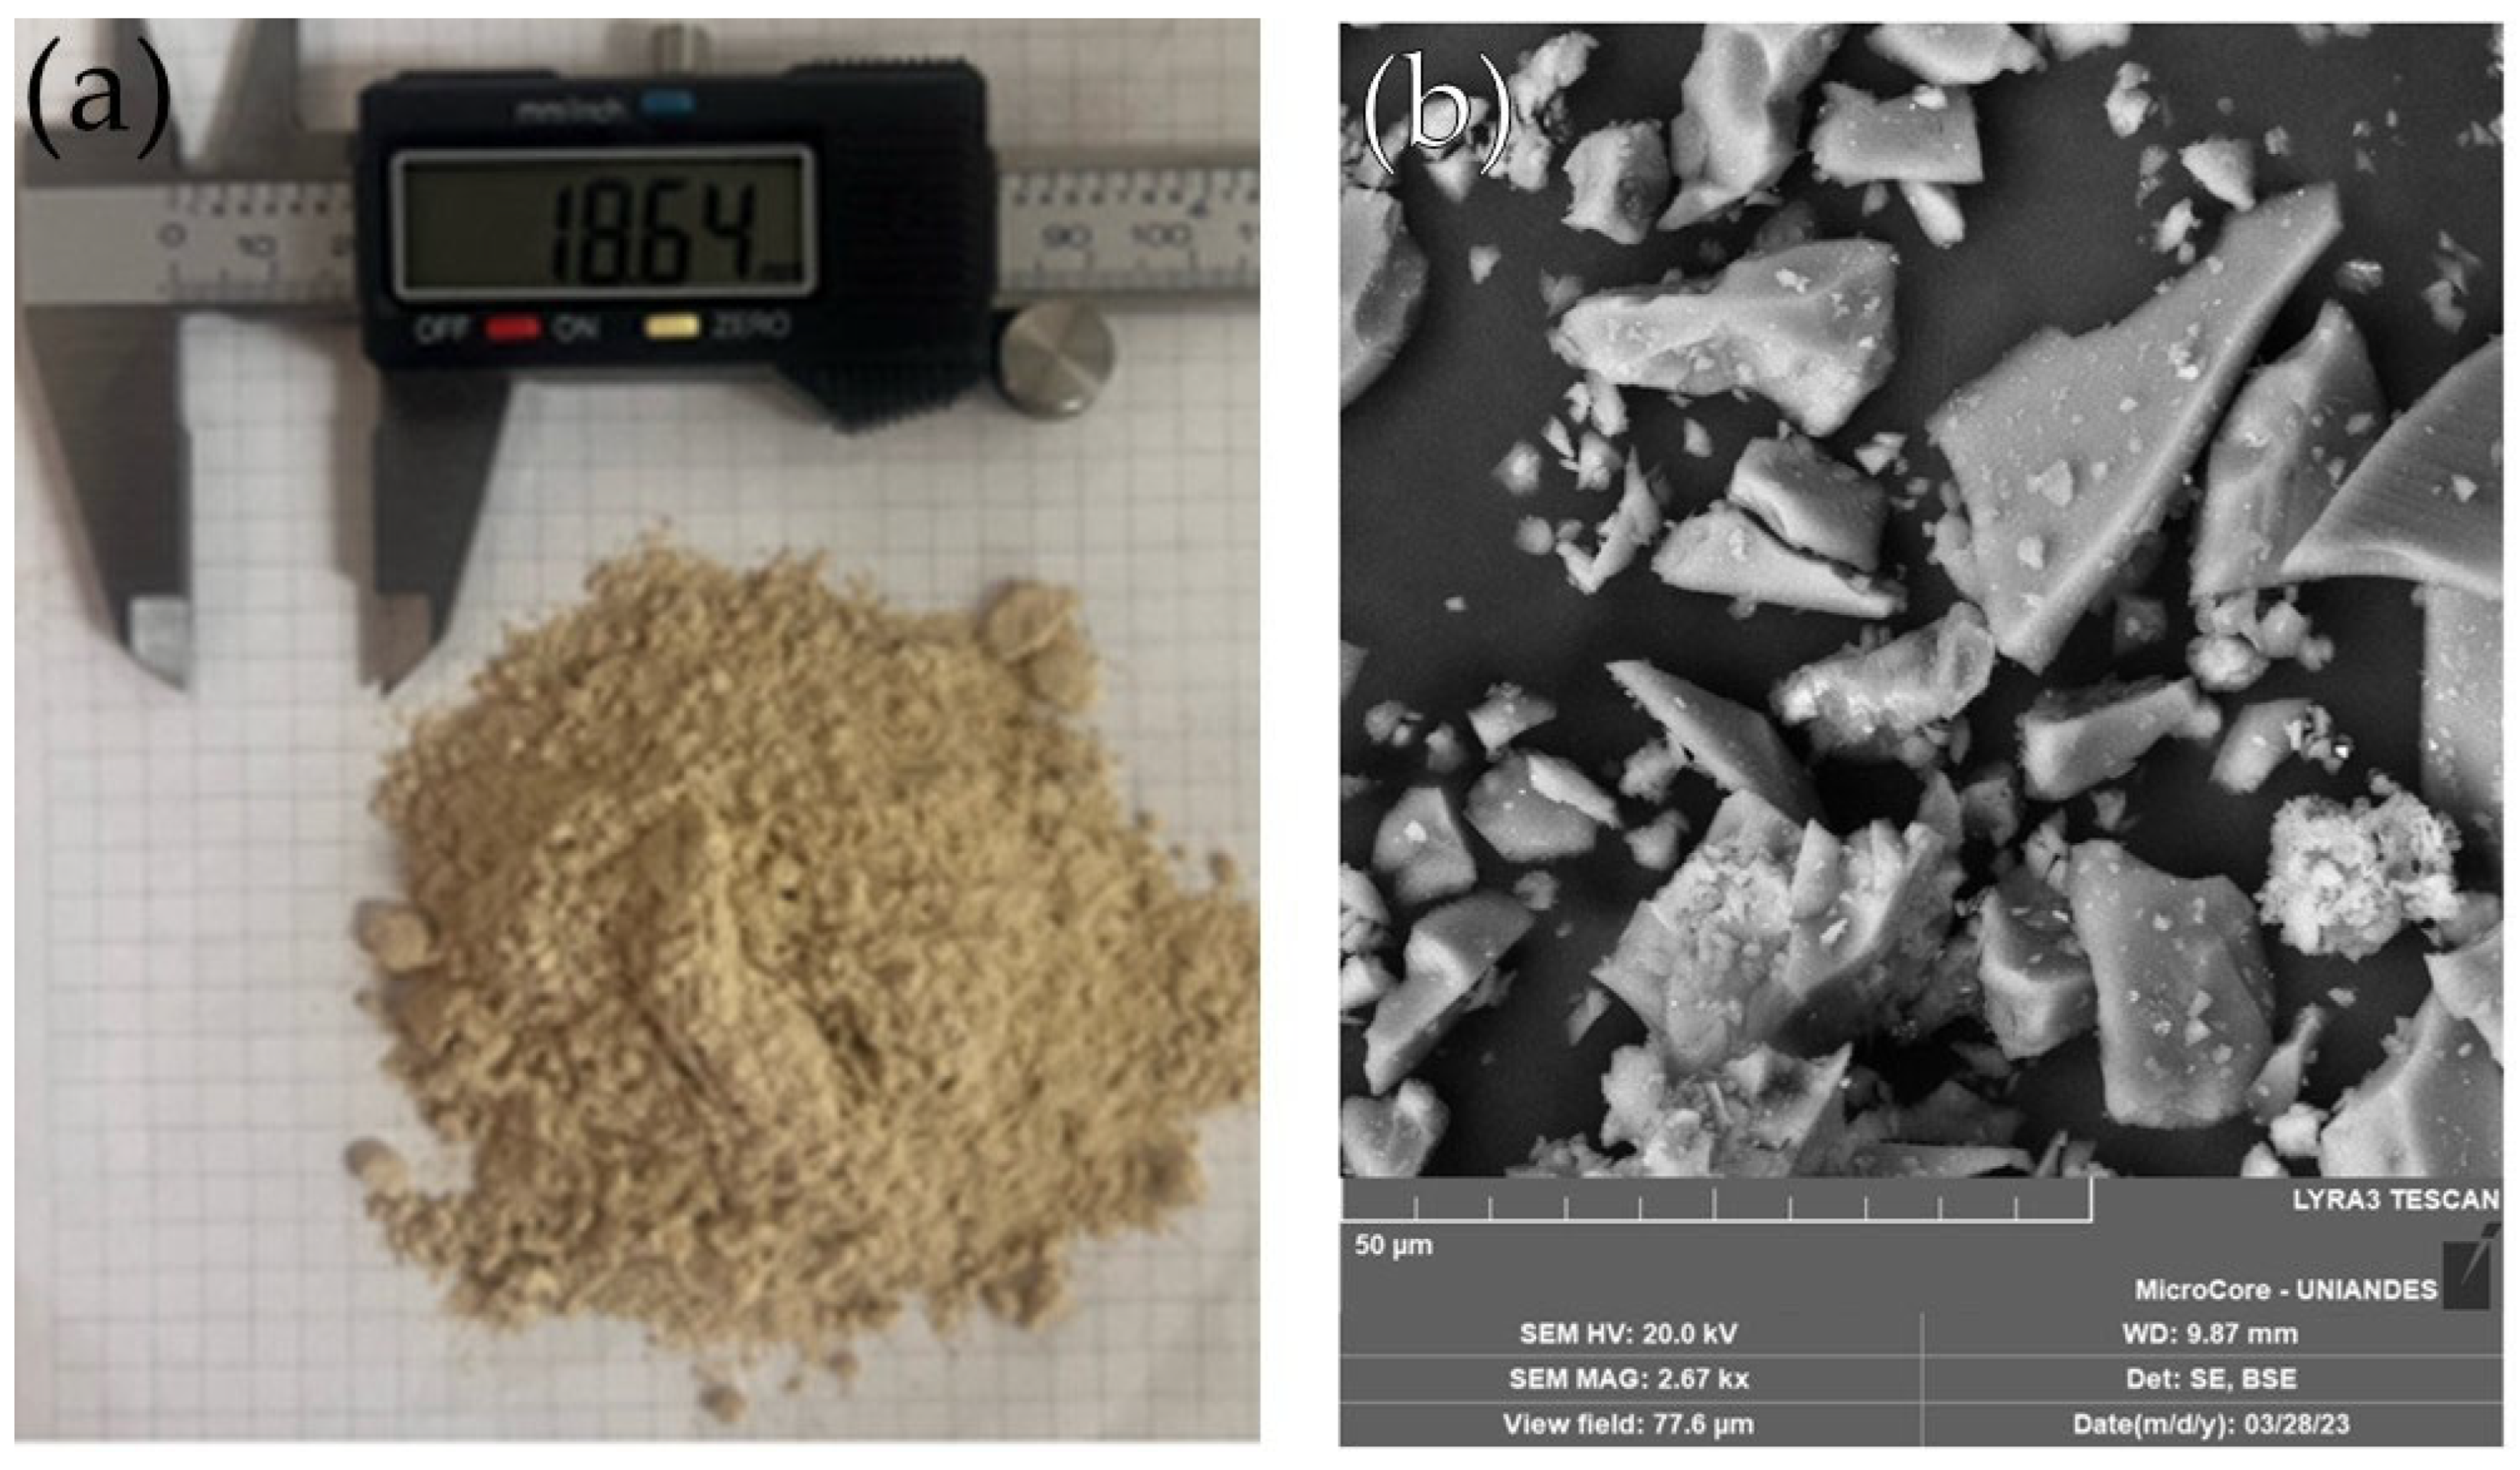
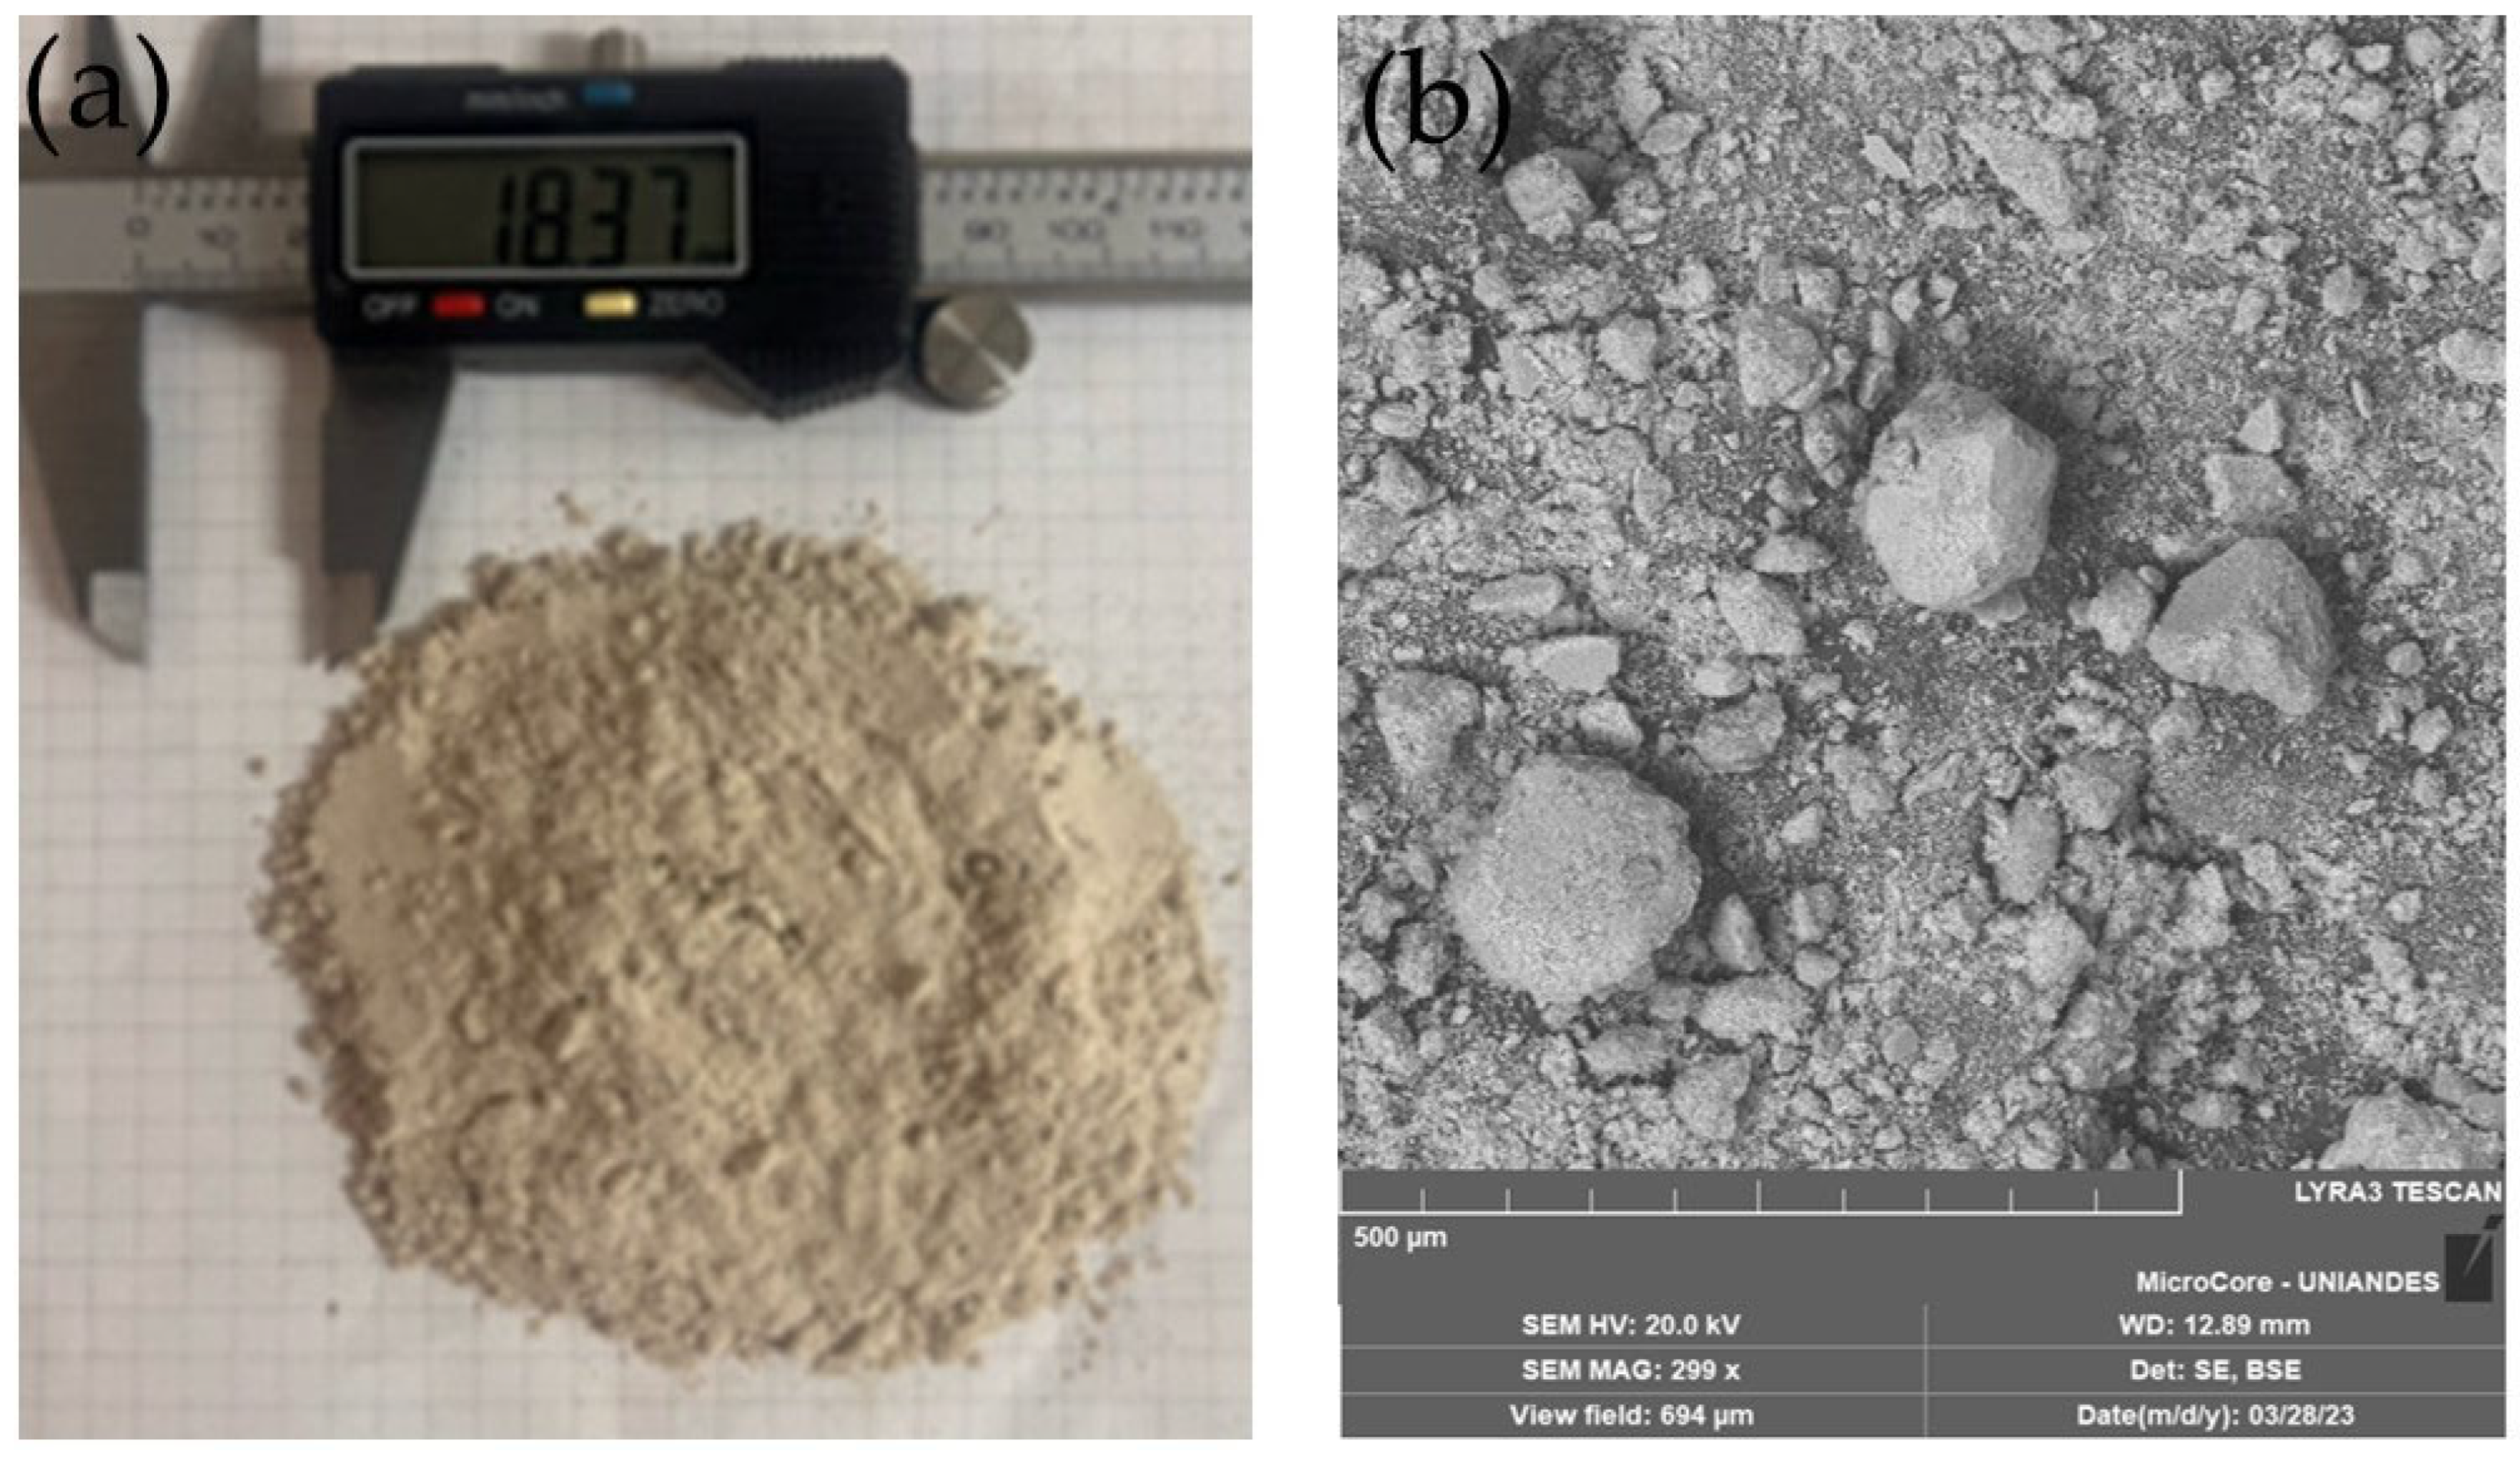
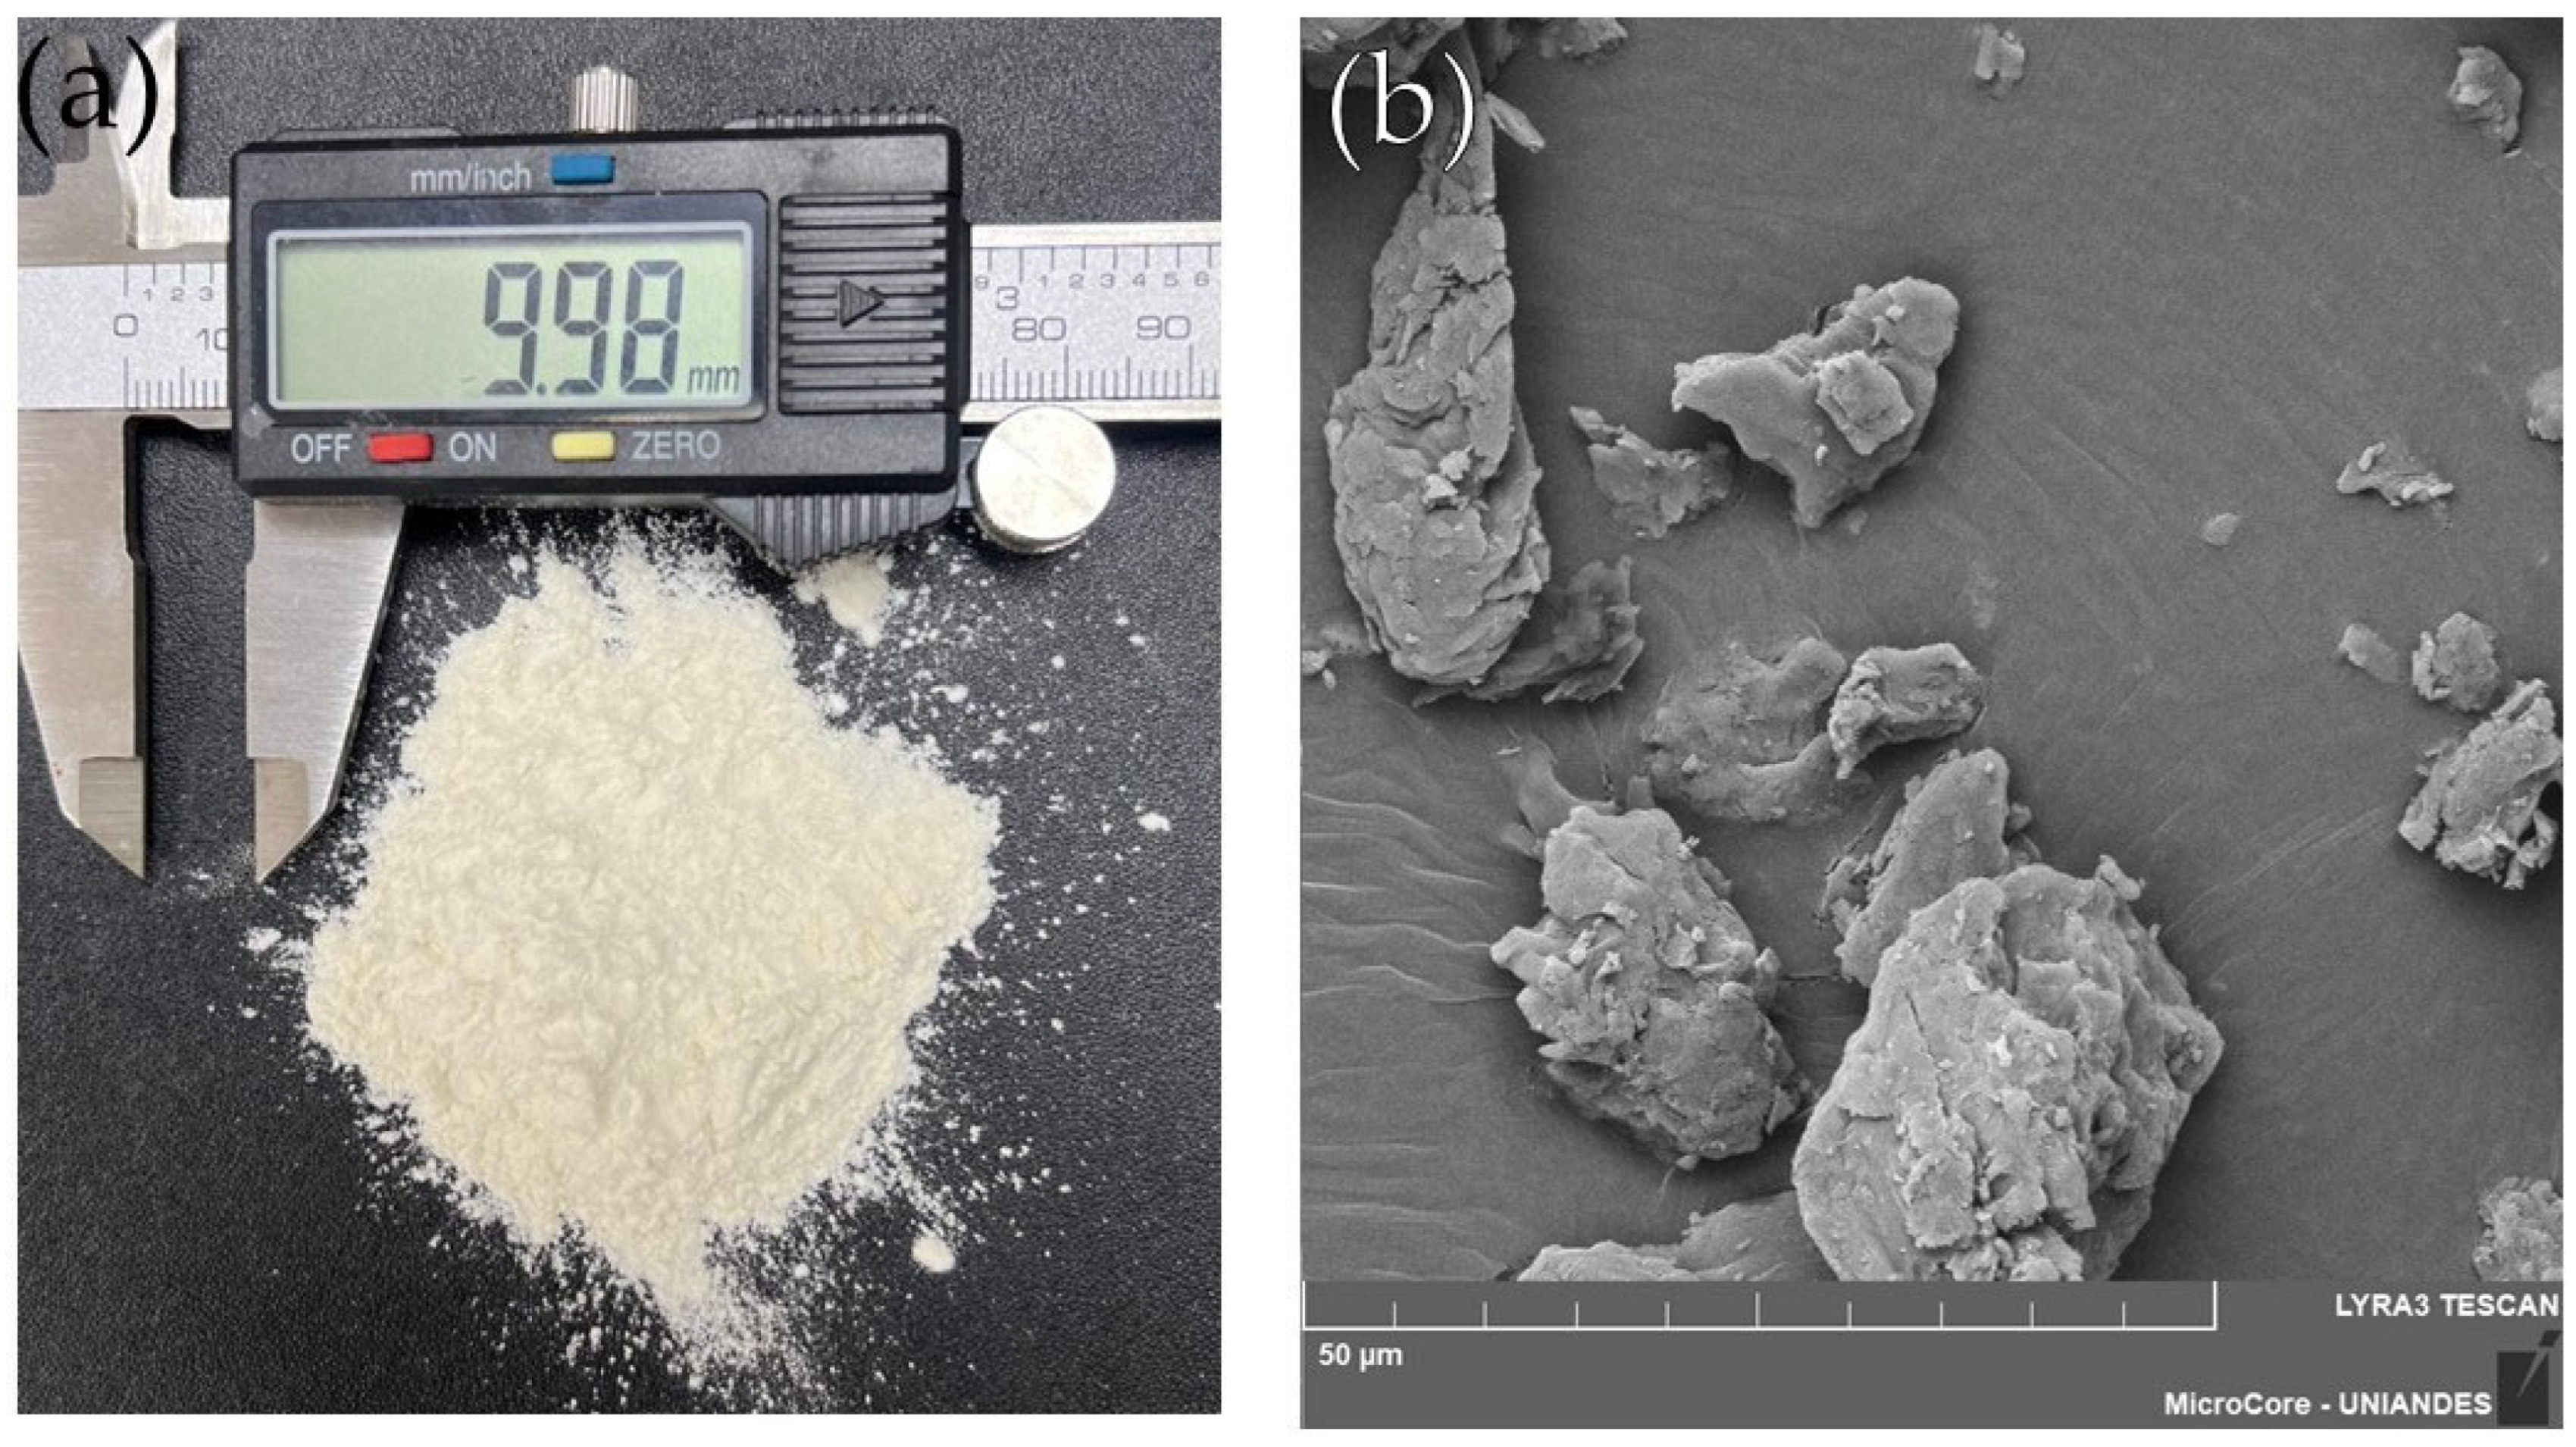
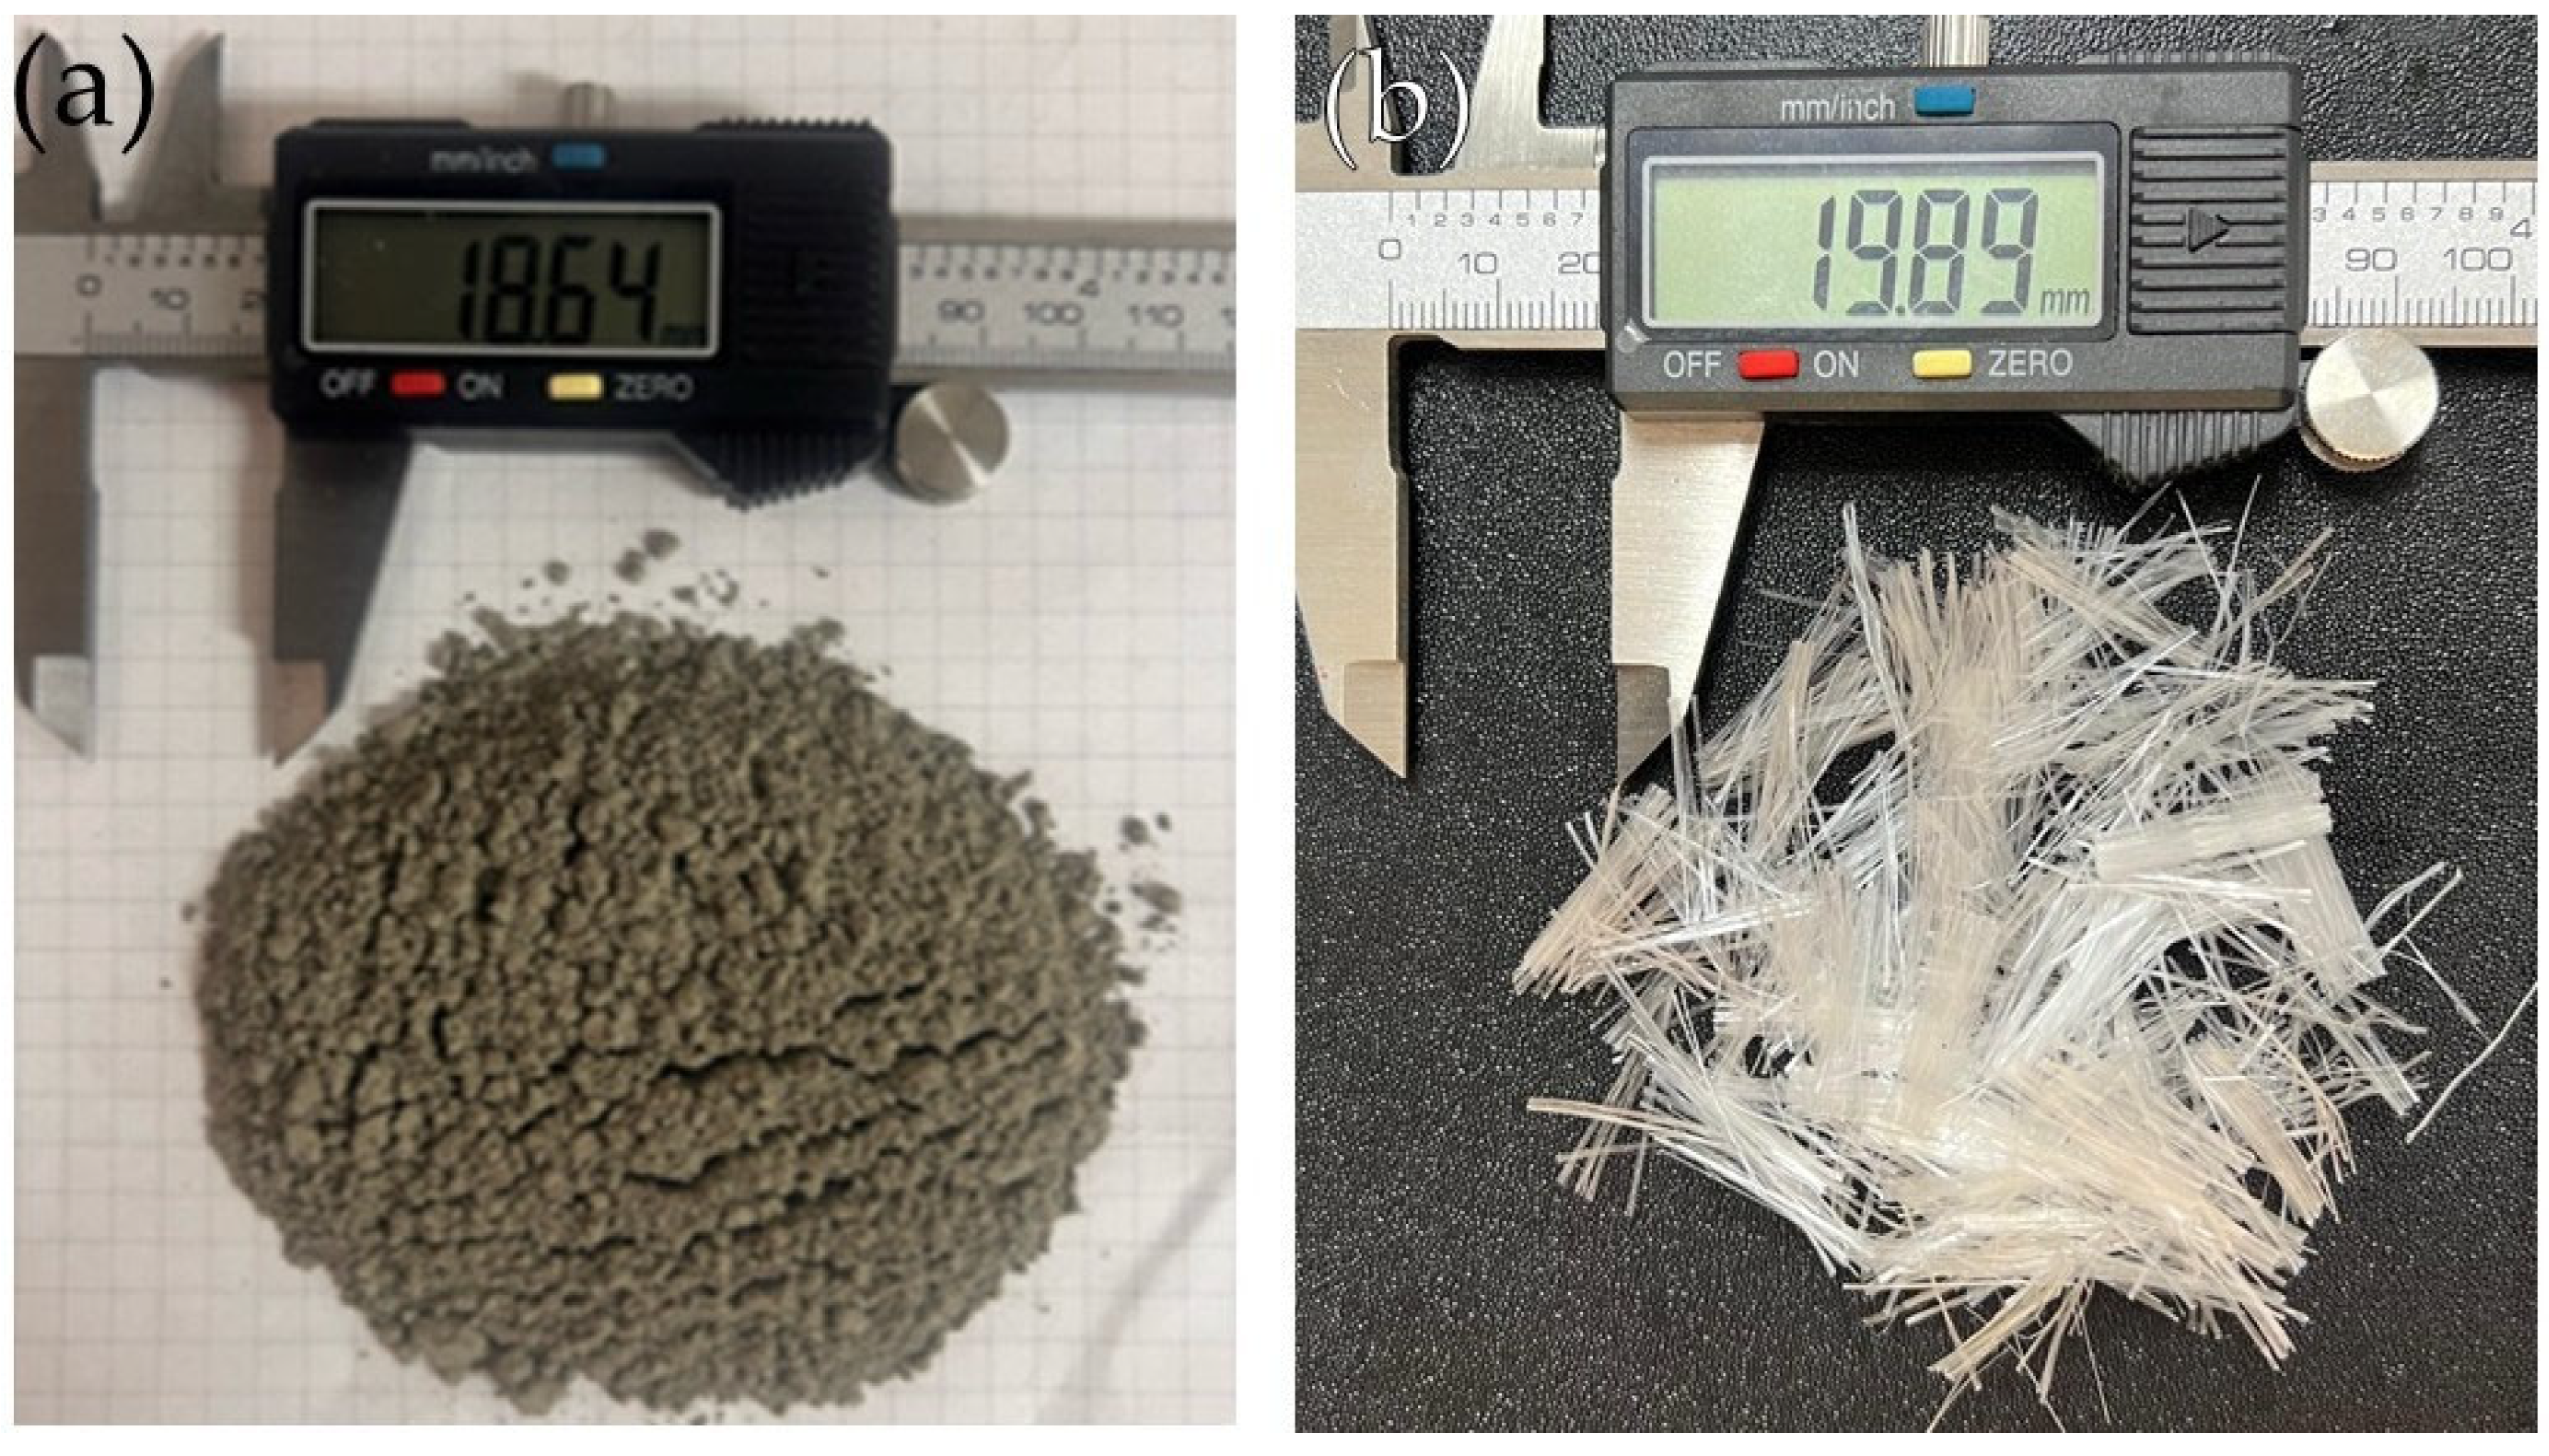
2.1.2. Properties of Recycled Materials (CLW, GG, and GY) and XG

The CLW (Figure 3) was collected from a quarry located near Cartagena (9°57′57.04″ N 75°6′5.77″ O). The material was subjected to Gs testing, chemical analysis, and morphological characterization using SEM. Figure 3a shows the general appearance of the residue, while Figure 3b displays its surface structure obtained via SEM (MAG: 72×; FOV: 2.87 mm). The CLW exhibited a Gs of 2.52, gray coloration, and a textural composition predominantly consisting of MS (38%) and CS (30%), along with a 15% silt fraction. According to USCS [28], the CLW was classified as SW. The Cu and Cc coefficients were 13.67 and 1.59, respectively [6]. The chemical composition is presented in Table 3.
The GG, primarily composed of silica, was obtained by crushing recycled glass bottles collected from recycling points in Cartagena. A total of 40 kg of residue was processed in a ball mill BM for 40 min at 1 Hz, followed by sieving through a 0.15 mm mesh. The GG exhibited a Gs of 2.40, white coloration, and a particle size distribution dominated by silt (83%) and fine sand (13%), with 4% clay content. According to the USCS [28], it was classified as ML. The Cu and Cc coefficients were 5.71 and 1.03, respectively [6]. Figure 4a shows the processed residue, while Figure 4b presents its morphology (SEM MAG: 2.67 kx; FOV: 77.6 µm), where the particles exhibit irregular geometry and diameters < 0.10 mm. SEM observations of the CLW, GY, and GG samples revealed a granular arrangement with no visible signs of chemical interaction between particles. The chemical composition data for GG are provided in Table 3.
The GY (Figure 5) was obtained by grinding ceiling panels recovered from demolition waste. A total of 40 kg of material was collected, of which 4 kg were processed in a BM for 40 min at 1 Hz. The ground material was then stolen using a 1 mm mesh. The GY recorded a Gs of 2.33, white coloration, and was primarily composed of fine sand (59%) and silt (32%), with a small fraction of clay (3%). According to the USCS [28], the GY was also classified as SW. The Cu and Cc coefficients were 18.50 and 1.76, respectively [6]. The chemical composition is reported in Table 3, and its microstructure is shown in Figure 6b (SEM MAG: 299×; FOV: 695 µm).
According to Baldovino et al. [25], XG exhibits a density (ρXG) of approximately 1.5 g/cm3, a pH value of 6.34, and a viscosity measured at 1200 MPa·s. Its elemental composition is mainly comprised of carbon (54.05%), oxygen (43.47%), sodium (1.59%), and calcium (0.89%). This specific chemical profile facilitates the formation of both ionic and covalent bonds, contributing to enhanced cohesion and structural stability in the soil after treatment. Figure 6 shows the XG used in this study.
The binder employed in this study was Type III Portland cement (Figure 7a), known for its high early strength. According to the manufacturer’s technical specifications, its chemical composition is predominantly CaO (60.7%), MgO (4.1%), and SO3 (3.0%). The insoluble residue and fineness, expressed as percentages, were reported as 0.77% and 0.04%, respectively [12]. The compressive strength at 28 days of curing was indicated to be 53 MPa. The specific gravity of the cement particles was determined to be 3.11 g/cm3.
PPF (Figure 7b) was sourced from a local supplier. These fibers have a length of 20 mm and a density ( ρ P P F ) of 0.91 g/cm3.
All materials were mixed and prepared using distilled water, which was also used in the characterization tests and specimen molding process.

2.2. Specimen Molding and Preparation

All specimens included in this study were prepared and cured under controlled laboratory conditions: a constant temperature of 23 ± 2 °C and relative humidity of 95%, following a curing period of 28 days for all mixtures, as summarized in Table 4. The preparation procedures were categorized into two groups according to the type of stabilizing agent used: construction residues with Portland cement (CLW, GG, GY) and biopolymer-based mixtures (XG and XG–PPF). While both followed similar curing conditions and specimen geometries, the material handling and compaction processes differed slightly depending on the type of binder.
The preparation began with air-dried and sieved soil. Stabilizing agents (cement and residue) were dozed by weight relative to the dry mass of the soil. Cement content was fixed at 3% and 6%, while residues were added at 15% and 30% for CLW, and 10% and 20% for GG and GY, respectively. The mixing process was carried out manually to ensure uniformity, and the optimum moisture content was set at 18%, based on a standard Proctor compaction test (γd, max = 17.6 kN/m3) [12].
Each batch was subdivided into three portions to prepare one specimen per dry unit weight level: 17.0, 17.6, and 18.0 kN/m3.
For mixtures stabilized with XG, the biopolymer was first dissolved in distilled water and then gradually incorporated into the soil. Dosages of 1, 3, and 5% (by dry soil weight) were selected based on literature recommendations [26,33,34]. The amount of water was adjusted to achieve maximum compaction close to γd = 16.5, 17.0, and 17.6 kN/m3. Specimens with XG–PPF included 0.5% polypropylene fibers by weight, added during the mixing stage [25].
The mixtures were compacted in three layers, each with equal mass and carefully scarified between layers to ensure homogeneity. Cylindrical specimens were molded using standard molds (5 cm diameter × 10 cm height; volume ≈ 196.35 cm3). After compaction, samples were wrapped in plastic, sealed, and stored in a humid chamber for the full 28-day curing period.
Before testing, specimens were submerged in distilled water for 24 h to minimize matric suction. Acceptance criteria required the dry density to remain within ±1% of the target value and moisture content within ±0.5% of the intended optimum. This immersion step was adopted based on established methodologies [35,36], aiming to reduce matric suction effects that could interfere with mechanical performance.

2.3. Stiffness (Non-Destructive) and UCS Program

Following immersion, specimens were tested for stiffness and unconfined strength. The small-strain shear modulus (Go) was evaluated using Pundit Lab Plus equipment (Proceq, Zúrich, Switzerland), following the guidelines established in ASTM C597 [37]. This equipment enabled the generation and detection of both compression (P) waves at 54 kHz and shear (S) waves at 250 kHz. The wave propagation velocities were used to compute the shear modulus at small strains (Go), employing the relation Go = γVs2.
For the UCS tests, specimens were vertically positioned in a hydraulic press and subjected to axial load at a constant displacement rate of 1.15 mm/min. Two types of testing equipment were used based on specimen group: (i) an automatic press with 2.6 N resolution for residue-based mixtures and (ii) a 50 kN hydraulic multi-test press with a sensitivity of 0.1 kN for the XG and XG–PPF groups. All UCS procedures followed the ASTM D2166 standard [38].
Additionally, selected fragments from the tested specimens were preserved for matric suction measurement to support the interpretation of mechanical behavior under unsaturated conditions. The experimental program is schematically summarized in Figure 8.

2.4. Statistical Analysis

To evaluate the influence of the different stabilizing materials and compaction conditions on the mechanical behavior of the treated clay, a statistical analysis was conducted using IBM SPSS Statistics Version 29. The results of unconfined compressive strength (UCS) and small-strain shear modulus (Go) were analyzed through a univariate analysis of variance (ANOVA), with a significance level set at p < 0.05. The ANOVA model was employed to assess the statistical relevance of the type of additive (CLW, GG, GY, XG, XG–PPF), the dosage level, and the dry unit weight, as well as the interactions among these factors. This approach allowed the identification of significant differences between group means, helping to determine whether variations in the input variables resulted in meaningful changes in the mechanical response of the mixtures. Furthermore, the presence of curvature in the response surface was verified to support the interpretation of trends within the data.

3. Results

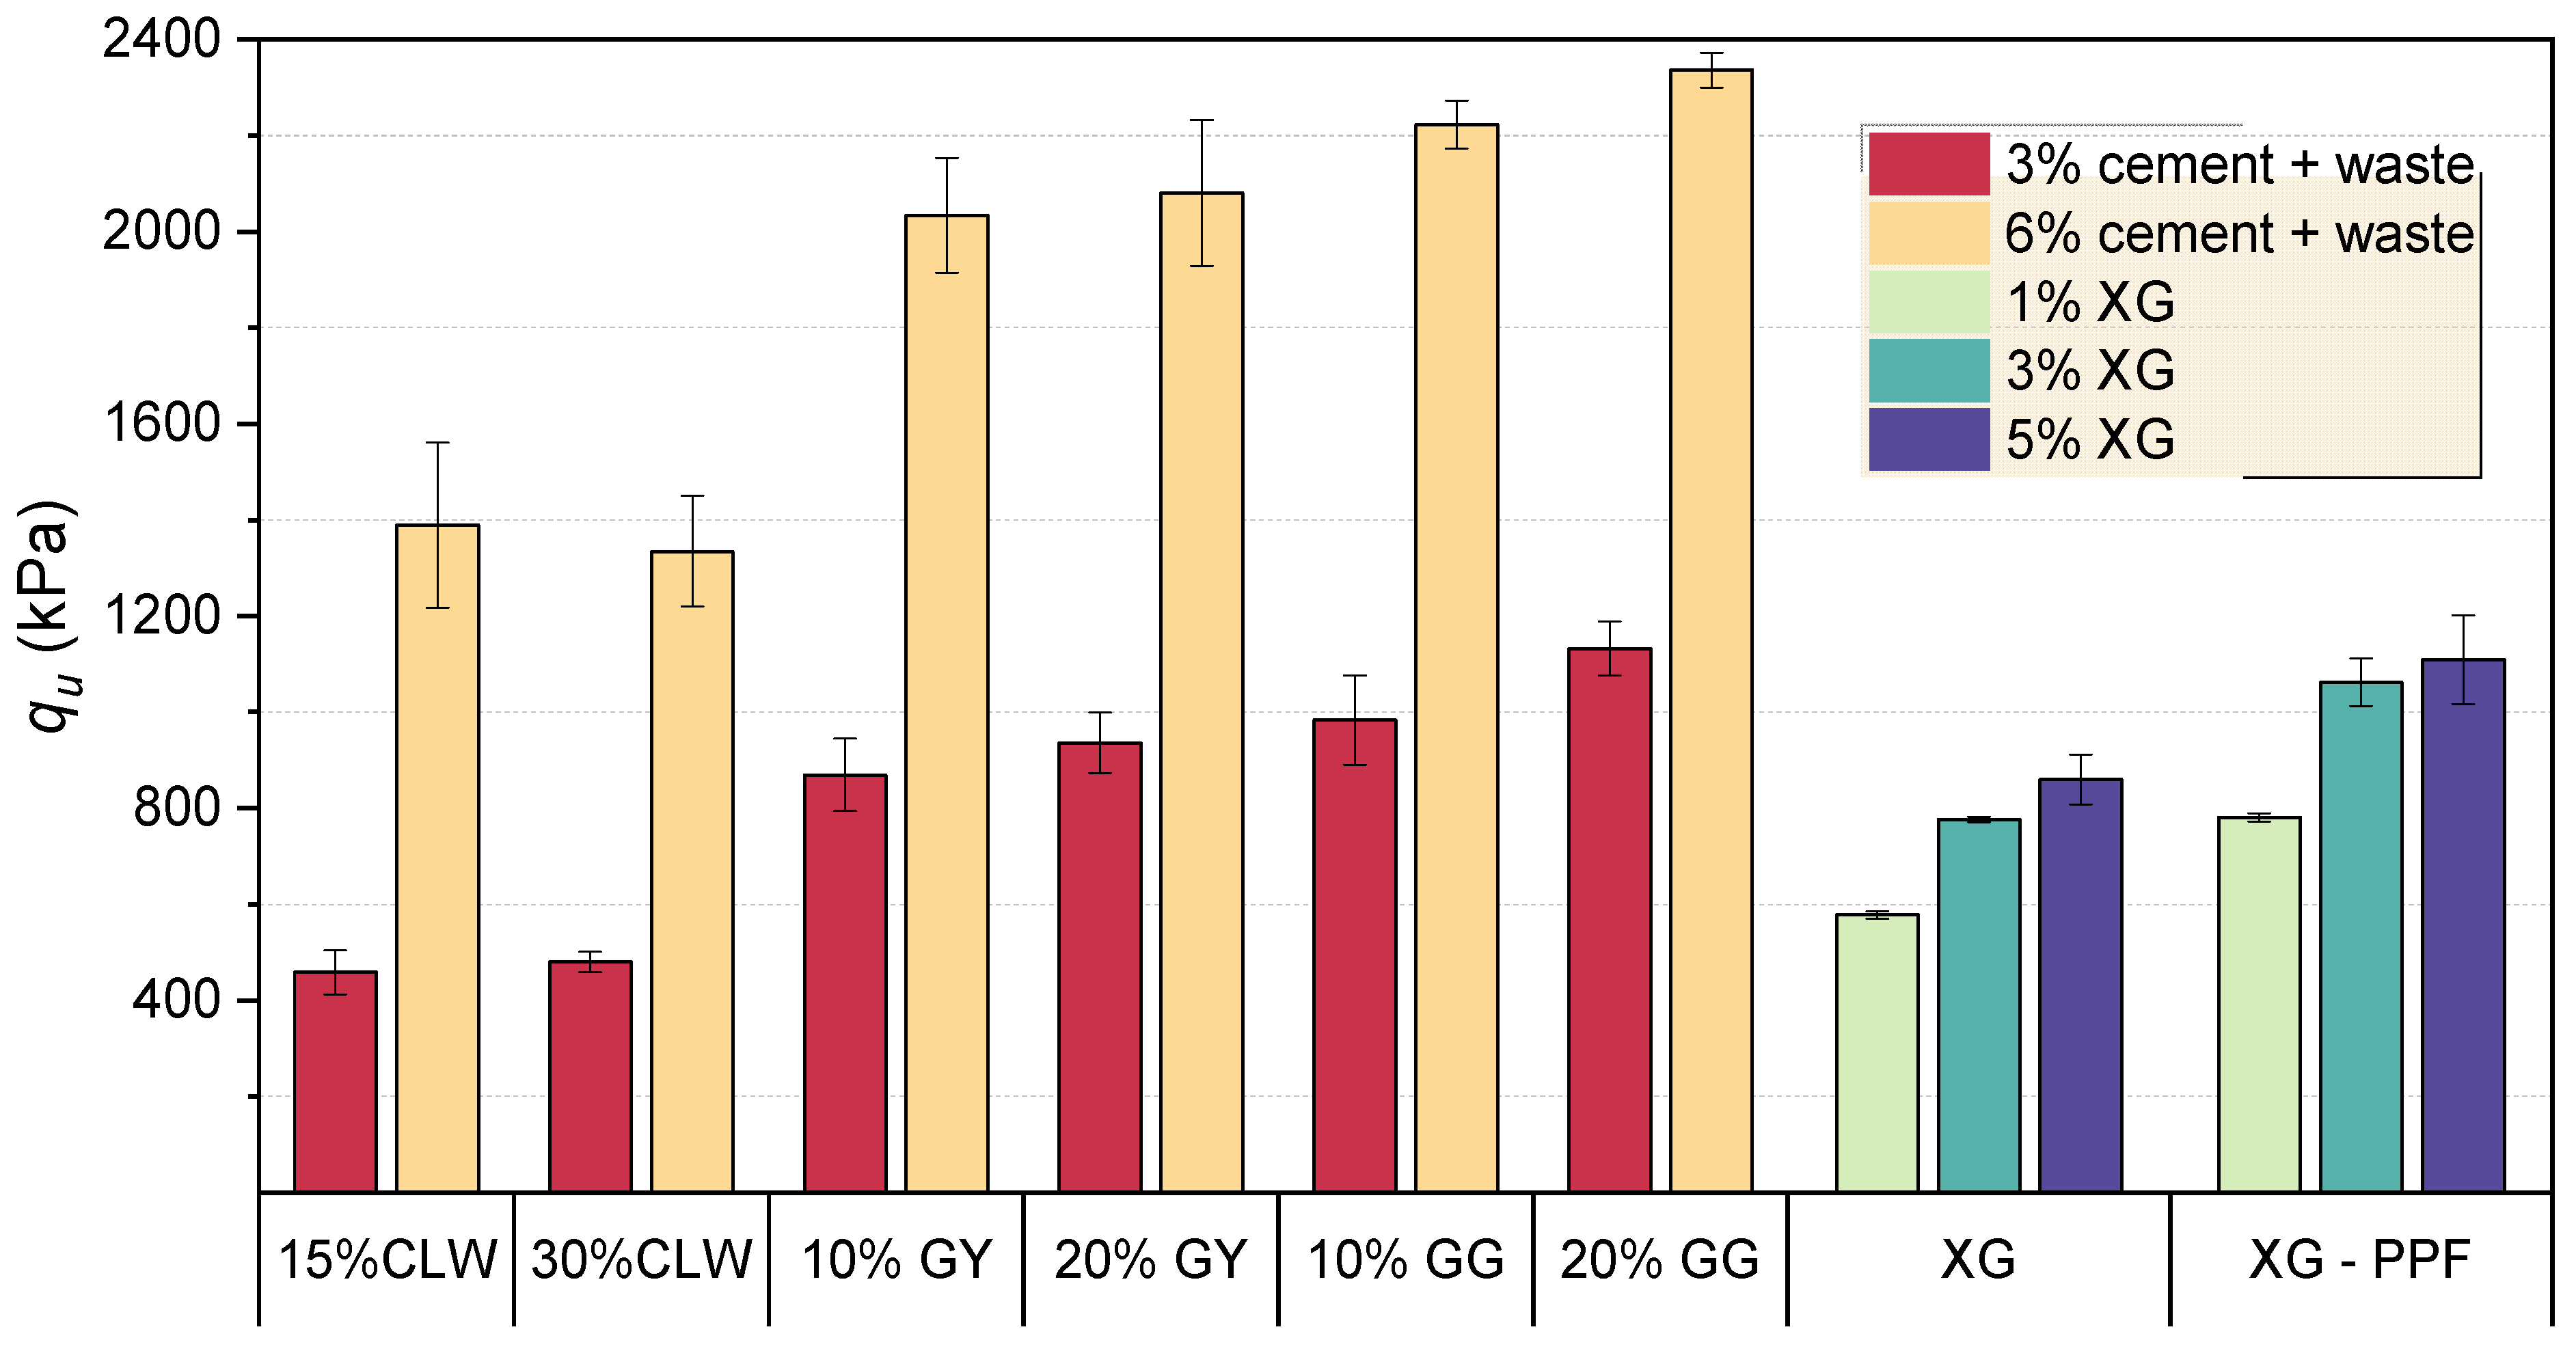
3.1. Assessment of the Mechanical Behavior (Strength and Stiffness) of Novel Geomaterials

A comparative analysis is presented below for the eight mixtures involved in the study, considering both unconfined compressive strength and stiffness results. Due to the presence of 3% and 6% cement contents in the mixtures with residues (CLW, GY, and GG), these were grouped according to the percentage of residue added by weight of the clay soil. To simplify the comparative analysis, the optimal dry density (γd = 17.6 kN/m3) was used as a common reference point, allowing a clearer observation of the effect of each treatment on the mechanical properties evaluated. The compressive strength and stiffness results are presented in Figure 9 and Figure 10, respectively.
As shown in Figure 9, the results indicate that GG exhibited the best performance in terms of unconfined compressive strength, reaching values up to 2335.97 kPa, particularly at a 20% dosage combined with 6% cement. GY also demonstrated notable improvements, achieving 2079.96 kPa under similar conditions. In contrast, CLW showed a less efficient response; the 15% CLW mixture outperformed the 30% mixture, suggesting a possible saturation effect or lower reactivity of the residue at higher contents. The associated standard deviations reveal greater variability in CLW and GY compared to GG, emphasizing the consistent performance of the latter. Regarding XG and XG–PPF, a progressive increase in strength was observed with increasing XG content, reaching a maximum of 859.59 kPa. The addition of polypropylene fibers (XG–PPFs) further enhanced mechanical behavior, achieving 1109.15 kPa at 5% XG, surpassing several cemented residue mixtures. These formulations also displayed the lowest standard deviations, indicating more homogeneous behavior. Although their strength was lower than that of GG or GY mixtures, their stability and sustainability position them as a viable alternative in contexts where mechanical uniformity and environmental considerations are prioritized.
In terms of initial small-strain stiffness (Figure 10), GG again delivered strong results, with values reaching up to 7121.27 kPa at 20% content and 6% cement. However, unlike in the compressive strength data, the 10% GG mixture with 6% cement (6579.96 kPa) showed a slightly closer performance, indicating a more gradual increase in stiffness with increasing residue content. GY followed a similar pattern, with stiffness peaking at 8051.67 kPa for the 20–6%C mixture. Notably, these values represent the highest stiffness recorded across all formulations, suggesting that GY’s reactivity and matrix formation at early strain levels are highly efficient under cemented conditions. CLW, while achieving considerable stiffness (6223.88 kPa at 15–6%C), maintained the same trend observed in strength: limited improvement at higher residue content. The decrease in variability at 30% CLW compared to 15% (despite lower average stiffness) indicates a more consistent internal structure, albeit with reduced mechanical output.
For the biopolymer-treated soils, XG and XG–PPF mixtures exhibited significantly lower stiffness values compared to cemented residues, with maximum values of 1709.94 kPa (XG) and 2197.75 kPa (XG–PPF) at 5% dosage. Nevertheless, the increasing trend with dosage was clear in both cases, and the incorporation of PPF provided a notable improvement over XG alone. The progression from 1% to 5% XG–PPF represented a near doubling in stiffness, emphasizing the positive synergistic effect of fiber reinforcement. Compared to their compressive strength results, the XG-based mixtures showed proportionally greater gaps in stiffness relative to GG and GY. This suggests that while biopolymers improve strength through cohesive effects, their influence on stiffness remains limited, potentially due to the absence of cementitious mineral bonding phases. Still, the reduced variability and repeatable response of these mixtures highlight their potential for specific engineering applications where high stiffness is not the primary requirement.
The relationship between stiffness and strength is shown in Figure 11. The general correlation obtained for all mixtures was expressed as Go = 3354.7qu, with a determination coefficient of R2 = 0.74. Although this represents a moderate fit, it highlights the limitation of applying a grouped regression model across different stabilization strategies. The variability in composition and behavior among the mixtures suggests that individual regression analyses are more appropriate. This observation aligns with the findings of Roman et al. [12], who reported a much stronger correlation for CLW-based mixtures alone, reaching Go = 4828.8qu with a coefficient of determination of R2 = 0.96. Such results reinforce the importance of disaggregated modeling when dealing with diverse materials and stabilization mechanisms.

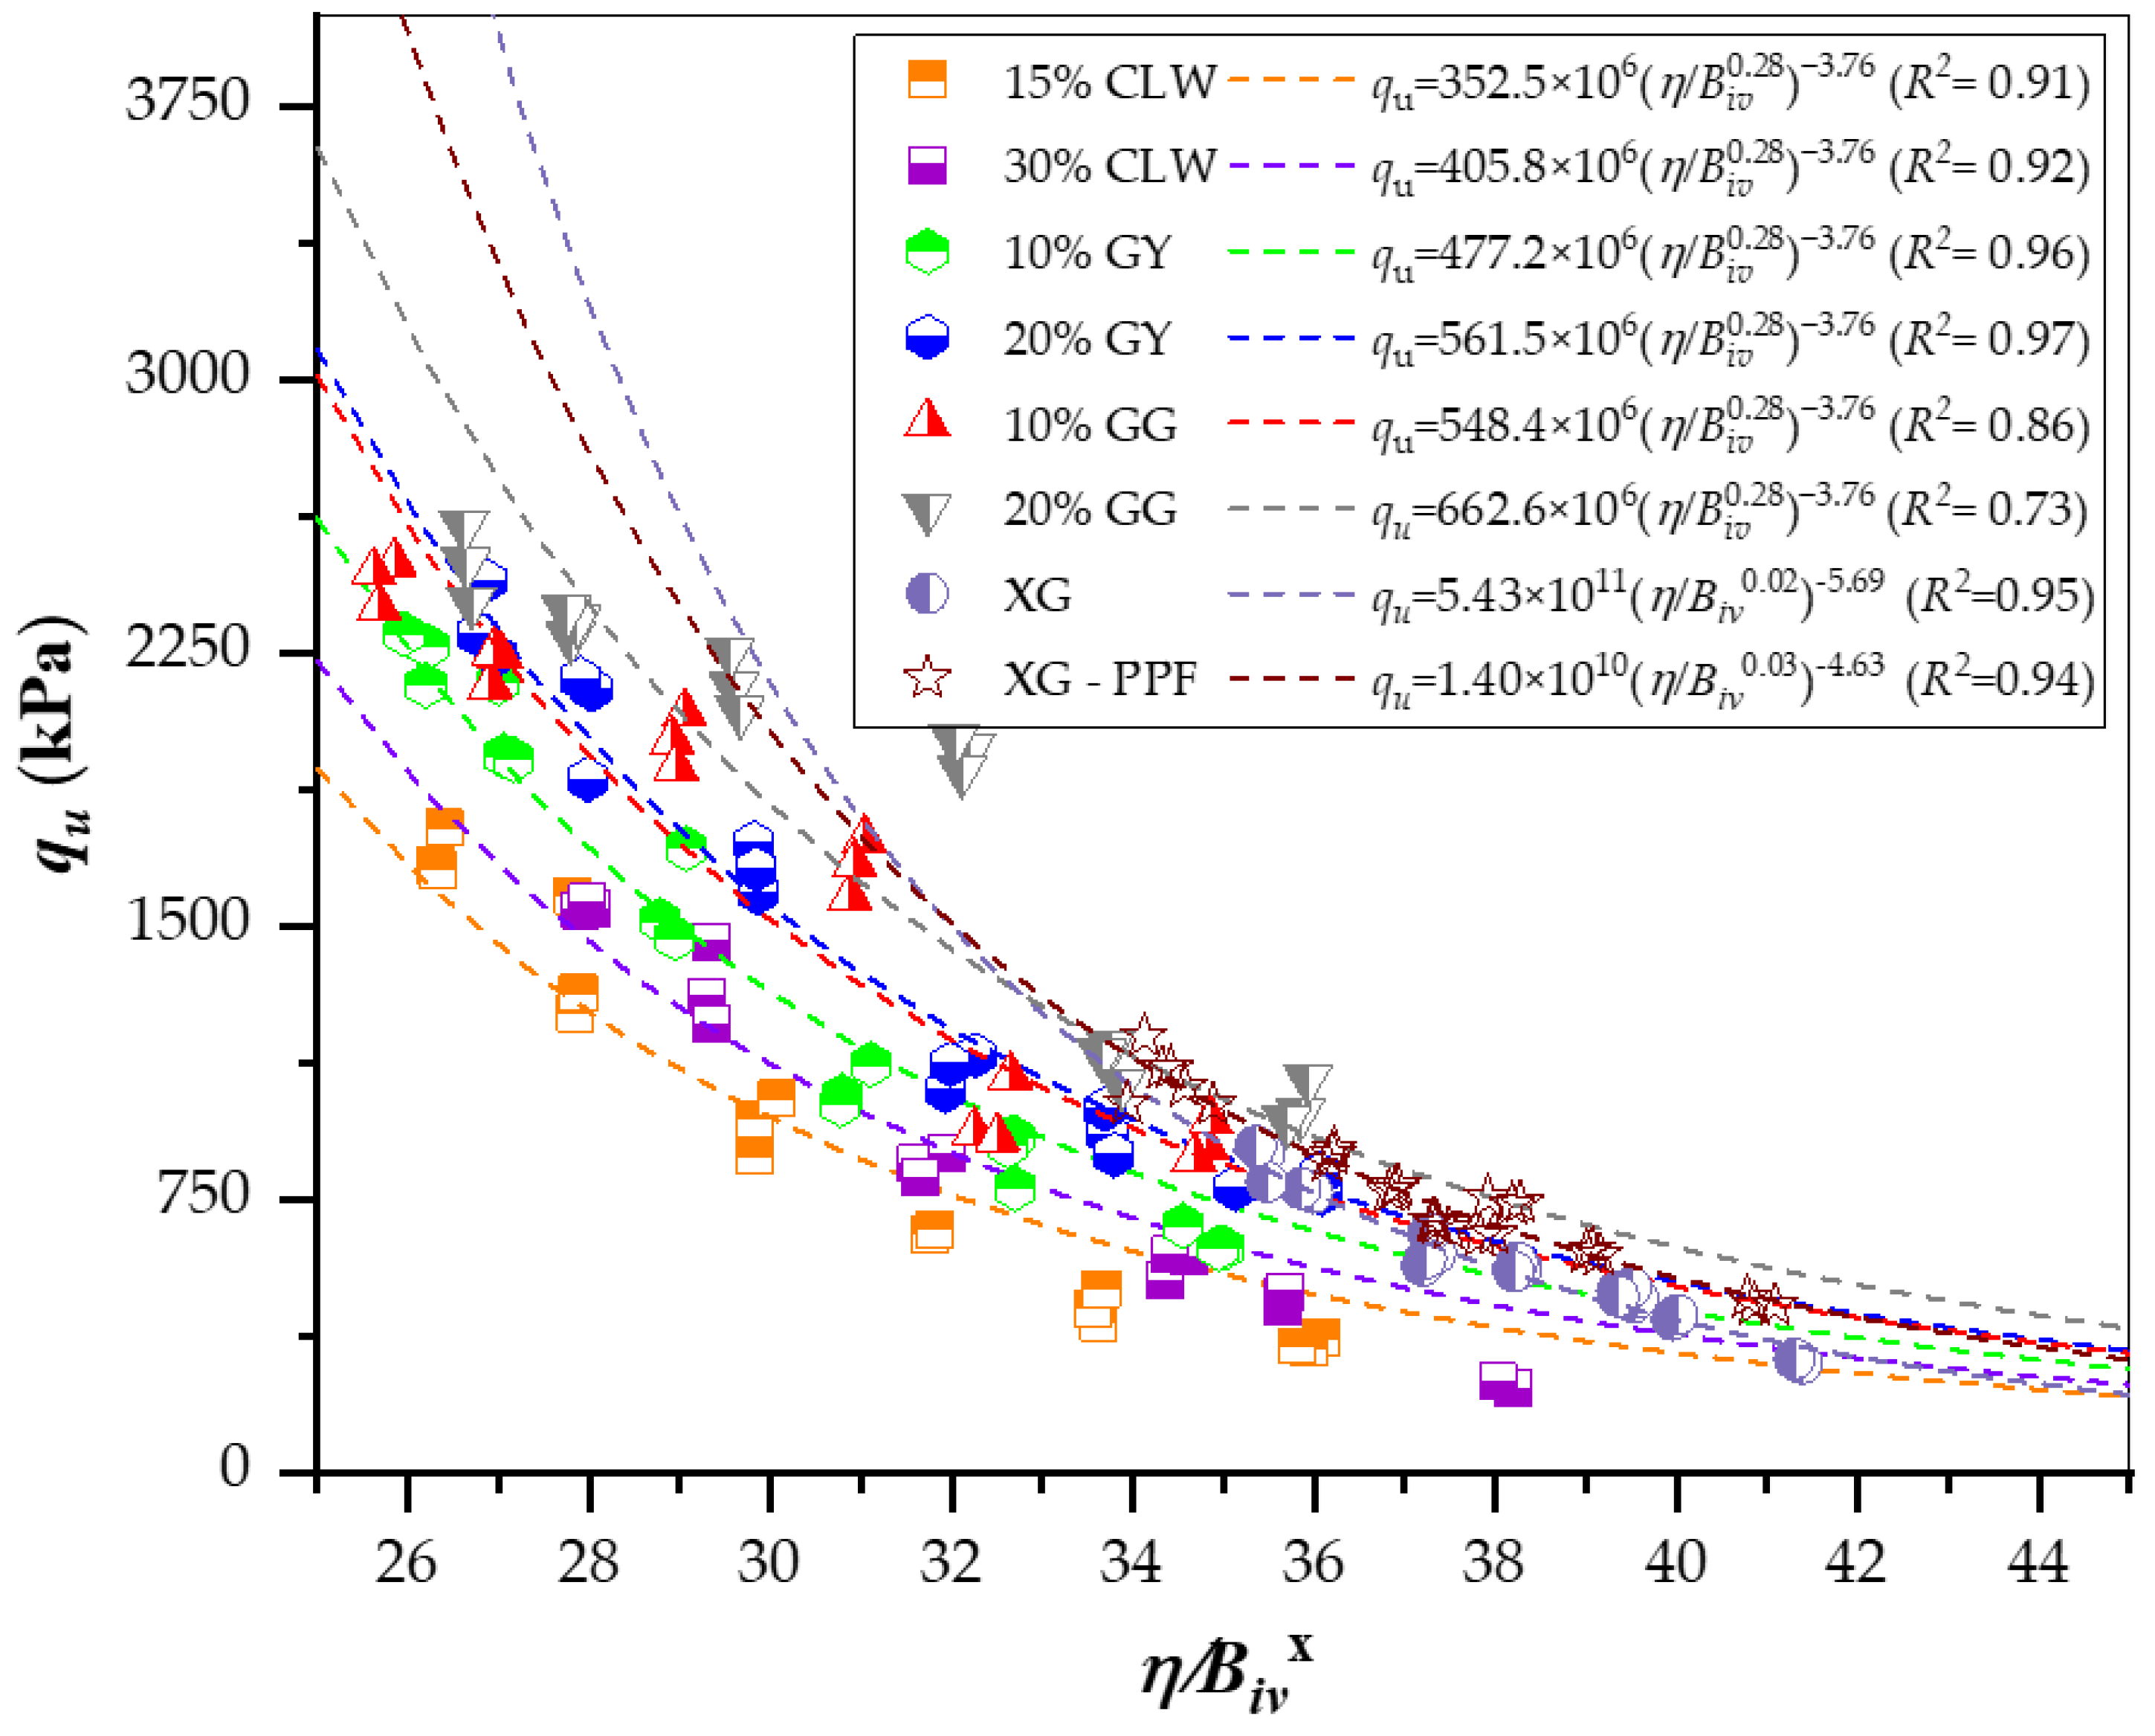
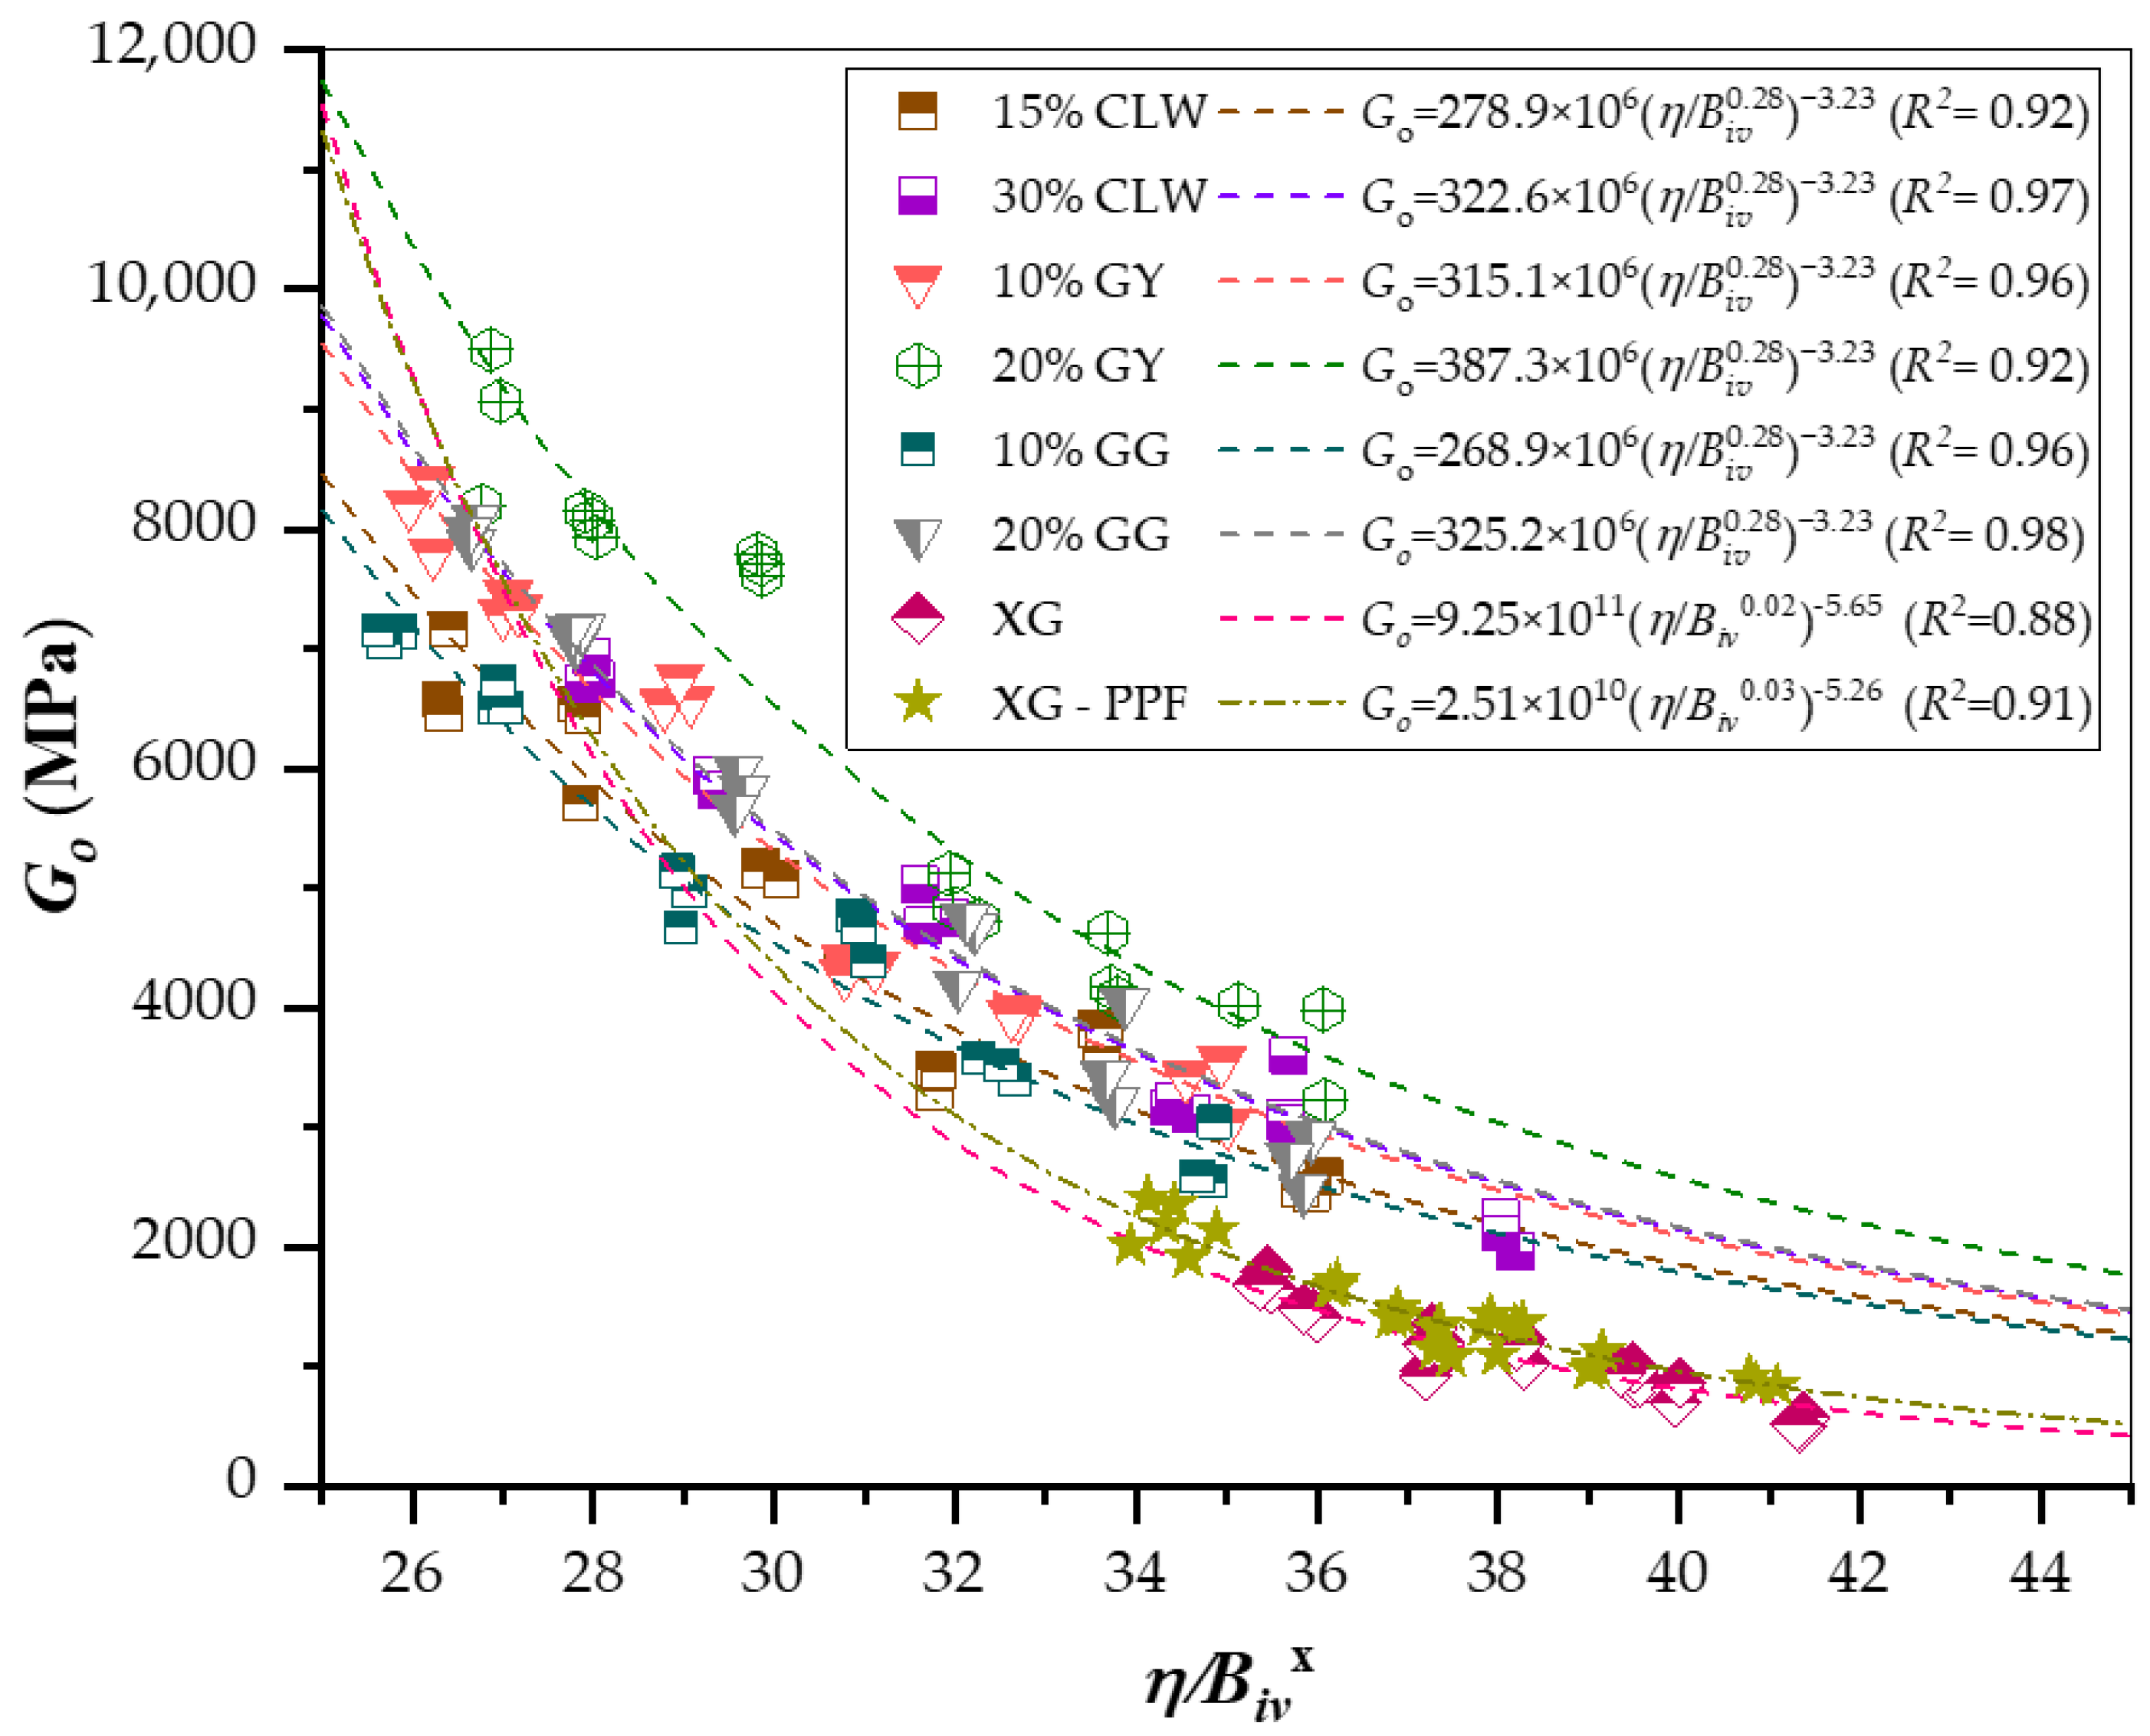
3.2. Application of the Porosity/Binder Index in Predicting the Compressive Strength and Stiffness of Novel Geomaterials

The porosity/binder index (η/Biv), originally developed by Consoli et al. [39] (3), has become a key tool in the rational design of soil–binder mixtures. By establishing a relationship between the void content of compacted soils and the absolute volume of binder, this index provides a robust physical foundation for predicting mechanical behavior—including unconfined compressive strength (qu) and small-strain stiffness (Go)—through the power-type relationship shown in Equation (1).
q u   V   G o = A q η B i v x C
The model considers the combined effects of soil matrix density and effective binder availability, while the exponent x allows for adjusting the relative influence of each variable depending on the material type and stabilization mechanism [40]. Although originally conceived for soil–cement mixtures, the applicability of this approach has been successfully extended to systems using lime [35,41], pozzolans [42], and more recently, biopolymers such as xanthan gum (XG) [25,26].
In recent studies, Baldovino et al. [25,26] successfully adapted the η/Biv index to account for the inclusion of XG and PPF, modifying the traditional porosity calculation to incorporate their volumetric contributions. This reformulation enabled accurate modeling of both strength and stiffness in mixtures stabilized with sustainable binders, achieving determination coefficients above 0.9 for qu and above 0.8 for Go under optimal conditions. Furthermore, it was identified that the optimal exponent x for XG-treated systems is approximately 0.04, significantly lower than the 0.28 commonly used in Portland cement mixtures, indicating a dominant influence of porosity in these biopolymer-based systems [25]. These findings reinforce the versatility and relevance of the η/Biv index as a rational criterion for designing innovative geomaterials.
In this study, the η/Biv index is applied to a set of eight novel mixtures composed of construction residues (CLW, GY, GG), biopolymers (XG), and fiber-reinforced systems (XG–PPFs). This work compiles and extends the index-based models previously developed by Baldovino et al. [6,25,26] and Roman et al. [12], with the aim of comparing and unifying the dosage curves corresponding to each stabilization strategy. Through this comparison, the study seeks to validate the applicability of the index as an effective predictive tool for estimating the mechanical properties of mixtures containing unconventional geomaterials. Additionally, this approach enables the evaluation of stabilization efficiency across different formulations and contributes to establishing rational guidelines for optimizing binder dosages in sustainable soil improvement projects.
Figure 12 presents the results of the fitted dosage curve for the unconfined compressive strength of the eight mixtures.
The dosage curves fitted for each mixture revealed distinct trends based on the type of stabilizing material. For all mixtures incorporating construction residues (CLW, GY, and GG), a unified exponent of x = 0.28 provided consistent and high-quality fits across the board, with coefficients of determination (R2) ranging from 0.86 to 0.97. This consistency suggests that the porosity and binder content exerted a relatively balanced and predictable influence on compressive strength, enabling the use of a common power-law exponent for all residue-based formulations. Among these, GY-treated mixtures achieved the highest correlation (R2 = 0.97 for 20% GY), highlighting its superior performance in strength development and homogeneity of response. As described by Diambra et al. [43,44], these empirical curves reflect the combined contribution of the cemented phase and the soil matrix, with the cementation bonds being the dominant factor influencing the scaling constant A.
In contrast, mixtures treated with XG and XG–PPF exhibited fundamentally different behavior. The best-fitting dosage curves required significantly lower exponents, with x = 0.02 for XG and x = 0.03 for XG–PPF, indicating that porosity plays a far more dominant role in strength development for biopolymer-based mixtures. Additionally, the markedly higher values of the constant A (on the order of 1010–1011) further reflect the sensitivity of these systems to small changes in internal structure. As proposed by Festugato et al. [45], the parameter A in such mixtures may also encapsulate the combined effects of the fiber reinforcement and the frictional resistance of the soil matrix, particularly in formulations where no traditional cement is present.
Despite achieving high determination coefficients (R2 > 0.94), the need to use distinct exponents for XG-based formulations suggests that a single, unified adjustment—such as the one applied to the residue-based mixtures—is not suitable for biopolymer-stabilized soils.
The stiffness results (Go) (Figure 13) revealed similar behavioral trends to those observed in the compressive strength analysis, further confirming the reliability of the porosity/binder index as a predictive tool. For the mixtures containing construction residues, the use of a unified exponent of x = 0.28 again produced strong correlations, with R2 values ranging from 0.92 to 0.98. The highest stiffness was achieved with 20% GY (R2 = 0.92) and 20% GG (R2 = 0.98), while CLW-based mixtures also showed good fit, especially at 30% content. These results demonstrate that the porosity and binder content jointly control the mechanical response in terms of both strength and stiffness. In contrast, XG and XG–PPF mixtures required considerably lower exponents (x = 0.02 and x = 0.03, respectively), consistent with their compressive strength behavior. Moreover, the values of parameter A remained significantly higher, reaffirming the sensitivity of biopolymer-treated soils to small variations in void structure and internal bonding. These findings reinforce the premise put forward by Diambra et al. [43,44] and Festugato et al. [45], who emphasized that both the C and x exponents are strongly dependent on the nature of the soil matrix and the type of bonding developed in the mixture. Therefore, while the porosity/binder index is a powerful predictive tool, its calibration must be tailored to the specific mechanical behavior and composition of each treatment system.

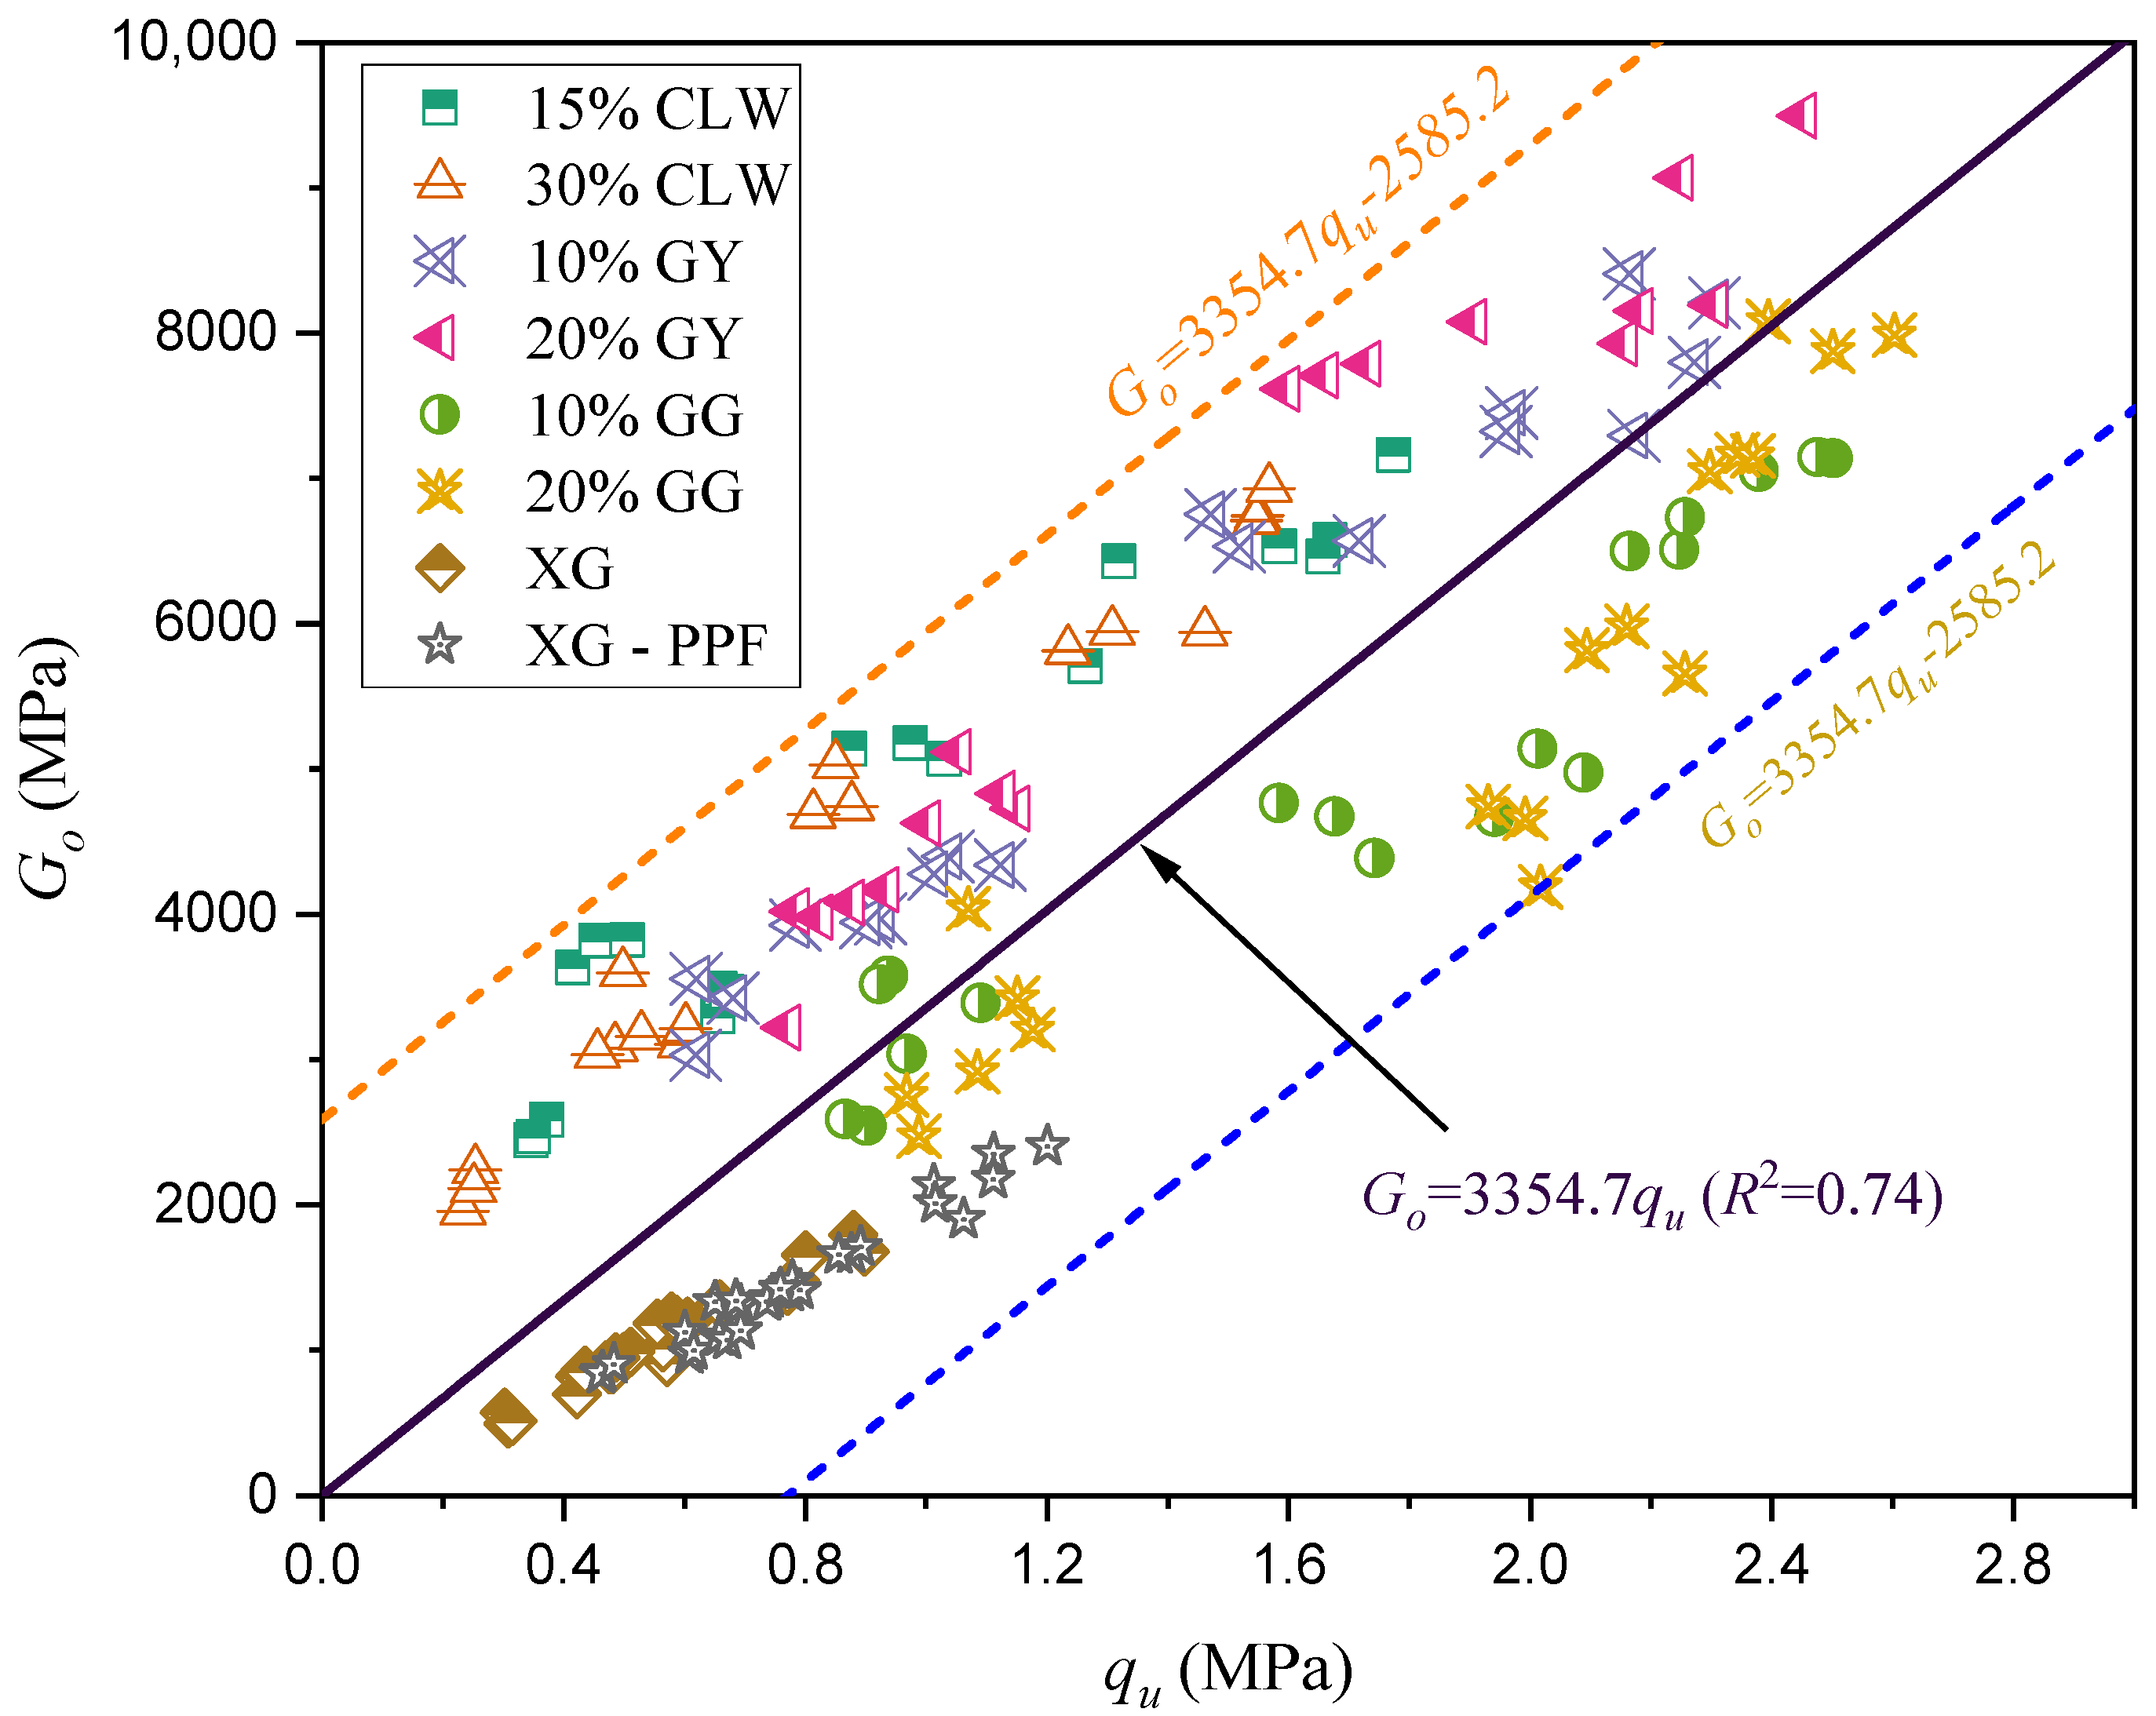
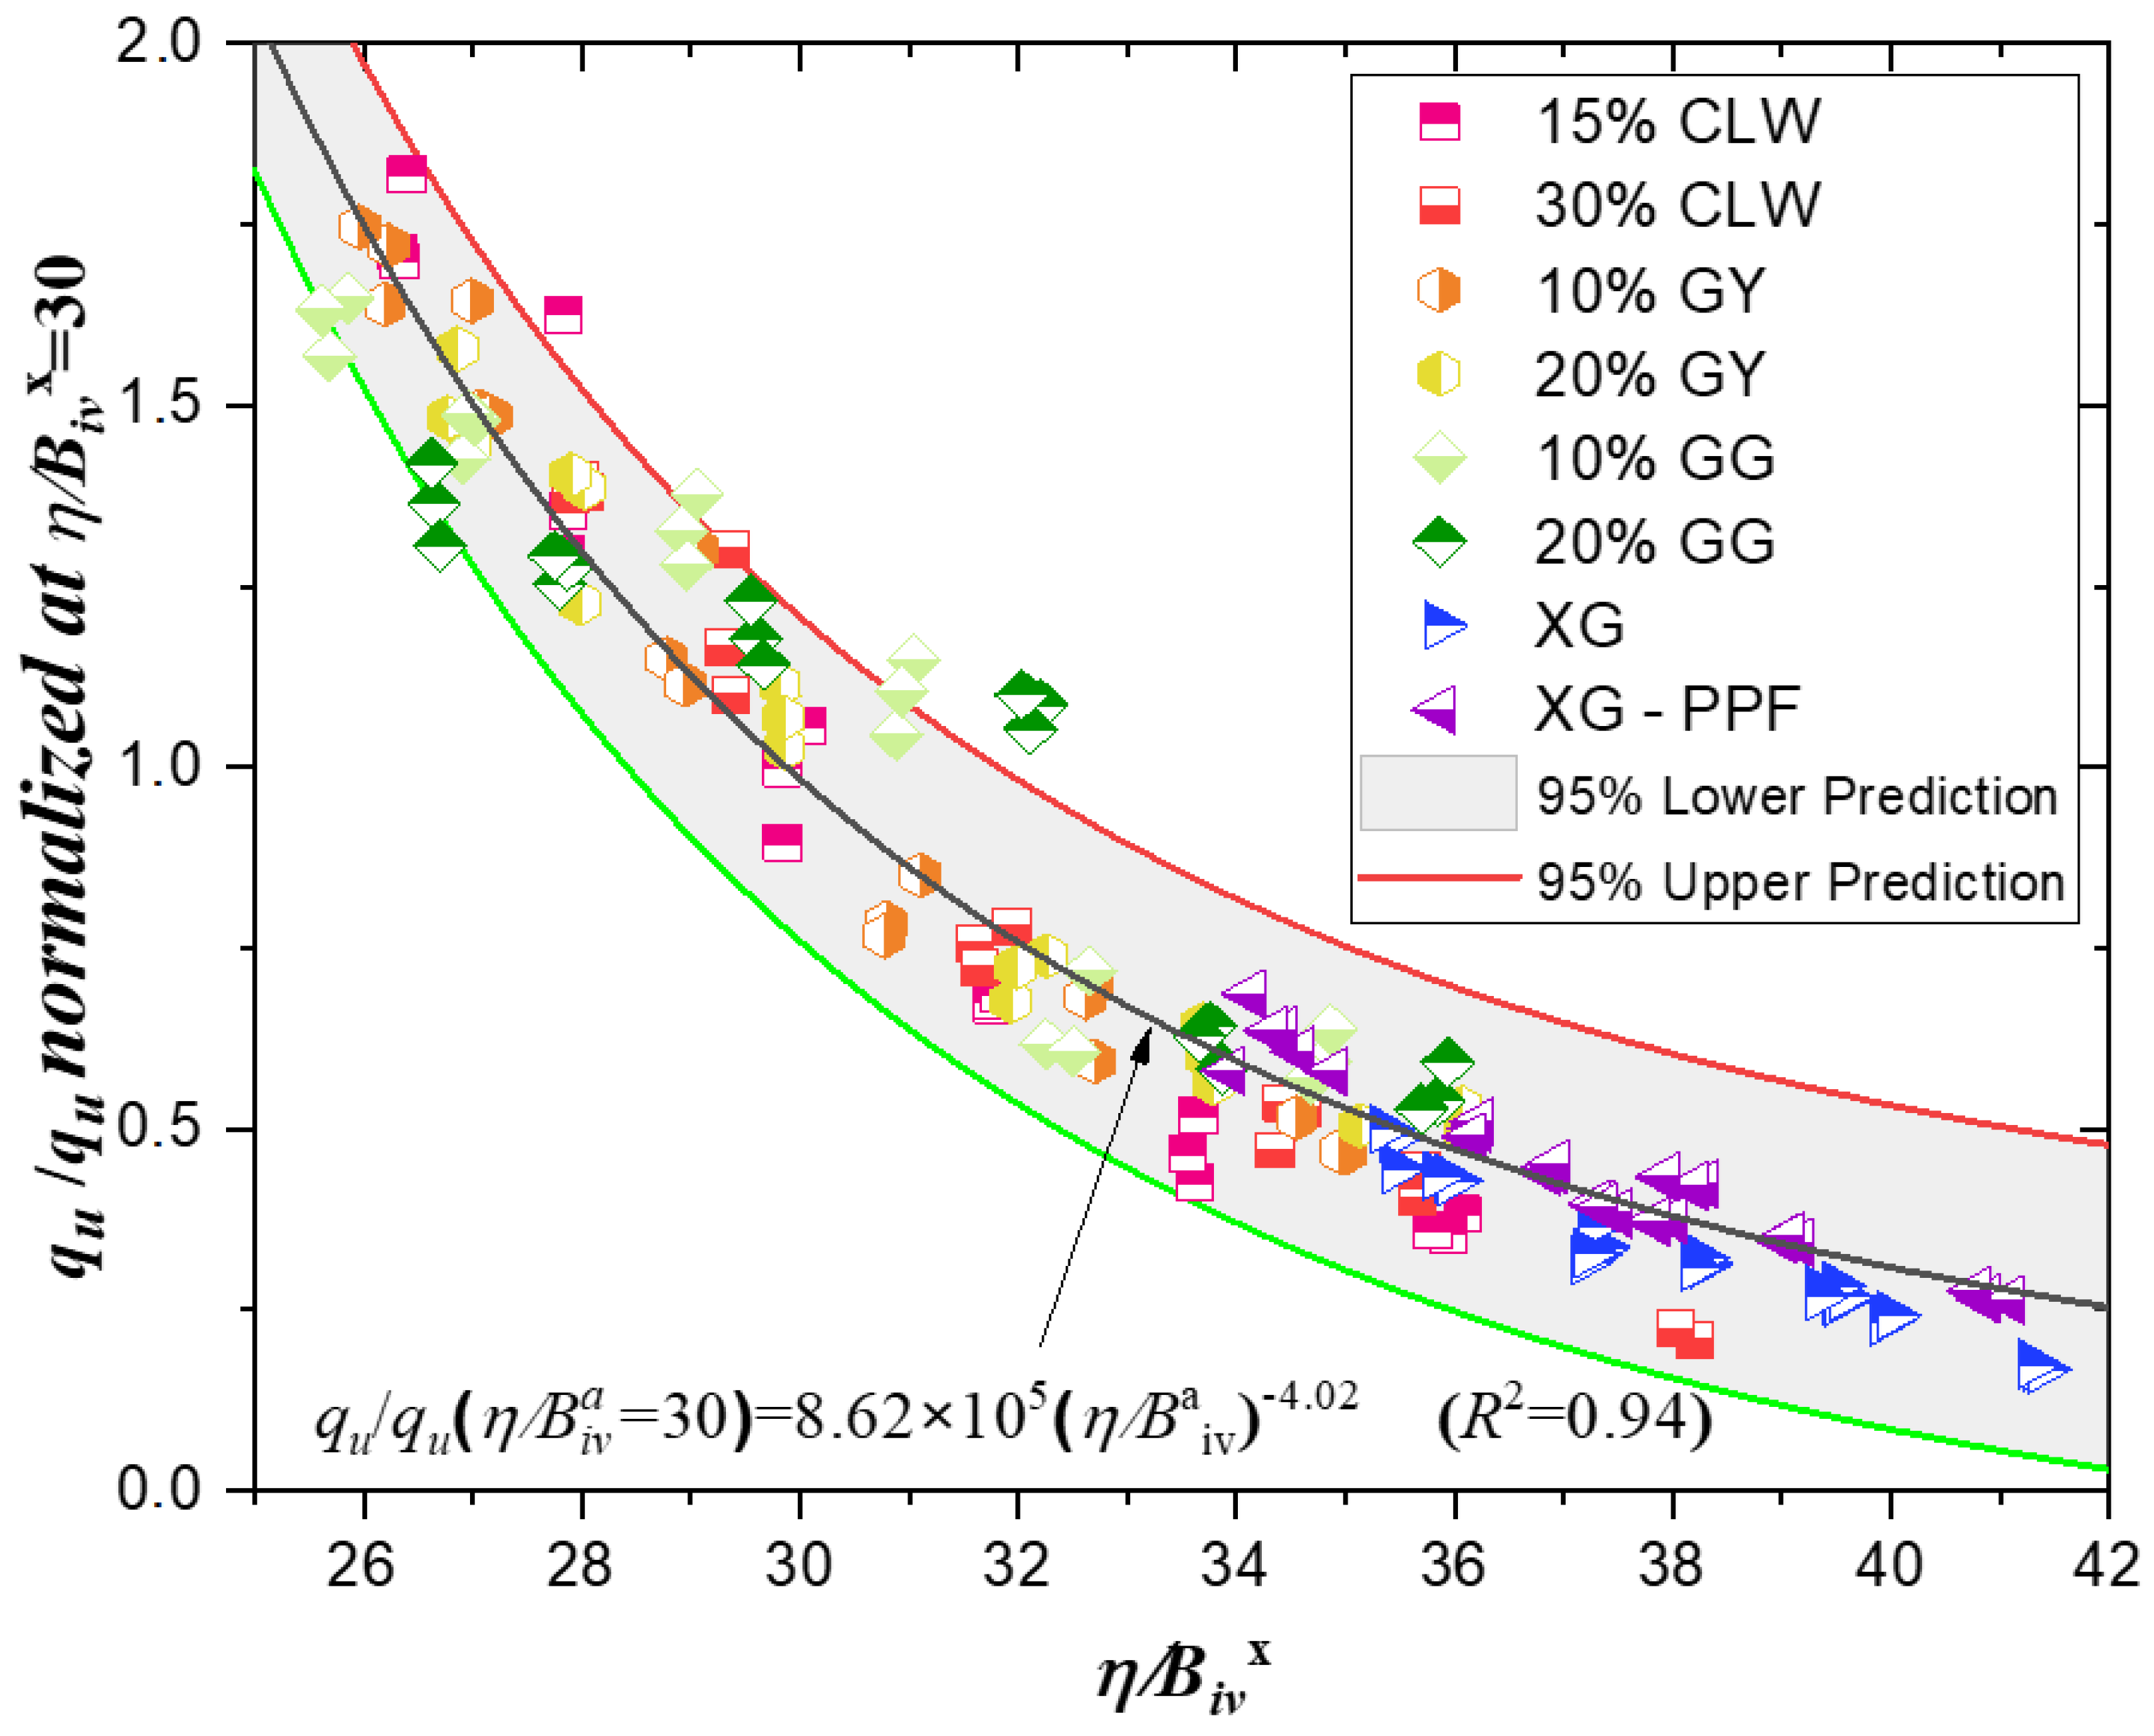
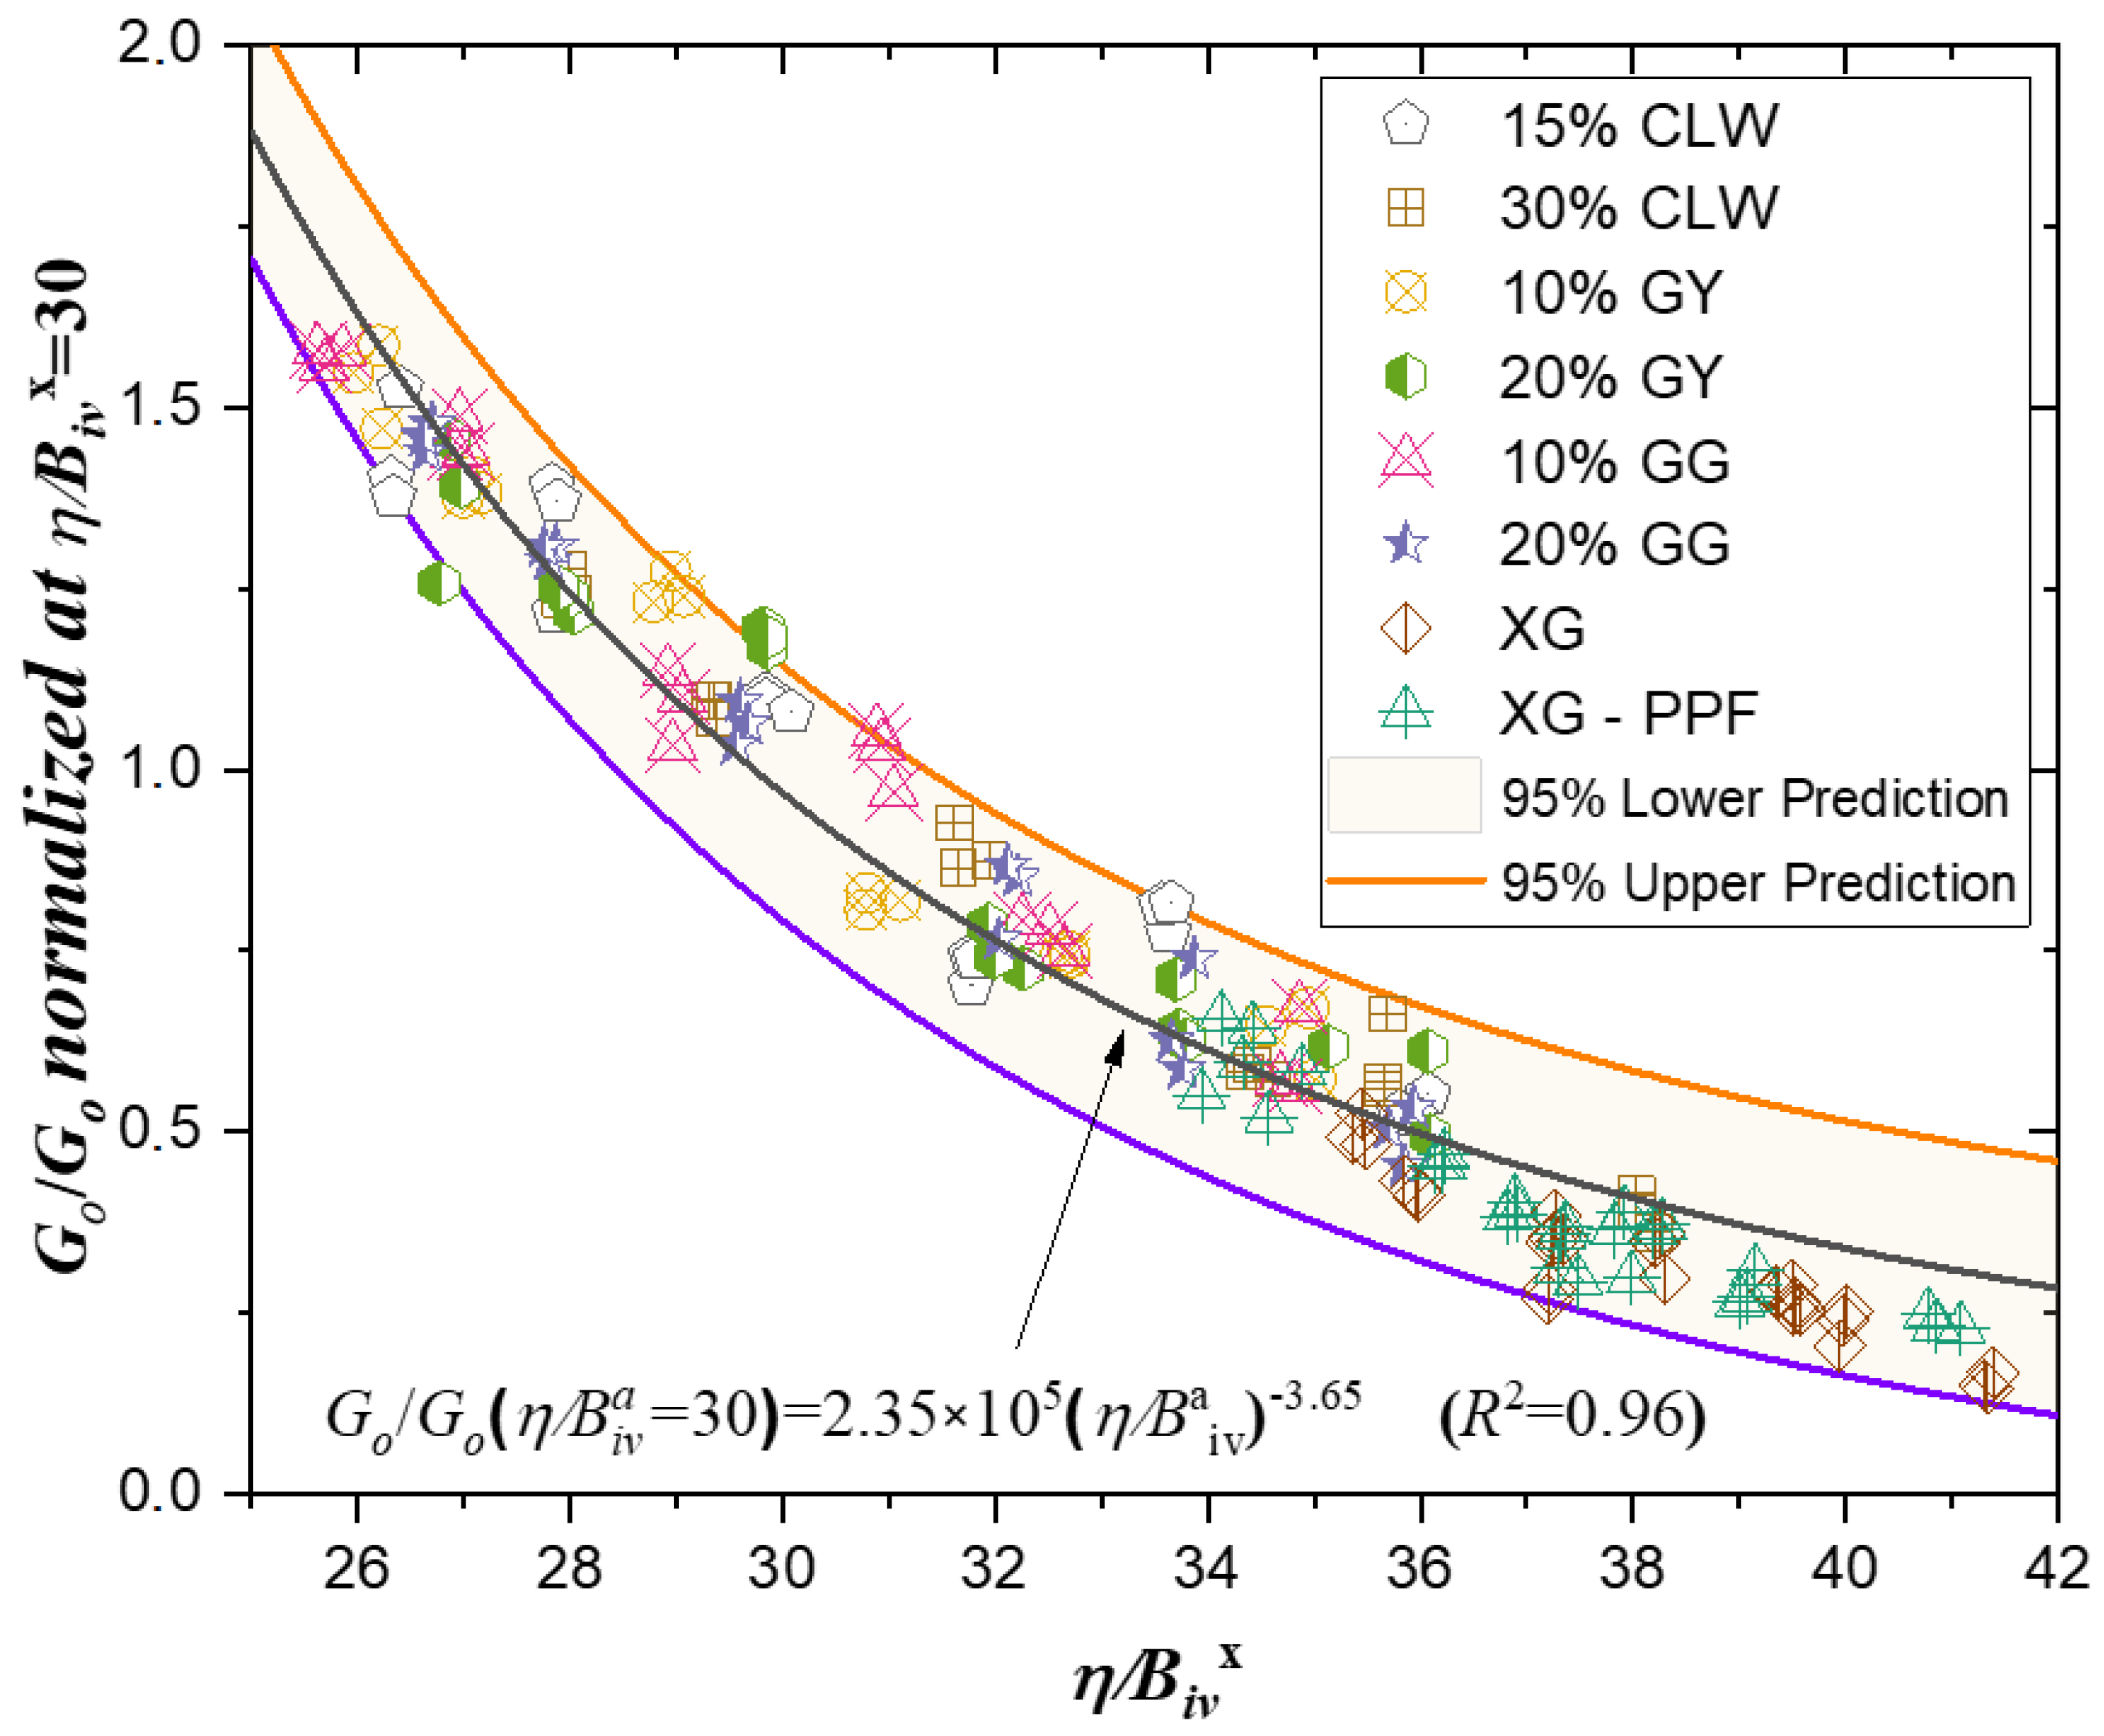
3.3. Normalization of the Strength and Stiffness of the Materials

The data normalization was applied to the eight analyzed mixtures. This procedure enables the construction of robust predictive models that eliminate inherent variations among individual samples, facilitating the identification of both general and specific trends [36]. Consoli et al. [46] demonstrated that it is possible to represent the behavior of dosage curves as a single trend by using the porosity/binder ratio as a parameter. In turn, Baldovino et al. [6] stated that normalization involves expressing the strength (qu) or stiffness (Go) as a ratio relative to the value the material would reach for a constant η / B i v x index, which must fall within the range defined by the curves fitted through a power function.
Equations (2) and (3) present the mathematical expressions that define the new normalized dosage curves for strength and stiffness. Figure 14 and Figure 15 display the graphical representation of the normalized data, along with a 95% prediction band for both unconfined compressive strength and initial stiffness.
q u q u n n / B i v x = 30 = 8.62 × 10 5 n / B i v x 4.02   R 2 = 0.94
G o G o n n / B i v x = 30 = 2.35 × 10 5 n / B i v x 3.65   R 2 = 0.96
To derive these equations, the normalized strength and stiffness values (Table 5) were calculated using a specific value of the index η / B i v x = ∇. A normalization range for ∇ between 25 and 42 was defined, applicable to both unconfined compressive strength (qu) and small-strain initial stiffness (Go). A value of ∇ = 30 was selected, as it yielded the highest coefficients of determination for both mechanical properties, with R2 = 0.94 for strength and R2 = 0.96 for stiffness, respectively.

3.4. Statistical Analysis of the Influence of Cement Mixed with Residues (CLW, GY, and GG), Xanthan Gum (XG) Addition, and XG–PPF Improvement on the Strength and Stiffness of Compacted Blends

The ANOVA results for qu and Go (Table A1, Table A2, Table A3, Table A4, Table A5, Table A6, Table A7, Table A8, Table A9 and Table A10, Appendix A) confirm that the statistical models were highly significant across most experimental conditions, with corrected R2 values ranging from 0.980 to 0.999. Cement content consistently emerged as the most influential factor, showing p-values < 0.001 in all cases. In blends containing construction residues such as CLW, GY, and GG (Table A1, Table A2, Table A3, Table A6, Table A7 and Table A8), both the residue type and the dry unit weight (γd) significantly affected the mechanical behavior, although interaction terms—particularly residue × γd—were generally non-significant, indicating largely additive effects rather than synergistic ones.
In the case of XG-treated blends (Table A4 and Table A9), both qu and Go were significantly influenced by XG dosage and compaction density. The interaction XG × γd was not significant in qu (p = 0.493) but approached significance in Go (p = 0.087), suggesting that stiffness may be more sensitive to the interaction between biopolymer content and compaction level. The ANOVA results for the XG–PPF mixtures (Table A5 and Table A10) indicate that PPF, XG, and compaction density significantly influence the treated soil’s strength (qu) and stiffness (Go) (p < 0.001). Interactions between factors were not significant, except for a slight trend in Go for the PPF × XG interaction (p = 0.090). This suggests a predominantly additive behavior. The models explain over 68% of the observed variability.
Interestingly, in the Go analysis for GG-based blends (Table A8), the interaction between GG and cement was statistically significant (p < 0.001), suggesting that this residue interacts differently with cement compared to CLW and GY. This could be attributed to GG’s granular morphology and pozzolanic potential, which may influence matrix continuity and stiffness development when combined with cement under high compaction conditions. In contrast, CLW- and GY-based blends showed no significant interaction terms with cement, highlighting a more predictable and homogeneous response.
In addition, the progression of qu values across increasing compaction densities supports the known influence of dry unit weight on mechanical performance. For example, in cement–CLW blends, UCS values rose from 345–370 kPa at 1.70 g/cm3 to over 650 kPa at 1.80 g/cm3 for the same binder dosage. Similarly, XG–PPF blends consistently showed higher strength and stiffness than their XG-only counterparts, suggesting that PPF improves internal friction and fiber–matrix bonding, even though its effect could not be isolated statistically. These observations align with previous findings that show improved post-peak behavior and energy absorption in biopolymer–fiber systems.
Taken together, the ANOVA models and experimental trends suggest that while cement remains the dominant factor governing strength and stiffness development, sustainable additives such as construction residues, XG, and PPF can play a strategic role in optimizing mechanical behavior.
The lack of significance in several interaction terms, such as residue × γd or XG × γd, may be attributed to the predominantly independent effects of each variable on the mechanical behavior of the soil. This suggests that, within the tested ranges, the influence of compaction density and binder content acts in an additive manner rather than modifying each other’s effects. In practical terms, this behavior simplifies the mix design process, as improvements in strength or stiffness can be achieved by adjusting individual factors without requiring complex synergistic tuning. However, it also highlights the need for further investigation under broader ranges or different environmental conditions, where non-linear or synergistic effects could become more pronounced.

4. Conclusions

The study confirms that the use of alternative binders such as CLW, GY, and GG can effectively improve the mechanical behavior of compacted clay soils. The results show that glass powder and limestone waste provided consistent improvements in strength and stiffness, especially at higher compaction densities. Recycled gypsum also contributed positively, though its effect was somewhat less pronounced in comparison.
Xanthan gum (XG) significantly enhanced both strength and stiffness, especially when combined with polypropylene fibers (PPFs). Although the fixed percentage of PPF prevented its inclusion in the statistical analysis due to zero degrees of freedom, the experimental evidence suggests that its presence contributes to better energy absorption and ductile response. The mixtures containing XG–PPF achieved the highest performance values, supported by a denser internal structure observed in the microstructural analysis.
The porosity/binder index (η/Biv) proved to be a useful tool for predicting mechanical performance. The relationships established between this index and the values of qu and Go showed high reliability, with determination coefficients close to or above 0.90. However, it was not possible to integrate XG-based mixtures into a single predictive trend due to their gel-like behavior, which differs from that of mineral binders. This limitation required a separate model to represent the response of those systems adequately.
The ANOVA supported the experimental trends, identifying cement content and compaction density as the most significant variables. While some interaction terms were not statistically relevant, the observed trends in strength and stiffness aligned with the model’s predictions. The analysis helped reinforce the importance of combining experimental and statistical methods to guide the development of efficient and sustainable soil stabilization alternatives.
Future research should explore the long-term durability and environmental performance of these alternative binders under field conditions, particularly in the presence of moisture fluctuations and aggressive chemical environments. Additionally, the optimization of XG–PPF ratios and the development of adaptable predictive models for biopolymer-based systems remain important challenges. Investigating the interaction of these binders with different soil types could also broaden their applicability in geotechnical engineering.

Author Contributions

Conceptualization, J.d.J.A.B. and Y.E.N.d.l.R.; methodology, J.d.J.A.B.; software, J.d.J.A.B.; validation, Y.E.N.d.l.R. and R.T.O.; formal analysis, J.d.J.A.B.; investigation, J.d.J.A.B.; resources, Y.E.N.d.l.R. and R.T.O.; data curation, J.d.J.A.B.; writing—original draft preparation, J.d.J.A.B.; writing—review and editing, Y.E.N.d.l.R.; visualization, J.d.J.A.B. and R.T.O.; supervision, J.d.J.A.B.; project administration, Y.E.N.d.l.R.; funding acquisition, Y.E.N.d.l.R. All authors have read and agreed to the published version of the manuscript.

Funding

The Fundación Universitaria Los Libertadores (Bogotá, Colombia) funded the APC.

Institutional Review Board Statement

Not applicable.

Informed Consent Statement

Not applicable.

Data Availability Statement

Data are contained within the article.

Acknowledgments

The authors thank the Universidad de Cartagena. The authors thank Luis Carlos Suarez Lopez for the writing and editing assistance.

Conflicts of Interest

The authors declare no conflicts of interest.

Abbreviations

XGXanthan Gum
PPFPolypropylene Fibers
PCPortland Cement
CLWCrushed Limestone Waste
GGGround Glass Powder
GYRecycled Gypsum
GsSpecific Gravity
CuUniformity Coefficient
CcCoefficient of Curvature
η/BivPorosity/Binder Index
UCSUnconfined Compressive Strength
UPVUltrasonic Pulse Velocity
SEMScanning Electron Microscopy
EDXEnergy Dispersive X-ray Spectroscopy
GoSmall-Strain Shear Modulus
LOILoss on Ignition
R2Coefficient of Determination
ANOVAAnalysis of Variance
BMBall Mill
USCSUnified Soil Classification System

Appendix A

Statistical ANOVA Analysis

This appendix presents the tables corresponding to the results of the statistical analysis of variance (ANOVA), applied to the unconfined compressive strength (qu) and small-strain stiffness (Go) obtained from the various compacted blends or geomaterials studied. This analysis allowed for the identification of statistically significant effects of the main factors—such as cement content, the addition of residues (CLW, GY, and GG), xanthan gum (XG), and the XG–PPF combination—as well as their second-order interactions on the mechanical properties evaluated. The tables detail the main effects and interactions, including the associated significance levels for each source of variation.
Table A1. ANOVA Table for the qu Results: Cement—CLW Blends.
SourceSum of SquaresDegrees of FreedomMean SquaresZp-ValueSignificance
(p-Value < 0.05)
Corrected Model8260101.000 *9917789.000198.823<0.001yes
Cement6266677.77816266677.7781357.566<0.001yes
CLW59049.000159049.00012.7920.001yes
γd 1647094.2222823547.111178.407<0.001yes
CLW * Cement4715.11114715.1111.0210.321no
Cement * γd 263902.8892131951.44428.585<0.001yes
CLW * γd 18662.00029331.0002.0210.153no
Error120018.889264616.111
Total36262040.00036
* Corrected R2 = 0.981.
Table A2. ANOVA Table for the qu Results: Cement—GY Blends.
SourceSum of SquaresDegrees of FreedomMean SquaresZp-ValueSignificance
(p-Value < 0.05)
Corrected Model12341565.028 *91371285.003228.894<0.001yes
Cement9013004.69419013004.6941504.446<0.001yes
GG194040.2501194040.25032.389<0.001yes
γd 2554313.16721277156.583213.182<0.001yes
GG * Cement15088.028115088.0282.5180.125no
Cement * γd 560159.3892280079.69446.751<0.001yes
GG * γd 4959.50022479.7500.4140.665no
Error155763.722265990.912
Total126762739.00036
* Corrected R2 = 0.980.
Table A3. ANOVA Table for the qu Results: Cement—GG Blends.
SourceSum of SquaresDegrees of FreedomMean SquaresZp-ValueSignificance
(p-Value < 0.05)
Corrected Model12341565.028 *91371285.003228.894<0.001yes
Cement9013004.69419013004.6941504.446<0.001yes
GG194040.2501194040.25032.389<0.001yes
γd 2554313.16721277156.583213.182<0.001yes
GG * Cement15088.028115088.0282.5180.125no
Cement * γd 560159.3892280079.69446.751<0.001yes
GG * γd 4959.50022479.7500.4140.665no
Error155763.722265990.912
Total126762739.00036
* Corrected R2 = 0.983.
Table A4. ANOVA Table for the qu Results: Effect of Xanthan Gum (XG) Addition.
SourceSum of SquaresDegrees of FreedomMean SquaresZp-ValueSignificance
(p-Value < 0.05)
Corrected Model194003429.667 *1117636675.423677.45705<0.001yes
XG195570.8889297785.4444420.3894308<0.001yes
γd6355590.22241588897.556331.30408<0.001yes
XG * γd16812.2222244203.0555560.876387180.493no
Error115101.3333244795.888889
Total322057252.00036
* Corrected R2 = 0.999.
Table A5. ANOVA Table for the qu Results: Improvement with XG–PPF.
SourceSum of SquaresDegrees of FreedomMean SquaresZp-ValueSignificance
(p-Value < 0.05)
Corrected Model62048663434.602 *173649921378.50615.739<0.001yes
PPF15047101801115047101801.12064.887<0.001yes
XG877254830624386274153.00918.915<0.001yes
γd 35523437203.463217761718601.73276.593<0.001yes
PPF * XG825268482.3522412634241.1761.7790.175no
PPF * γd504936189.2412252468094.6201.0890.341no
XG * γd 988520774.5374247130193.6341.0660.378no
PPF * XG * γd 386850677.870496712669.4680.4170.796no
Error20870669113.50090231896323.483
Total765501403557.000108
* Corrected R2 = 0.701.
Table A6. ANOVA Table for the Go Results: Cement—CLW Blends.
SourceSum of SquaresDegrees of FreedomMean SquaresZp-ValueSignificance
(p-Value < 0.05)
Corrected Model91530339.000 *910170037.667237.598<0.001yes
Cement75846681.000175846681.0001771.971<0.001yes
CLW761547.1111761547.11117.792<0.001yes
γd 13167074.88926583537.444153.808<0.001yes
CLW * Cement90801.778190801.7782.1210.157no
Cement * γd 1487786.0002743893.00017.379<0.001yes
CLW * γd 176448.222288224.1112.0610.148no
Error1112892.8892642803.573
Total815518152.00036
* Corrected R2 = 0.984.
Table A7. ANOVA Table for the Go Results: Cement—GY Blends.
SourceSum of SquaresDegrees of FreedomMean SquaresZp-ValueSignificance
(p-Value < 0.05)
Corrected Model137025039.194 *915225004.355192.521<0.001yes
Cement123643280.2501123643280.2501563.476<0.001yes
GY3742290.25013742290.25047.321<0.001yes
γd 8969138.66724484569.33356.708<0.001yes
GY * Cement397950.6941397950.6945.0320.034yes
Cement * γd 194216.667297108.3331.2280.309no
GY * γd 78162.667239081.3330.4940.616no
Error2056139.5562679082.291
Total1410895085.00036
* Corrected R2 = 0.984.
Table A8. ANOVA Table for the Go Results: Cement—GG Blends.
SourceSum of SquaresDegrees of FreedomMean SquaresZp-ValueSignificance
(p-Value < 0.05)
Corrected Model107912179.250 *911990242.139252.140<0.001yes
Cement80153224.694180153224.6941685.523<0.001yes
GG1296941.36111296941.36127.273<0.001yes
γd 24403275.389212201637.694256.585<0.001yes
GG * Cement1352181.36111352181.36128.435<0.001yes
Cement * γd 676057.0562338028.5287.1080.003yes
GG * γd30499.389215249.6940.3210.728no
Error1236401.7222647553.912
Total1044580611.00036
* Corrected R2 = 0.980.
Table A9. ANOVA Table for the Go Results: Effect of XG Addition.
SourceSum of SquaresDegrees of FreedomMean SquaresZp-ValueSignificance
(p-Value < 0.05)
Corrected Model161574489.889 *1114688589.991581.685<0.001yes
XG1107749.4072553874.703759.641<0.001yes
γd7675187.85241918796.963206.618<0.001yes
XG * γd85903.7037421475.925932.312550.087no
Error222880249286.666667
Total347310850.00036
* Corrected R2 = 0.996.
Table A10. ANOVA Table for the Go Results: Improvement with XG–PPF.
SourceSum of SquaresDegrees of FreedomMean SquaresZp-ValueSignificance
(p-Value < 0.05)
Corrected Model243202513905.083 *1714306030229.71114.389<0.001yes
PPF54202221480154202221480.00954.516<0.001yes
XG38570349880219285174940.11119.397<0.001yes
γd 135718650040.056267859325020.02868.252<0.001yes
PPF * XG4910631158.74122455315579.3702.4700.090no
PPF * γd 3306215997.79621653107998.8981.6630.195no
XG * γd 4222841336.55641055710334.1391.0620.380no
PPF * XG * γd 2271604011.7044567901002.9260.5710.684no
Error89482790697.83390994253229.976
Total2806399655105.000108
* Corrected R2 = 0.680.

References

  1. Modarres, A.; Nosoudy, Y. Clay stabilization using coal waste and lime—Technical and environmental impacts. Appl. Clay Sci. 2015, 116, 281–288. [Google Scholar] [CrossRef]
  2. Bazarbekova, A.; Shon, C.S.; Kissambinova, A.; Zhang, D.; Kim, J. Evaluating the Efficacy of Limestone Powder as a Partial Replacement of Ordinary Portland Cement for the Sustainable Stabilization of Sulfate-Bearing Saline Soil. Sustainability 2024, 16, 9224. [Google Scholar] [CrossRef]
  3. Wang, D.; Wang, Z.; Wang, H. Feasibility and performance assessment of novel framework for soil stabilization using multiple industrial wastes. Constr. Build. Mater. 2024, 449, 138228. [Google Scholar] [CrossRef]
  4. Perri, G.; De Rose, M.; Domitrović, J.; Vaiana, R. CO2 impact analysis for road embankment construction: Comparison of lignin and lime soil stabilization treatments. Sustainability 2023, 15, 1912. [Google Scholar] [CrossRef]
  5. Vukićević, M.; Marjanović, M.; Pujević, V.; Jocković, S. The alternatives to traditional materials for subsoil stabilization and embankments. Materials 2019, 12, 3018. [Google Scholar] [CrossRef]
  6. Baldovino, J.D.J.A.; Nuñez de la Rosa, Y.E.; Calabokis, O.P. Effect of porosity/binder index on strength, stiffness and microstructure of cemented clay: The impact of sustainable development geomaterials. Materials 2024, 17, 921. [Google Scholar] [CrossRef] [PubMed]
  7. Pastor, J.L.; Gutierrez, E.; Cano, M.; Tomás, R.; Riquelme, A.; Hino, T. Embankment construction with limestone powder waste: From laboratory to full-scale implementation. Transp. Geotech. 2025, 50, 101476. [Google Scholar] [CrossRef]
  8. Cabalar, A.F.; Omar, R.A. Stabilizing a silt using waste limestone powder. Bull. Eng. Geol. Environ. 2023, 82, 300. [Google Scholar] [CrossRef]
  9. Al-Khafaji, R.; Dulaimi, A.; Jafer, H.; Mashaan, N.S.; Qaidi, S.; Obaid, Z.S.; Jwaida, Z. Stabilization of Soft Soil by a Sustainable Binder Comprises Ground Granulated Blast Slag (GGBS) and Cement Kiln Dust (CKD). Recycling 2023, 8, 10. [Google Scholar] [CrossRef]
  10. Rouaiguia, A.; El Aal, A.K.A. Enhancement of the Geotechnical Properties of Soils Using Marble and Lime Powders, Guelma City, Algeria. Geotech. Geol. Eng. 2023, 38, 5649–5665. [Google Scholar] [CrossRef]
  11. Núñez, V.; Lotero, A.; Bastos, C.A.; Sargent, P.; Consoli, N.C. Mechanical and microstructure analysis of mass-stabilized organic clay thermally cured using a ternary binder. Acta Geotech. 2024, 19, 741–762. [Google Scholar] [CrossRef]
  12. Román Martínez, C.; Nuñez de la Rosa, Y.E.; Estrada Luna, D.; Baldovino, J.A.; Jordi Bruschi, G. Strength, Stiffness, and Microstructure of Stabilized Marine Clay-Crushed Limestone Waste Blends: Insight on Characterization through Porosity-to-Cement Index. Materials 2023, 16, 4983. [Google Scholar] [CrossRef] [PubMed]
  13. Javed, S.A.; Chakraborty, S. Effects of waste glass powder on subgrade soil improvement. World Sci. News 2020, 144, 30–42. [Google Scholar]
  14. Jalal, F.E.; Zahid, A.; Iqbal, M.; Naseem, A.; Nabil, M. Sustainable use of soda lime glass powder (SLGP) in expansive soil stabilization. Case Stud. Constr. Mater. 2020, 17, e01559. [Google Scholar] [CrossRef]
  15. Lai, Z.; Chen, Y. Enhancing the mechanical and environmental performance of solidified soil using construction waste and glass micro-powder. Heliyon 2024, 10, e40187. [Google Scholar] [CrossRef] [PubMed]
  16. Akoğuz, H. Performance evaluation of waste glass in soil improvement: Influence of particle size of waste glass on mechanical, microstructural, and durability characteristics. Case Stud. Constr. Mater. 2025, 22, e04241. [Google Scholar] [CrossRef]
  17. Niyomukiza, J.B.; Eisazadeh, A.; Akamumpa, J.; Kiwanuka, M.; Lukwago, A.; Tiboti, P. Use of waste glass powder in improving the properties of expansive clay soils. Glob. NEST Int. J. Glob. NEST J 2023, 25, 139–145. [Google Scholar] [CrossRef]
  18. Ordoñez Muñoz, Y.; Villota-Mora, A.J.E.; Perretto, F.; dos Santos Izzo, R.L. Eco-friendly stabilization of clayey soil with waste glass powder-based geopolymer. Geomech. Geoengin. 2024, 1–30. [Google Scholar] [CrossRef]
  19. Abdolvand, Y.; Sadeghiamirshahidi, M. Soil stabilization with gypsum: A review. J. Rock Mech. Geotech. Eng. 2024, 16, 5278–5296. [Google Scholar] [CrossRef]
  20. Wu, J.; Liu, L.; Deng, Y.; Zhang, G.; Zhou, A.; Xiao, H. Use of recycled gypsum in the cement-based stabilization of very soft clays and its micro-mechanism. J. Rock Mech. Geotech. Eng. 2022, 14, 909–921. [Google Scholar] [CrossRef]
  21. Pu, S.; Zhu, Z.; Huo, W. Evaluation of engineering properties and environmental effect of recycled gypsum stabilized soil in geotechnical engineering: A comprehensive review. Resour. Conserv. Recycl. 2021, 174, 105780. [Google Scholar] [CrossRef]
  22. Ahmed, A.; Ugai, K. Environmental effects on durability of soil stabilized with recycled gypsum. Cold Reg. Sci. Technol. 2011, 66, 84–92. [Google Scholar] [CrossRef]
  23. Chang, I.; Im, J.; Prasidhi, A.K.; Cho, G.C. Effects of Xanthan gum biopolymer on soil strengthening. Constr. Build. Mater. 2015, 74, 65–72. [Google Scholar] [CrossRef]
  24. Abbasi, F.; Choobbasti, A.J.; Roushan, K. Advanced stabilization of clayey sand using xanthan gum: Insights from multiscale evaluation and ultrasonic pulse velocity analysis. Results Eng. 2025, 25, 104419. [Google Scholar] [CrossRef]
  25. Baldovino, J.d.J.A.; de la Rosa, Y.E.N.; Calabokis, O.P.; Vergara, J.A.A.; López, L.C.S. Geotechnical Behavior of Xanthan Gum-Stabilized Clay Reinforced with Polypropylene Fibers. Polymers 2025, 17, 363. [Google Scholar] [CrossRef] [PubMed]
  26. Baldovino, J.d.J.A.; Palma Calabokis, O.; Saba, M. From Bibliometric Analysis to Experimental Validation: Bibliometric and Literature Review of Four Cementing Agents in Soil Stabilization with Experimental Focus on Xanthan Gum. Sustainability 2024, 16, 5363. [Google Scholar] [CrossRef]
  27. Acuña, C.; Betancur, J.; Baldovino, J.A.; Barboza, G.; Saba, M. Analysis of Dispersivity in Marine Clays of Cartagena de Indias, Colombia. Geosciences 2023, 13, 162. [Google Scholar] [CrossRef]
  28. ASTM D2487-11; Standard Practice for Classification of Soils for Engineering Purposes (Unified Soil Classification System). ASTM Stand. Guide; ASTM International: West Conshohocken, PA, USA, 2017; p. 11.
  29. Skempton, A.W. The Colloidal “Activity” of Clays. In Proceedings of the 3rd International Conference on Soil Mechanics 1, Zurich, Switzerland, 16–27 August 1953; pp. 57–61. [Google Scholar]
  30. ASTM D854; Standard Test Methods for Specific Gravity of Soil Solids by Water Pycnometer. ASTM International: West Conshohocken, PA, USA, 2014.
  31. ASTM 4318; Standard Test Methods for Liquid Limit, Plastic Limit and Plasticity Index of Soils. ASTM International: West Conshohocken, PA, USA, 2010.
  32. ASTM D1557-12; Standard Test Methods for Laboratory Compaction Characteristics of Soil Using Modified Effort (56,000 ft-lbf/ft3 or 2,700 kN-m/m3). ASTM International: West Conshohocken, PA, USA, 2012.
  33. Sulaiman, H.; Taha, M.R.; Abd Rahman, N.; Mohd Taib, A. Performance of Soil Stabilized with Biopolymer Materials—Xanthan Gum and Guar Gum. Phys. Chem. Earth Parts A/B/C 2022, 128, 103276. [Google Scholar] [CrossRef]
  34. Ni, J.; Li, S.S.; Ma, L.; Geng, X.Y. Performance of soils enhanced with eco-friendly biopolymers in unconfined compression strength tests and fatigue loading tests. Constr. Build. Mater. 2020, 263, 120039. [Google Scholar] [CrossRef]
  35. Baldovino, J.A.; Moreira, E.B.; Teixeira, W.; Izzo, R.L.; Rose, J.L. Effects of lime addition on geotechnical properties of sedimentary soil in Curitiba, Brazil. J. Rock Mech. Geotech. Eng. 2018, 10, 188–194. [Google Scholar] [CrossRef]
  36. López, L.C.S.; Vergara, J.A.A.; de la Rosa, Y.E.N.; Arrieta, A.; Baldovino, J.d.J.A. Effect of Grain Size and Porosity/Binder Index on the Unconfined Compressive Strength, Stiffness and Microstructure of Cemented Colombian Sands. Materials 2024, 17, 5193. [Google Scholar] [CrossRef] [PubMed]
  37. ASTM C597-22; Standard Test Method for Ultrasonic Pulse Velocity Through Concrete. ASTM International: West Conshohocken, PA, USA, 2022; pp. 1–4.
  38. ASTM D 2166-03; Standard Test Method for Unconfined Compressive Strength of Cohesive Soil 1. ASTM International: West Conshohocken, PA, USA, 2003; p. 4.
  39. Consoli, N.C.; Foppa, D.; Festugato, L.; Heineck, K.S. Key Parameters for Strength Control of Artificially Cemented Soils. J. Geotech. Geoenviron. Eng. 2007, 133, 197–205. [Google Scholar] [CrossRef]
  40. Scheuermann Filho, H.C.; Dias Miguel, G.; Cesar Consoli, N. Porosity/Cement Index over a Wide Range of Porosities and Cement Contents. J. Mater. Civ. Eng. 2022, 34, 06021011. [Google Scholar] [CrossRef]
  41. Consoli, N.C.; da Silva Lopes, L., Jr.; Heineck, K.S. Key parameters for the strength control of lime stabilized soils. J. Mater. Civ. Eng. 2009, 21, 210–216. [Google Scholar] [CrossRef]
  42. Hanafi, M.; Javed, I.; Ekinci, A. Evaluating the strength, durability and porosity characteristics of alluvial clay stabilized with marble dust as a sustainable binder. Results Eng. 2025, 25, 103978. [Google Scholar] [CrossRef]
  43. Diambra, A.; Ibraim, E.; Peccin, A.; Consoli, N.C.; Festugato, L. Theoretical Derivation of Artificially Cemented Granular Soil Strength. J. Geotech. Geoenviron. Eng. 2017, 143, 04017003. [Google Scholar] [CrossRef]
  44. Diambra, A.; Festugato, L.; Ibraim, E.; da Silva, A.P.; Consoli, N.C. Modelling tensile/compressive strength ratio of artificially cemented clean sand. Soils Found. 2018, 58, 199–211. [Google Scholar] [CrossRef]
  45. Festugato, L.; da Silva, A.P.; Diambra, A.; Consoli, N.C.; Ibraim, E. Modelling tensile/compressive strength ratio of fibre reinforced cemented soils. Geotext. Geomembr. 2018, 46, 155–165. [Google Scholar] [CrossRef]
  46. Consoli, N.C.; Marques, S.F.V.; Floss, M.F.; Festugato, L. Broad-Spectrum Empirical Correlation Determining Tensile and Compressive Strength of Cement-Bonded Clean Granular Soils. J. Mater. Civ. Eng. 2017, 29, 06017004. [Google Scholar] [CrossRef]
Figure 1. Grain size distribution curve of the studied soil and image of the clay [6].
Applsci 15 05895 g001
Figure 2. (a) Microstructure of soil sample [6]. (b) X-ray diffraction (XRD) of the soil sample.
Applsci 15 05895 g002
Figure 3. CLW: (a) processed residue; (b) CLW morphology recorded in the SEM analysis [6].
Applsci 15 05895 g003
Figure 4. GG (a) processed material; (b) GY morphology recorded in the SEM analysis [6].
Applsci 15 05895 g004
Figure 5. GY: (a) processed material; (b) GY morphology recorded in the SEM analysis [6].
Applsci 15 05895 g005
Figure 6. XG: (a) XG in powder form; (b) XG morphology captured through SEM analysis [25].
Applsci 15 05895 g006
Figure 7. (a) Cement Portland Type III [6] (b) PPF [25].
Applsci 15 05895 g007
Figure 8. Test set-up of stiffness and unconfined compressive strength.
Applsci 15 05895 g008
Figure 9. UCS of eight stabilized soil mixtures compacted at optimal dry density (γd = 17.6 kN/m3). The mixtures include construction residues (CLW, GY, GG) with 3% and 6% cement, XG, and XG–PPF.
Applsci 15 05895 g009
Figure 10. Stiffness of eight stabilized soil mixtures compacted at optimal dry density (γd = 17.6 kN/m3). The mixtures include construction residues (CLW, GY, GG) with 3% and 6% cement, XG, and XG–PPF.
Applsci 15 05895 g010
Figure 11. The direct relationship between the UCS and stiffness.
Applsci 15 05895 g011
Figure 12. Influence of the porosity/cement ratio on the unconfined compressive strength of the novel geomaterials after 28 days of curing.
Applsci 15 05895 g012
Figure 13. Effects of the porosity/cement index on the unconfined compressive strength of the new geomaterials cured after 28 days.
Applsci 15 05895 g013
Figure 14. Normalization of unconfined compressive strength using the porosity/binder index.
Applsci 15 05895 g014
Figure 15. Normalization of stiffness using the porosity/binder index.
Applsci 15 05895 g015
Table 3. Chemical composition of the soil sample, cement, CLW, GG and GY [6].
CompoundChemical Contents by Weight (%)
CementCLWGGGY
CaO62.772.47.150.5
MgO3.82.12.2-
SiO221.19.078.20.4
Al2O35.21.32.2-
Fe2O32.60.90.190.3
SO33.5--37.6
Na2O0.1-9.31.3
MnO0.214.3--
P2O5-72.4-1.9
LOI0.82.10.78.0
Table 4. Mixed proportion design for compacted blends of soil with cement (PC) and residues (CLW, GY, and GG), XG, and XG–PPF cured for 28 days.
MixWeight (%)MoldingNumber of Samples
SoilCementCLWGGGYXGPPFγd (kN/m3)
Soil–PC–CLW1003, 615----17, 17.6, 1818
1003, 630----17, 17.6, 1818
Soil–PC–GG1003, 6-10---17, 17.6, 1818
1003, 6-20---17, 17.6, 1818
Soil–PC–GY1003, 6--10--17, 17.6, 1818
1003, 6--20--17, 17.6, 1818
Soil–XG100----1, 3, 5-16.5, 17, 17.627
Soil–XG-PPF100----1, 3, 50.516.5, 17, 17.627
Table 5. Normalization data.
Mix Normalization   Index   ( ) For Normalization
q u n G o n q u k P a G o M P a
Soil–cement–15%CLW n / B i v 0.28 = 30 n / B i v 0.28 = 30 975.044692.11
Soil–cement–30%CLW n / B i v 0.28 = 30 n / B i v 0.28 = 30 1122.565426.83
Soil–cement–10%GG n / B i v 0.28 = 30 n / B i v 0.28 = 30 1320.015300.33
Soil–cement–20%GG n / B i v 0.28 = 30 n / B i v 0.28 = 30 1553.166515.44
Soil–cement–10%GY n / B i v 0.28 = 30 n / B i v 0.28 = 30 1516.834523.20
Soil–cement–20%GY n / B i v 0.28 = 30 n / B i v 0.28 = 30 1832.775471.41
Soil–XG n / C i v 0.02 = 30 n / C i v 0.02 = 30 2165.624118.58
Soil–XG-PPF n / C i v 0.03 = 30 n / C i v 0.03 = 30 2034.724345.75
Disclaimer/Publisher’s Note: The statements, opinions and data contained in all publications are solely those of the individual author(s) and contributor(s) and not of MDPI and/or the editor(s). MDPI and/or the editor(s) disclaim responsibility for any injury to people or property resulting from any ideas, methods, instructions or products referred to in the content.

