Next Article in Journal
Technology–Economy–Policy: Biochar in the Low-Carbon Energy Transition—A Review
Next Article in Special Issue
Effect of Microbially Induced Calcium Carbonate Precipitation on Swelling and Performance Degradation of Expansive Soil
Previous Article in Journal
Assessment of Pesticide Contamination of Groundwater from Titu-Sarata Plain, Romania
Previous Article in Special Issue
A Study on the Creep Characteristics of Gassy Clay Mixed with Silt
 
 
Due to scheduled maintenance work on our database systems, there may be short service disruptions on this website between 10:00 and 11:00 CEST on June 14th.
Article

Optimization of Exposed Aggregate Concrete Mix Proportions for High Skid Resistance and Noise Reduction Performance

1
School of Traffic and Transportation Engineering, Changsha University of Science and Technology, No. 2-960 Wanjiali Rd. (South), Yuhua District, Changsha 410114, China
2
Department of Railway Engineering, School of Civil Engineering, Central South University, 68 South Shaoshan Road, Changsha 410075, China
*
Author to whom correspondence should be addressed.
Appl. Sci. 2025, 15(11), 5881; https://doi.org/10.3390/app15115881
Submission received: 18 April 2025 / Revised: 14 May 2025 / Accepted: 22 May 2025 / Published: 23 May 2025

Abstract

:
Conventional cement concrete pavements often suffer from rapid skid resistance degradation and excessive traffic noise, necessitating effective solutions. This study investigates exposed aggregate concrete (EAC) through orthogonal experimental methods to evaluate the effects of four mix design parameters—water–binder ratio, sand ratio, coarse aggregate volume ratio, and proportion of aggregates > 9.5 mm—on surface texture characteristics, skid resistance and noise reduction (SRNR) performance, and mechanical properties. The optimal EAC mix proportions were developed, and the correlations between surface texture characteristics and SRNR performance were established. Results indicate that the proportion of aggregates > 9.5 mm significantly influences surface texture characteristics and SRNR performance. The optimal mix proportions (water–binder ratio: 0.43, sand ratio: 31%, coarse aggregate volume ratio: 42%, and proportion of aggregates > 9.5 mm: 50%) exhibited superior mechanical properties, achieving a 31.5% increase in pendulum value and a 6.48 dB reduction in tire/surface noise compared to grooved conventional concrete. The noise reduction frequency range is mainly concentrated in the mid-high frequency range of 1.5~4.0 kHz, which is more sensitive to the human ear. High correlations were observed between the surface texture characteristics and SRNR performance. Specifically, noise value decreased progressively with increasing exposed aggregate depth, while the pendulum value exhibited a trend of initial decrease, followed by an increase and subsequent decrease in response to the elevated exposed aggregate area ratio. Compared to traditional cement concrete pavements, the optimized EAC, while maintaining mechanical properties, exhibits superior SRNR performance, providing a valuable reference for the construction of high SRNR cement concrete pavements.

1. Introduction

To ensure adequate skid resistance of cement concrete pavements, conventional surface treatments such as grooving and brooming are commonly employed; however, these traditional methods exhibit functional deficiencies, including rapid skid resistance degradation and excessive traffic noise, thereby compromising driving safety and comfort [1,2]. Relevant studies indicate that when the sideway force coefficient (SFC) of cement pavements drops below 45, the incidence of rainy-day traffic accidents increases by over 30% compared to clear weather conditions [3,4], while tire/pavement noise has emerged as a critical control factor in environmental noise management [5,6,7]. Against this background, as requirements for driving safety enhancement and road traffic noise reduction continue to escalate [8,9], SRNR cement concrete pavements have gained increasing attention in road engineering. Among these, EAC pavements, owing to their asphalt-like surface macrotexture, demonstrate superior SRNR performance, making them one of the preferred solutions for high SRNR performance cement concrete pavements.
Cai et al. [10,11] analyzed the relationship between the mortar layer thickness and the exposed aggregate depth in EAC, and established a predictive model between the mortar layer thickness and the mortar sweeping amount. It was found that as the mortar layer thickness increased, the exposed aggregate depth continuously decreased, while the mortar removal volume increased with the elevated sum of the mortar layer thickness and the exposed aggregate depth. Wei [12] compared the noise reduction performance of asphalt pavements, EAC pavements, and conventional cement concrete pavements using the tire drop test method, demonstrating that EAC pavements exhibited the highest noise attenuation efficiency. Kim et al. [13] experimentally demonstrated that under identical surface degradation conditions, EAC incorporating 8 mm and 10 mm coarse aggregates exhibited 43% and 36% lower wear depths, respectively, compared to grooved cement concrete. Yan et al. [14] compared the road performance of EAC with different sand ratios and different coarse aggregate gradations, and the best road performance was achieved when the sand ratio was 20% and the ratio of 4.75~9.5 mm to 9.5~13.2 mm coarse aggregate was 2:1. Chhay et al. [15] constructed a 3D model of EAC surface texture through digital image processing technology, confirming that this technology can effectively characterize the surface texture of EAC. Yang et al. [16] investigated the long-term skid resistance of EAC, concluding that the larger the particle size of the aggregate, the better the long-term skid resistance. Chen et al. [17] investigated the surface treatment process for EAC, establishing that the optimal spraying time and dosage of the exposed aggregate agent range from 30~90 min and 200~250 g/m2, respectively. Hu et al. [18] investigated the effects of macro texture depth (MTD) on surface roughness and skid resistance performance of EAC, revealing that EAC achieves optimal skid resistance when MTD is controlled within the 0.72~0.80 mm range. Rith et al. [19] employed pavement texture parameters and aggregate polishing resistance to characterize the long-term skid resistance performance of EAC and established a predictive model for its long-term skid resistance. Han et al. [20] conducted noise spectrum analysis and found that EAC pavements exhibit a significant reduction in noise value above 1.25 kHz compared to plain concrete pavements. Zhao et al. [21] investigated the relationship between different coarse aggregate exposure postures and the long-term skid resistance of EAC, pointing out that the coarse aggregate with flat-lying or inclined exposure has better long-term skid resistance. Hablovicova et al. [22] utilized the Close Proximity method (CPX) to compare the noise data of EAC (maximum aggregate size: 8 mm) and SMA-11 asphalt pavements at various time intervals, revealing that both pavement types exhibited similar noise levels and followed a logarithmic variation pattern over their lifetime.
In summary, current research on EAC has predominantly focused on the impacts of surface treatment techniques, texture characteristics, coarse aggregate composition, and exposure patterns on its SRNR performance, while studies concerning the formation mechanisms of surface texture characteristics and optimized mix design that comprehensively considers factors including water–binder ratio, sand ratio, coarse aggregate composition, and dosage have remained comparatively scarce in existing literature. To address this gap, the present study employed an orthogonal experimental method to prepare EAC samples with varying mix proportions and systematically investigated the effects of four mix design parameters—water–binder ratio, sand ratio, coarse aggregate volume ratio, and proportion of aggregates > 9.5 mm—on surface texture characteristics, SRNR performance, and mechanical properties. Based on these analyses, the optimal mix proportions for EAC with enhanced SRNR capabilities are proposed, thereby providing a scientific basis for the application of EAC with high SRNR performance in pavement engineering.

2. Materials and Methods

2.1. Raw Materials

The experimental materials included ordinary Portland cement (OPC) of grade P·O 42.5, with a density of 3110 kg/m3 and a specific surface area of 3360 cm2/g. The fine aggregate was river sand classified as Zone II medium sand with a maximum particle size of 2.36 mm, a fineness modulus of 2.48, and an apparent density of 2655 kg/m3. The coarse aggregate comprised basalt gravel in two size fractions: 4.75–9.5 mm and 9.5–16 mm, with an apparent density of 2930 kg/m3, a crushing value of 10.7%, an elongated/flaky particle content of 1.2%, and a Los Angeles abrasion value of 11.8%. The exposed aggregate agent employed was MT-308, a hydroxy carboxylic acid-based organic compound with a pH of 8.5 that exhibits a black, viscous liquid appearance. Its mechanism involves penetrating the concrete matrix to encapsulate cement particles, thereby inhibiting their hydration reaction with water. This action effectively delays the final setting time of the concrete surface by 12~24 h. Tap water was used for mixing. All materials satisfied the technical requirements stipulated in the Technical Guidelines for Construction of Highway Cement Concrete Pavements (JTG/T F30-2014) [23], confirming their suitability for the preparation of EAC.

2.2. Orthogonal Experimental Design Scheme

The surface texture characteristics of EAC are intrinsically linked to coarse aggregate content and gradation. Therefore, two mix design parameters—coarse aggregate volume ratio and proportion of aggregates > 9.5 mm—were selected to reflect coarse aggregate dosage and gradation, alongside two conventional parameters (water–binder ratio and sand ratio), forming four factors in the orthogonal experimental design. Based on existing research on the mix proportion design of EAC [24,25,26,27,28] and technical requirements specified in the Specification for Mix Proportion Design of Ordinary Concrete (JGJ 55-2011) [29], the appropriate ranges for each parameter were determined as follows: water–binder ratio 0.40~0.46, sand ratio 28~34%, coarse aggregate volume ratio 40~44%, and proportion of aggregates > 9.5 mm 30~70%. After comprehensive consideration of factors including specimen fabrication costs, number of experiments, parameter range settings, and the three-level experimental design which facilitates inflection point analysis, each factor was assigned three levels based on the aforementioned ranges, and an L9(3⁴) orthogonal array was adopted to organize laboratory tests for physical and mechanical properties. The factor-level assignments are detailed in Table 1, with the Orthogonal test scheme provided in Table 2. Here, Factors A, B, C, and D correspond to water–binder ratio, sand ratio, coarse aggregate volume ratio, and proportion of aggregates > 9.5 mm.
To rationally analyze the surface texture characteristics, SRNR performance, and mechanical properties of EAC, two indicators—exposed aggregate depth and exposed aggregate area ratio—were used to characterize the surface texture. The pendulum value and noise value were employed to evaluate the SRNR performance, respectively. The 28-day compressive and flexural strengths were used to assess the mechanical properties of EAC. Therefore, a total of six performance indicators were tested to optimize the EAC mix proportion. To minimize potential errors during EAC preparation and testing, three parallel specimens were fabricated for each mix proportion in the orthogonal experiment, resulting in 27 specimens in total. The corresponding experimental results for each group were determined as the average value of the three specimens. The experimental error was controlled using the absolute error percentage of three parallel data relative to the median value. For exposed aggregate depth and area ratio, an absolute error threshold of 5% was established: when the error exceeded 5%, the median value was retained as the valid measurement if only one datum exceeded the threshold, whereas the entire specimen group was invalidated if both data exceeded the threshold. Similarly, for the pendulum value and noise value, the absolute error tolerance was adjusted to 3%, while the tolerance for 28-day compressive and flexural strength tests was set at 15%.

2.3. Specimen Preparation and Test Methods

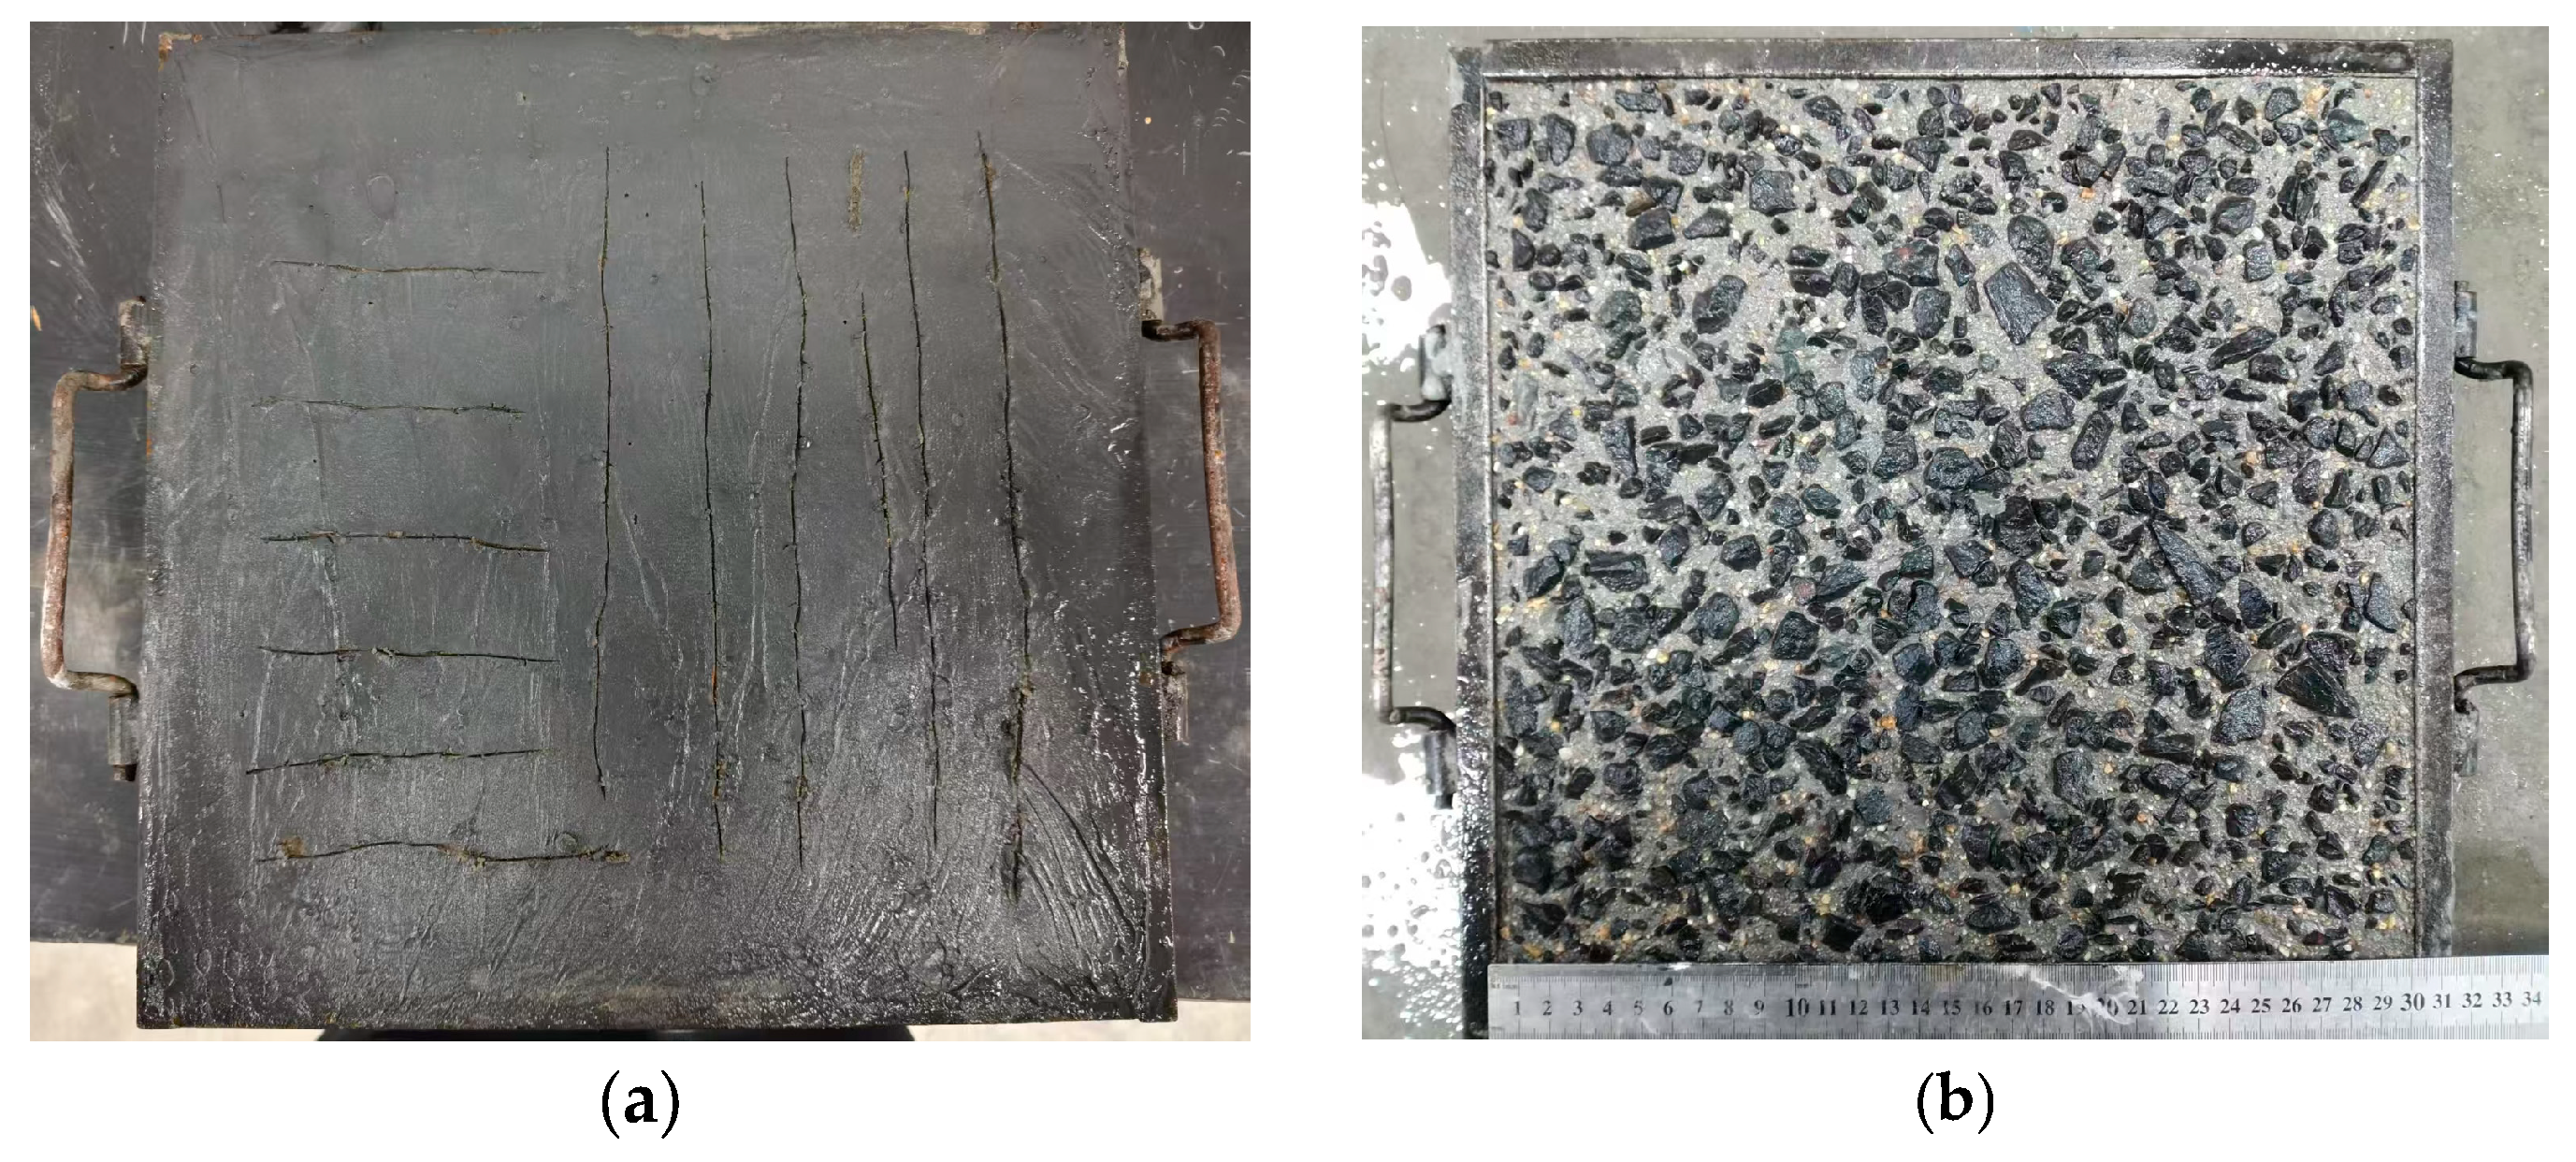
2.3.1. Specimen Preparation

EAC slab specimens were prepared using 300 mm × 300 mm × 50 mm rutting plate molds through the following procedures: (1) fresh concrete was batched, mixed, cast into molds, vibrated, and screeded, then left undisturbed at ambient temperature; (2) after surface water film disappearance, exposed aggregate agent was uniformly sprayed onto specimen surfaces followed by plastic film covering to prevent evaporation; (3) specimens were cured in a constant temperature chamber maintained at 20 °C and relative humidity >90%; (4) following a 18-h curing period, pressure water jets and brushes were applied to expose coarse aggregates; (5) post-washing specimens were transferred to standard curing chambers at 20 ± 5 °C and relative humidity > 95% for moisture retention until designated testing ages for physico-mechanical evaluations. The completed EAC slabs are illustrated in Figure 1.

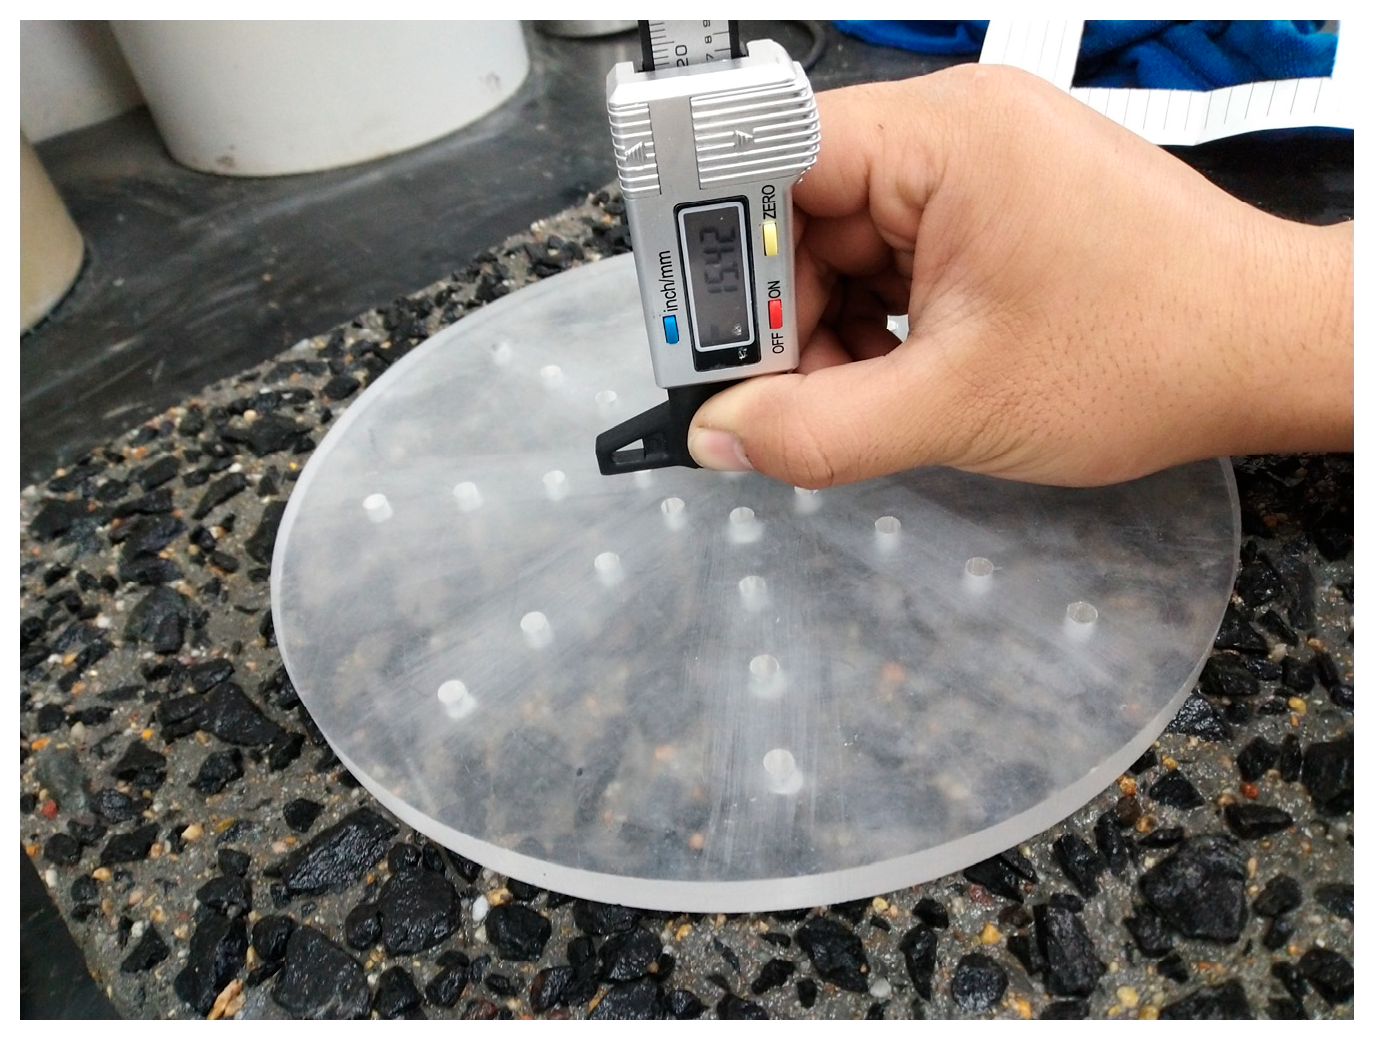
2.3.2. Exposed Aggregate Depth Test

Exposed aggregate depth refers to the height of exposed coarse aggregates on the surface of EAC, serving as a critical indicator for evaluating the exposing effect. According to relevant literature [30], the optimal exposed aggregate depth should be controlled within the range of 2~3 mm. The disc method [17] was employed to measure the exposed aggregate depth. During testing, a transparent plexiglass disc with circular holes was placed on the surface of the EAC slab. A measurement probe was vertically inserted into the hole. If the reading on the probe exceeded the disc thickness, the measurement was considered valid. Conversely, if the reading was less than the disk thickness, it indicated that the measurement point was located at a protrusion of coarse aggregates, rendering the data invalid. Based on this method, ten random test positions were uniformly selected across the disk surface, with the mean of these ten measurements serving as a single valid measurement. The aforementioned steps were repeated five times to obtain five valid measurements, and the coefficient of variation (CV) of these five values was calculated. When CV exceeded 0.05, the disk was repositioned for additional sampling; otherwise, the exposed aggregate depth was obtained by subtracting the disk thickness from the valid mean measurement. The specific testing setup is illustrated in Figure 2.

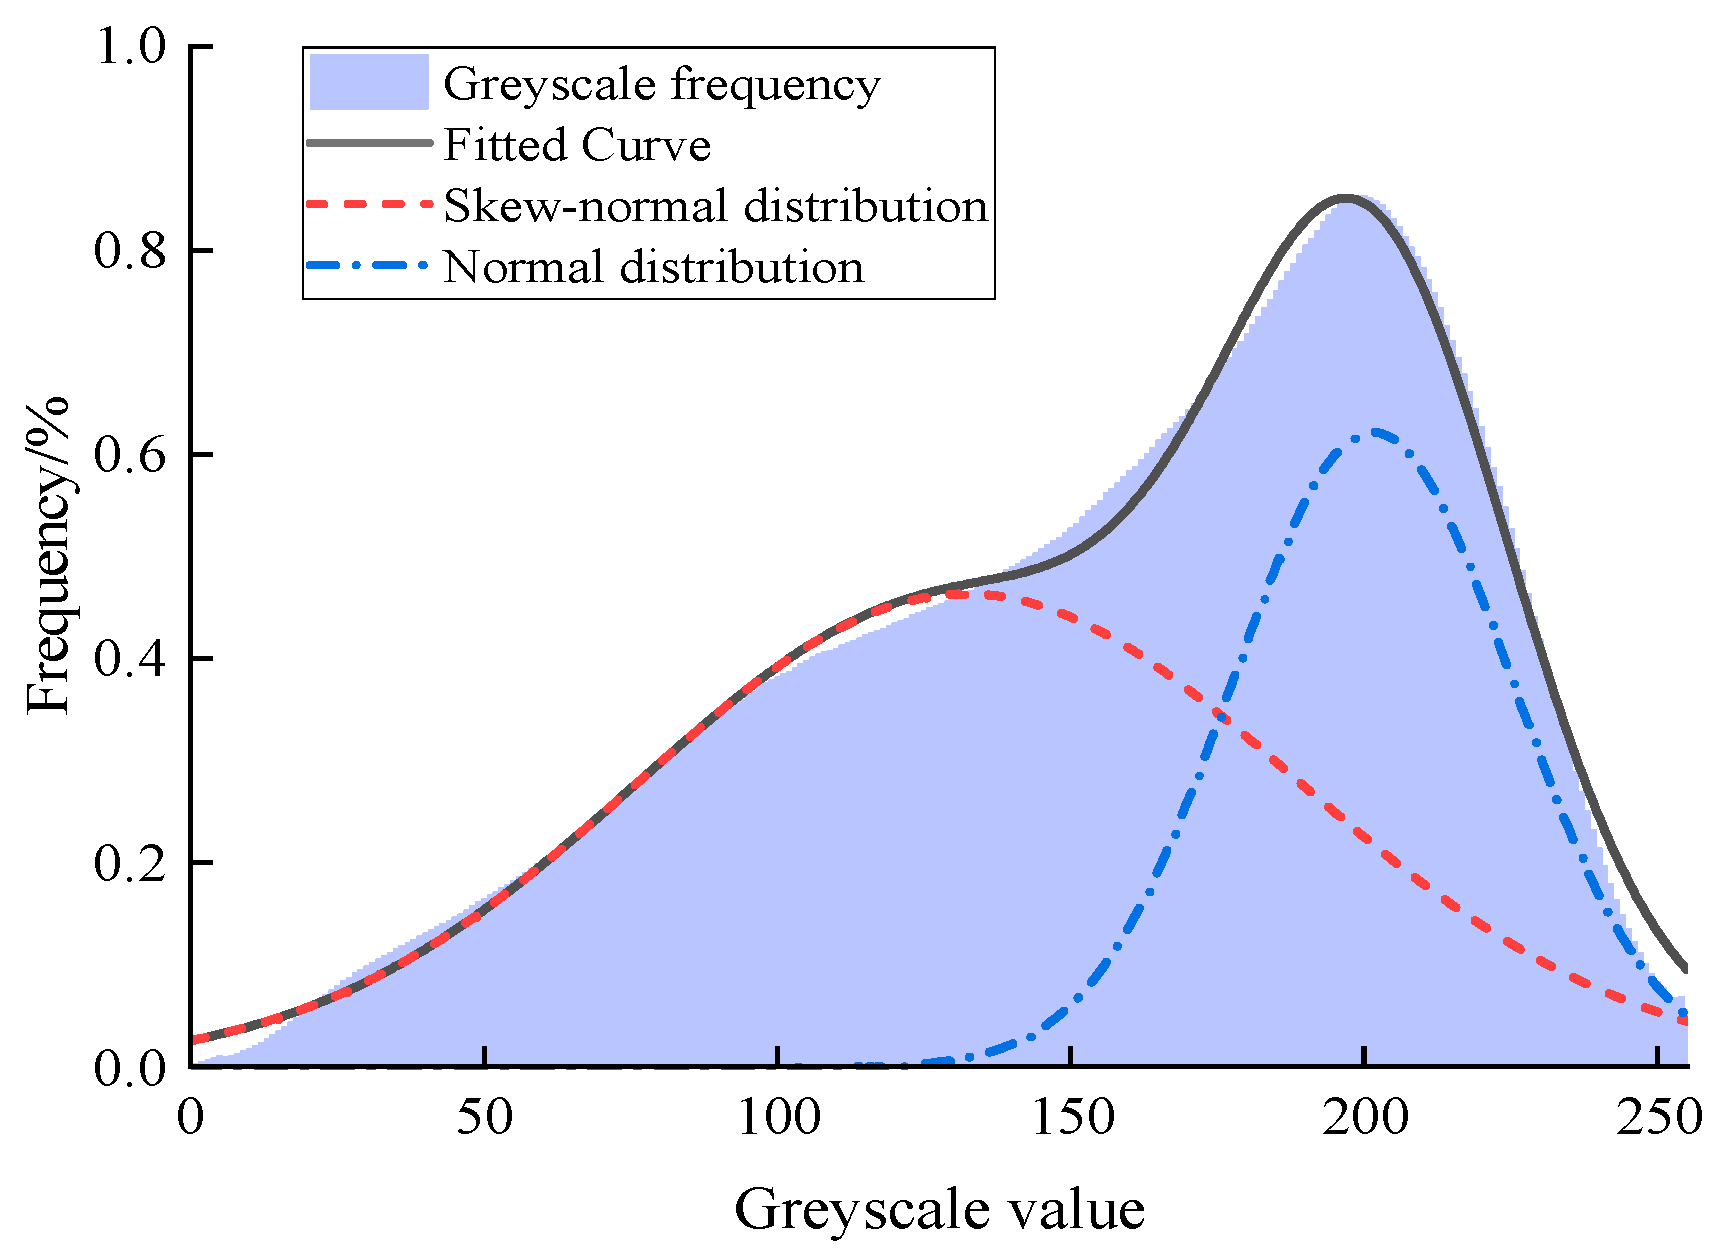
2.3.3. Exposed Aggregate Area Ratio Analysis

The exposed aggregate area ratio represents the percentage of the unit surface area of EAC occupied by exposed coarse aggregates, serving as a critical indicator for characterizing the surface texture of EAC. According to the Technical Guidelines for Construction of Highway Cement Concrete Pavements (JTG/T F30-2014) [23], the exposed aggregate area ratio on EAC surfaces should, optimally, be controlled between 65% and 75%.
Given the distinct color contrast between the exposed black basalt coarse aggregates and the surrounding off-white cement mortar on the EAC slab surface, the exposed aggregate area ratio can be obtained using digital image processing techniques [31] via MATLAB R2022b software. The specific processing steps are as follows: (1) The captured surface image of EAC slab was subjected to grayscale conversion, yielding the grayscale frequency distribution histogram shown in Figure 3; (2) Considering the inevitable presence of residual cement paste stains on exposed aggregate surfaces, causing localized off-white discoloration, a skewed normal distribution was employed to characterize the grayscale frequency distribution of coarse aggregates, while a normal distribution was adopted for the cement mortar due to its relatively minor color contamination. Based on the above analysis, a weighted combination function of skew–normal and normal distributions was utilized to fit the grayscale frequency data of EAC slab image, with the specific mathematical formulation detailed in Equation (1) and the fitting curve results demonstrated in Figure 3; (3) In the fitting results, the integral area under the skew–normal distribution curve within the 0~255 grayscale range was calculated as the exposed aggregate area ratio of the EAC slab. Figure 4 shows the pre- and post-grayscale processing results of a typical exposed aggregate slab surface image.
f ( x ) = 2 a σ 1 ϕ ( y μ 1 σ 1 ) Φ ( λ y μ 1 σ 1 ) + b 2 π σ 2 exp [ 1 2 ( x μ 2 σ 2 ) 2 ]
where f(x) represents the grayscale value; ϕ(·) denotes the probability density function of the standard normal distribution, while Φ(·) denotes its cumulative distribution function; parameters μ1, σ1 and μ2, σ2 correspond to the mean and standard deviation of the skew–normal distribution and normal distribution, respectively; λ serves as the skewness parameter for the skew–normal distribution; and a and b represent the weighting coefficients for the two distributions.

2.3.4. Skid Resistance Performance Test

The skid resistance performance of the EAC slab surface was evaluated using the pendulum friction tester method (T 0964) specified in the Field Test Methods of Highway Subgrade and Pavement (JTG 3450-2019) [32], with the British Pendulum Number (BPN) serving as the indicator of skid resistance. Testing was conducted at 25 °C ambient temperature with surface moistening achieved through water spray bottle application. The test result was derived from the average of five consecutive measurements, followed by temperature correction as prescribed by the standard. The specific testing configuration is illustrated in Figure 5.

2.3.5. Noise Reduction Performance Test

Owing to the dimensional constraints of the EAC slab specimens, the indoor tire drop method [33] was implemented to simulate traffic-induced noise on the slab surface. The DH5922D dynamic signal acquisition and analysis system was employed to capture the impact noise generated between the tire and the EAC slab. The test tire used was a standard passenger car tire (205/55 R16) inflated to a pressure of 0.22 MPa. The ambient temperature during testing was 26 °C, and the tire was dropped from a height of 65 cm above the EAC slab surface. Noise sensors were positioned symmetrically on the same side of the slab, each located 100 cm horizontally and 70 cm vertically from the slab center, forming a 45° angle with the line passing through the slab center and perpendicular to the tire’s direction of travel. During testing, the ambient background noise level was maintained below 30 dB to minimize interference. The specific test procedures are as follows: (1) connecting the noise sensors and initiating noise data acquisition; (2) releasing the tire from an elevated platform to generate impact noise with the EAC slab and acquiring the noise frequency spectrum; (3) recording maximum noise peaks during tire/surface interaction; (4) repeating the sequence five times, and calculating the arithmetic mean of measurements as the noise value of the EAC slab. The entire noise testing system configuration is illustrated in Figure 6.

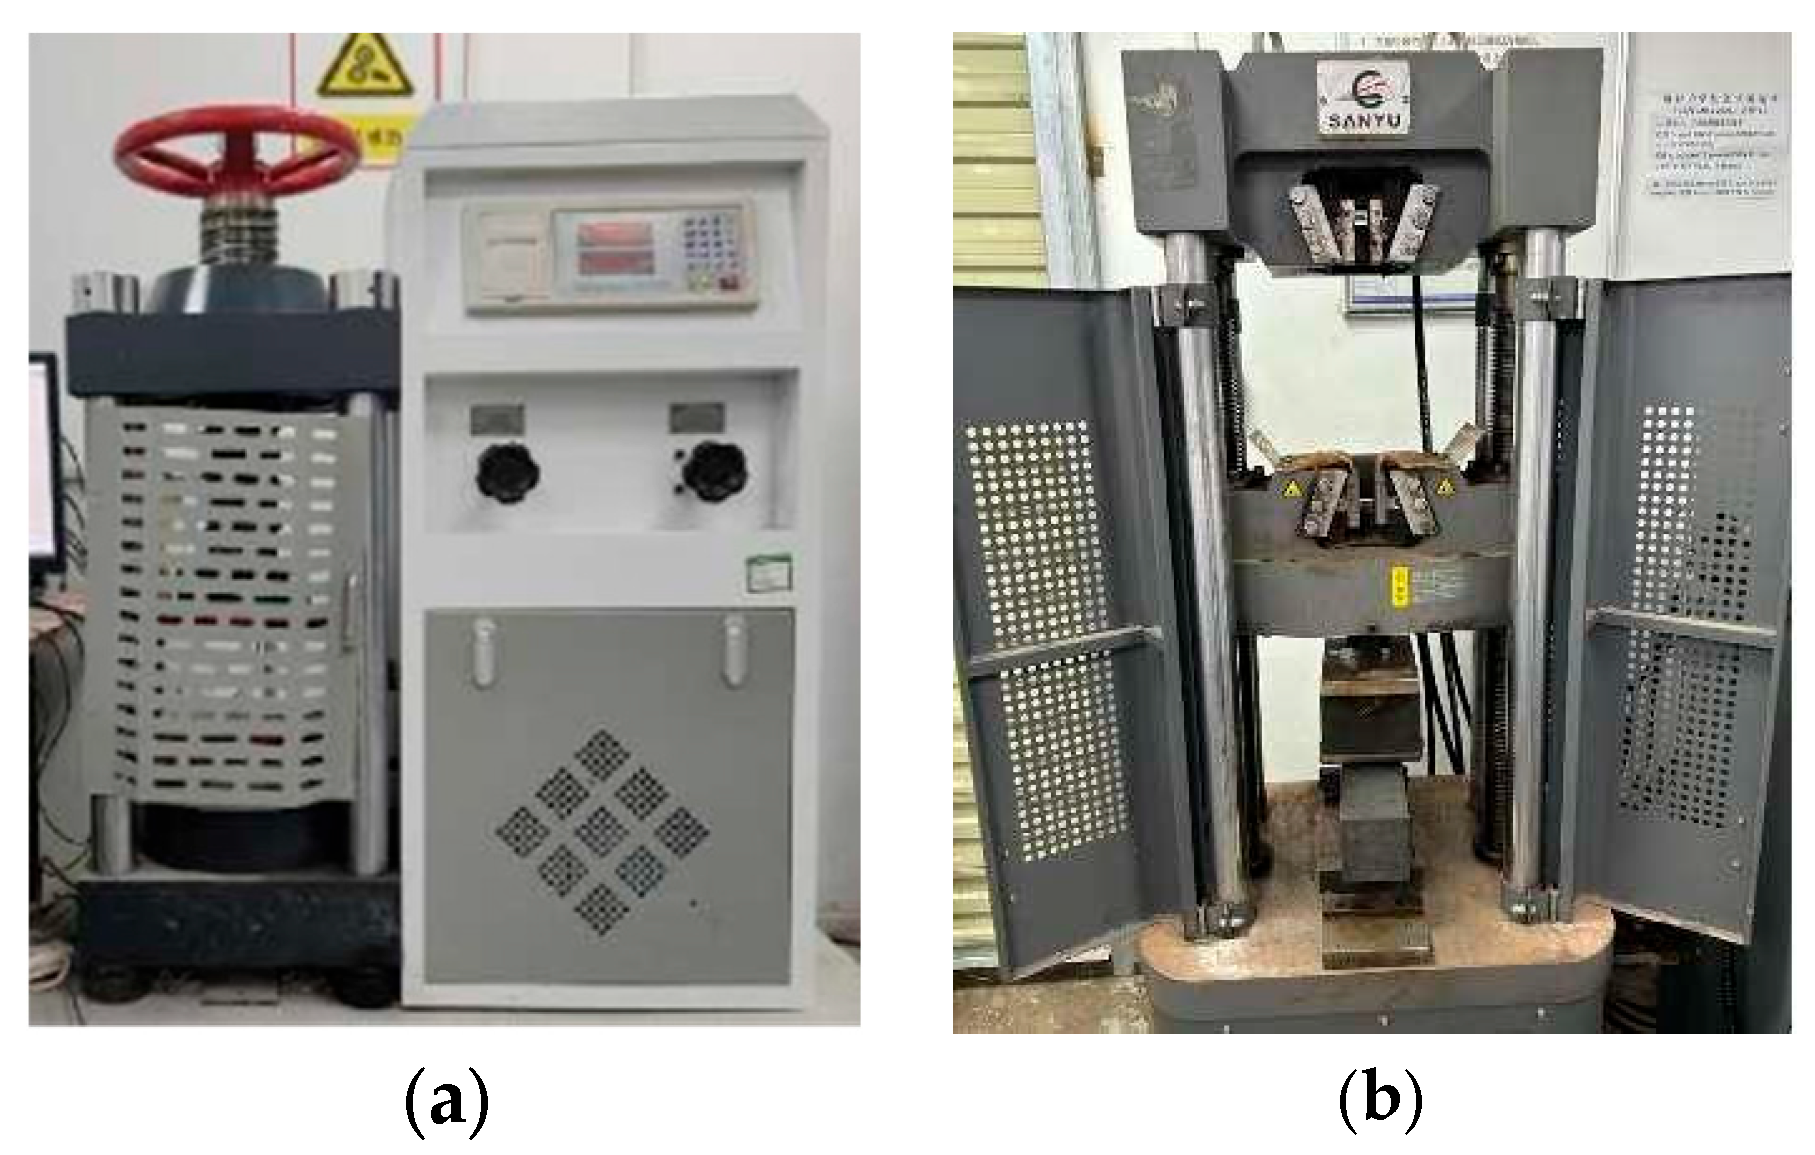
2.3.6. Mechanical Properties Test

The mechanical properties of the concrete were tested in accordance with the 28-day compressive and flexural strength test methods (T 0553 and T 0558) for concrete specified in the Testing Methods of Cement and Concrete for Highway Engineering (JTG 3420-2020) [34]. Specifically, the 28-day compressive strength test was conducted using a DYE-2000 digital compression testing machine, as shown in Figure 7a, while the 28-day flexural strength test was performed using a WE-300B universal material testing machine (Shuangniu Building Materials Instrument and Equipment Factory, Wuxi, China), as illustrated in Figure 7b.

3. Test Results

3.1. Analysis of Orthogonal Test Results

The surface texture characteristics, SRNR performance, and mechanical properties indicators of the EAC slab specimens prepared through orthogonal experimental design were tested. The test results are presented in Table 3, and the corresponding range analysis results are shown in Table 4.
By comparing the range values of the four factors, the influence degrees of each mix design parameter on the six performance indicators of EAC can be ranked from high to low as follows: exposed aggregate depth D > B > C > A; exposed aggregate area ratio D > C > B > A; pendulum value D > C > A > B; noise value D > A > B > C; 28-day compressive strength A > B > C > D; and 28-day flexural strength B > D > A > C. The above results indicate that, for the surface texture characteristics of EAC, the proportion of aggregates > 9.5 mm has the most significant impact on both exposed aggregate depth and area ratio, while the water–binder ratio exerts the minimal influence. Regarding skid resistance performance, the proportion of aggregates > 9.5 mm remains the most influential factor. Both the water–binder ratio and sand ratio contribute marginally to skid resistance, with their range values being less than 2 BPN, indicating a substantial gap compared to the impact of other factors. For noise reduction performance, the proportion of aggregates > 9.5 mm is still the most significant factor, whereas the coarse aggregate volume ratio has the least impact on noise value. In terms of mechanical properties, the water–binder ratio and sand ratio are the most significant factors affecting the 28-day compressive strength and 28-day flexural strength, respectively. The coarse aggregate volume ratio has a negligible impact on the 28-day flexural strength, with a range of only 0.08 MPa.

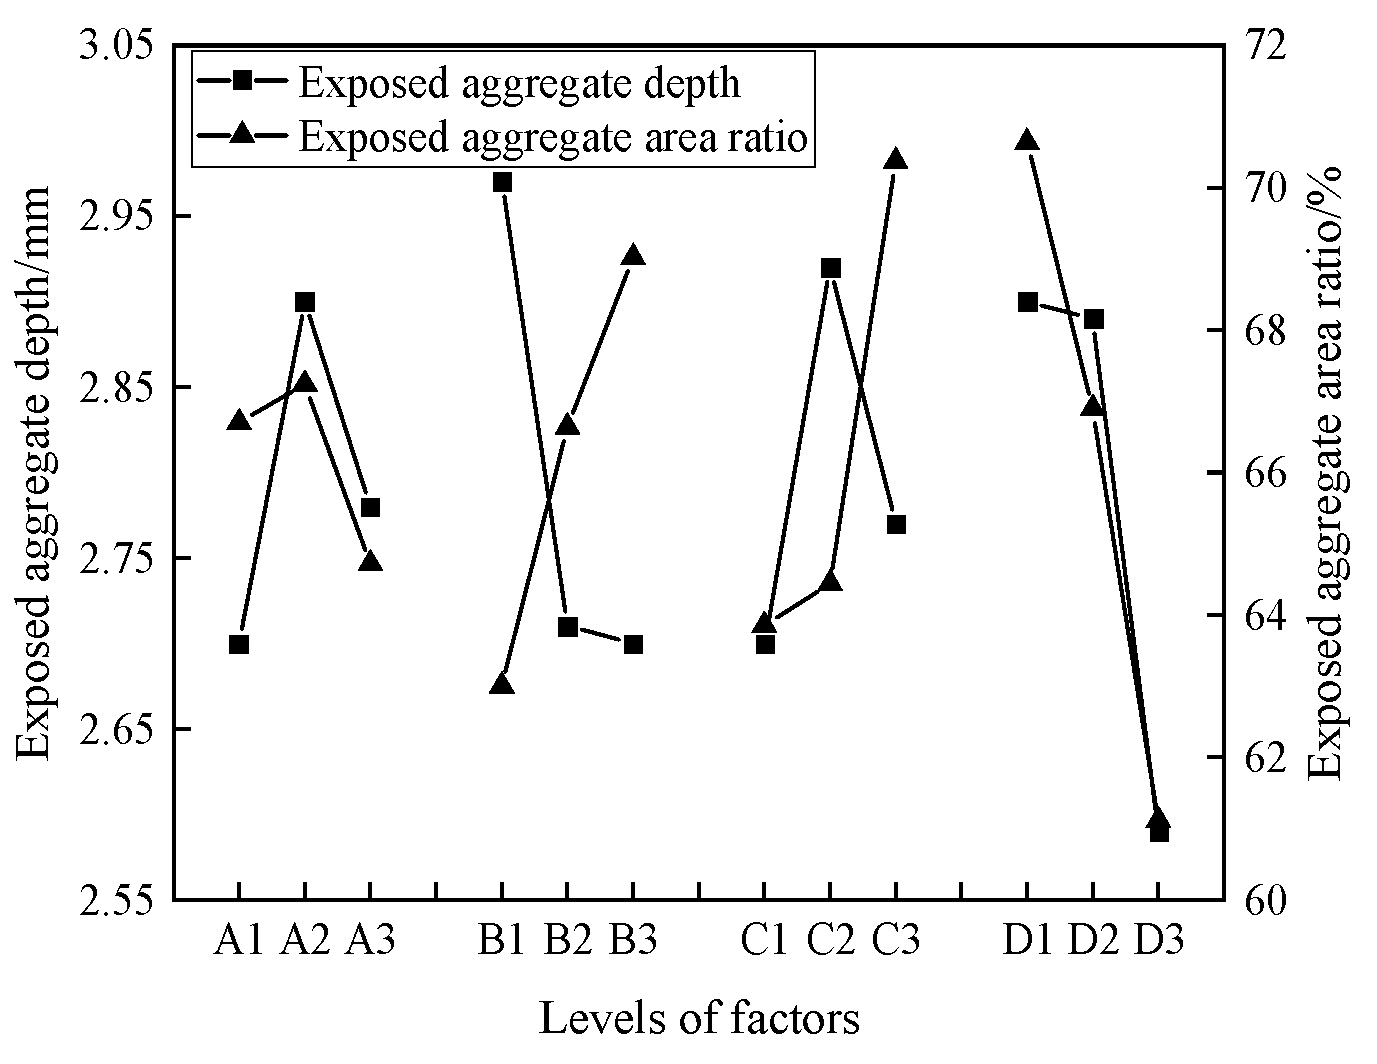
3.2. Variation Patterns of Various Factors on Surface Texture Characteristics

The surface texture characteristics of EAC are critical to its SRNR performance. According to the Technical Guidelines for Construction of Highway Cement Concrete Pavements (JTG/T F30-2014) [23] and relevant literature [30], the exposed aggregate depth of EAC should be controlled between 2 and 3 mm, and the exposed aggregate area ratio should be maintained between 65 and 75%. Based on the range analysis results of the orthogonal test shown in Table 4, the variation patterns of the average exposed aggregate depth and area ratio under different factor levels are illustrated in Figure 8.
As shown in Figure 8, as the water–binder ratio increases, both the exposed aggregate depth and the exposed aggregate area ratio first increase and then decrease. When the water–binder ratio increases from 0.40 to 0.43, the elevation of the water–binder ratio prolongs the setting time of the surface cement mortar. Under identical brushing timing conditions, the EAC surface with a higher water–binder ratio exhibits greater amounts of unset cement mortar, leading to greater exposed aggregate depth and area ratio after brushing. When the water–binder ratio further increases from 0.43 to 0.46, the enhanced fluidity of the EAC mixture causes internal cement mortar to rise to the surface during vibration, while coarse aggregates sink. This increases the surface mortar layer thickness, making cement mortar the primary component within the influence depth of the exposed aggregate agent, rather than the coarse aggregate. Consequently, both the exposed aggregate depth and area ratio decrease after brushing.
As the sand ratio increases, the exposed aggregate depth gradually decreases, while the exposed aggregate area ratio gradually increases. When the sand ratio increases from 28% to 34%, the fine aggregates progressively fill the voids between coarse aggregates, enhancing the fluidity and dispersion of coarse aggregates during EAC vibration. This reduces the convex peak structures formed by the mutual extrusion of coarse aggregates at the surface, thereby gradually lowering and stabilizing the exposed aggregate depth. Simultaneously, the increased sand ratio enlarges the total specific surface area of aggregates, reducing concrete fluidity. During vibration, coarse aggregates become less prone to sinking, leading to a gradual increase in the exposed aggregate area ratio.
As the coarse aggregate volume ratio increases, the exposed aggregate depth first increases and then decreases, while the exposed aggregate area ratio gradually increases. When the coarse aggregate volume ratio increases from 40% to 42%, the proportion of coarse and fine aggregates in the concrete mixture gradually increases, while the cement paste proportion decreases. This reduces the cement paste’s ability to coat the aggregates. The reduced concrete fluidity decreases the surface mortar thickness, increasing the exposed aggregate depth and slightly raising the exposed aggregate area ratio by 0.59%. When the coarse aggregate volume ratio increases from 42% to 44%, the cement paste proportion further decreases, leaving insufficient paste to coat all aggregates. Both the cement paste deficiency and aggregate surface adsorption reduce the effective penetration depth of the exposed aggregate agent, causing a decrease in exposed aggregate depth. Concurrently, the further reduced concrete fluidity impedes coarse aggregate particles from sinking during vibration, leading to their accumulation on the surface and a significant increase in the exposed aggregate area ratio, reaching 5.93%.
As the proportion of aggregates >9.5 increases, both exposed aggregate depth and exposed aggregate area ratio exhibit decreasing trends. Specifically, the minimum exposed aggregate depth drops by 10.7% compared to its maximum value, while the exposed aggregate area ratio decreases by 9.53%. Among all factors, the proportion of aggregates >9.5 exerts the most significant influence on surface texture characteristics. As this proportion increases from 30% to 70%, the proportion of large-diameter particles in the coarse aggregates increases, the gaps between the coarse aggregates enlarge, and the specific surface area of the aggregates decreases. These changes enhance the internal mortar flow capacity of the EAC, making it easier for the mortar to float to the surface during concrete vibration. Meanwhile, large-particle coarse aggregates are more likely to sink, resulting in a significant reduction in both the exposed aggregate depth and the exposed aggregate area ratio.

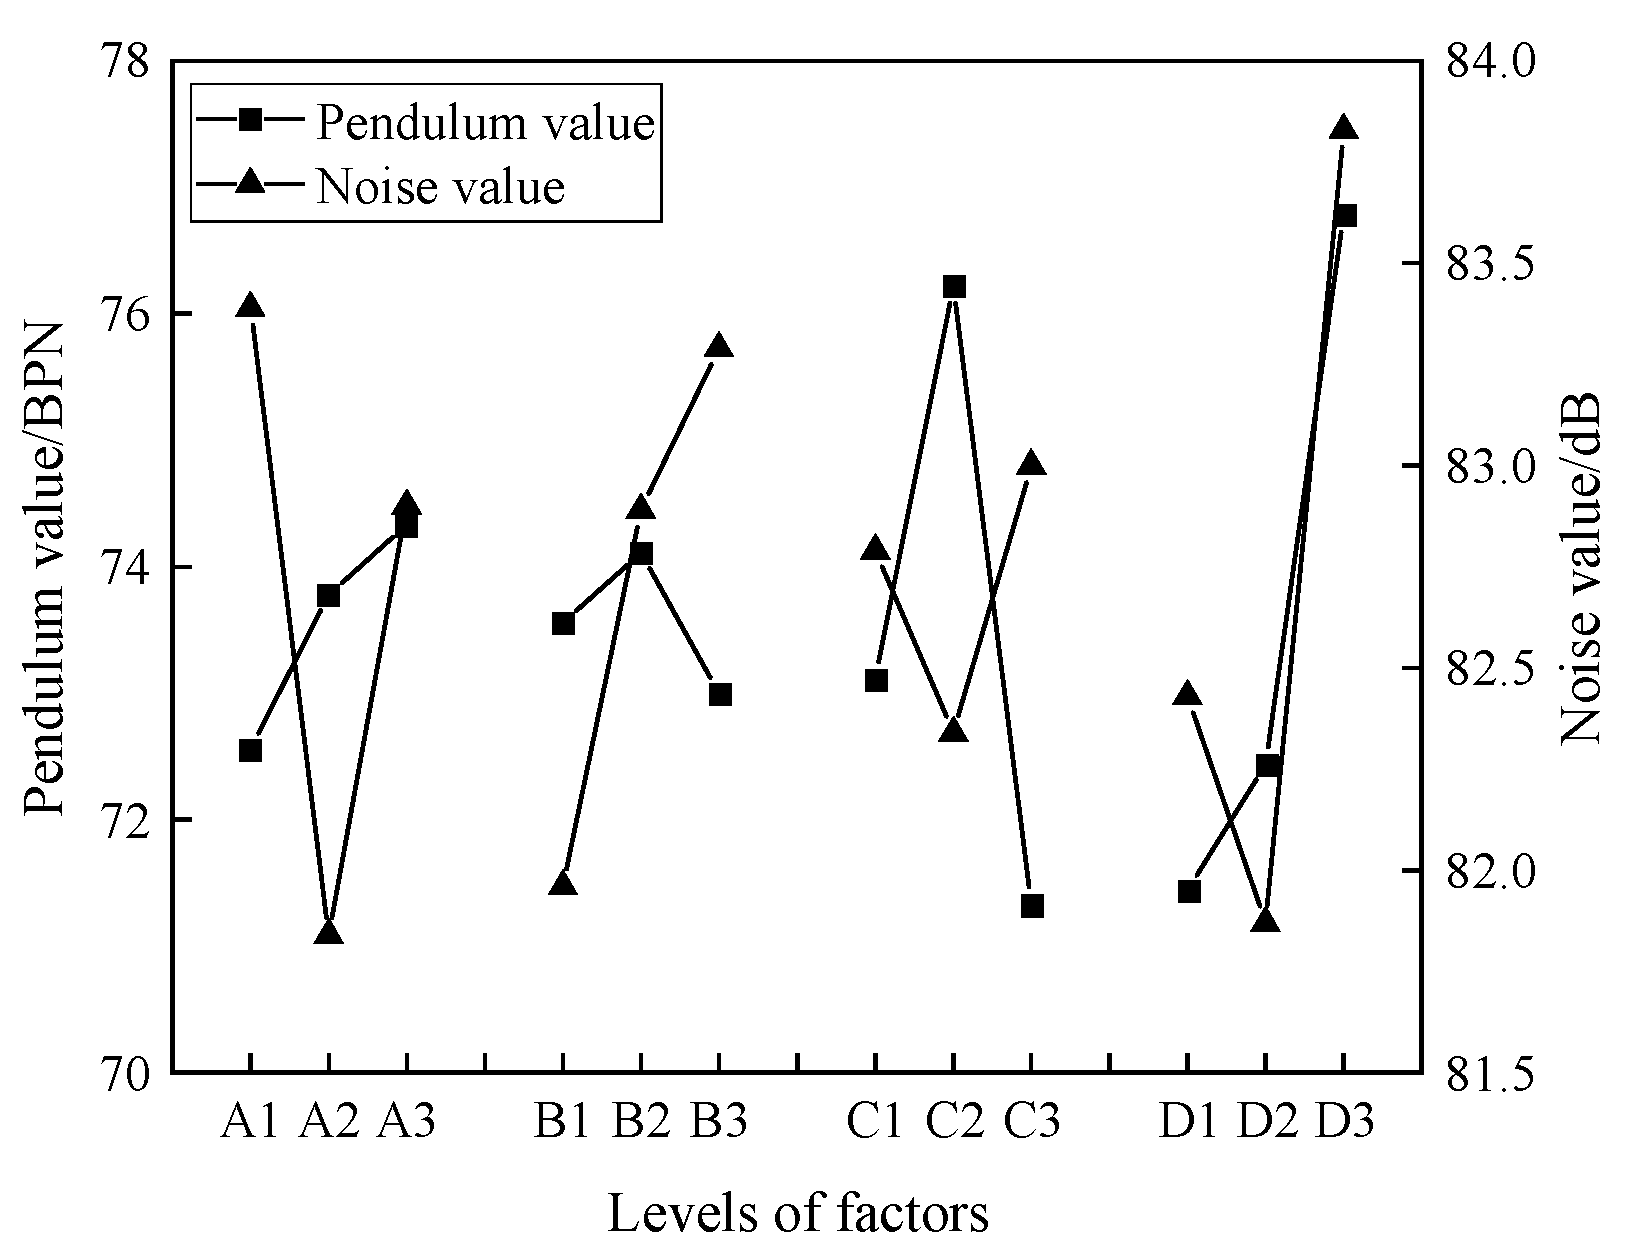
3.3. Variation Patterns of Various Factors on SRNR Performance

As indicated in the previous analysis, various factors have varying impacts on the surface texture characteristics of EAC, which directly correlate with the SRNR performance of EAC surfaces. Therefore, it is necessary to analyze the influence of each factor on the SRNR performance of EAC surfaces based on their effects on the surface texture characteristics. Figure 9 illustrates the variation patterns of the average pendulum value and average noise value of EAC surfaces under different factor levels.

3.3.1. Variation Patterns of Various Factors on Skid Resistance Performance

As shown in Figure 9, as the water–binder ratio increases, the pendulum value gradually rises; with the increase in the sand ratio, the pendulum value first increases and then decreases. For both water–binder ratio and sand ratio, the maximum value does not exceed 2.5% compared to the minimum value. This indicates that the influence of water–binder ratio and sand ratio on the skid resistance performance of EAC surfaces is not significant.
As the coarse aggregate volume ratio increases, the pendulum value first increases and then decreases. When the coarse aggregate volume ratio increases from 40% to 42%, the exposed aggregate area ratio changes slightly, only increasing by a small margin of 0.59%, while the exposed aggregate depth increases by 0.22 mm. The rise in pendulum value is primarily attributed to the increased exposed height of coarse aggregates on the EAC surface, enhancing the frictional effect of the coarse aggregates and thereby improving surface skid resistance performance. When the coarse aggregate volume ratio increases from 42% to 44%, the exposed aggregate area ratio increases by 5.93%, while the exposed aggregate depth decreases by 0.15 mm. According to research by the International Road Federation (IRF), the skid resistance performance between tires and pavement primarily depends on the pavement surface micro-texture under low-speed driving conditions [35]. On EAC surfaces, the mortar possesses richer micro-textures. The pendulum friction tester simulates low-speed vehicle driving; therefore, the primary reason for the decrease in pendulum value at this stage is that the increased coarse aggregate area ratio obstructs contact between the pendulum friction tester’s rubber slider and the cement mortar, thereby reducing the EAC surface skid resistance performance.
As the proportion of aggregates > 9.5 mm increases, the pendulum value gradually increases. When the proportion of aggregates > 9.5 mm increases from 30% to 50%, the exposed aggregate depth only decreases by 0.01 mm, and the exposed aggregate area ratio decreases by 3.74%, while the pendulum value only increases by 1.00 BPN. This indicates that when the exposed aggregate area ratio is from 66.90% to 70.64%, the impact of the exposed aggregate area ratio on the pendulum value is relatively small. When the proportion of aggregates > 9.5 mm increases from 50% to 70%, the exposed aggregate depth decreases by 0.30 mm, and the exposed aggregate area ratio decreases by 5.79%, while the pendulum value increases by 4.34 BPN. This indicates that when the exposed aggregate area ratio is from 61.11% to 66.90%, the impact of the exposed aggregate area ratio on the pendulum value is relatively large. Although the frictional resistance of the coarse aggregate decreases, the contact area between the rubber slider of the pendulum friction tester and the cement mortar continuously increases, enhancing the surface skid resistance of the EAC.

3.3.2. Variation Patterns of Various Factors on Noise Reduction Performance

As shown in Figure 9, as the water–binder ratio increases, the noise value first decreases and then increases. This phenomenon is mainly due to the fact that when the water–binder ratio is 0.43, the corresponding exposed aggregate depth is the largest, and there are the most voids between the tire and the EAC surface. Relevant studies have shown that the voids between the tire and the pavement can effectively reduce the pumping noise generated when the tire contacts the pavement surface [36,37]. Therefore, when the water–binder ratio is 0.43, the noise value of the EAC surface is the lowest.
As the sand ratio increases, the noise value gradually rises, with the maximum value increasing by 1.33 dB compared to the minimum value. When the sand ratio increases from 28% to 31%, the exposed aggregate depth decreases by 0.26 mm, and the voids between the tire and the surface decrease, leading to an increase in the noise value. When the sand ratio increases from 31% to 34%, the exposed aggregate depth changes little, decreasing by only 0.01 mm; however, the exposed aggregate area ratio increases by 2.38%. At this point, the increase in the noise value is mainly due to the increase in the exposed aggregate area ratio, which results in the accumulation of more coarse aggregates on the EAC surface. This accumulation reduces the voids between the coarse aggregates, enhancing the air pumping effect between the tire and the pavement, as well as the vibration noise of the tire itself.
As the coarse aggregate volume ratio increases, the noise value first decreases and then increases. When the coarse aggregate volume ratio increases from 40% to 42%, the exposed aggregate area ratio only increases by 0.59%, while the exposed aggregate depth increases by 0.22 mm, resulting in a decrease in the noise value. When the coarse aggregate volume ratio increases from 42% to 44%, the exposed aggregate area ratio increases by 5.93%, while the exposed aggregate depth decreases by 0.15 mm. The increase in coarse aggregates on the EAC surface, coupled with the decrease in exposed aggregate depth, leads to the blockage of air escape channels between the tire and the surface, thereby increasing the noise value.
As the proportion of aggregates > 9.5 mm increases, the noise value first decreases and then increases. When the proportion of aggregates > 9.5 mm increases from 30% to 50%, the exposed aggregate area ratio decreases by 3.74%, while the exposed aggregate depth only decreases by 0.01 mm, resulting in a decrease in the noise value. When the proportion of aggregates > 9.5 mm increases from 50% to 70%, the exposed aggregate area ratio decreases by 5.79%, and the exposed aggregate depth decreases by 0.30 mm. At this point, the noise value increases by 2.96 dB compared to when the proportion of aggregates > 9.5 mm is 50%. This indicates that, compared to the exposed aggregate area ratio, the exposed aggregate depth has a greater impact on the noise value.

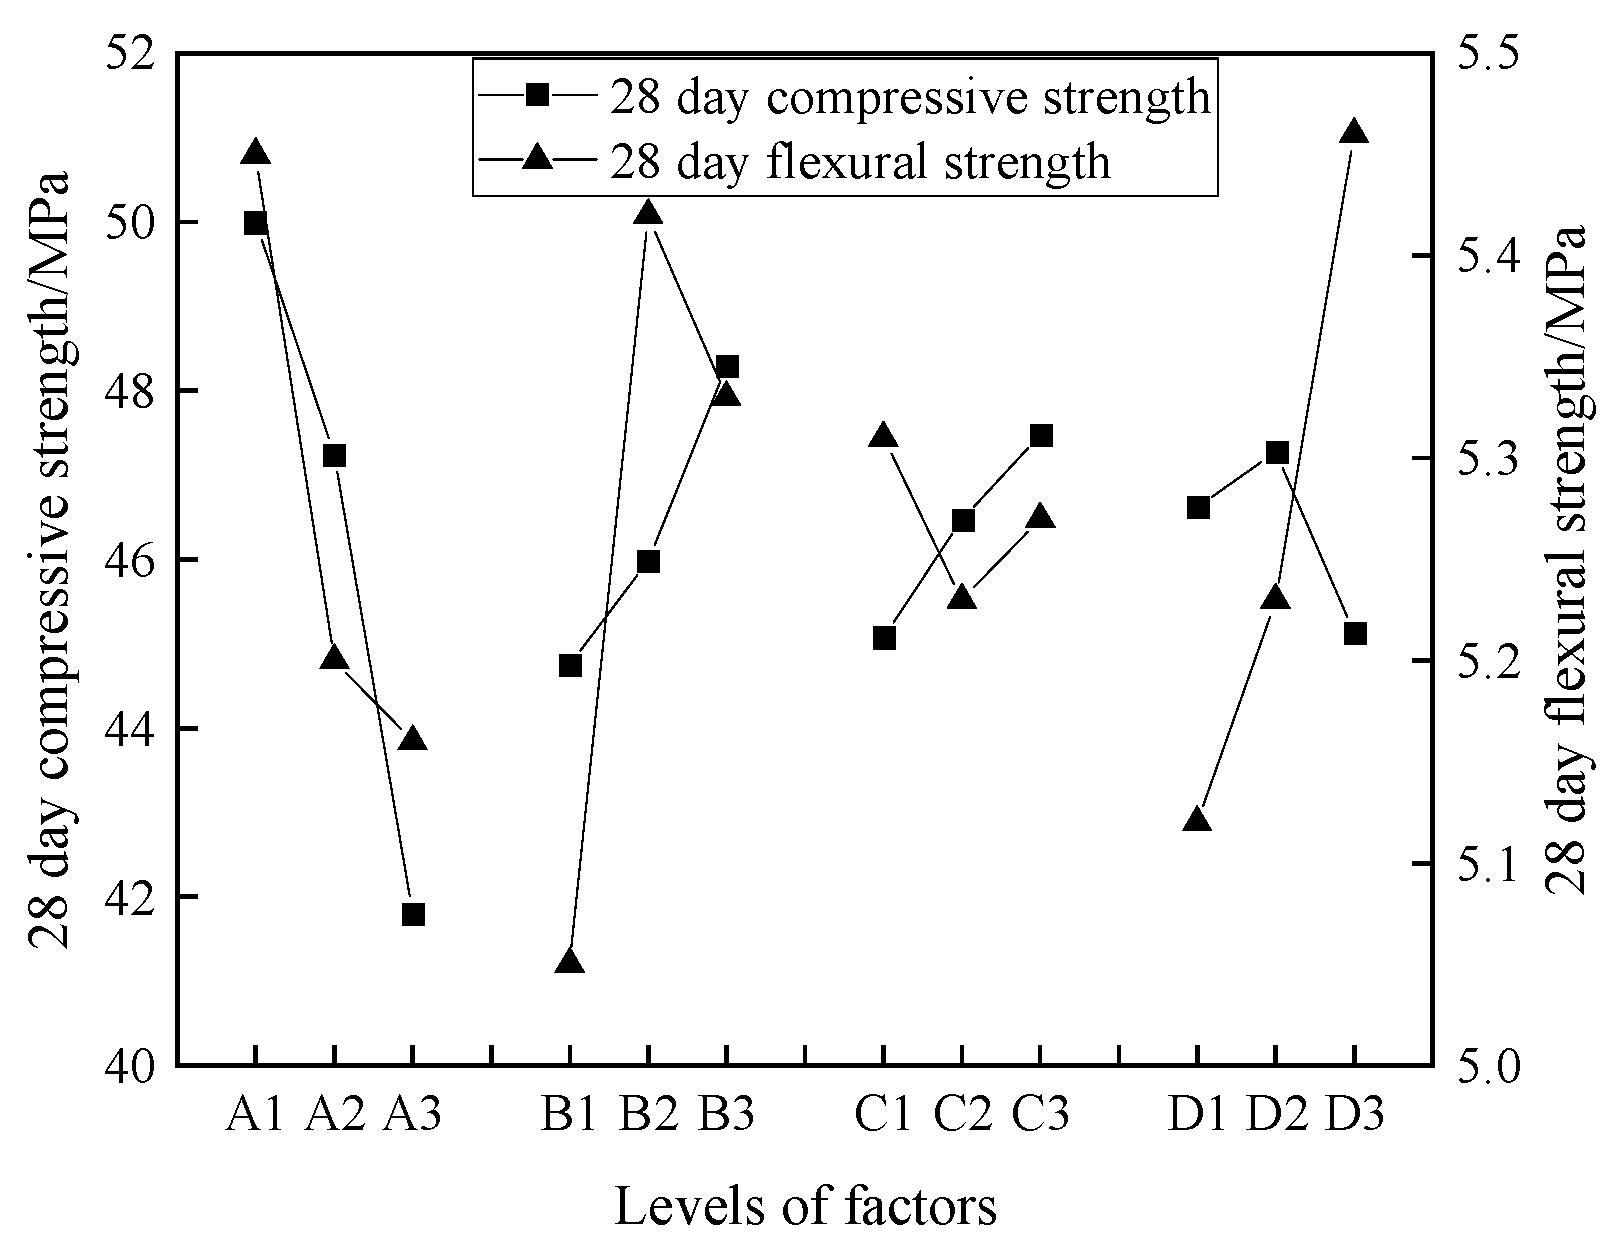
3.4. Variation Patterns of Various Factors on Mechanical Properties

The mechanical properties of EAC are important technical indicators that determine its application scenarios. The strength of EAC designed in this study should meet the C40 compressive strength grade (≥40 MPa) and the requirements for concrete flexural strength (≥5 MPa) under heavy and above traffic load grades specified in the Specifications for Design of Highway Cement Concrete Pavement (JTG D40-2011) [38]. The variation patterns of average 28-day compressive and flexural strength under different factor levels are shown in Figure 10.
As shown in Figure 10, as the water–binder ratio increases, both the 28-day compressive and flexural strengths gradually decrease. This is mainly because an increase in the water–binder ratio affects the hydration reaction of cement, and excess water easily forms blisters or pores after concrete hardening, resulting in excessive pores inside the concrete, which, in turn, reduces the strength of the concrete.
As the sand ratio increases, the 28-day compressive strength gradually increases, while the 28-day flexural strength first increases and then decreases. When the sand ratio increases from 28% to 31%, the fine aggregates continuously fill the voids between the coarse aggregates, making the concrete structure denser and the stress distribution between the aggregates more uniform, thereby improving both the compressive and flexural strengths. When the sand ratio increases from 31% to 34%, the interlocking effect of the microscopic engagement structure between the fine aggregates is further enhanced, increasing the compressive strength. However, at this point, an increase in the sand ratio increases the specific surface area of the aggregates, and insufficient coating of the aggregates by the cement paste leads to a decrease in the flexural strength of the concrete interface.
As the coarse aggregate volume ratio increases, the 28-day compressive strength gradually increases, while the 28-day flexural strength first decreases and then increases. For compressive strength, an increase in the coarse aggregate volume ratio increases the “point-to-point” contact between coarse aggregates, improving the interlocking force between them, and thus gradually increasing the compressive strength. For flexural strength, when the coarse aggregate volume ratio is 40%, the flexural strength reaches a maximum value of 5.31 MPa, which is only an increase of 1.5% compared to the minimum value, indicating that the coarse aggregate volume ratio has a small impact on the 28-day flexural strength.
As the proportion of aggregates > 9.5 mm increases, the 28-day compressive strength first increases and then decreases, while the 28-day flexural strength gradually increases. For compressive strength, when the proportion of aggregates > 9.5 mm is 50%, the aggregates form a skeleton-dense structure, resulting in the highest overall compressive strength of the concrete structure. For flexural strength, the larger the proportion of aggregates > 9.5 mm, the smaller the specific surface area of the aggregates, the higher the proportion of cement mortar at the cross-section, and the smaller the area of the interface weak zone composed of mortar and coarse aggregates, thus resulting in higher flexural strength.

4. Discussion

4.1. Optimisation of Mix Proportions

Based on the results of the above orthogonal test analysis, aiming at maximizing the pendulum value, minimizing the noise value, maximizing the 28-day compressive strength, and maximizing the 28-day flexural strength, the optimal level combinations of the four mix design factors (water–binder ratio, sand ratio, coarse aggregate volume ratio, and proportion of aggregates > 9.5 mm) for the SRNR performance and mechanical properties of EAC can be obtained. The results are shown in Table 5.
The optimal mix proportions of EAC should be based on meeting the basic requirements of concrete strength and surface texture characteristics, while pursuing higher SRNR performance. When the water–binder ratio is 0.46, the EAC tends to exhibit reduced exposed aggregate depth and area ratio due to excessive mortar layer thickness; therefore, the water–binder ratio is chosen as 0.43. When the sand ratio is 28%, the fine aggregates are insufficient to fill the voids between the coarse aggregates, resulting in interlocking between the coarse aggregates, which is not easily dispersed. The coarse aggregates are easily unevenly distributed in the exposed height on the surface of EAC, and the exposed aggregate area ratio is reduced. Therefore, the sand ratio is selected as the optimal level of 31% for the pendulum value and 28-day flexural strength. The coarse aggregate volume ratio is selected as the optimal level of 42% for the pendulum value and noise value. The proportion of aggregates > 9.5 mm has the greatest impact on the surface texture characteristics of EAC. When the proportion of aggregates > 9.5 mm is 70%, both the exposed aggregate depth and the exposed aggregate area ratio will be significantly reduced to low levels. Although the skid resistance performance may improve at this stage due to the increased mortar area ratio, the reduction in coarse aggregates on the surface simultaneously compromises its abrasion resistance. Therefore, in order to ensure that the EAC surface has sufficient exposed aggregate depth and exposed aggregate area ratio, the proportion of aggregates > 9.5 mm is selected as 50%.
In summary, the optimal mix proportions for EAC with high SRNR performance are determined as follows: water–binder ratio of 0.43, sand ratio of 31%, coarse aggregate volume ratio of 42%, and proportion of aggregates > 9.5 mm of 50%.

4.2. Verification of Optimal Mix Proportions

The optimal mix proportions were selected to fabricate EAC slab specimens, and their surface texture characteristics, SRNR performance, mechanical properties, and workability indicators were experimentally verified. Meanwhile, to compare the high SRNR performance of EAC with the optimal mix proportions, grooved cement concrete slab specimens with a texture width of 6 mm, depth of 3 mm, and texture spacing of 15 mm were fabricated as a control group. The corresponding test results are shown in Table 6. A spectral analysis comparison of the A-weighted tire/surface noise between EAC and grooved concrete was conducted, and the results are shown in Figure 11.
As can be seen from Table 6 and Figure 11, compared with grooved concrete, the pendulum value of EAC increased by 31.5%, and the noise value decreased by 6.48 dB. The frequency range of noise reduction was mainly concentrated between 1.5 and 4.0 kHz, which falls within the mid-to-high frequency range from 1.0 to 5.0 kHz that is more sensitive to the human ear [39]. This indicates that the optimized EAC, due to its rich surface texture, has superior SRNR performance compared to ordinary concrete, and can serve as a reference for engineering applications.

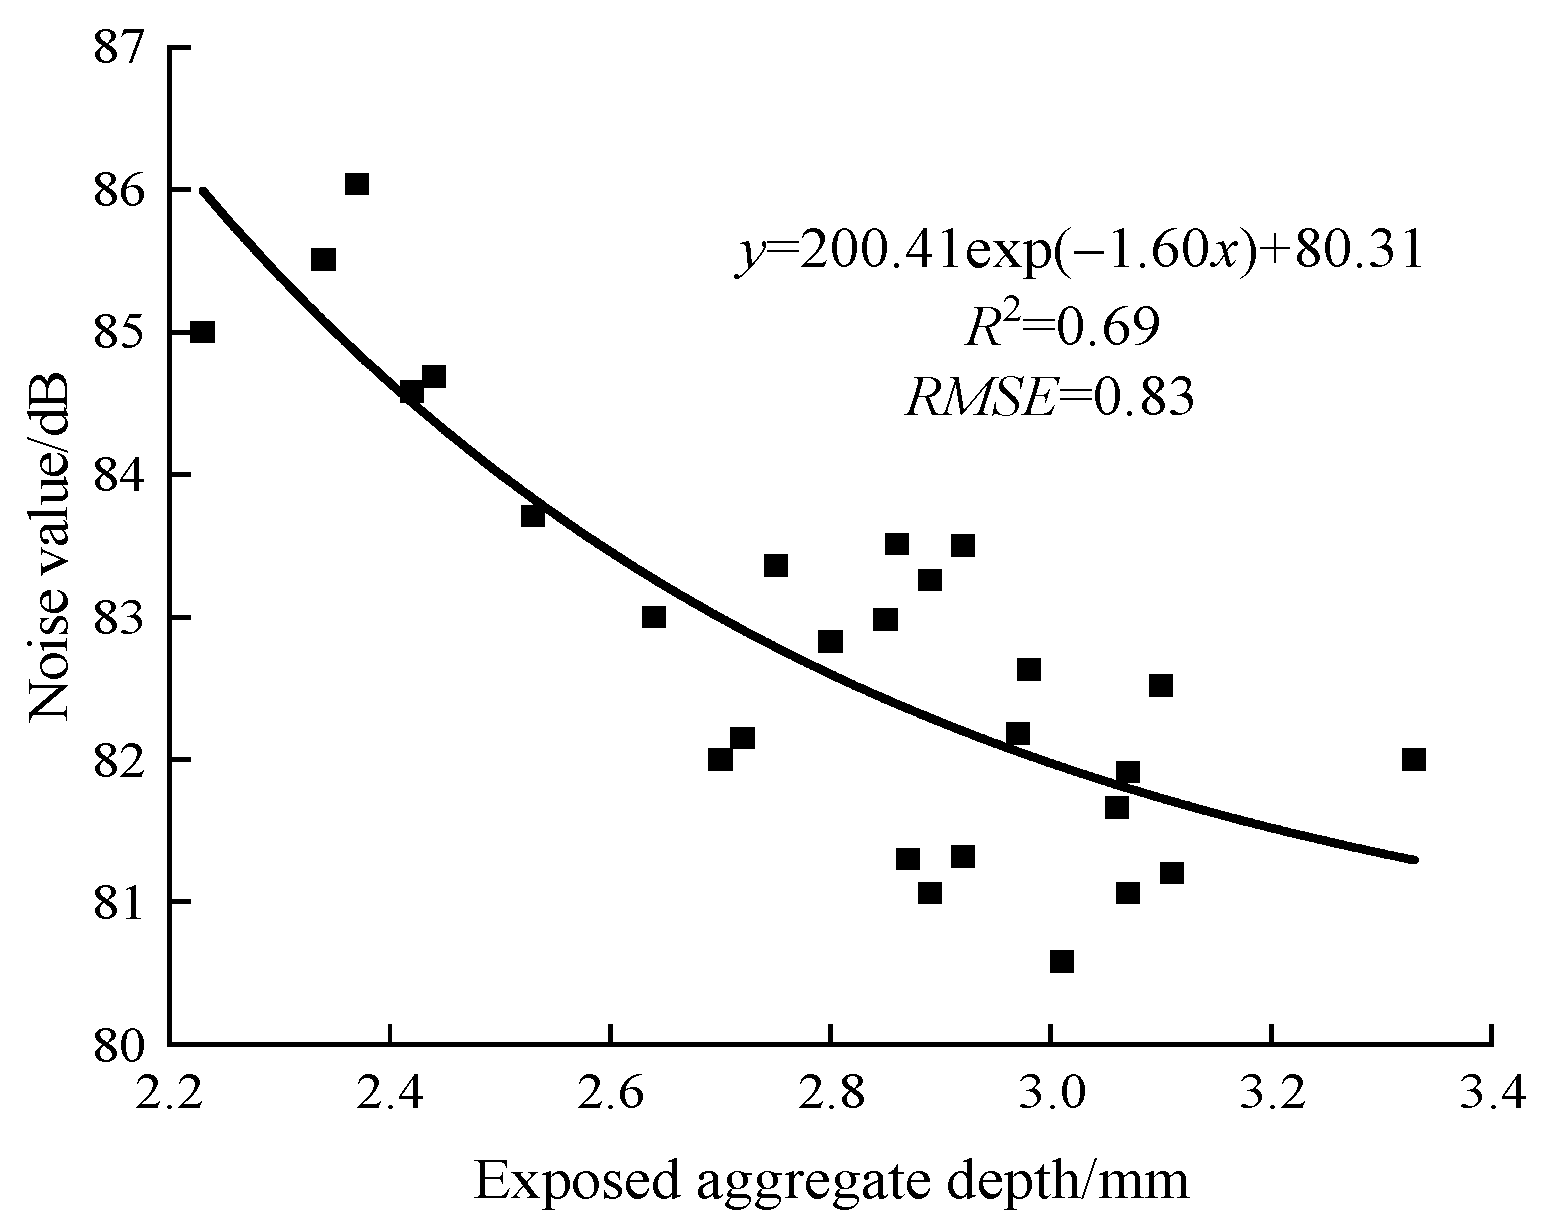
4.3. Correlation Analysis of SRNR Performance

Based on the analysis of orthogonal test results, it is not difficult to find that there is a certain correlation between the surface texture characteristics of EAC and its SRNR performance. Therefore, a correlation analysis was conducted on the orthogonal test data of nine groups of 27 EAC slab specimens, including exposed aggregate depth, exposed aggregate area ratio, pendulum value, and noise value. The analysis results are shown in Figure 12 and Figure 13, respectively. The results showed that the coefficient of determination R2 between noise value and exposed aggregate depth, as well as between pendulum value and exposed aggregate area ratio, both exceeded 0.64, indicating that both relationships exhibited high correlations.
As can be seen from Figure 12, as the exposed aggregate depth increases, the noise value gradually decreases and stabilizes. Based on this variation characteristic of noise value, an inverse exponential function was used for fitting, and the coefficient of determination R2 was found to be 0.69, indicating an inverse exponential function relationship between noise value and exposed aggregate depth. This relationship between noise value and exposed aggregate depth also reflects the variation pattern of the air pumping effect generated by tires traveling at a certain speed on EAC pavement. Specifically, as the exposed aggregate depth increases, the voids between the tire and the EAC surface during contact increase, and the air discharge channels become more unobstructed, reducing the likelihood of forming air compression in enclosed voids. Consequently, the air pumping effect between the tire and the pavement weakens, and the surface noise value of the pavement gradually decreases.
As can be seen from Figure 13, as the exposed aggregate area ratio increases, the pendulum value shows a trend of first decreasing, then increasing, and finally decreasing again, forming a cubic polynomial relationship with a coefficient of determination R2 reaching 0.78. This variation trend between the pendulum value and exposed aggregate area ratio mainly depends on the contact condition between the rubber slider of the pendulum friction tester and the surface texture of EAC during testing. Generally, the mortar texture contains a large number of rich micro-textures, and under the condition that the rubber slider simulates the low-speed driving of automobile tires, the micro-textures play a major role in pavement skid resistance. Therefore, when the exposed aggregate area ratio is less than 64%, the larger the exposed aggregate area ratio, the smaller the contact area between the rubber slider and the mortar texture, and the lower the skid resistance performance of the EAC surface. When the exposed aggregate area ratio is between 64% and 71%, the coarse aggregate texture becomes the main texture. At this time, an increase in the exposed aggregate area ratio reduces the contact between the rubber slider and part of the mortar texture, reducing the impact of the mortar texture on skid resistance performance, and the friction effect of the coarse aggregate on the rubber slider becomes the main source of skid resistance performance. Therefore, as the exposed aggregate area ratio increases, the pendulum value gradually increases. When the exposed aggregate area ratio exceeds 71%, the mortar texture distributed in the valleys between the coarse aggregates is almost completely blocked by the coarse aggregate texture, and the texture contacted by the rubber slider changes from the original composite texture of coarse aggregate and mortar to only contacting the coarse aggregate texture. Therefore, the pendulum value shows a downward trend once again.
In summary, the SRNR performance of EAC is closely related to its surface texture characteristics. However, some data points in the fitting results exhibited relatively high dispersion, with root mean square errors (RMSEs) of 1.75 BPN for the pendulum value and 0.83 dB for the noise value. This indicates that while the exposed aggregate depth and area ratio can reflect the overall variation trends of SRNR performance for EAC, high-precision prediction remains challenging due to the influence of additional factors such as the exposure postures of coarse aggregates and surface microtexture. Based on the correlation analysis, under the condition of meeting the basic requirements for surface texture characteristics with an exposed aggregate depth of 2~3 mm and an exposed aggregate area ratio of 65~75%, the greater the exposed aggregate depth, the better the noise reduction performance of the EAC surface. When the exposed aggregate area ratio is controlled between 69% and 73%, the skid resistance performance of its surface reaches a high and stable level.

5. Conclusions

To enhance the SRNR performance of EAC and clarify the formation mechanism of its surface texture characteristics and their relationship with SRNR performance, this paper investigated the effects of four mix design parameters—water–binder ratio, sand ratio, coarse aggregate volume ratio, and proportion of aggregates > 9.5 mm—on the surface texture characteristics, SRNR performance, and mechanical properties of EAC through orthogonal experiments. The optimal mix proportions for EAC were proposed, and a correlation analysis was conducted between the surface texture characteristics and the SRNR performance. The main conclusions are as follows:
(1)
The proportion of aggregates > 9.5 mm is the most significant factor affecting the surface texture characteristics and SRNR performance of EAC. When the proportion of aggregates > 9.5 mm is 70%, both the exposed aggregate depth and the exposed aggregate area ratio of EAC decrease significantly. Therefore, the proportion of aggregates > 9.5 mm should not be too high during mix design.
(2)
The optimal mix proportions of EAC are as follows: water–binder ratio of 0.43, sand ratio of 31%, coarse aggregate volume ratio of 42%, and proportion of aggregates > 9.5 mm of 50%. Compared with ordinary grooved concrete, the optimal mix proportions of EAC increase the pendulum value by 31.5% and reduce the noise value by 6.48 dB. The frequency range of noise reduction is mainly concentrated between 1.5 kHz and 4.0 kHz, which belongs to the mid-high frequency range that is more sensitive to the human ear.
(3)
There is a high correlation between noise value and exposed aggregate depth, as well as between pendulum value and exposed aggregate area ratio. Specifically, as the exposed aggregate depth increases, the noise value gradually decreases and stabilizes, showing an inverse exponential function relationship. On the other hand, as the exposed aggregate area ratio increases, the pendulum value first decreases, then increases, and finally decreases again, exhibiting a cubic polynomial relationship.
EAC has broad application prospects in the field of pavement engineering due to its superior SRNR performance. Future research will employ 3D laser scanning technology and machine learning algorithms [40,41,42,43] to establish the relationship between macroscopic/microscopic surface texture parameters and SRNR performance of EAC, investigating the evolution patterns of texture parameters and SRNR performance under different wear levels, so as to provide a reference for the practical engineering application effects of EAC.

Author Contributions

Conceptualization, C.W. and X.Z.; methodology, C.W. and R.L.; software, C.W.; validation, C.W. and R.L.; formal analysis, X.Z; investigation, C.W.; resources, X.Z.; data curation, C.W.; writing—original draft preparation, C.W.; writing—review and editing, X.Z. and R.L.; visualization, Y.L.; supervision, X.Z. and Y.L.; project administration, X.Z. All authors have read and agreed to the published version of the manuscript.

Funding

This work was funded by National Natural Science Foundation of China [grant number 51878077] and the Postgraduate Scientific Research Innovation Project of Hunan Province [grant number CXCLY2022002].

Institutional Review Board Statement

Not applicable.

Informed Consent Statement

Not applicable.

Data Availability Statement

The original contributions presented in this study are included in the article. Further inquiries can be directed to the corresponding author.

Conflicts of Interest

The authors declare no conflicts of interest.

References

  1. Fang, J.; Tu, J.; Wu, K. Analysis of skid resistance and noise characteristics for varieties of concrete pavement. Adv. Mater. Sci. Eng. 2020, 1, 7427314. [Google Scholar] [CrossRef]
  2. Zhao, W.; Zhang, J.; Lai, J.; Shi, X.; Xu, Z. Skid resistance of cement concrete pavement in highway tunnel: A review. Constr. Build. Mater. 2023, 406, 133235. [Google Scholar] [CrossRef]
  3. Wen, B.; Cao, D. Statistical analysis of traffic accidents and skid resistance of expressway pavement. HTRD 2006, 23, 72–75. [Google Scholar] [CrossRef]
  4. Zhang, C.; Wang, B.; He, J.; Xiang, D.; Yi, L. Traffic risk analysis of ponding sections on freeways based on driving dynamics. J. Transp. Inf. Saf. 2019, 37, 9–17. [Google Scholar] [CrossRef]
  5. Kassomenos, P.; Vogiatzis, K.; Coelho, J. Critical issues on environmental noise: Editorial. Sci. Total Environ. 2014, 482, 399–400. [Google Scholar] [CrossRef]
  6. Miera-Dominguez, H.; Lastra-González, P.; Indacoechea-Vega, I.; Castro-Fresno, D.; Van Loon, R.; van Blokland, G.; Muresn, B.; Blanc, J. Development and validation of a new asphalt mixture to reduce tyre-road contact noise in interurban areas. Constr. Build. Mater. 2024, 453, 139025. [Google Scholar] [CrossRef]
  7. Zhu, B.; Hu, D.; Liao, F.; Chen, J.; Su, B.; Wu, J.; Wang, Y. A Fast Approach to Optimize Tread Pattern Shape for Tire Noise Reduction. Appl. Sci. 2023, 13, 10256. [Google Scholar] [CrossRef]
  8. Ouis, D. Annoyance from road traffic noise: A review. J. Environ. Psychol. 2001, 21, 101–120. [Google Scholar] [CrossRef]
  9. Wegman, F. The future of road safety: A worldwide perspective. IATSS Res. 2017, 40, 66–71. [Google Scholar] [CrossRef]
  10. Cai, Z.; He, Z.; Tian, B.; Qiu, Z. Study on effecting depth of aggregate exposing solvent. Highw. Eng. 2018, 43, 66–69+100. [Google Scholar] [CrossRef]
  11. Cai, Z.; He, Z.; Wang, Z.; Yu, D.; Hou, Z.; Zhang, Y.; Zhang, B. Study on the amount of cleaning of exposed-aggregate concrete pavement. Concrete 2018, 3, 149–152. [Google Scholar] [CrossRef]
  12. Wei, L. Study on surface characteristics of exposed aggregate concrete pavement. Low Temp. Archit. Technol. 2016, 38, 17–19. [Google Scholar] [CrossRef]
  13. Kim, Y.K.; Kim, J.H.; Rith, M.; Lee, S.W. Optimisation of mixture design and surface texture for low-noise exposed aggregate concrete pavements. Int. J. Pavement Eng. 2020, 23, 950–956. [Google Scholar] [CrossRef]
  14. Yan, Q.; Li, X.; Tian, B.; Hou, Z.; Xie, J. Research on mix proportion design of low noise exposed-aggregate cement concrete. Constr. Technol. 2015, 44, 63–66. [Google Scholar] [CrossRef]
  15. Chhay, L.; Kim, J.; Lee, S.W. Mean texture depth estimation of exposed aggregate concrete pavement surface texture based on photogrammetry technique. Int. J. Civ. Eng. 2024, 22, 1717–1729. [Google Scholar] [CrossRef]
  16. Yang, L.; Chen, J.; Zhang, B.; Li, J.; Wang, F. Research on long-term anti-sliding performance of exposed aggregate cement concrete. J. Traffic Eng. 2020, 20, 1–6. [Google Scholar] [CrossRef]
  17. Chen, W.; Shen, P. Research on development and pavement performances of aggregate exposing concrete. Highway 2013, 58, 45–52. [Google Scholar] [CrossRef]
  18. Hu, L.; Yun, D.; Gao, J.; Tang, C. Monitoring and optimizing the surface roughness of high friction exposed aggregate cement concrete in exposure process. Constr. Build. Mater. 2020, 230, 117005. [Google Scholar] [CrossRef]
  19. Rith, M.; Kim, Y.K.; Lee, S.W. Characterization of long-term skid resistance in exposed aggregate concrete pavement. Constr. Build. Mater. 2020, 256, 119423. [Google Scholar] [CrossRef]
  20. Han, S.; Dong, Y.; Chen, H.; Zhang, D.; Lu, X.; Shi, Y. Noise reduction performance of exposed-aggregate cement concrete pavement. J. Traffic Transp. Eng. 2005, 5, 32–34. [Google Scholar] [CrossRef]
  21. Zhao, D.; Zhang, P.; Tian, B.; Huang, Z.; Li, L. Study on the wear behavior of three-dimensional morphology of anti-sliding structure of cement concrete pavement. New Build. Mater. 2023, 50, 117–122. [Google Scholar] [CrossRef]
  22. Hablovicova, B.; Krivanek, V.; Markova, P. Comparison of exposed aggregate cement concrete surface and stone mastic asphalt surface noise emissions by close-proximity method. Appl. Sci. 2021, 11, 10359. [Google Scholar] [CrossRef]
  23. JTG/T F30-2014; Technical Guidelines for Construction of Highway Cement Concrete Pavements. Ministry of Transportation of PRC: Beijing, China, 2014.
  24. Liu, Y.; Liu, M.; Qu, L.; Wang, F. Factor analysis affect the surface structure of exposed-aggregate cement concrete pavement. Concrete 2016, 2, 157–160. [Google Scholar] [CrossRef]
  25. Šernas, O.; Zofka, A.; Vaitkus, A.; Gražulytė, J. The effect of exposed aggregate concrete gradation on the texture characteristics and durability. Constr. Build. Mater. 2020, 261, 119921. [Google Scholar] [CrossRef]
  26. Hu, S. Study on mix proportion of slipform paving of tunnel exposed aggregate cement concrete pavement. Commun. Sci. Technol. Heilongjiang 2022, 45, 113–117. [Google Scholar] [CrossRef]
  27. Xiao, Y. Application of exposed aggregate concrete pavement in road tunnel construction. Transp. World 2023, 36, 154–156. [Google Scholar] [CrossRef]
  28. Jang, G. Analysis of construction techniques for high skid resistance and low noise exposed aggregate cement concrete pavement. Transp. World 2024, 17, 65–67. [Google Scholar] [CrossRef]
  29. JGJ 55-2011; Specification for Mix Proportion Design of Ordinary Concrete. Ministry of Transportation of PRC: Beijing, China, 2011.
  30. Yin, F.; Cheng, X. Key construction control technology of exposed aggregate cement concrete. Highw. Transp. Inn. Mong. 2007, 6, 15–16. [Google Scholar] [CrossRef]
  31. Zha, X.; Liu, L.; Bai, L.; Han, X. Image recognition method of asphalt-aggregate ratio for asphalt mixture. J. Traffic Transp. Eng. 2013, 13, 1–6+14. [Google Scholar] [CrossRef]
  32. JTG 3450-2019; Field Test Methods of Highway Subgrade and Pavement. Ministry of Transportation of PRC: Beijing, China, 2019.
  33. Mai, J.; Meng, X.; Li, L.; Zhao, L.; He, J. Study on denoising and sound absorption performance of drainage asphalt pavement based on indoor tire accelerated falling method. J. Highw. Transp. Res. Dev. 2022, 39, 17–24. [Google Scholar] [CrossRef]
  34. JTG 3420-2020; Testing Methods of Cement and Concrete for Highway Engineering. Ministry of Transportation of PRC: Beijing, China, 2020.
  35. Panagouli, O.K.; Kokkalis, A.G. Skid resistance and fractal structure of pavement surface. Chaos Soliton. Fract. 1998, 9, 493–505. [Google Scholar] [CrossRef]
  36. Han, D.; Wang, L.; Guo, P.; Lu, W.; Yang, X. Review of principles and research on noise reduction technology for dense-graded rubber asphalt pavements. J. Chang. Univ. Sci. Technol. (Nat. Sci. Ed.) 2024, 21, 61–78+106. [Google Scholar] [CrossRef]
  37. Huang, Z.; Zang, X.; Chen, B.; Yu, J.; Chen, F. Influence of tyre contact configuration distribution on noise reduction characteristics of asphalt pavement. Sci. Technol. Eng. 2018, 18, 123–128. [Google Scholar] [CrossRef]
  38. JTG D40-2011; Specifications for Design of Highway Cement Concrete Pavement. Ministry of Transportation of PRC: Beijing, China, 2011.
  39. Guo, C.; Shen, G.; Wang, X.; Li, L. Analysis of asphalt-rubber pavement noise spectrum with close-proximity trailer method. China J. Highw. Transp. 2012, 25, 22–28. [Google Scholar] [CrossRef]
  40. Dong, S.; Han, S.; Xu, J.; Su, H.; Niu, D.; Chen, D.; Jia, M.; Wang, W. Review of methods for three-dimensional reconstruction and evaluation of asphalt pavement textures. China J. Highw. Transp. 2025, 38, 60–84. [Google Scholar] [CrossRef]
  41. Asteris, P.G.; Skentou, A.D.; Bardhan, A.; Samui, P.; Pilakoutas, K. Predicting concrete compressive strength using hybrid ensembling of surrogate machine learning models. Cement Concrete Res. 2021, 145, 106449. [Google Scholar] [CrossRef]
  42. Jamhiri, B.; Jalal, F.E.; Chen, Y. Hybridizing multivariate robust regression analyses with growth forecast in evaluation of shear strength of zeolite-alkali activated sands. Multiscale Multi. Mod. 2022, 5, 317–335. [Google Scholar] [CrossRef]
  43. Naser, A.H.; Badr, A.H.; Henedy, S.N.; Ostrowski, K.A.; Imran, H. Application of multivariate adaptive regression splines (mars) approach in prediction of compressive strength of eco-friendly concrete. Case Stud. Constr. Mat. 2022, 17, e01262. [Google Scholar] [CrossRef]
Figure 1. EAC slab specimen: (a) Before brushing. (b) After brushing.
Applsci 15 05881 g001
Figure 2. Exposed aggregate depth test.
Applsci 15 05881 g002
Figure 3. Greyscale frequency distribution fitting results.
Applsci 15 05881 g003
Figure 4. EAC slab images before and after grayscale image processing: (a) Before grayscale processing. (b) After grayscale processing.
Applsci 15 05881 g004
Figure 5. Pendulum value test.
Applsci 15 05881 g005
Figure 6. Noise testing system.
Applsci 15 05881 g006
Figure 7. Twenty-eight-day compressive and flexural strength test: (a) Compressive strength tester. (b) Flexural strength tester.
Applsci 15 05881 g007
Figure 8. The variation patterns of exposed aggregate depth and area ratio.
Applsci 15 05881 g008
Figure 9. The variation patterns of the pendulum value and noise value.
Applsci 15 05881 g009
Figure 10. The variation patterns of 28-day compressive and flexural strength.
Applsci 15 05881 g010
Figure 11. Tire/surface noise spectrum of grooved concrete and EAC.
Applsci 15 05881 g011
Figure 12. The relationship between noise value and exposed aggregate depth.
Applsci 15 05881 g012
Figure 13. The relationship between pendulum value and exposed aggregate area ratio.
Applsci 15 05881 g013
Table 1. Factors, levels.
LevelsFactors
A
Water–Binder Ratio
B
Sand Ratio/%
C
Coarse Aggregate Volume Ratio/%
D
Proportion of
Aggregates >9.5 mm/%
10.40284030
20.43314250
30.46344470
Table 2. L9(34) Orthogonal test scheme.
Test NumberFactors
ABCD
10.40284030
20.40314250
30.40344470
40.43284270
50.43314430
60.43344050
70.46284450
80.46314070
90.46344230
Table 3. Results of the orthogonal test.
Test NumberExposed Aggregate Depth/mmExposed Aggregate Area Ratio/%Pendulum Value/BPNNoise Value/dB28-day Compressive Strength/MPa28-day Flexural Strength/MPa
12.8865.5370.0082.4447.425.13
22.8466.0374.6782.3750.695.53
32.3868.5473.0085.3851.865.70
43.0057.1379.6781.8444.575.13
52.8976.2370.0082.0248.295.20
62.8168.3471.6781.6648.865.27
73.0366.3371.0081.5942.274.90
82.4057.6777.6784.2838.975.53
92.9270.1774.3382.8244.155.03
Table 4. Range analysis of an orthogonal test.
Test IndicatorsFactors
ABCD
Exposed aggregate depth/mmk12.702.972.702.90
k22.902.712.922.89
k32.782.702.772.59
range0.200.270.220.31
Exposed aggregate area ratio/%k166.7063.0063.8570.64
k267.2466.6464.4466.90
k364.7269.0270.3761.11
range2.516.026.529.53
Pendulum value/BPNk172.5673.5673.1171.44
k273.7874.1176.2272.44
k374.3373.0071.3376.78
range1.781.114.895.33
Noise value/dBk183.3981.9682.7982.43
k281.8482.8982.3481.87
k382.9083.2983.0083.83
range1.551.330.661.96
28-day compressive strength/MPak149.9944.7545.0846.62
k247.2445.9846.4747.27
k341.8048.2947.4745.13
range8.193.542.392.14
28-day flexural strength/MPak15.455.055.315.12
k25.205.425.235.23
k35.165.335.275.46
range0.300.370.080.33
Table 5. Optimized combination results.
Test IndicatorsFactors
ABCD
Pendulum value0.46314270
Noise value0.43284250
28-day compressive strength0.40344450
28-day flexural strength0.40314070
Table 6. The optimal mix proportions verification and comparison.
Test IndicatorsTechnical
Requirements
EACGrooved
Concrete
Exposed aggregate depth/mm2~32.89/
Exposed aggregate area ratio/%65~7568.75/
Pendulum value/BPN/77.5658.98
Noise value/dB/81.5388.01
28-day compressive strength/MPa≥4047.8143.23
28-day flexural strength/MPa≥55.355.12
Slump/mm10~301423
Disclaimer/Publisher’s Note: The statements, opinions and data contained in all publications are solely those of the individual author(s) and contributor(s) and not of MDPI and/or the editor(s). MDPI and/or the editor(s) disclaim responsibility for any injury to people or property resulting from any ideas, methods, instructions or products referred to in the content.

