1. Introduction
Gassy soil primarily contains CH
4, N
2, CO
2, etc., collectively referred to as shallow gas. Shallow gas represents a natural gas resource and a geological hazard, especially in oceanic environments. In China, shallow gas is widely dispersed along the southeastern coast, the middle and lower reaches of the Yangtze River, the Sichuan Basin, and the Bohai Bay Basin, with an even broader presence on the seabed. Its impact on the construction of foundation engineering projects is often considerable [
1,
2,
3].
Scholars both domestically and internationally have conducted extensive studies on the mechanical properties of gassy sands and gassy soils: Tong et al. [
4] conducted triaxial tests on saturated sand and gas-bearing sand and established a constitutive model of gas-bearing sand and a static liquefaction criterion for gas-bearing sand. Kong et al. [
5] conducted triaxial tests on Hangzhou Bay gas storage sand under four stress paths of active and passive compression and elongation and demonstrated the influence of stress path on the deformation and strength characteristics of unsaturated sand. Guo et al. [
6] conducted field tests and indoor tests to compare the bearing capacity of sand before and after biogas release and found that the slow release of biogas can improve the bearing capacity of sand. Vega-Posada et al. [
7] conducted single and cyclic triaxial tests on medium-density gas-bearing sand and found that even the presence of a small amount of gas makes the soil more easily compressed and limits the accumulation of excess pore water pressure. Wang et al. [
8] found that the occurrence and configuration characteristics of sand in the shallow gas-rich zone of a reservoir were similar to those of ordinary unsaturated soil, but its pore gas pressure was several times that of the atmospheric pressure. During the gas release process, the deformation of the reservoir sand caused only by a reduction in suction was negligible, and the main deformation was attributed to the increase in net average stress caused by a reduction in gas pressure in the reservoir. Yang et al. [
9] studied the influence of temperature on the shear behavior of gas-bearing sand and found that, under undrained shear conditions, the shear strength of loose gas-bearing sand increased with increasing temperature, while the opposite was true for dense gas-bearing sand, and the higher the gas content, the more obvious the phenomenon.
The aforementioned research on the mechanical properties of gassy sands is relatively complete. However, due to the differences in particle size, structure and mineral composition, the mechanical properties of gassy soils are also different to those of gassy sands: Song et al. [
10] conducted a
K0 consolidation test on gas-bearing soil prepared by zeolite and found that the compression coefficient of gas-bearing soil was negatively correlated with the load, and the compression coefficient and rebound coefficient were both positively correlated with the load and gas content. Ye et al. [
11] studied the pore pressure dissipation and settlement development law of fine-grained gas-bearing soil and found that the instantaneous settlement was negatively correlated with saturation, the instantaneous settlement was positively correlated with pore pressure, and the final settlement of gas-bearing soil was greater than that of saturated soil. Wang et al. [
12] conducted indoor tests to study the distribution of water vapor pressure and saturation changes in the aeration zone of shallow gas reservoirs and their effects on soil deformation under controlled degassing measures. Xu et al. [
13] conducted undrained triaxial compression tests on gas-bearing soil and found that the presence of bubbles increased the undrained shear strength of loose sand but reduced the shear strength of dense sand. Wang et al. [
14] prepared gas-bearing clay using the zeolite method and conducted triaxial and one-dimensional consolidation tests. They found that the trapped gas in the soil hindered drainage, increased the undrained shear strength of the soil and reduced the consolidation coefficient. Hong et al. [
15] conducted undrained cyclic triaxial tests on normally consolidated fine-grained gas-bearing soil and found that during the cyclic shear process, the collapse of gas-filled pores led to an increase in cyclic pore water pressure and a decrease in stiffness, while water partially discharged into the gas cavity could prevent this process. Liu et al. [
16] compared the drained stiffness and undrained stiffness of gas-containing and non-gas-containing fine-grained sediments and found that stress history had almost no effect on the undrained stiffness of gas-containing fine-grained sediments, while the drained stiffness of non-gas-containing fine-grained sediments was related to stress history. Sultan et al. [
17] conducted triaxial tests on natural gas-containing sediments in the Gulf of Guinea. The results showed that the expansion and dissolution of gas led to an increase in the compression rate of the soil, a decrease in the preconsolidation pressure and the undrained shear peak strength, and an increase in the pore pressure. Wang et al. [
18] analyzed the effect of water content on the strength and deformation characteristics of thin silt sand interlayers in silty gas-containing clay in a tidal flat area in Cangnan through triaxial tests and consolidation tests. The results showed that the soil cohesion was negatively correlated with the water content, while the internal friction angle was almost unaffected by the water content. Hyodo et al. [
19] compared the triaxial compression properties of gas-saturated soil and water-saturated soil and found that the stiffness and strength of gas-saturated samples were higher than those of water-saturated samples, and the strain softening behavior of gas-saturated samples was more obvious and the volumetric strain was larger. Yoneda et al. [
20] used a mixed pressure coring system to recover cores from shallow natural gas hydrate deposits on the deep seabed and conducted uniaxial and triaxial compression tests to obtain strength and stiffness data for shallow natural gas hydrate deposits. The abovementioned research on gassy soils is relatively advanced but mostly consists of simple experimental studies such as triaxial tests or cross-plate shear tests. In particular, for gassy soft clay, due to its soft characteristics after sample preparation, existing studies rarely involve it.
This paper, based on the actual “Cross-River Tunnel” project and considering practical unconsolidated and undrained engineering conditions, conducted triaxial shear tests and creep tests on gassy soft clay. It analyzed the shear deformation characteristics and long-term strength properties of gassy clay containing silt. A long-term strength prediction model for silty clay considering confining pressure and gas content is proposed, and the effectiveness of the prediction model is verified through experiments.
2. Materials and Methods
2.1. Properties of the Natural Soil
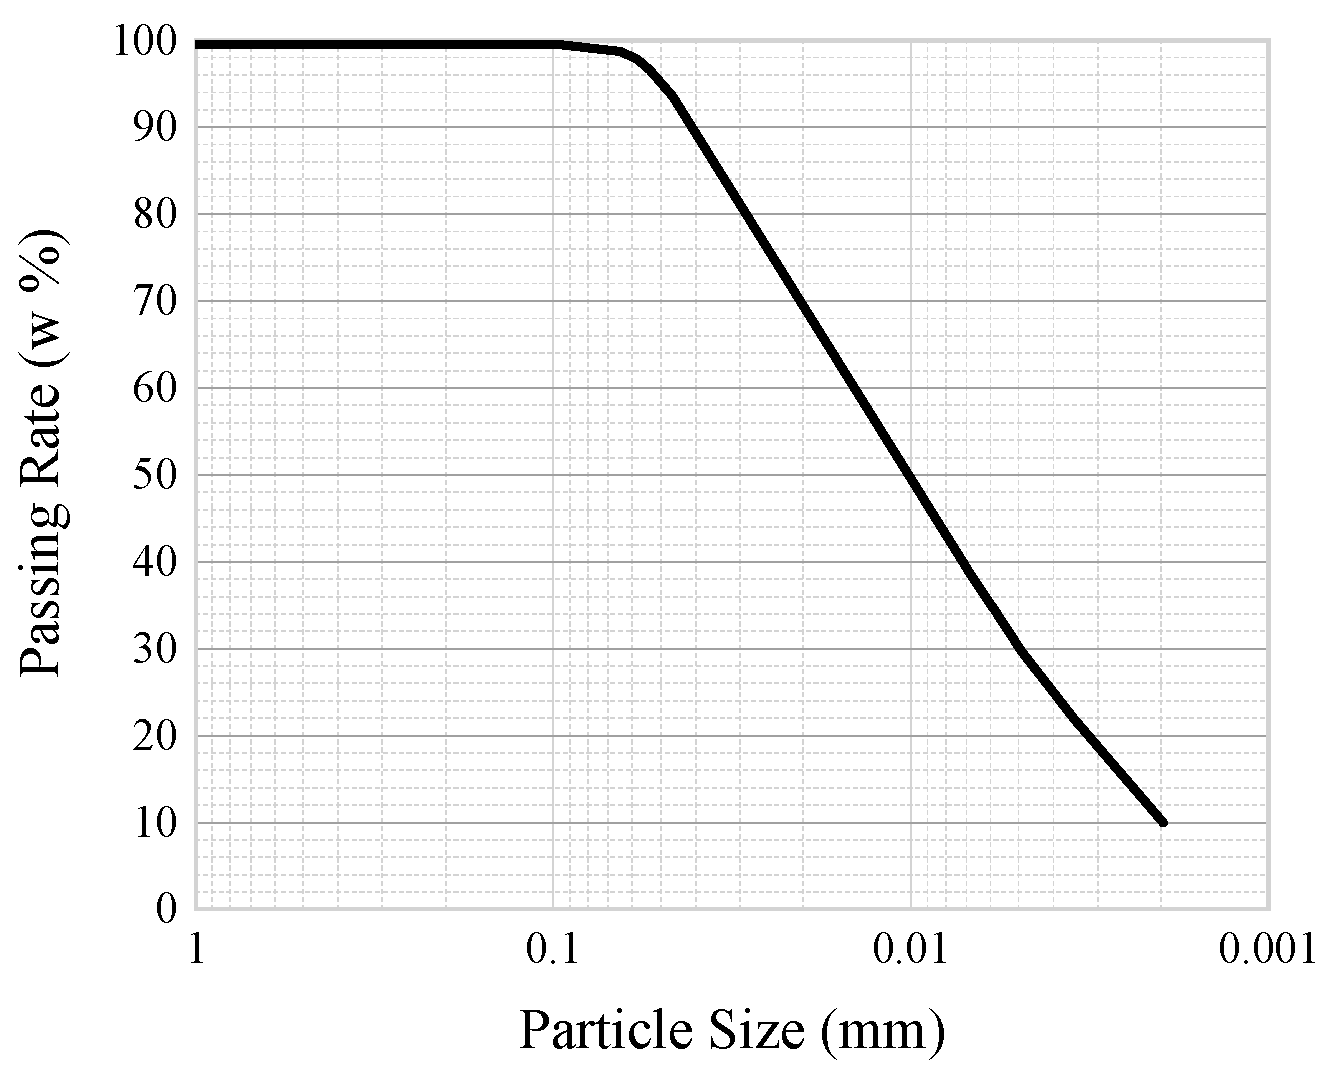
The natural soil utilized in this study is sourced from a silt-containing clay layer located between 8.1 and 29.9 m within borehole DZT02, situated along the north bank of the river. Characterized by a gray-black hue and a distinct odor of decay, this soil exhibits significant plasticity.
Table 1 presents the primary physical attributes of the natural soil, while
Figure 1 depicts the results of the particle analysis.
2.2. Preparation of Soil with Different Gas Content
This study employs the “zeolite method” to simulate the preparation of modified samples of gassy clay with added silt. Zeolite powder serves as a medium for introducing gas into the gassy soil, with N
2 chosen as the experimental gas. The natural soil undergoes a series of steps including drying, grinding, and sieving to eliminate large particles and impurities. Subsequently, the dried zeolite powder is placed in a pressure chamber and subjected to a vacuum for 2 h, reducing the pressure within the chamber to −100 kPa, while the zeolite powder remains in this environment for 24 h to ensure complete gas removal from the zeolite crystals. A nitrogen gas pressurization device is then connected to the pressure chamber, and over a span of 24 h, nitrogen gas at 200 kPa is intermittently injected into the chamber every 6 h to saturate the zeolite crystals with nitrogen gas. The nitrogen-filled zeolite powder is carefully mixed with dry soil particles no larger than 0.075 mm, following the proportions detailed in
Table 2. Distilled water is added to the mixture, which is then thoroughly stirred. The transfer of the soil sample into an acrylic molding tube for self-weight consolidation is conducted swiftly, with the stirring-to-sampling process controlled to within 2 min to minimize nitrogen gas loss. The molding tube is sealed and left to stand for 24 h, facilitating the complete displacement of gas within the zeolite crystals by water and enabling the gassy soil to consolidate under its own weight to a specific strength capable of supporting the pre-consolidation pressure.
2.3. Triaxial Shear Test Study
The soil sample undergoes pre-consolidation within a dedicated device, where vertical stress is incrementally applied, starting from 3 kPa and increasing by 3 kPa every 6 h until reaching 24 kPa, marking the completion of pressurization. Following pre-consolidation, the soil sample’s resilience is further increased, paving the way for conventional triaxial shear tests conducted utilizing an advanced stress path triaxial rheometer. In alignment with the actual conditions of the engineering site, test conditions are established as unconsolidated and undrained, with confining pressures set at 100 kPa, 150 kPa, 200 kPa, and 250 kPa. The testing procedure adheres to the specifications outlined in the “Chinese Standard for Geotechnical Test Methods (GB/T50123-2019)”.
2.4. Creep Test Study
The creep test comprises two parts, examining the creep characteristics of silt-containing gassy clay with identical gas content and different confining pressures and with identical confining pressure and varying gas contents. Utilizing a triaxial apparatus, the experimental setup features specimen dimensions of Φ39.1 mm × H80 mm. Employing the step loading method, the test utilizes the deviatoric stress amplitude from the conventional triaxial shear test (as detailed in
Section 2.3) as the maximum deviatoric stress in the creep test. The loading time for each deviatoric stress level is set at 50 h, with the specific loading schemes outlined in
Table 3 and
Table 4.
3. Results
3.1. Analysis of Triaxial Shear Characteristics
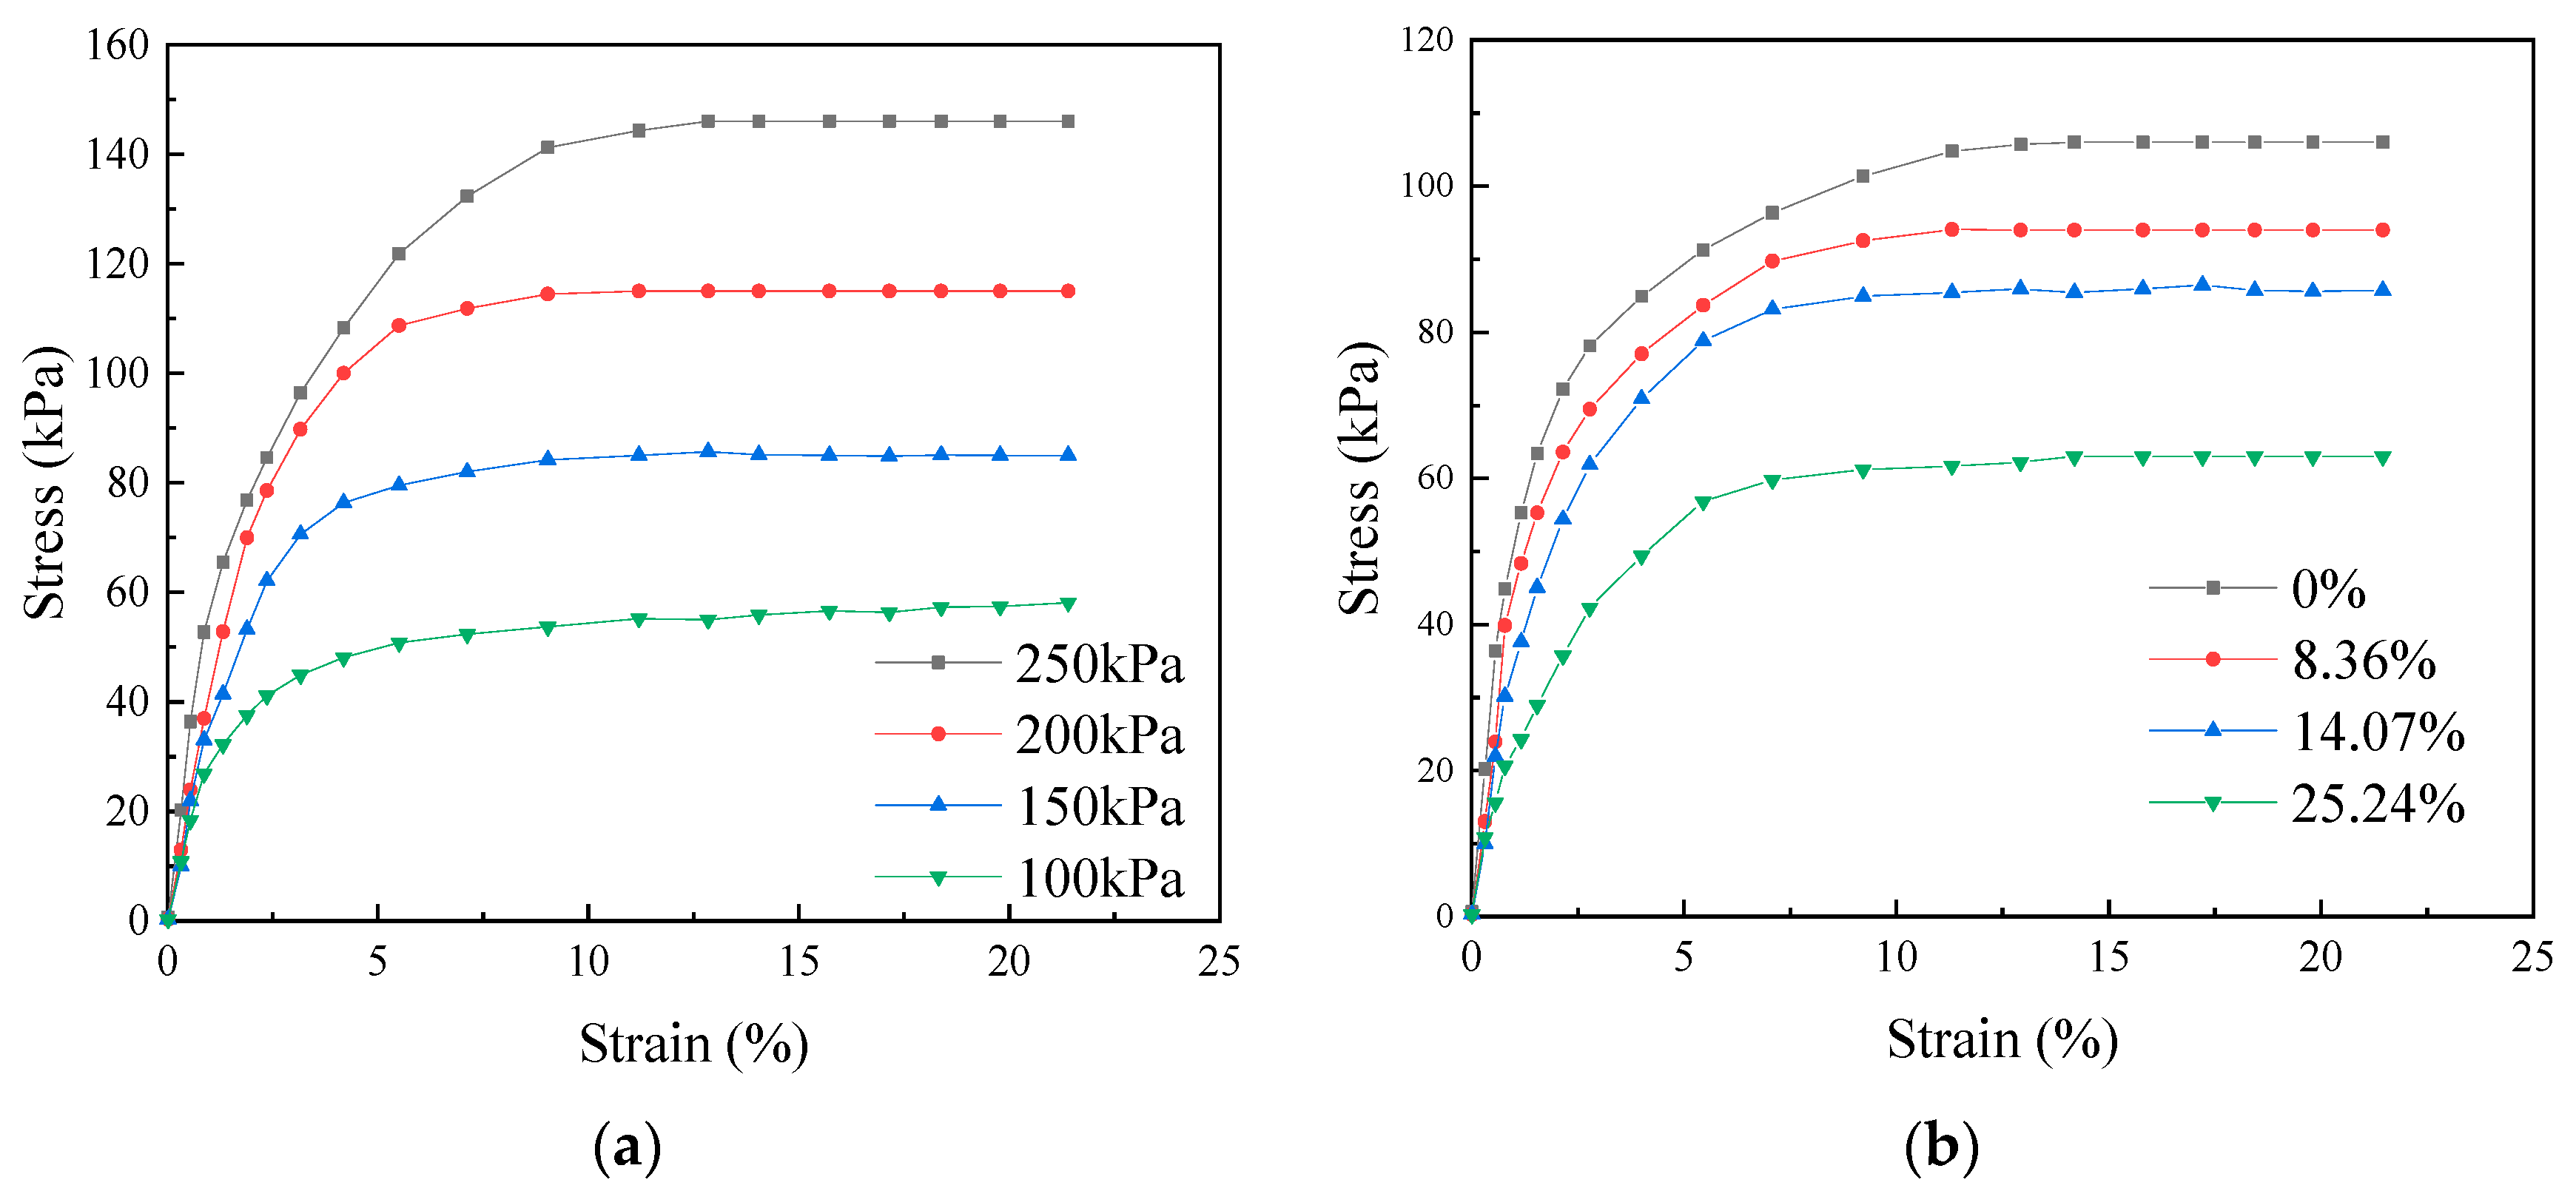
Following the triaxial shear tests, stress–strain relationship curves of the silt-containing gassy clay are plotted under various confining pressures with identical gas content and under consistent confining pressure with differing gas contents, depicted in
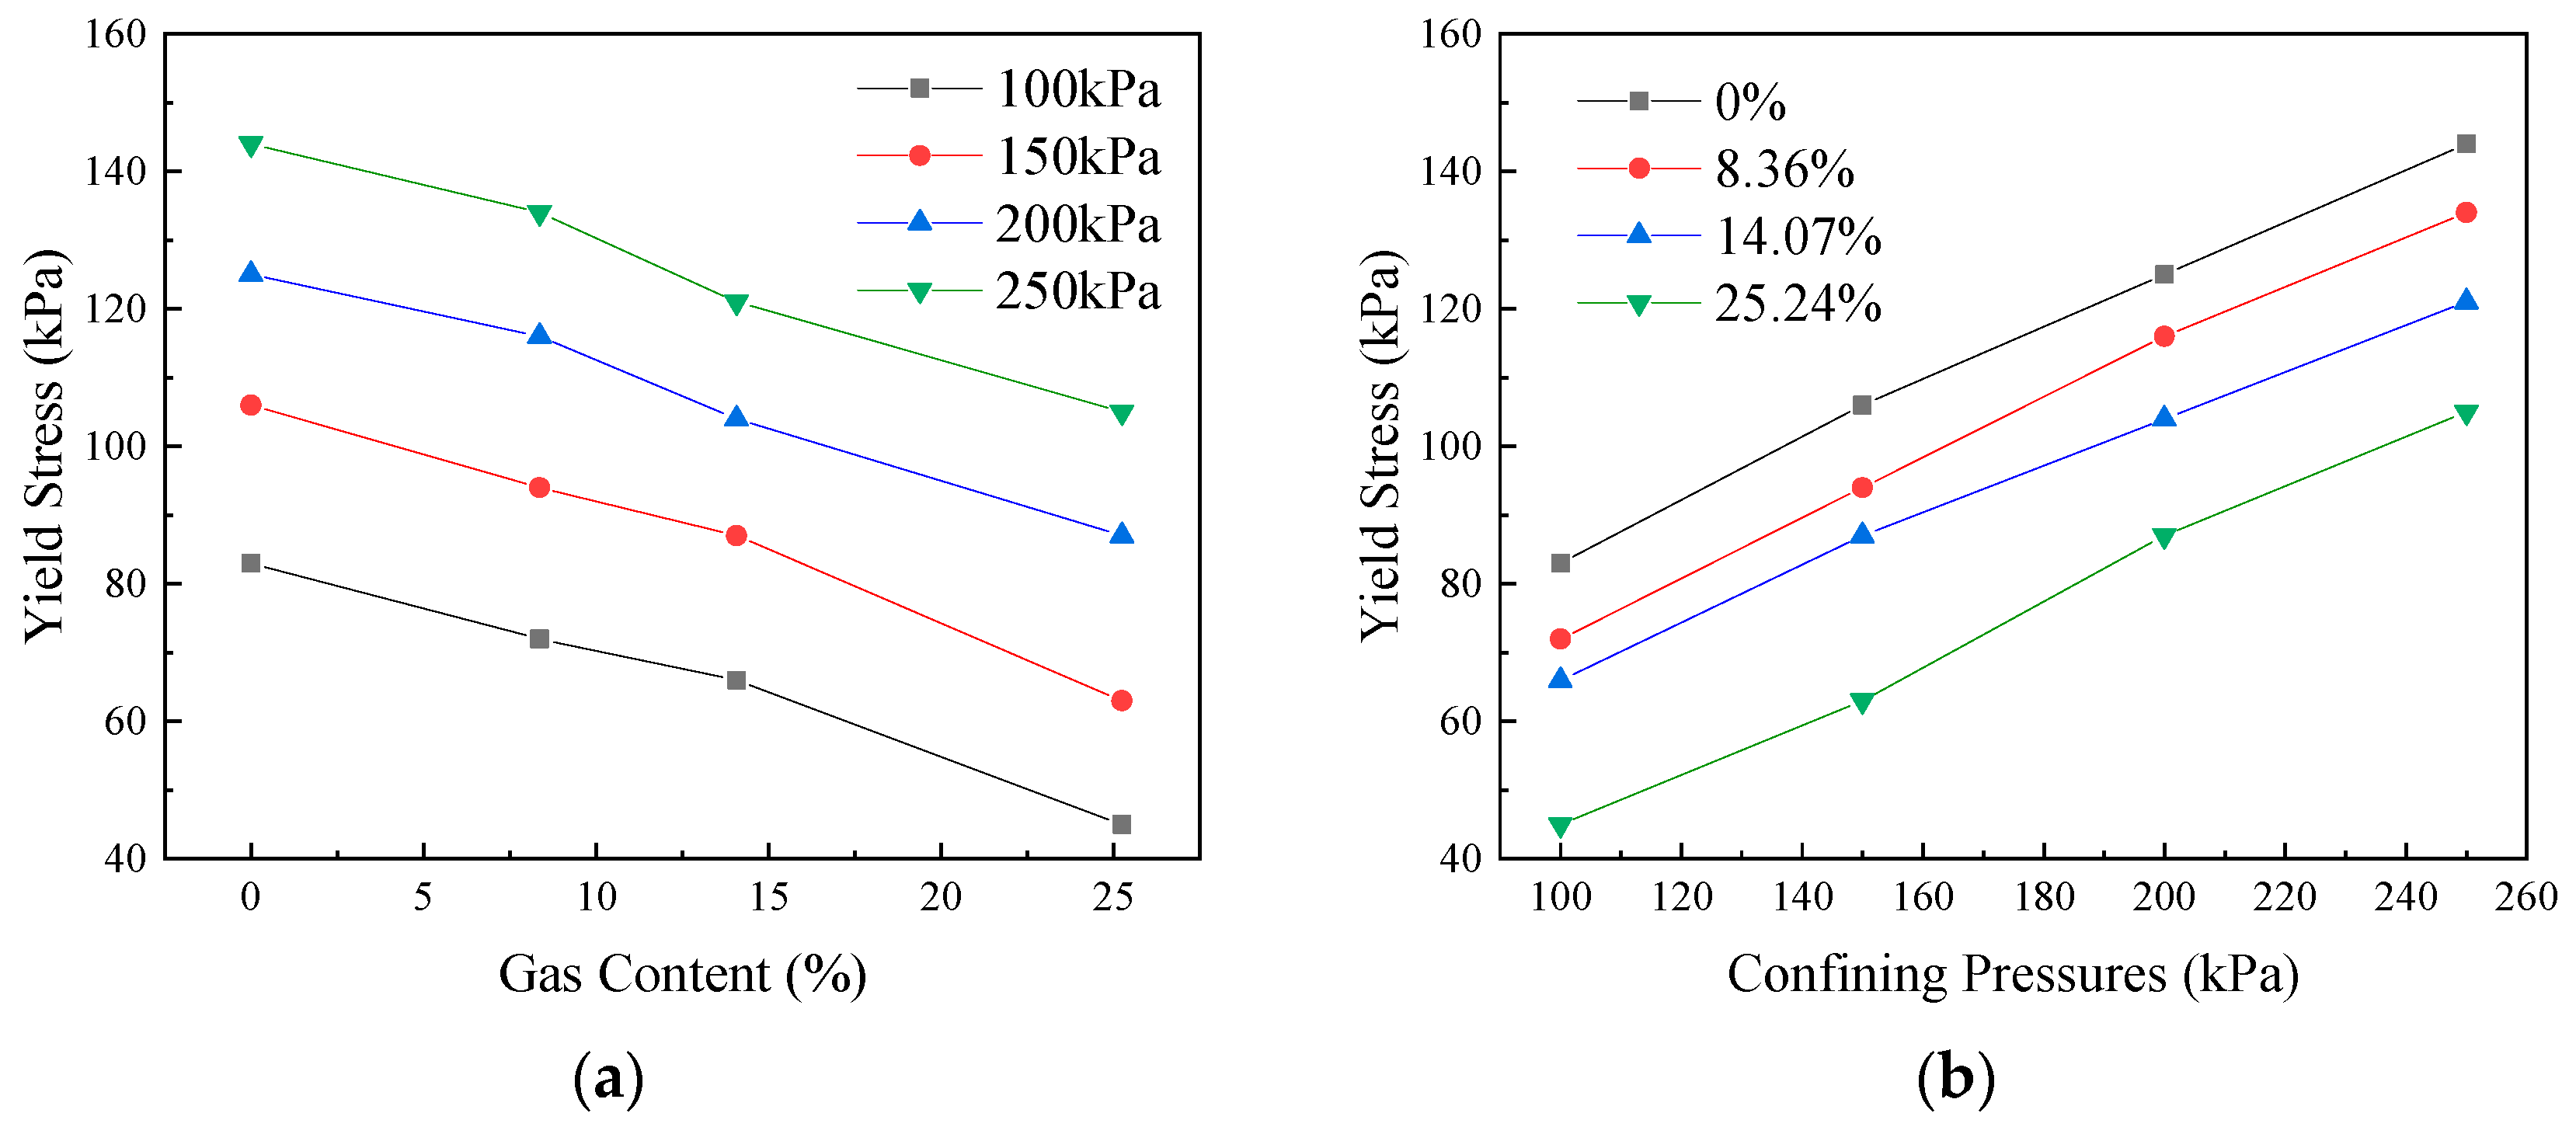
Figure 2 (take the gas content of 14.07% and the confining pressure of 150 kPa as an example). Yield stress distribution curves of the silt-containing gassy clay are plotted under the dual influence of confining pressures and gas contents, depicted in
Figure 3.
An analysis of
Figure 2a reveals that under four distinct confining pressures, stress increases with strain when the specimen’s strain is minimal; as strain reaches a certain threshold, stress remains almost unchanged; when the strain continues to increase, the stress eventually reaches a stable state and no peak value appears, indicating that the stress–strain relationship curve of silt-containing gassy clay exhibits a characteristic strain-hardening pattern [
21]. Additionally,
Figure 2a underscores the significant influence of confining pressure on the stress–strain characteristics of the specimen when the gas content remains constant. Higher confining pressures correspond to greater stress levels exhibited by the specimen at identical strain levels, alongside elevated yield stress and the corresponding strain.
From
Figure 2b, it is evident that for the four different gas contents, as the strain on the specimen remains minimal, the stress increases proportionally with strain; as the strain reaches a certain threshold, the stress relatively stabilizes; and when the strain continues to increase, the stress eventually reaches a constant state and no peak value appears, indicating that the stress–strain curve of silt-containing gassy clay demonstrates a typical strain-hardening pattern [
21]. Additionally,
Figure 2b illustrates the significant impact of specimen gas content on its stress–strain relationship under identical confining pressures. Specifically, lower gas content correlates with higher stress levels at equivalent strains, resulting in increased yield stress and strain. Notably, when the gas content of the specimen is zero, stress peaks at the same strain, as do the yield stress and its corresponding strain.
Comparing
Figure 2a,b reveals consistent trends in the stress–strain relationship curves of the specimens. Both sets exhibit strain-hardening behavior. Notably, variations in confining pressure and gas content markedly influence the stress–strain relationship. Higher confining pressure or lower gas content results in greater stress levels at an equivalent strain, alongside elevated yield stress and strain.
It can be seen from
Figure 3 that at each level of confining pressure, the yield stress of the soil sample tends to decrease with the increase in gas content, and the relationship is linear; at each level of gas content, the yield stress of the soil sample tends to increase with the increase in confining pressure, and the relationship is also linear. According to the phenomenon in
Figure 3, we believe that the gas content directly affects the yield stress but has no effect on the relationship between the yield stress and the confining pressure. Similarly, the confining pressure directly affects the yield stress but has no effect on the relationship between the yield stress and the gas content; that is,
3.2. Analysis of Creep Characteristics
Based on the test loading schemes outlined in
Table 3 and
Table 4, triaxial creep tests were conducted on the prepared silt-containing gassy clay. Subsequent to the creep tests, full-process creep curves were plotted for the silt-containing gassy clay under identical gas content with varying confining pressures and under identical confining pressure with varying gas contents, as illustrated in
Figure 4 and
Figure 5.
Figure 4 and
Figure 5 reveal that with consistent gas content and varying confining pressures, or with consistent confining pressure and varying gas contents, the axial strain of the specimen exhibits a consistent pattern of change over time following the application of each deviatoric stress level. The axial strain gradually increases with time, ultimately reaching stabilization, indicating a decaying development of creep. Subsequent applications of deviatoric stress consistently result in greater axial strain compared to the preceding levels.
Figure 4 further demonstrates that when the applied deviatoric stress is below the yield stress observed in conventional triaxial shear tests with the same confining pressure, the axial strain of the specimen increases relatively slowly over time, with a smaller magnitude of increase and a smaller stable-state axial strain. Conversely, when the applied deviatoric stress approaches the yield stress observed in conventional triaxial shear tests under the same confining pressure, the increase in axial strain becomes more pronounced over time, with a larger magnitude of increase and a larger stable-state axial strain.
Analyzing the phenomena depicted in
Figure 4 and
Figure 5, when the applied deviatoric stress is below the yield stress observed in conventional triaxial shear tests under the same confining pressure, the structure of the gassy soil remains intact. Consequently, the shear deformation exhibited by the specimen primarily entails elastic deformation. Conversely, when the applied deviatoric stress approaches the yield stress resulting from the same confining pressure as in conventional triaxial shear tests, the structure of the gassy soil experiences partial disruption. As a result, the shear deformation undergone by the specimen includes both elastic and plastic deformation. However, owing to the presence of confining pressure, the axial strain of the specimen can stabilize. Upon surpassing the yield stress observed in conventional triaxial shear tests with the same confining pressure, the structure of the gassy soil undergoes complete breakdown. At this juncture, the shear deformation displayed by the specimen primarily involves plastic deformation. Nevertheless, as the test’s confining pressure remains at a level higher than the deviatoric stress, the specimen continues to exhibit a state of decaying creep by the end of the test.
3.3. Long-Term Resilience Prediction Model
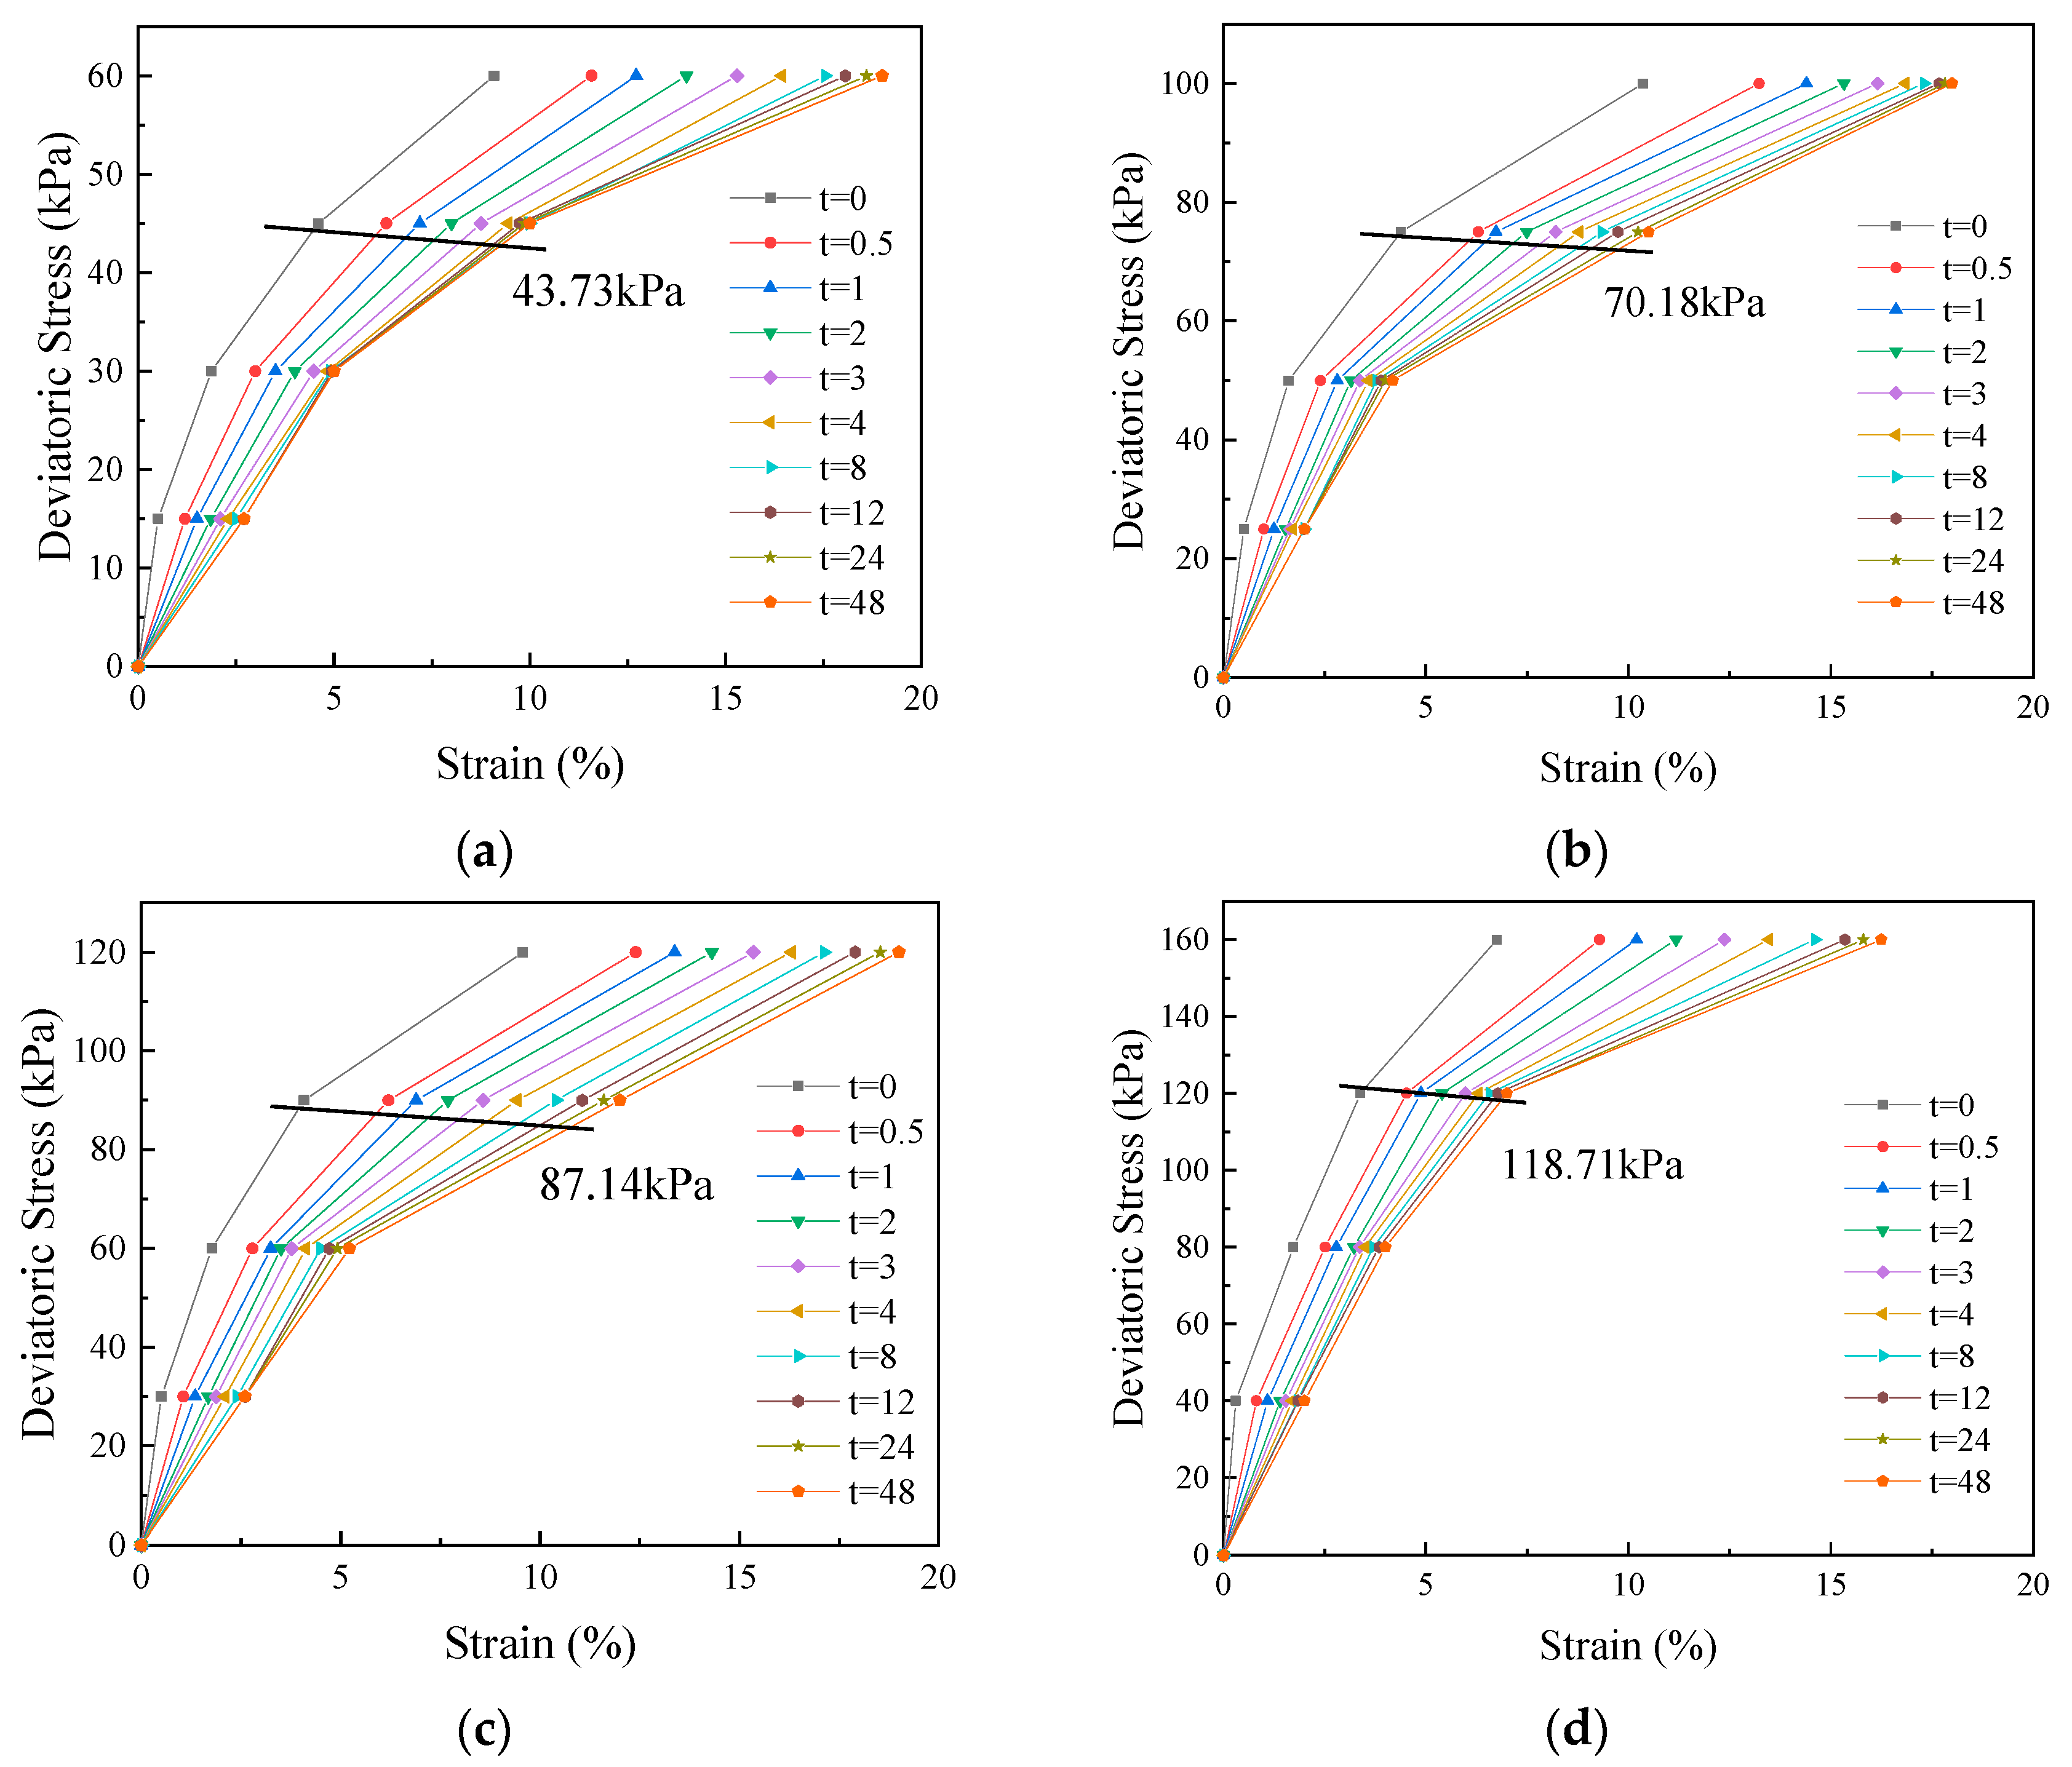
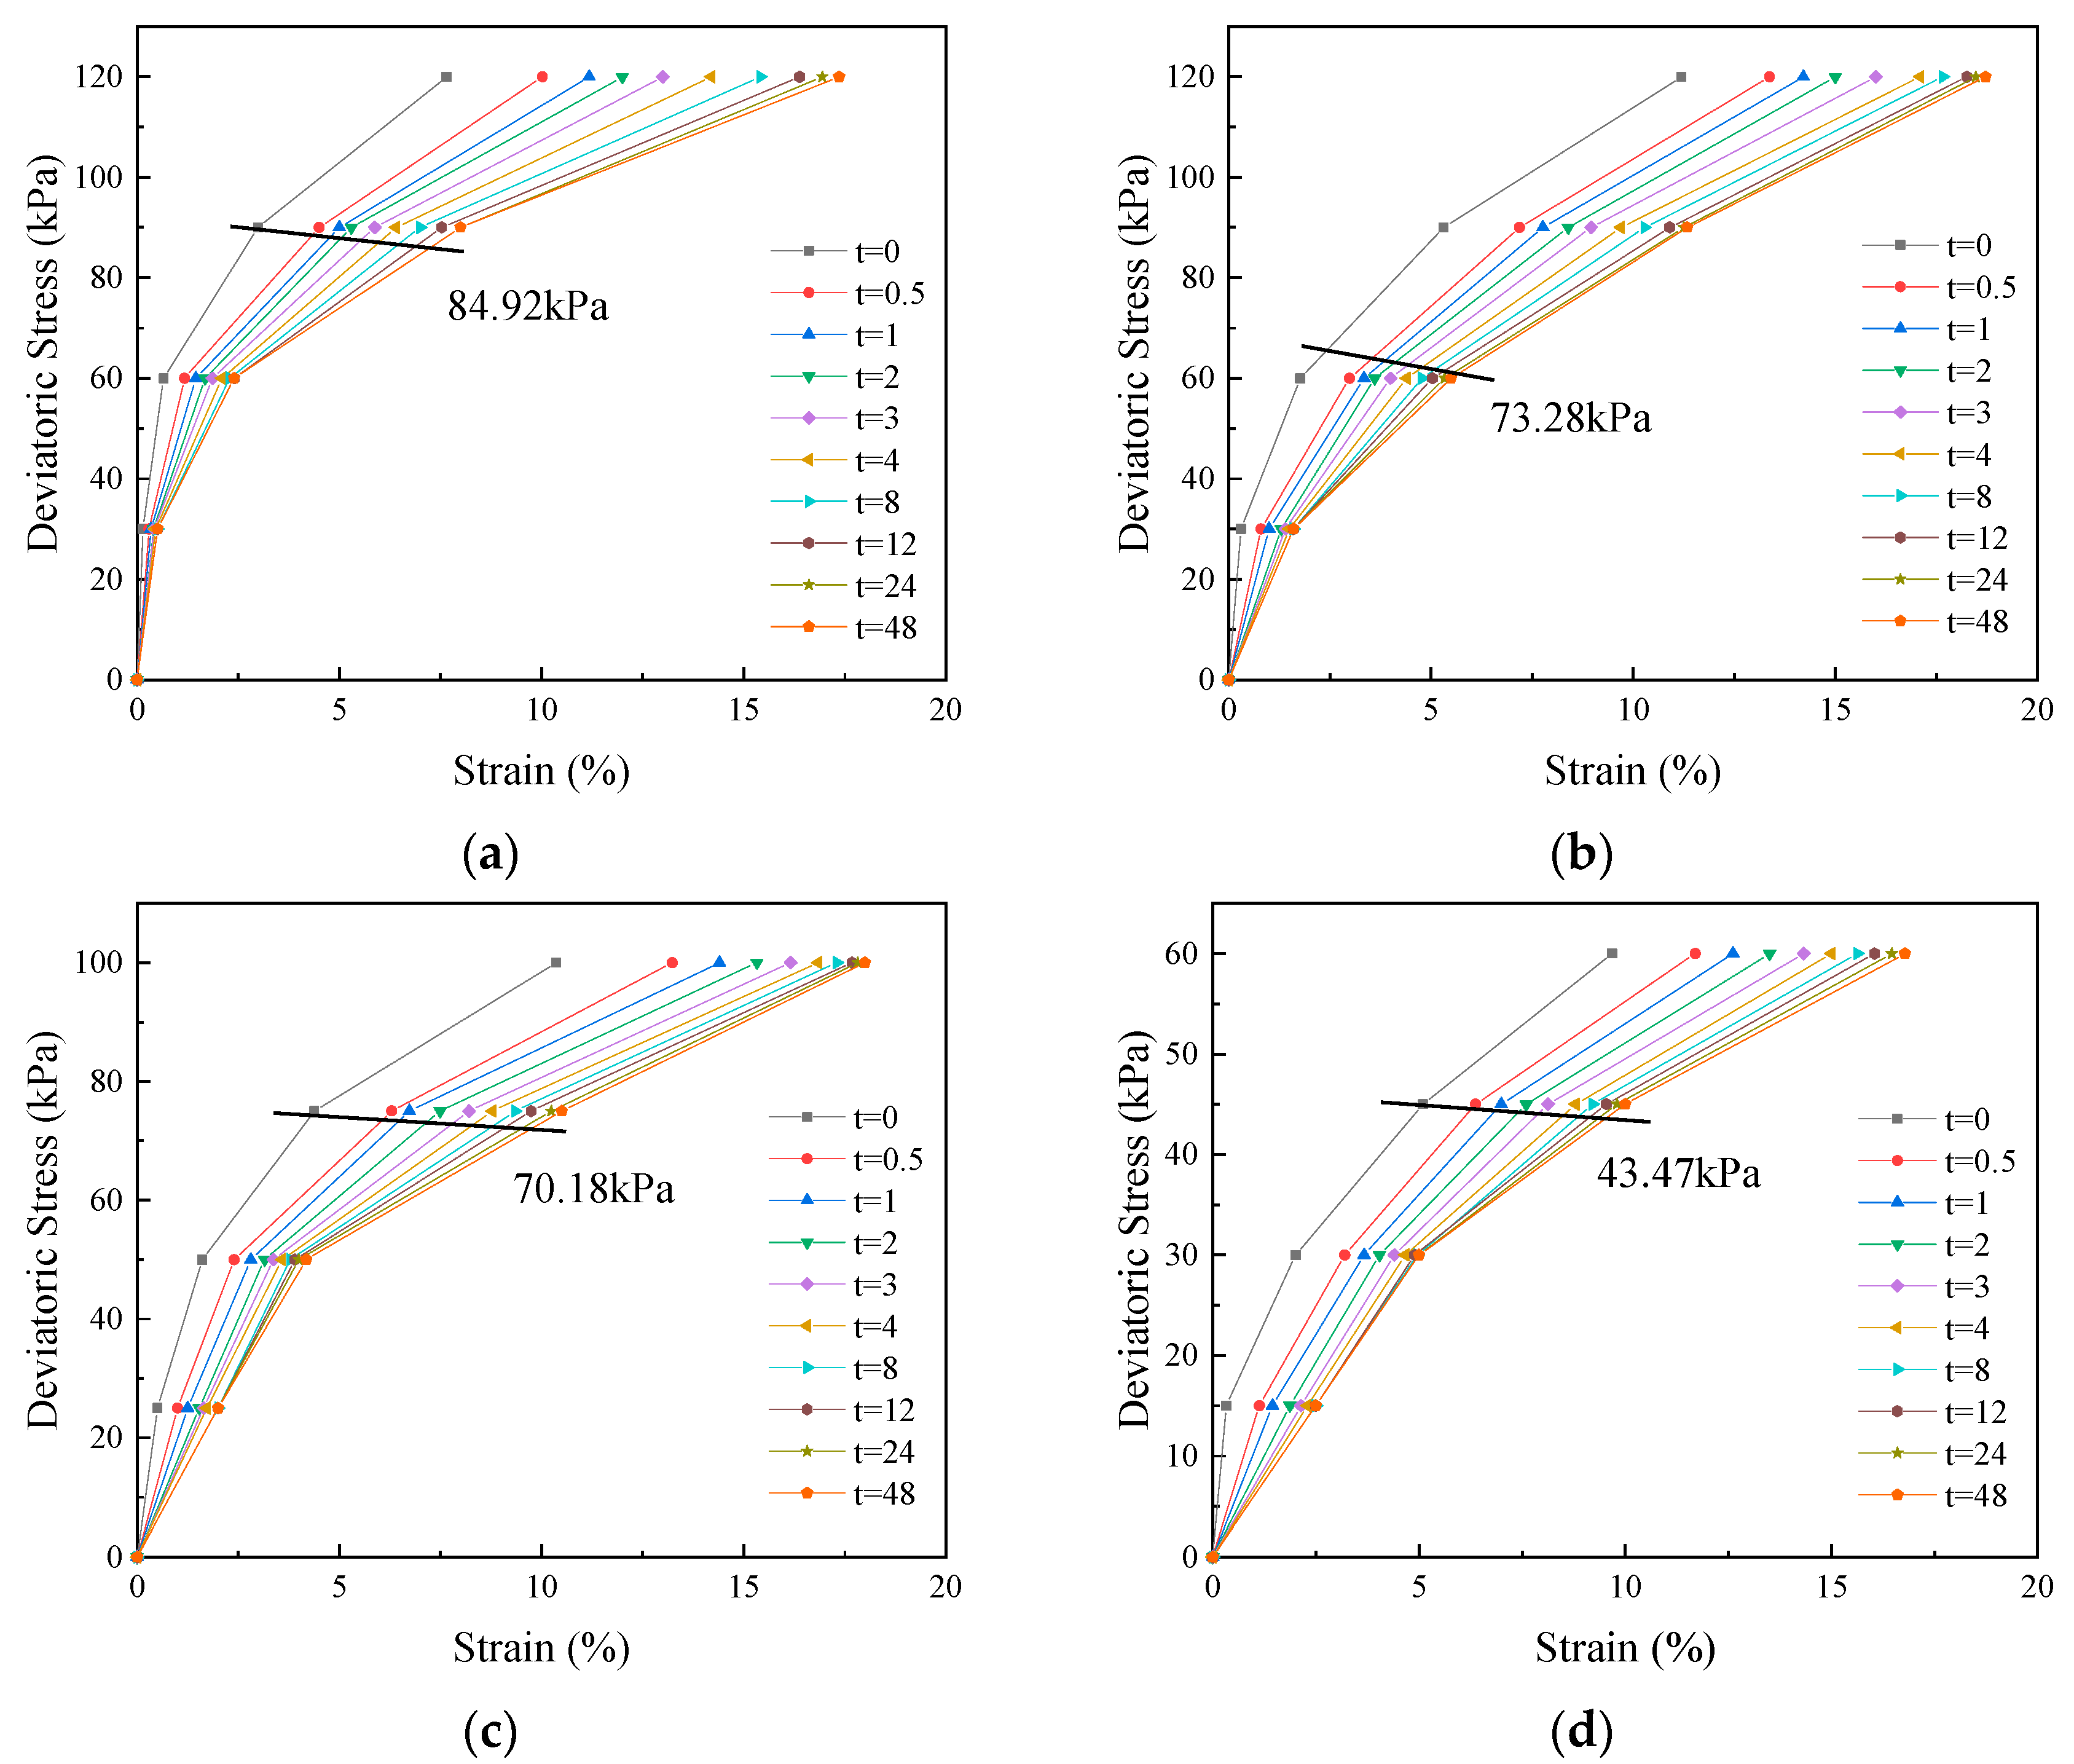
Figure 4 and
Figure 5 serve as the basis for plotting isochronous stress–strain curves during the creep process of the specimen. Time points are selected at 0, 0.5, 1, 2, 3, 4, 8, 12, 24, and 48 h, as depicted in
Figure 6 and
Figure 7.
From
Figure 6 and
Figure 7, it is evident that the stress–strain isochronous curves of the specimen can be roughly categorized into three stages: the first stage exhibits approximate linearity with a consistent slope, signifying the elastic stage of the specimen; the second stage demonstrates a small degree of non-linearity with a progressively decreasing slope, indicating the viscoelastic stage; and the third stage showcases significant non-linearity with a notably reduced slope, suggesting the onset of internal soil structure breakdown and the specimen’s entry into the viscoplastic stage. According to the definition of long-term resilience, the deviatoric stress value corresponding to the inflection point between the second and third stages of the curve is considered the long-term resilience of the specimen.
Using the stress–strain isochronous curves in
Figure 6 and
Figure 7, the long-term strength of silt-containing gassy clay was determined for similar gas content but different confining pressures and for the same confining pressure but different gas contents. The results are presented in
Table 5 and
Table 6.
From
Table 5 and
Table 6, we observe a positive correlation between the long-term strength of the soil and the confining pressure when the gas content remains constant. This correlation arises due to the confining pressure’s role in restraining the lateral deformation of the soil body, thus maintaining its internal structure stability and augmenting the sample strength. Conversely, with a constant confining pressure, there exists a negative correlation between the long-term resilience of the soil and gas content. This negative correlation stems from increasing porosity between soil particles of the gas in the soil, which diminishes soil integrity.
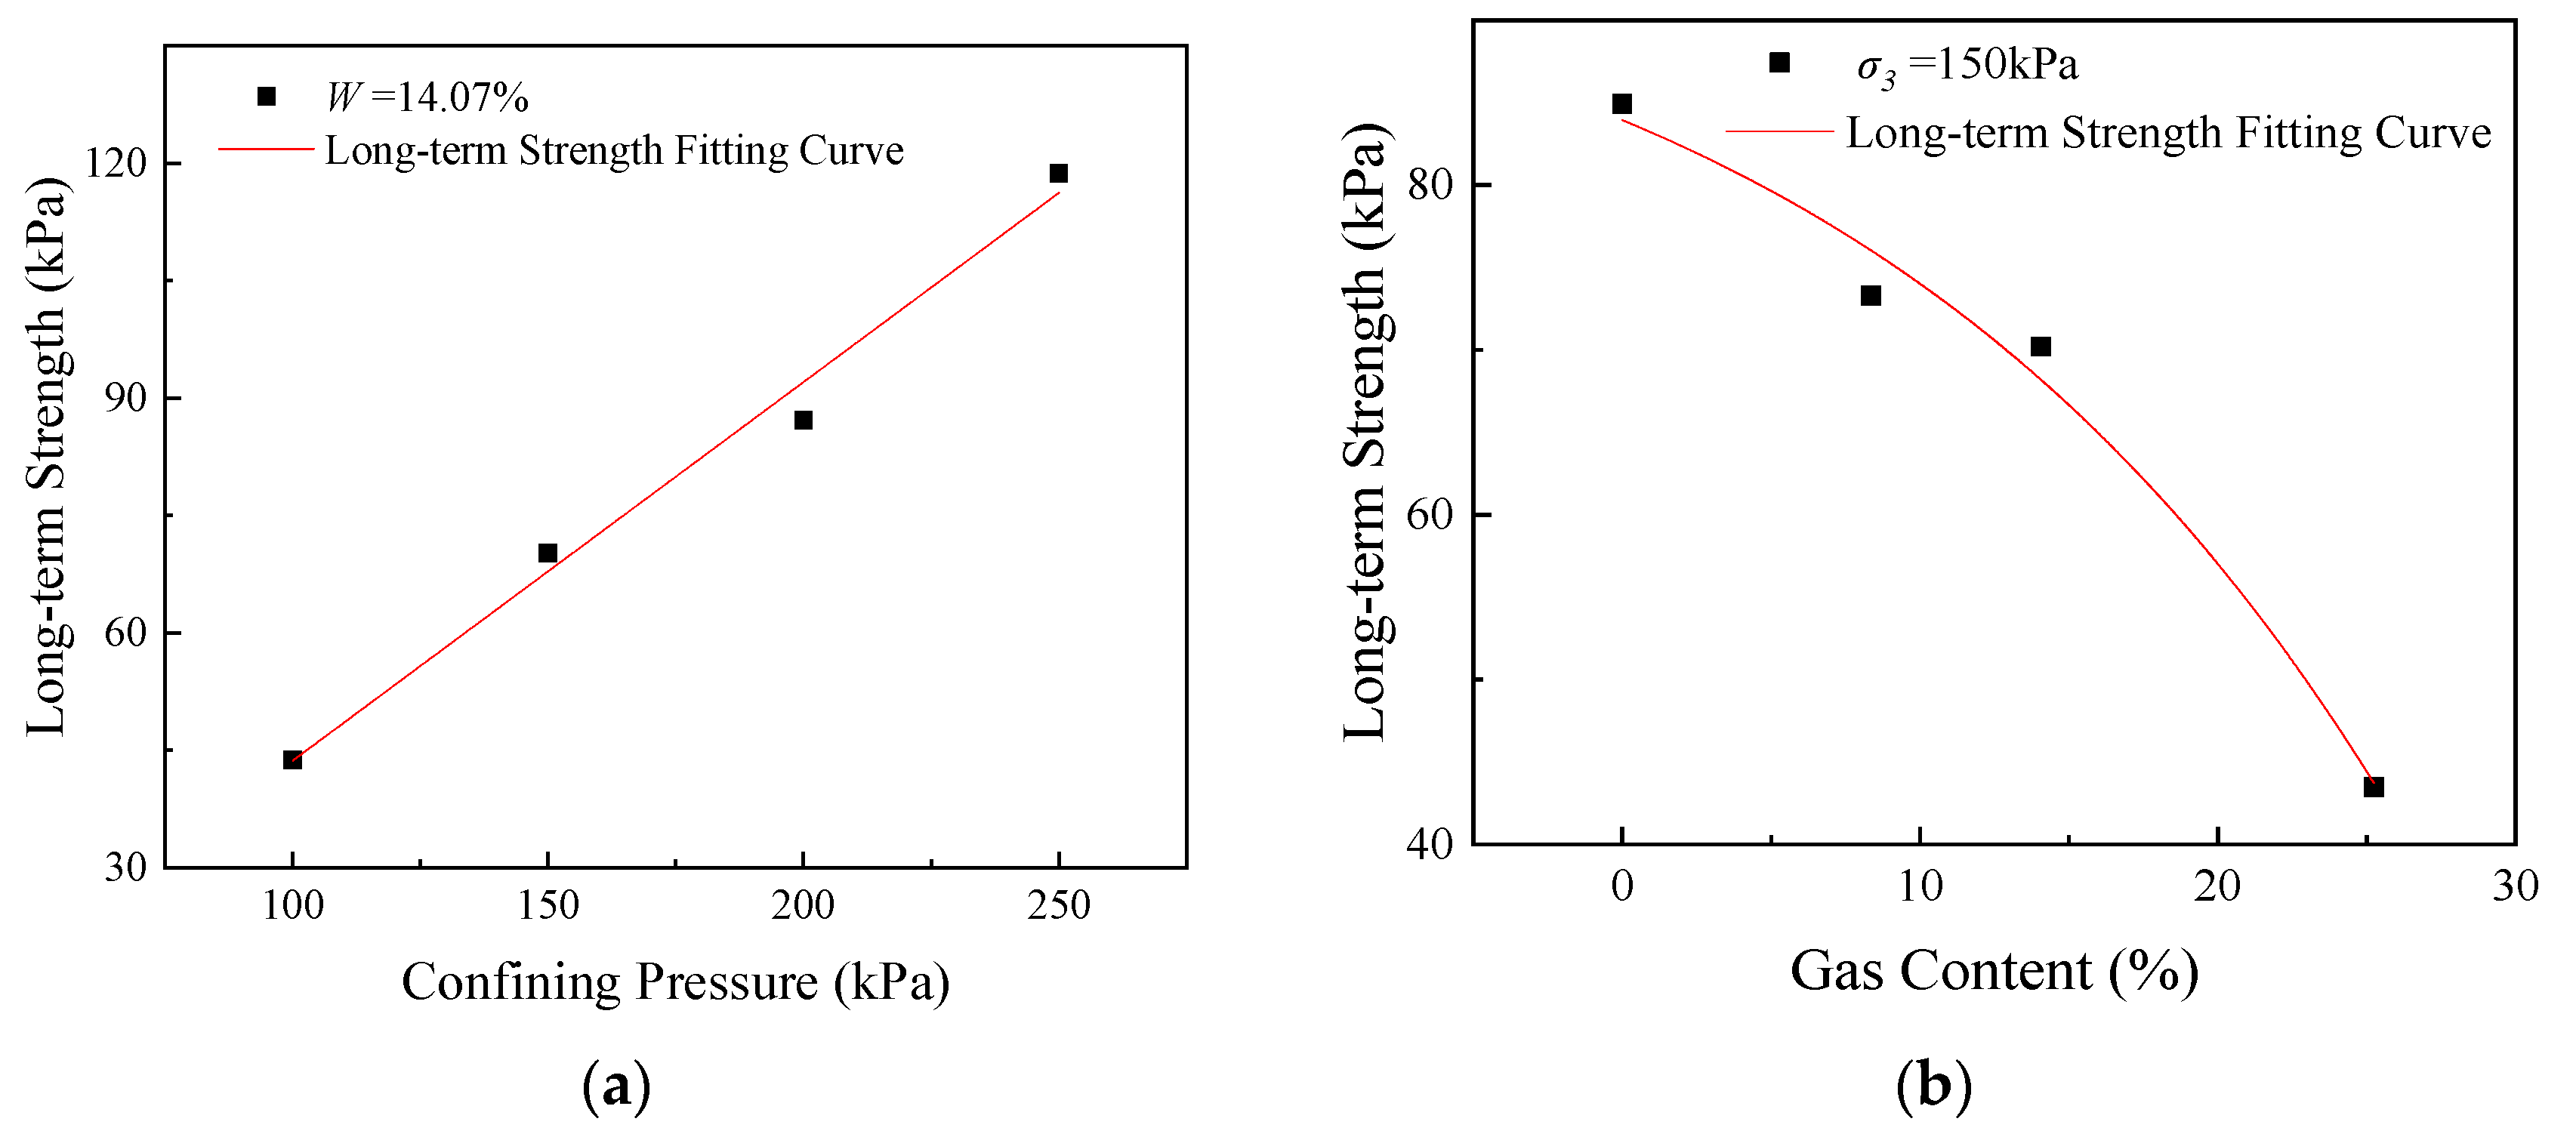
Curves depicting the long-term strength of gassy soil in relation to both confining pressure and gas content are derived from
Table 5 and
Table 6, as illustrated in
Figure 8.
Based on
Figure 8, the fitted relationship between the long-term resilience,
τ, of gassy soil and the confining pressure,
σ3, is expressed as
Based on
Figure 8, the fitted relationship between the long-term strength,
τ, of gassy soil and the gas content,
W, is described as
Integrating gas content
W into both sides of Equation (1) results in the following:
where
g1(
σ3) can be any function with independent variable confining pressure
σ3.
Integrating confining pressure
σ3 into both sides of Equation (4) results in
where
h(
W) can be any function with independent variable gas content
W.
Substituting Equations (2) and (3) into Equation (7) results in
Substituting the fitting results of
Figure 8 into Equation (8) yields
Equation (9) effectively characterizes the long-term resilience of silt-containing gassy clay.
To validate the efficacy of Equation (9), gassy soil with a gas content of 20.68% was prepared for triaxial creep tests to determine the long-term resilience of the sample. Simultaneously, the long-term resilience was calculated using Equation (9), and the results are detailed in
Table 7 and
Figure 9.
Table 7 and
Figure 9 indicate a close proximity between the calculated and measured results of the long-term resilience of gassy soil, affirming the feasibility of employing Equation (9) for calculating the long-term resilience of silt-containing gassy clay.
To further verify whether Equation (9) can be generalized to gassy clay in other regions, we substituted the gas content and confining pressure of gassy clay (from Somerset, UK) in reference [
22] into Equation (9) for calculation and compared the calculated results with the measured values in reference [
22]. However, in reference [
22], the addition of zeolite leads to a decrease in the saturation of gassy clay, and under different confining pressures, the rate at which the saturation of gassy clay decreases with the addition of zeolite is different. To avoid the influence of different saturations on the calculation results of Equation (9), we only selected the gas content corresponding to the same saturation (from 20% to 40%) and substituted it into Equation (9) for calculation. The results are detailed in
Table 8.
Table 8 indicates a close proximity between the calculated and measured results of the long-term resilience of gassy soil, affirming the feasibility of generalizing Equation (9) for calculating the long-term resilience of silt-containing gassy clay in other regions.
Comparing
Table 7 and
Table 8 reveals that when using Equation (9) to calculate silt-containing gassy clay from other regions, its relative error increases slightly but is still within an acceptable range overall.
4. Discussions
This paper uses the silty clay of a borehole 8.1–29.9 m deep in a super-large diameter cross-river tunnel project as raw soil, combines the laboratory “zeolite method” to prepare silt-containing gassy clay, and studies the mechanical properties of gassy soil such as triaxial shear strength and long-term creep strength based on triaxial shear tests and creep tests, combined with test results, theoretical analysis, and prediction models. The main research results are as follows:
(1) Indoor geotechnical tests were conducted on the raw soil to measure its basic physical and mechanical indicators. The process of preparing silt-containing gassy clay by the “zeolite method” was introduced. At the same time, the composition ratio table of each component when preparing the soil sample and the pretreatment method of the soil sample before the triaxial test were given before the test.
(2) The triaxial test results show that the increase in confining pressure and the decrease in gas content both increase the yield stress value of silt-containing gassy clay, and the stress–strain curve relationship presents a typical strain hardening type, revealing the influence of gas content on the mechanical properties of silt-containing gassy clay, providing a basis for subsequent creep tests.
(3) From the full-process creep curve, it can be seen that the increase in gas content and confining pressure has the opposite effect on soil deformation. When other conditions are the same, the increase in confining pressure makes the deformation of silt-containing gassy clay smaller; similarly, when other conditions are the same, the increase in gas content makes the deformation of silty gas-containing clay faster. This phenomenon is due to the fact that high confining pressure can better suppress the lateral deformation of the soil and keep the soil stable, while the presence of gas in the soil changes the relatively stable state of the soil itself. The presence of gas in the soil causes the internal structure of the soil to be destroyed, and the strength of the soil is reduced, and the degree of damage increases with the increase in gas content.
(4) From the stress–strain isochronal curve, it can be seen that the increase in confining pressure has a positive effect on the structural stability of the soil, while the presence of gas weakens the structural strength of the soil itself, causing the structural attenuation of the soil under low deviatoric stress loading, which accelerates the deformation of the soil. In addition, the long-term strength is selected according to the stress–strain isochronous curve cluster method. When the gas content is constant, the long-term strength of the soil is positively correlated with the confining pressure; when the confining pressure is constant, the long-term strength of the soil is negatively correlated with the gas content.
(5) By analyzing the test results, a predictive relationship between the conventional triaxial yield stress of silty clay and the gas content and confining pressure was established, and the prediction effect was verified to be good.
(6) Compared to the complex derivation process and numerous parameters in traditional constitutive models, our long-term strength calculation model for silt-containing gassy clay can quickly calculate the long-term strength of saturated silt-containing gassy clay with fewer parameters.
Future research can be improved in the following directions:
(1) In future research, it will be possible to consider studying the triaxial creep characteristics under drainage conditions or more complex stress conditions.
(2) This paper only studies and analyzes the influence mechanism of gas content on the triaxial creep of silty clay under macroscopic conditions. In future research, it will be possible to study the microscopic mechanism of gas content before and after structural damage during creep from a microscopic perspective.
(3) We have not yet derived the long-term strength of unsaturated soil, and the influence of saturation on the long-term strength of gassy soil is also significant.
5. Conclusions
(1) The stress–strain relationship curve of gassy clay with silt content follows a typical strain-hardening pattern; confining pressure and gas content markedly affect this relationship, with higher confining pressure or lower gas content yielding higher stress at an equivalent strain, along with higher yield stress.
(2) With identical gas content, increased confining pressure enhances the long-term resilience of the soil, while lower gas content under the same confining pressure augments the soil’s long-term resilience.
(3) A prediction model was proposed for calculating the long-term resilience of silty clay, taking into account both confining pressure and gas content. The efficacy of this prediction model was validated through experimentation and the literature data. The model can calculate the long-term strength of silty clay with different gas contents, has strong adaptability, and can provide theoretical reference for complex engineering practices.


