Abstract
In this study, the ultrasonic extraction (UAE) of free phenolic compounds and relative biological activities of the Bulgarian peach variety “Filina” was optimized using chemometric techniques (response surface methodology). A Box–Behnken design was used to reveal the variation in the hydro module, temperature, duration, and extractant on the total phenolic content, total flavonoid content, antioxidant potential, and inhibitory activity on each yield. The results revealed that the optimal conditions included a hydro module of 20, a duration of 39.33 min, a temperature of 70 °C, and an extractant of 96.64% to retrieve the highest level of bioactive compounds. The calculated parameters were discovered to be following the projected values.
1. Introduction
Prunus fruits are constantly studied for their beneficial properties as well as their highly preferred taste. Fruits in general are not consumed in quantities that are suggested by the World Health Organization (WHO) [1]. Efforts have been made to promote their consumption. The genus Prunus is probably spread and known worldwide, which explains the interest in creating new varieties as well as intraspecific hybrids [2]. Prunus persica L. fruits provide a wide range of local and introduced varieties that ripen from June to October. Local varieties are often understudied in terms of their bioactivity. The “Filina” peach variety is a native Bulgarian variety that has not been promoted enough, although it has shown its potential. The variety is a result of the combination of “July Lady” and “Maycrest”. Authors have documented its chemical composition as well as its antioxidant properties [3] and enzyme inhibition abilities [4]. The majority of the significant polyphenol compounds, i.e., flavonoids, and phenolic acids can be found in peach fruits [5].
Phenolic compounds are often associated with enhanced health—both free and bound phenolics, as the main research has focused on free phenolics [6]. The biological advantages of fruit phenolic compounds are widely studied and the results continue to prove the fruits’ abilities to positively alter conditions like increased insulin levels, cholesterol levels, cancer cell growth, and inflammation, among others [7]. Phenolic compounds are beneficial not only to the food industry but also to fields like cosmetology and pharmacology. Each research design followed a different extraction approach, as there is no unified extraction method that has shown maximum efficiency. Polarity variation of the solvent has shown that differences exist in the properties of the resulting extracts [8,9]. The extraction of phenolic compounds is dependent on the duration, temperature, solvent/sample ratio, and specificity of the plant matrix, among others. Ultrasound-assisted extraction is often documented as highly potent for plant-based matrices [10]. It is marked by many advantages, i.e., less time and energy involved, lower temperature, and better extract quality [10].
Planning, examining, and foreseeing extraction conditions have all been performed with the use of response surface methodology (RSM). RSM is a reliable and promising tool in terms of bioactive compound extraction [11]. It can help create the most favorable, cost-effective, and sustainable conditions (short extraction, low solvent consumption, minimum environmental impact) [12,13].
This study attempted to optimize the extraction duration, temperature, and solvent ratio to positively alter the number of phenolic compounds and their respective biological activities. This study contributes to the optimization of antioxidant-rich extracts from fruits using mathematical approaches and is a pilot on the “Filina” peaches. The Box–Behnken design was applied to predict the model and to optimize the extraction conditions (temperature, time, liquid/solvent ratio) based on total phenolic and flavonoid contents, as well as antioxidant and enzymatic activities. This work can act as a core for other researchers to assess and quantify the biological activity of Prunus persica L.
2. Materials and Methods
2.1. Fruit Samples
The whole fruit of the Bulgarian peach variety “Filina” was harvested in 2022 undamaged, at eating ripeness (the growth of the fruit had ceased, the fruit had begun to soften, exhibited the representative red color of the variety, and was easily detached), at the Fruit Growing Institute, Plovdiv, BG. No bactericides were applied to plants during testing. The fruits were cut into pieces with a ceramic knife and quickly frozen. After that, they were freeze-dried with a vacuum freeze dryer (BK-FD12S, Biobase, Shandong, China). The dried samples were ground to powder and kept before extraction in a dry and cool place.
2.2. Ultrasound-Assisted Extraction of Free Phenolic Compounds
The extracts, concerning the levels of independent variables in Table 1, were obtained with methanol as a solvent mixed with water (v/v) in an ultrasonic bath operated at a frequency of 35 kHz with a maximum input power of 240 W (UST 5.7150 Siel, Gabrovo, Bulgaria). After that, the extracts were centrifuged at 6000 1/min for 40 min, filtered throughout a syringe filter (0.45 μm), and vacuum-evaporated to dryness (IKA RV10 digital, IKA HB 10 digital water bath-IKA®-Werke GmbH & Co., Germany). The residue was dissolved in 5 mL ethanol and kept in a freezer until further analyses.
Table 1.
Coded and decoded levels of independent variables used in the RSM design.
2.3. Evaluation of the Total Phenolic Content (TPC)
A modified method by Kujala et al. [14] was used for the evaluation of the TPC. Each sample (0.1 mL) was mixed with 0.5 mL Folin–Ciocalteu reagent followed by 0.4 mL 7.5% Na2CO3. The mixture was vortexed and incubated for 5 min at 50 °C. After that, the absorbance was measured at 765 nm. The result is expressed as mg gallic acid equivalents (GAEs) per 100 g fresh weight (mg GAE/100 g fw).
2.4. Evaluation of Total Flavonoid Content (TFC)
The method of Kivrak et al. [15] was applied to evaluate the total flavonoid content. An aliquot of 0.5 mL of the sample was mixed to 0.1 mL of 10% Al(NO3)3, 0.1 mL of 1 M CH3COOK, and 3.8 mL of ethanol. The mixture was incubated at room temperature for 40 min and the absorbance was measured at 415 nm. Quercetin (QE) was used as a standard, and the results are expressed as μg quercetin equivalents (QEs)/100 g fw.
2.5. Evaluation of Antioxidant Activities
2.5.1. DPPH• Radical Scavenging Assay
The radical scavenging activity of the samples, i.e., the ability to donate an electron and scavenge 2,2-diphenil-1-picrylhydrazyl (DPPH) radicals, was evaluated by the method of Brand-Williams et al. [16] with slight modifications [16], as described by Mihaylova et al. [17]. A freshly prepared DPPH• solution (4 × 10⁻⁴ M) was mixed with the samples in a ratio of 2:0.5 (v/v). The absorbance was measured at 517 nm after a 30 min incubation. The DPPH radical scavenging activity results are presented as a function of the concentration of Trolox—Trolox Equivalent Antioxidant Capacity (TEAC), which is defined as the concentration of Trolox with equivalent antioxidant activity expressed as μM TE/100 g fw.
2.5.2. ABTS•+ Scavenging Activity Assay
The scavenging activity of the samples against 2,2′-azino-bis(3-ethylbenzothiazoline-6-sulfonic acid) radical cation (ABTS•+) was estimated according to the method described by Re et al. [18]. The ABTS•+ was produced by mixing an ABTS stock solution (7 mM) with 2.45 mM potassium persulfate and allowing it to stand in the dark at 22 °C for 14 h before use. Then, a dilution of the ABTS•+ solution was performed with ethanol to an absorbance of 0.70 ± 0.02 at 734 nm at 30 °C. For the reaction procedure, 10 µL of the sample was mixed with 1.0 mL of the diluted and tempered ABTS•+ solution and incubated at 30 °C for 6 min. The absorbance was measured at the same temperature against the used solvent. The control sample consisted of a solution prepared in the same manner but with the solvent instead of a sample. The results were expressed as μM TE/100 g fw.
2.5.3. Ferric-Reducing Antioxidant Power (FRAP) Assay
The ferric-reducing antioxidant power was evaluated according to the slightly modified procedure of Benzie and Strain [19]. The FRAP reagent was prepared daily and was tempered at 37 °C before use. A total of 150 µL of the sample was mixed with 2850 µL of the FRAP reagent and allowed to react for 4 min at 37 °C. The absorbance was recorded at 593 nm and the results are expressed as μM TE/100 g fw.
2.5.4. Cupric Ion-Reducing Antioxidant Capacity (CUPRAC) Assay
The cupric ion-reducing antioxidant capacity assay was carried out according to the procedure of Apak et al. [20]. A total of 1 mL of CuCl2 solution (1.0 × 10⁻² M) was mixed with 1 mL of neocuproine solution in methanol (7.5 × 10⁻³ M), 1 mL of CH3COONH4 buffer solution (pH 7.0), and 0.1 mL of sample. The volume was made up to a total of 4.1 mL by adding1 mL of water and then mixing well. The absorbance was recorded against a reagent blank at 450 nm after 30 min of incubation. Trolox was used as a standard and the results are expressed as μM TE/100 g fw.
2.6. Enzyme-Inhibitory Activities
2.6.1. α-Glucosidase Inhibitory Assay (Alfa-Gl)
For the α-glucosidase inhibitory activity assessment, the reaction mixture contained 10 µL of extract (a minimum of five extract concentrations were tested to calculate the IC50) and 30 µL of α-glucosidase (0.1 U/mL, G5003-100UN, Sigma-Aldrich, Merck, Darmstadt, Germany). The mixture was incubated for 15 min at 37 °C in a microplate reader (SPECTROstar Nano Microplate Reader, BMG LABTECH, Ortenberg, Germany). Subsequently, 25 µL of 1 mM 4-nitrophenyl-α-D-glucopyranoside (N 1377, Sigma-Aldrich, Merck, Darmstadt, Germany) was added to the reaction mixture and shaken. The incubation was performed at 37 °C for 10 min. The termination of the reaction was conducted by adding 60 µL of 0.2 M sodium carbonate solution. Blanks were prepared by adding the sample after the termination of the reaction. The absorbance at 405 nm was measured using the microplate reader. An enzyme without an inhibitor acted as a negative control. The α-glucosidase inhibition percentage of blank corrected data was assessed using the following Formula (1):
% Inhibition = 100 − (A405 Blank corrected sample/A405 Blank corrected control) × 100
The results are expressed as a concentration of extract (IC50) in mg/mL that inhibited 50% of α-glucosidase.
2.6.2. Acetylcholinesterase-Inhibitory Assay (AChE)
The acetylcholinesterase-inhibitory potential was assessed based on the method described by Lobbens et al. [21] with slight modifications. The AChE-inhibitory assay was carried out in a 96-well microplate. Each well contained 30 µL of AChE (final concentration of 0.05 U/mL, C3389-500U, Sigma Aldrich, Merck, Darmstadt, Germany), 125 µL 1.5 mM 5,5′-dithiobis (2-nitrobenzoic acid) (DTNB, D 218200, Sigma Aldrich, Merck, Darmstadt, Germany) dissolved in phosphate-buffered saline (PBS) pH 7.5, 45 µL PBS pH 7.5, and 25 µL test solution or 25 µL negative control (water). A corresponding blank sample was prepared by adding buffer instead of enzyme. Then, the microplate was shaken for 10 s and incubated at 30 °C for 5 min. Subsequently, 30 µL of 7.5 mM acetylthiocholine (ATCI, 01480, Sigma Aldrich, Merck, Darmstadt, Germany) dissolved in water was added to each well and the absorbance was measured every 30 s for 1 min at 412 nm. The blank corrected data were plotted against time and the reaction rate (the slope of the plot) was calculated. The corresponding inhibition was calculated by comparing the reaction rate in the test solution compared to the negative control. Each experiment was performed in triplicate.
The inhibition was expressed as a percentage as follows (2):
%inhibition = 100 − (Slope sample/Slope negative control) × 100
The results are expressed as a concentration of extract (IC20) in mg/mL that inhibited 20% of acetylcholinesterase.
2.7. Experimental Design and Statistical Analysis
In the present study, response surface methodology (RSM) was used. Using the Box–Behnken design (BBD), the influence of four independent variables—HM (ratio of solvent to fresh fruit) (X1), Duration (X2), Temperature (X3), and Extractant (X4)—on different physicochemical parameters of peaches was investigated. The coded and actual levels of independent variables used in the RSM design are listed in Table 1. The dependent variables in this study are TPC, TFC, FRAP, CUPRAC, DPPH, ABTS, α-glucosidase, and AChE. They are denoted from Y1 to Y8, respectively. A second-order polynomial equation was used to express these dependent variables as a function of the independent variables as follows:
where Yj (j = 1, 2, …, 8) represents the responses to be modeled; β0 is the constant coefficient; βi is the coefficient of linear effect; βij is the coefficient of interaction effect; βii is the coefficient of squared effect; k is the number of variables; and Xi and Xj define the independent variables (Hydro module (HM) (ratio) (X1), Duration (X2), Temperature (X3), and Extractant (X4)). The statistical significance of the coefficients was verified using the Student’s t-test (α = 0.05), goodness-of-fit was established as the determination coefficient (R2), and the model consistency by the Fisher F test (α = 0.05).
The experimental design and statistical analysis were performed using Design-Expert software (Version 13.0.5.0, State-Ease Inc., Minneapolis, MN, USA). The complete experimental design consisted of 29 experimental runs, taken in random order. Center Points per Block were established at 5 to be able to estimate the pure error sum of squares.
3. Results and Discussion
RMS is a collection of statistical and mathematical techniques useful for developing, improving, and optimizing processes [22]. RMS is preferred because it minimizes the number of experiments for a specific number of factors and their levels [23]. In general, RMS has two main types of designs—the Box–Behnken design (BBD) and the central-composite design (CCD). The BBDs differ from the CCDs in that they use fewer runs and only three levels, compared to the five in CCD. BBDs were initiated to limit the sample size as the number of parameters increased. The BBDs pair well with the green approach for the extraction of bioactive compounds, using the fewest resources possible. For this reason, the BBD was preferred in the present study. Table 2 summarizes the obtained models of this study.
Table 2.
Coded dependent variables used in the RSM design.
The software product Design-Expert defines the dependence of TPC on the input variables as linear (Table 3) with statistically insignificant coefficients in front of the added members. Three factors (hydro module, duration, and temperature) influence the TPC values (Table 4).
Table 3.
ANOVA for Quadratic model for Response 1: TPC.
Table 4.
ANOVA for Linear model Response 1: TPC.
Other temperature-dependent studies on the topic of phenolic compounds are available in the literature [24]. Duration is also reported as critical to phenolic content availability and possible damage and degradation [25].
The Extractant’s effect was not statistically significant. However, many papers reveal that different extracts of the same plant result in different levels of phenolic compounds [26]. The F-value of the model itself is 10.08 and the p-value is <0.0001, indicating that the model is significant. The coefficient of determination is R2 = 0.63, while adjusted R2 = 0.56. The main idea of the “adjusted” R-squared statistic is to “penalize” the addition of terms that do not add statistical value. In this case, the only statistically insignificant term is the D-Extractant factor. Its inclusion in the TPC model caused the R-squared to decrease to a value of 0.56. In addition to the coefficient of determination, the standard error S is also applied as a measure of goodness-of-fit in the regression analysis. S is in the units of the dependent variable. In general, a higher coefficient of determination is usually associated with a smaller standard error of the regression, since a higher fit of the model to the data usually leads to smaller prediction errors. On the other hand, the standard error of the regression may decrease with a larger range of values of the independent variables or with a larger sample size, regardless of the value of the coefficient of determination. The standard error here is 5.4, meaning that the TPC data differ from the regression line by an average of 5.4. Therefore, when estimating the TPC value, an average error of less than 5.4 mg GAE/100 g fw can be expected. 
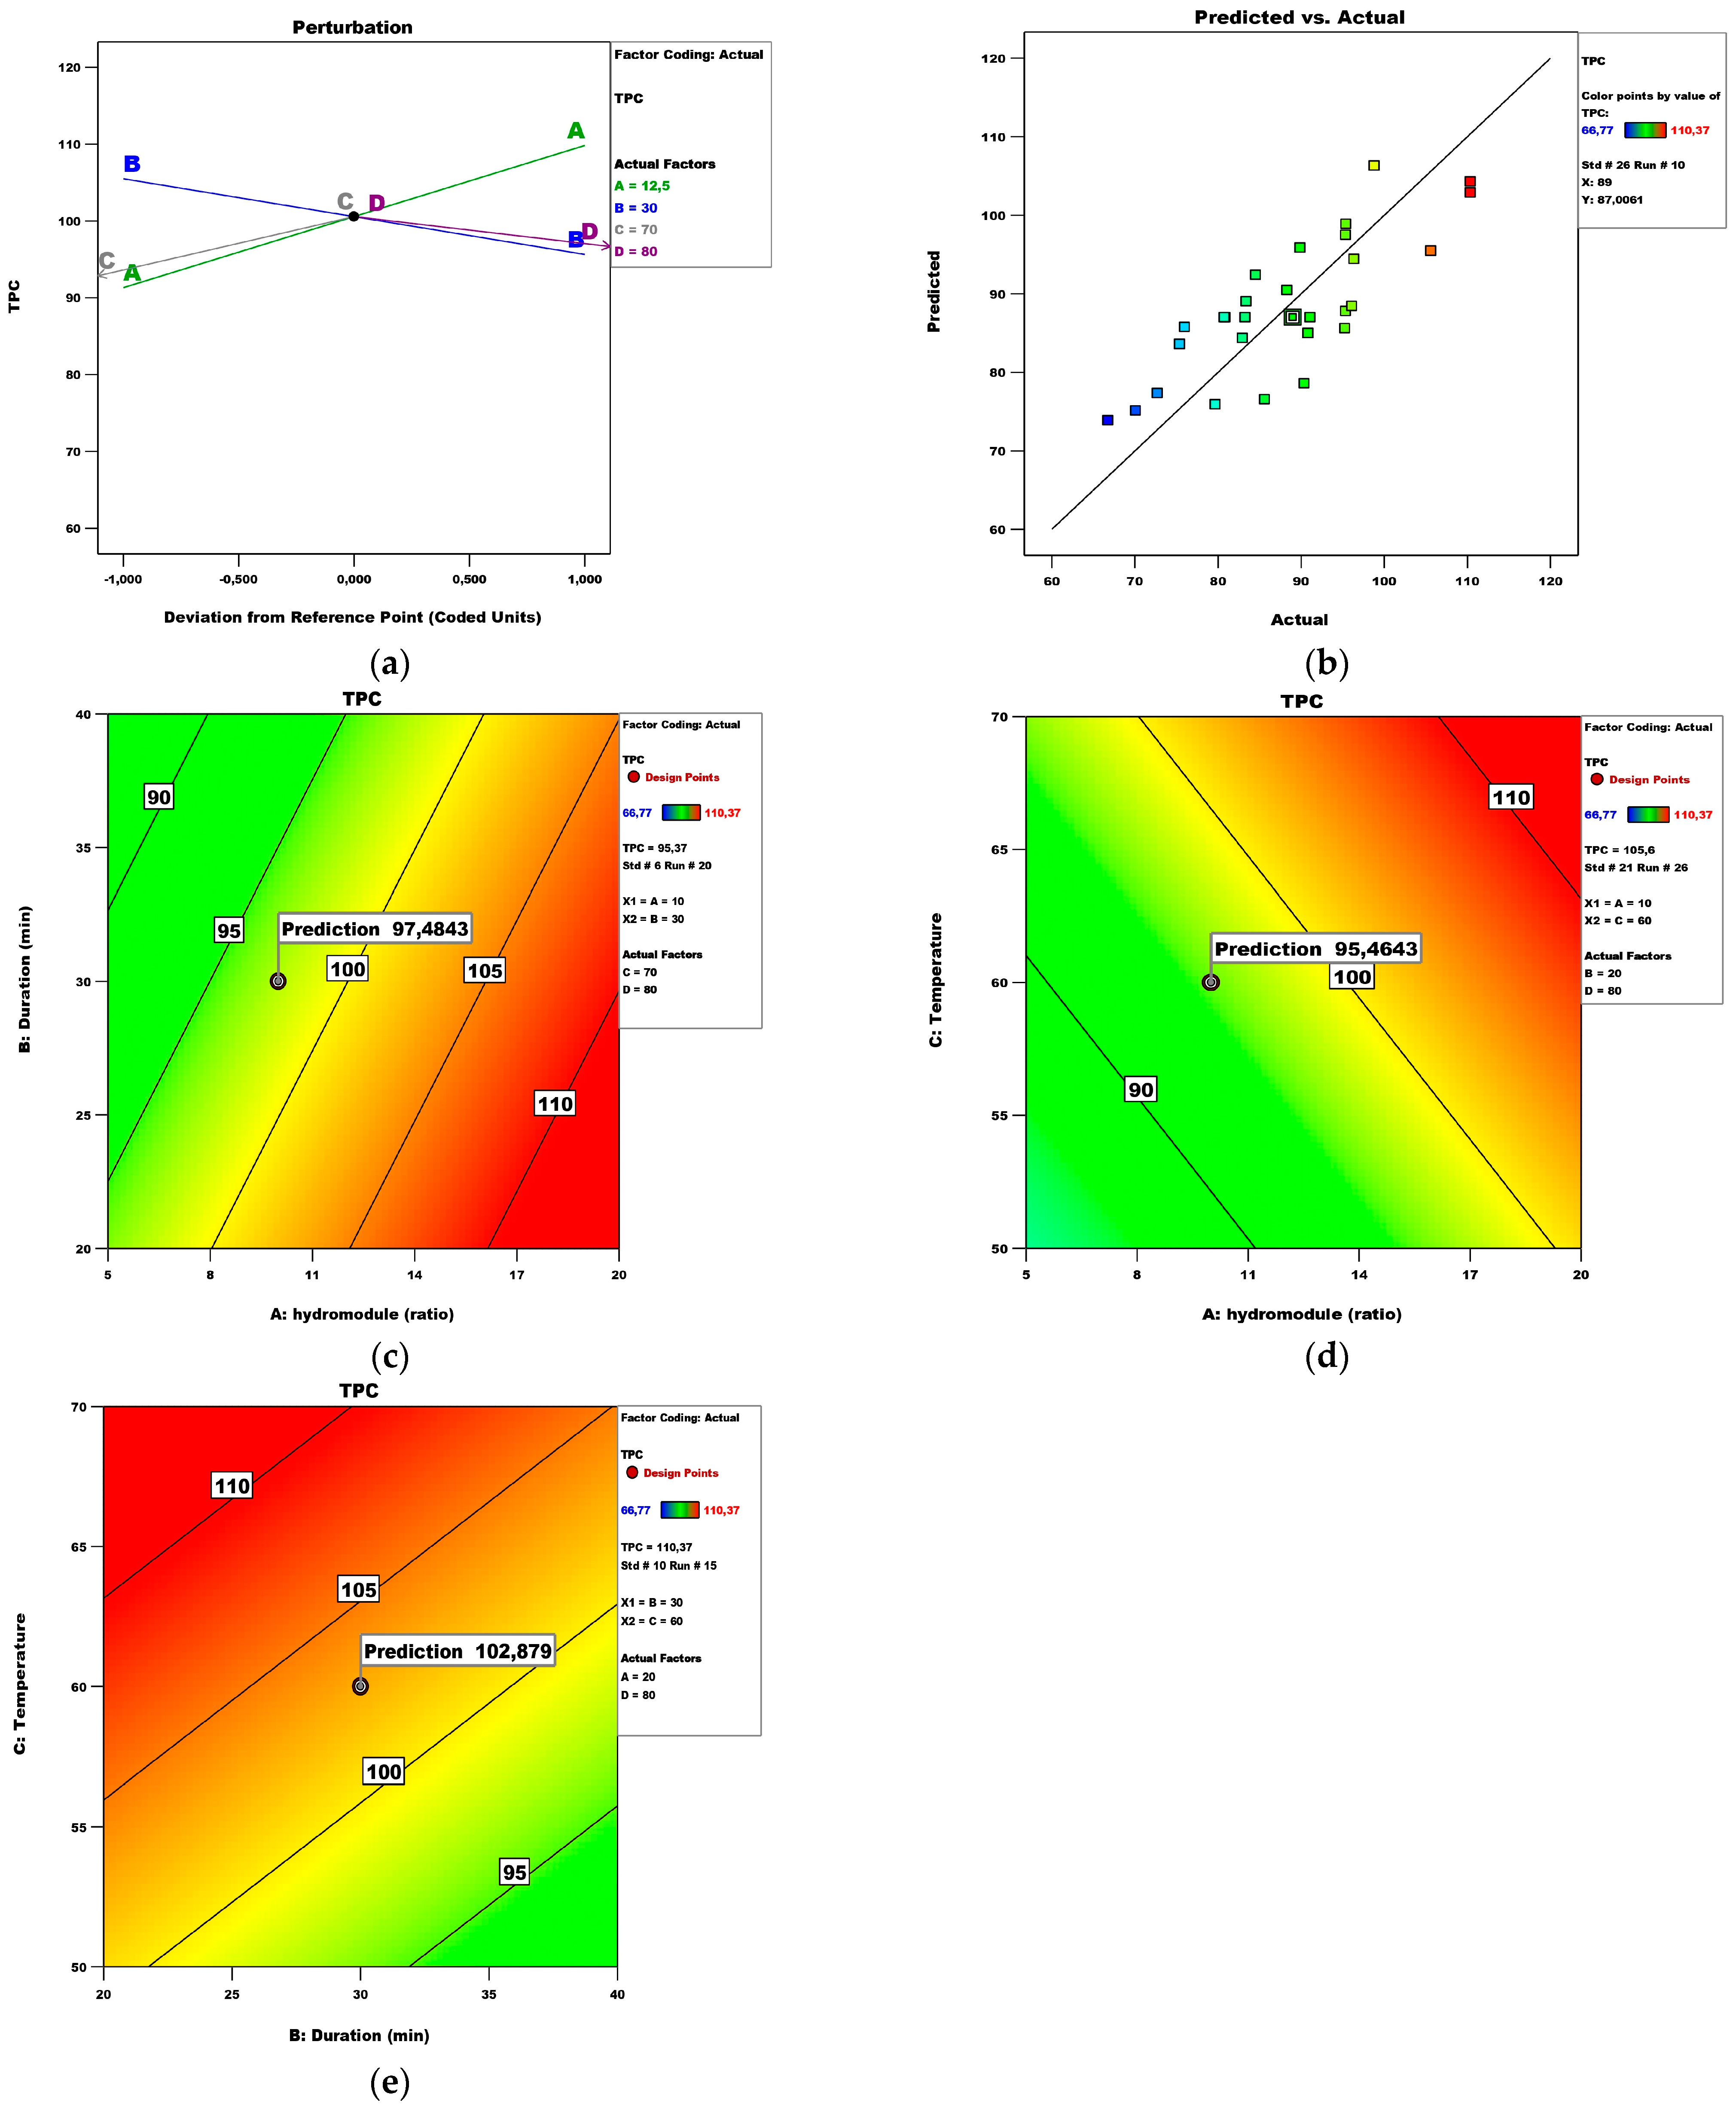
Figure 1 reveals some of the most important model informational graphs. The Perturbation plot (Figure 1a) represents the factors with the most significant influence. The hydro module’s and the duration’s graphs have the steepest slope. Since the extraction of bioactive molecules is evaluated as the first and most important step in functional ingredients to foods, pharmaceuticals, and cosmetology, among others, researchers have pointed out that an increase in the hydro module improves the diffusion rate in a solid–liquid extraction [27]. Figure 1b presents the actual versus predicted values.
Figure 1.
TPC model analysis: (a) Perturbation plot; (b) predicted vs. actual plot; (c) contour surface plots of TPC against hydro module (ratio) and duration (min); (d) contour surface plots of TPC against hydro module (ratio) and temperature; (e) contour surface plots of TPC against duration (min) and temperature.
The response surface plots (Figure 1c–e) visualize the variation in the values of two independent variables within the experimental domain while holding the other two constant. Figure 1c reveals that the maximum TPC value can be achieved by keeping the temperature and the extractant at 70 °C and 80%, respectively. Considering the effect of hydro module and temperature on the TPC (max. 105.596 mg GAE/100 g fw), Figure 1d predicts an optimal duration of 20 min and an 80% extractant (110.37 mg GAE/100 g fw).
Two-factor interaction terms have been added to further describe the dependence of TFC on the input variables. The results within the framework of the model appeared not statistically significant and were not visualized. An attempt was also made to define the model as linear. The results are presented in Table 5.
Table 5.
ANOVA for a Linear model for Response 2: TFC.
It turned out that this model was also not suitable because the model’s F-value of 1.60 meant that the model was not robust to noise. There was a 20.74% chance that such a large F-value was due to noise. Finally, the 2FI model was chosen, and the results are presented in Table 6.
Table 6.
ANOVA for 2FI model for Response 2: TFC.
It shows that the F-value is 11.68, which means that the model is significant. There is only a 0.01% chance that the F-value is due to noise. The coefficient of determination is R
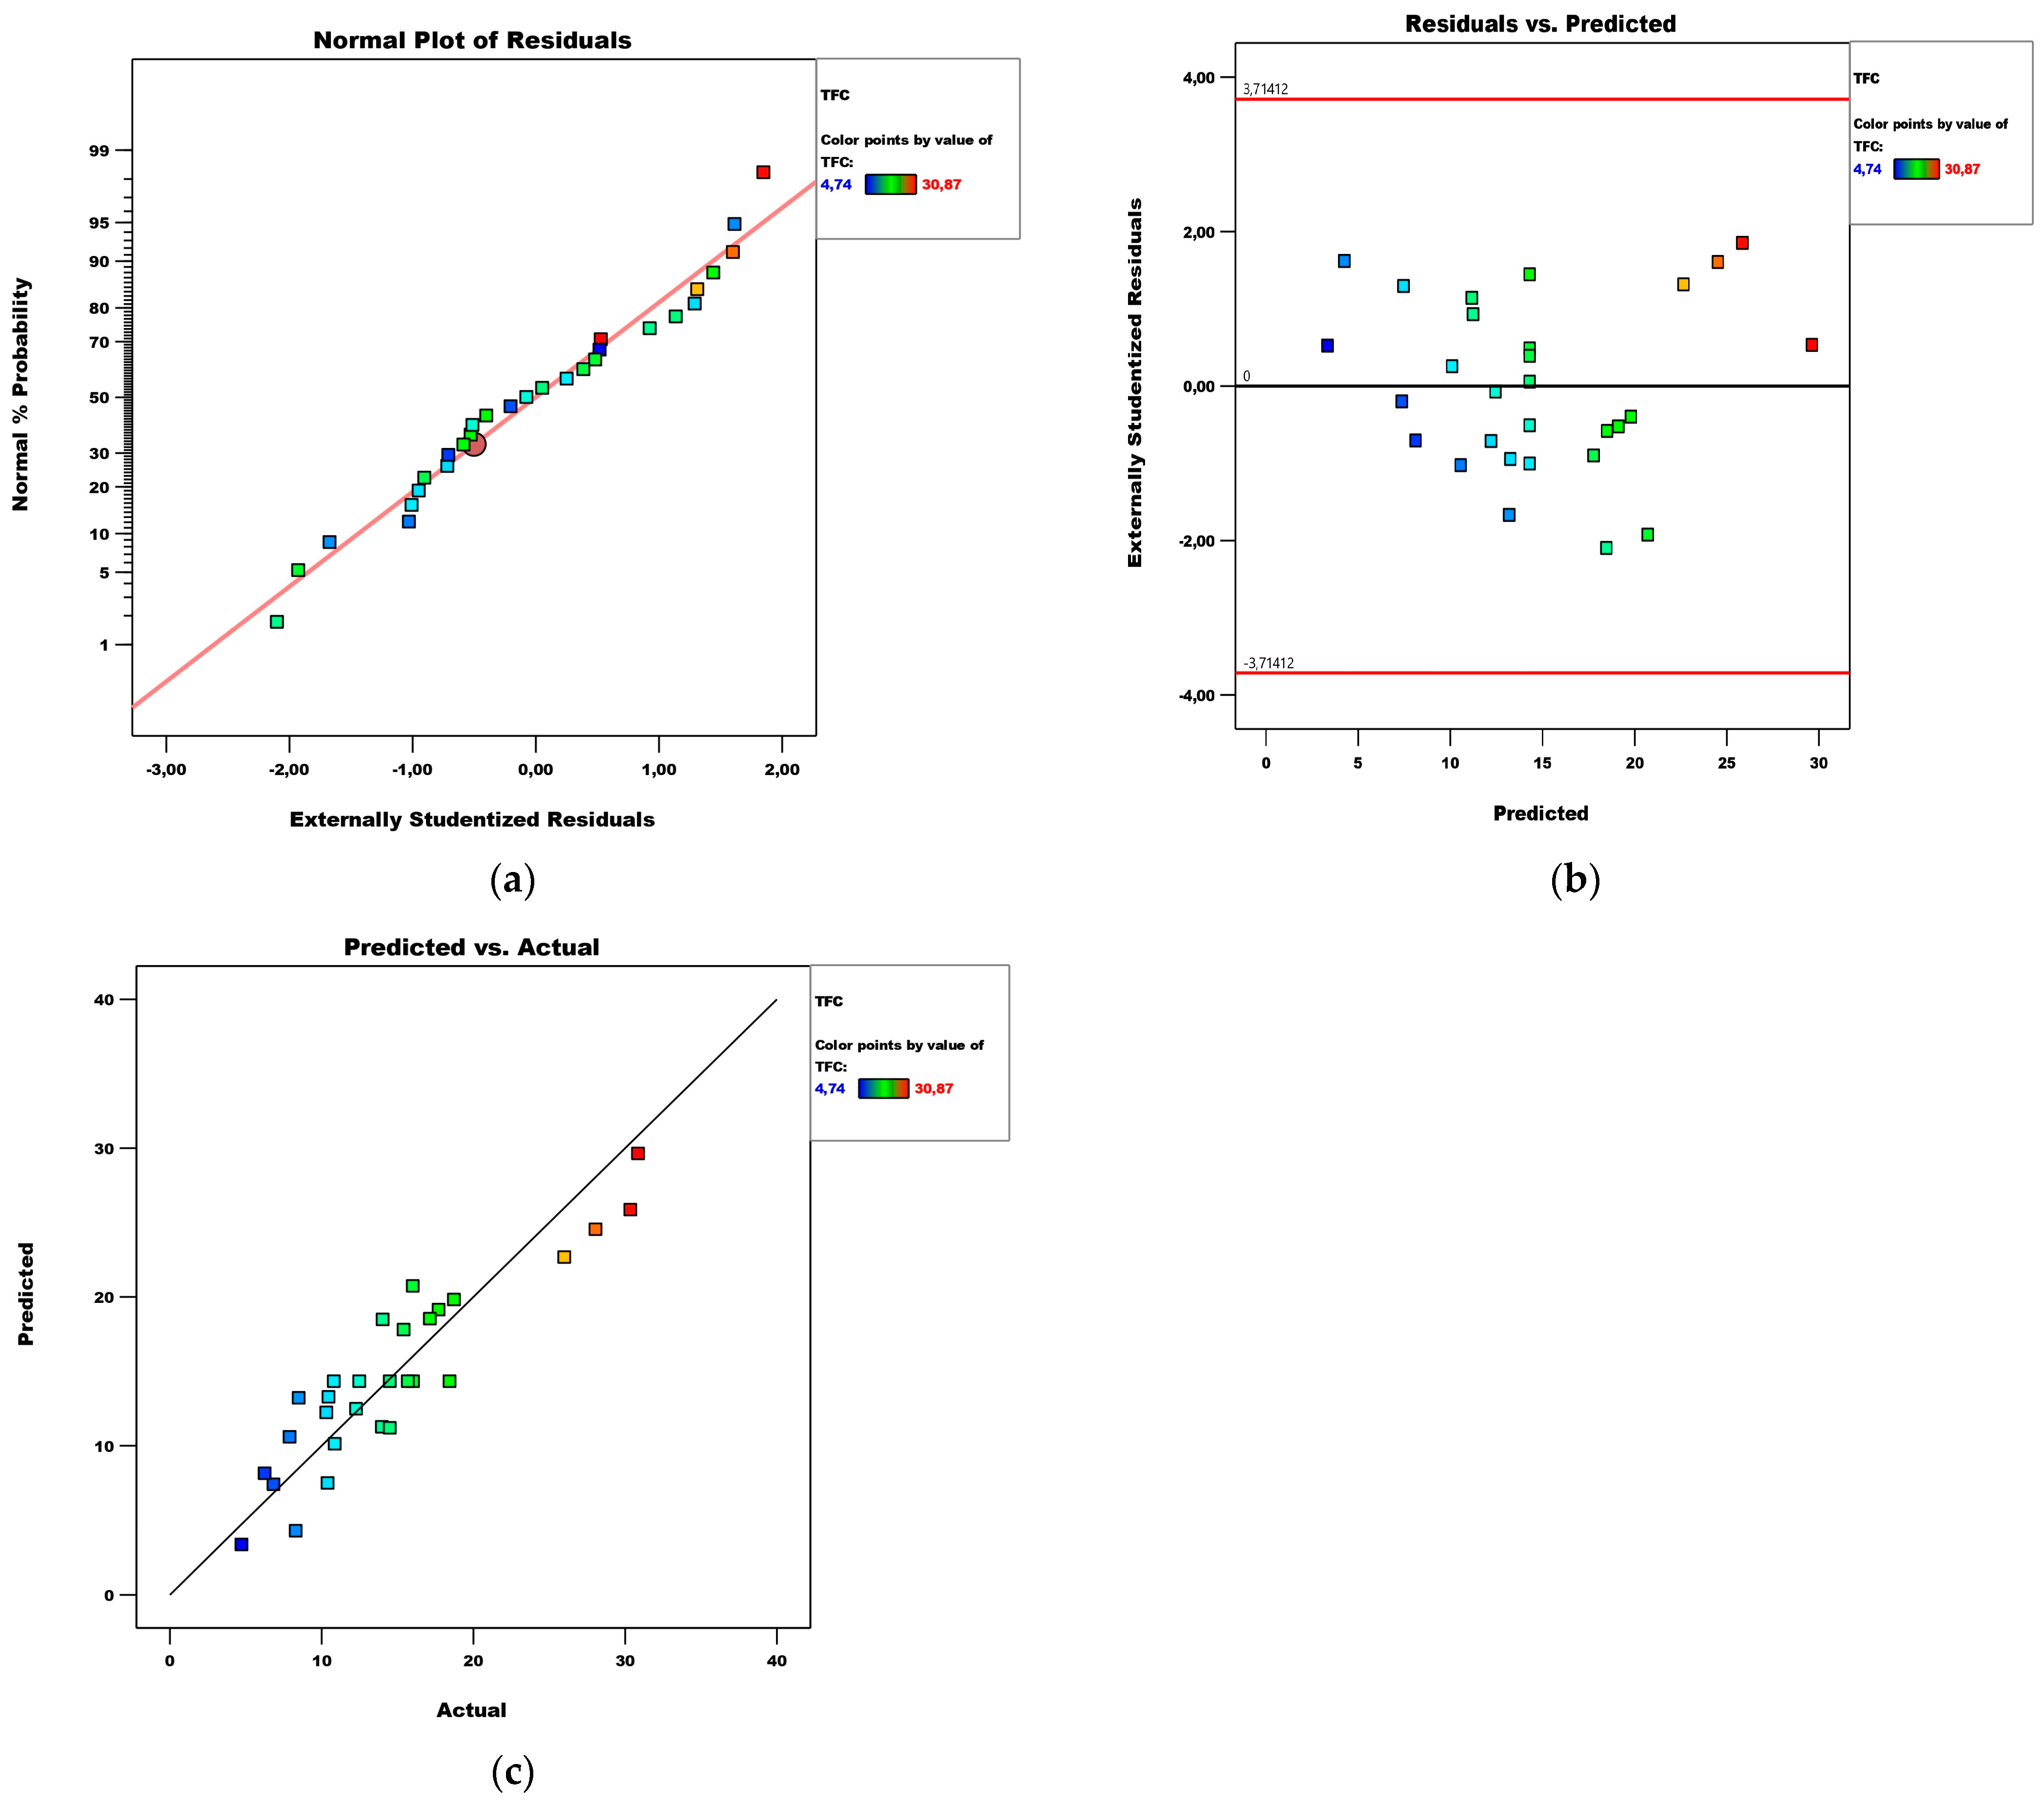
2 = 0.82 with a standard error of 2.63. This confirms the fact that the higher the R-squared value, the smaller the error (compared to a TPC regression model). Thus, when estimating the TFC value, an average error of less than 2.63 mg GAE/100 g fw can be expected. The temperature does not affect the extraction of TFC (Figure 2). Other authors also support this finding in their work, stating that the flavonoid and total phenolic contents were not influenced by temperature, time, and milling treatment [28].
Figure 2.
Diagnostics of the TFC model: (a) normal plot of residuals; (b) residuals vs. predicted plot; (c) predicted vs. actual plot.
Diagnostics of the model are performed by plots of the normal distribution of residuals, residuals versus predicted values, and predicted versus actual values, presented in Figure 2. Based on them, it can be said that the residuals are normally distributed and there are no extreme values among them.
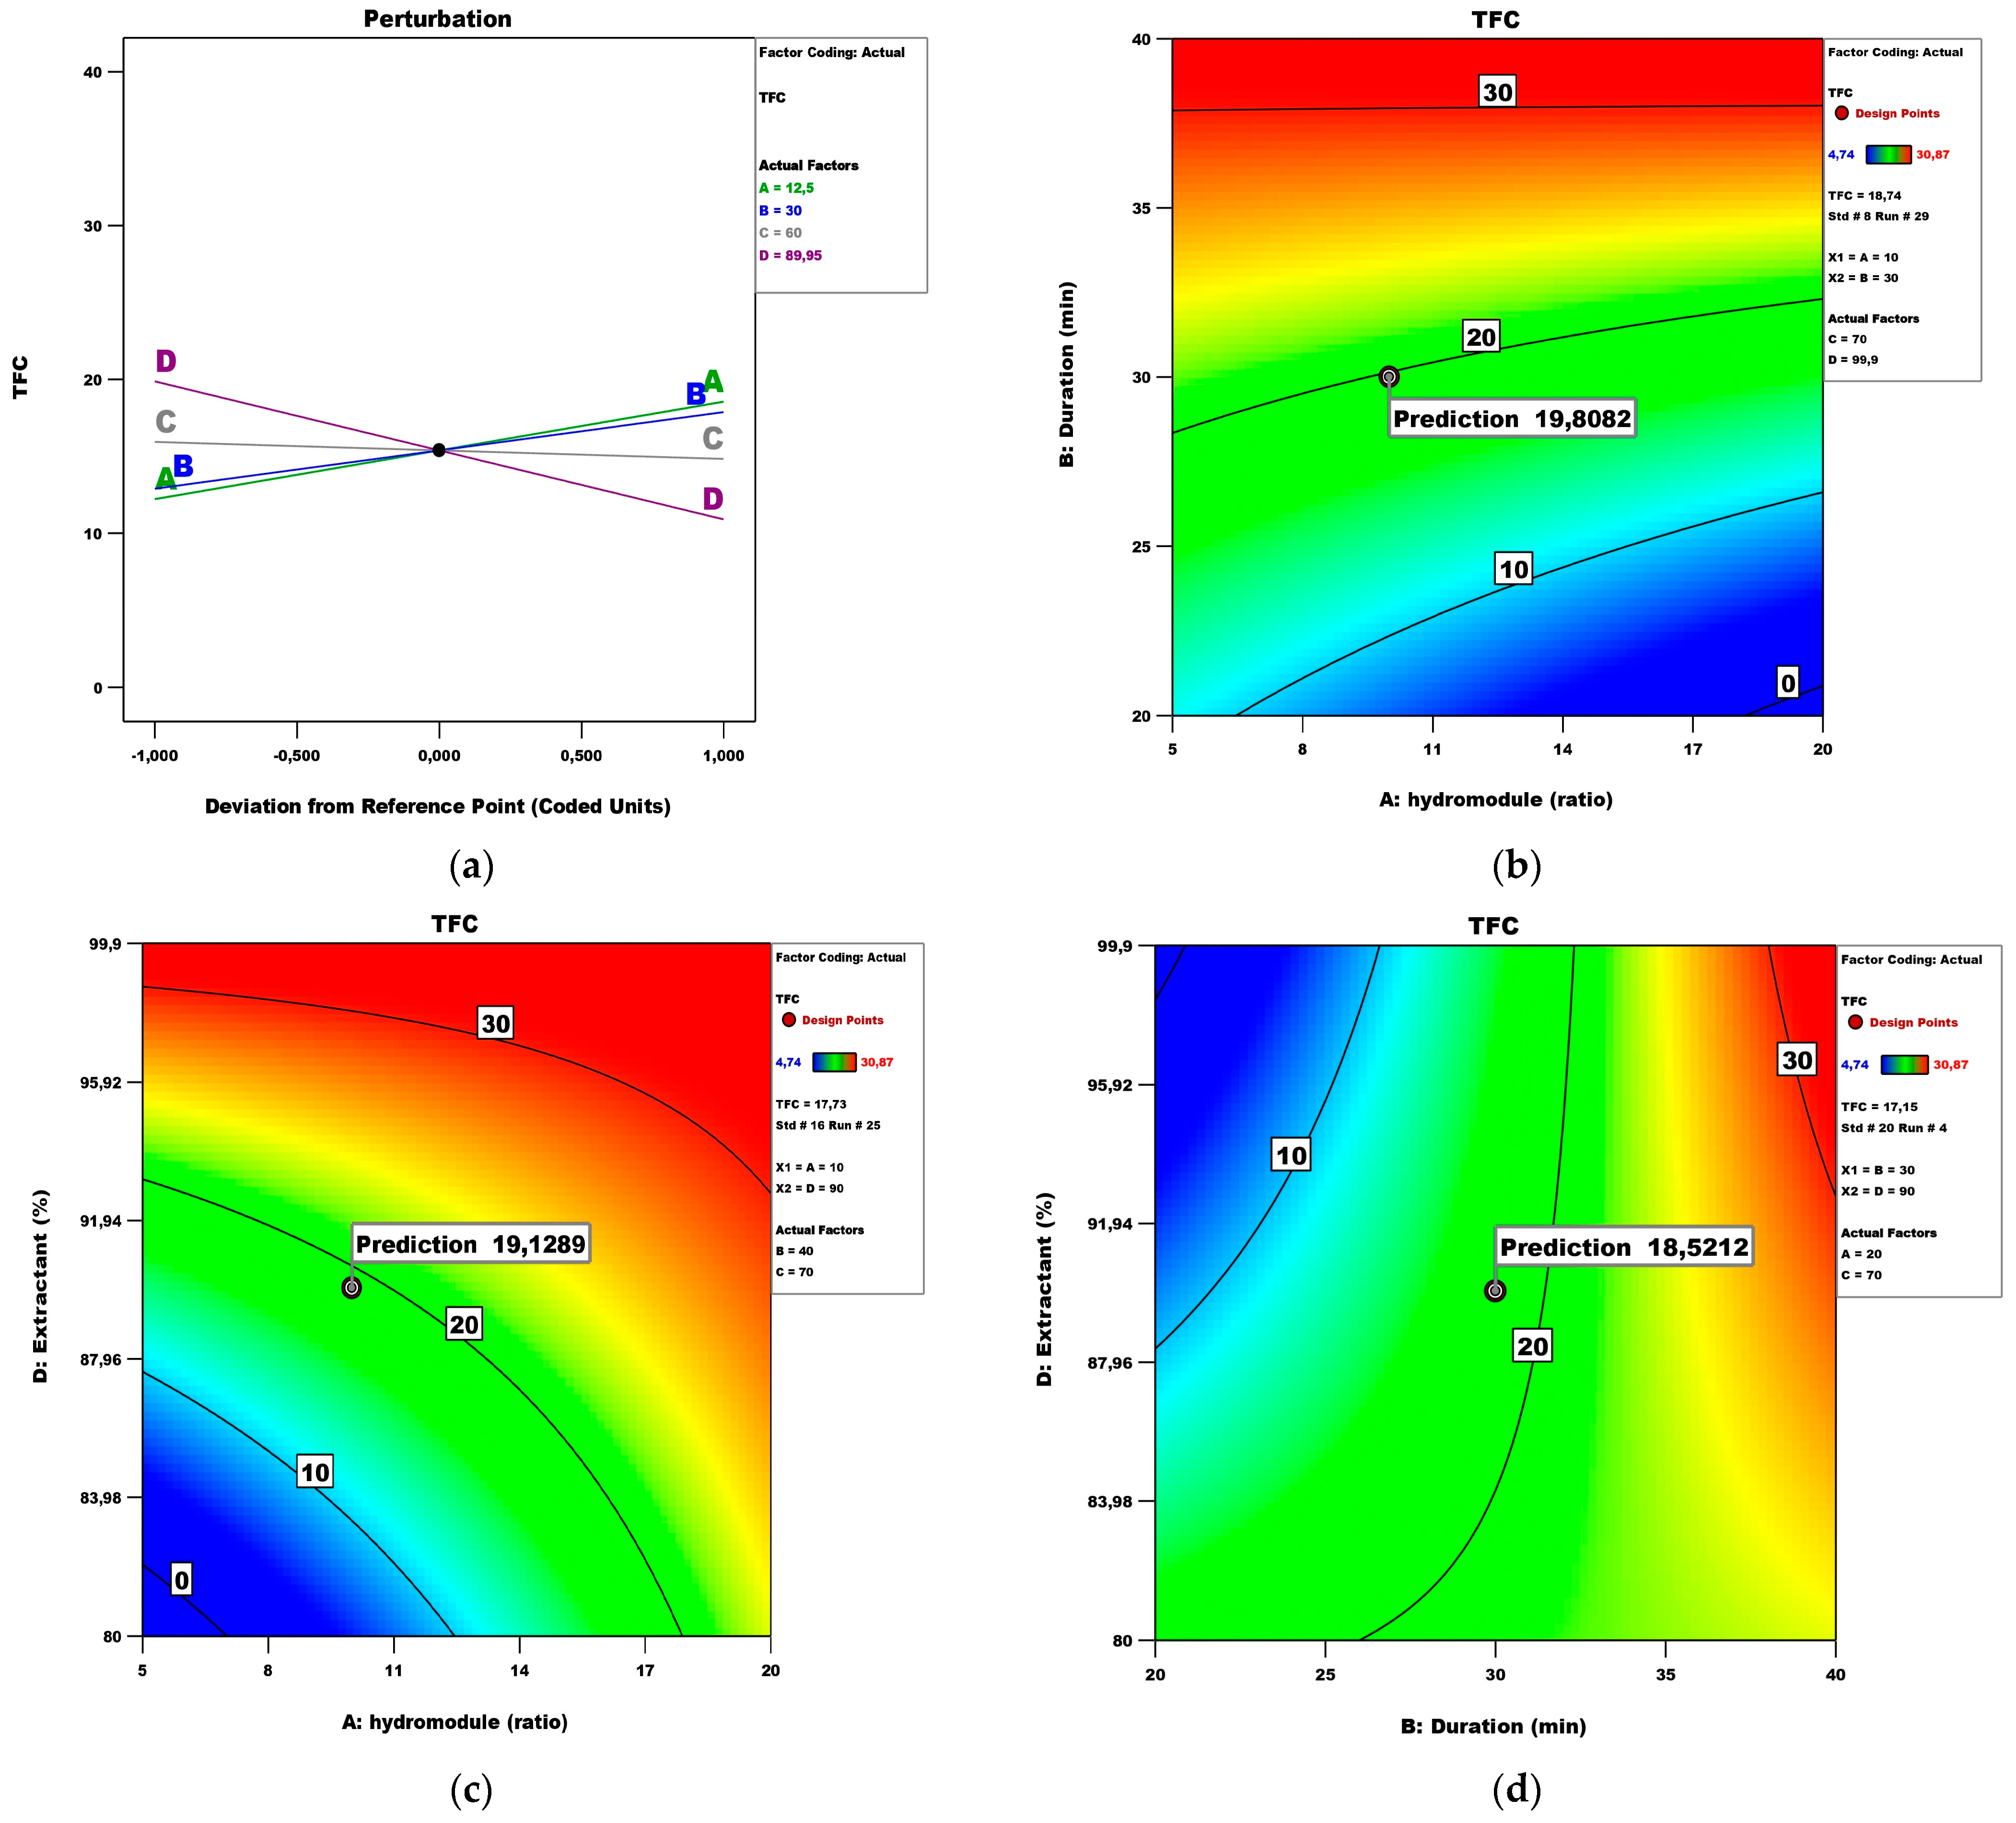
Figure 3 presents the perturbation and contour plots. It is clear that the extractant factor has the most significant influence.
Figure 3.
TFC model analysis: (a) Perturbation plot; (b) contour surface plots of TFC against hydro module (ratio) and duration (min); (c) contour surface plots of TFC against hydro module (ratio) and extractant; (d) contour surface plots of TFC against duration (min) and extractant.
Figure 3b shows the influence of the factors hydro module and duration, while the temperature and the extractant are constants, 70 °C and 99.9%, respectively. A design point with its actual and predicted value is also presented. Figure 3c shows the influence of the factors hydro module and extractant, while the temperature and the duration are constants, 70 °C and 40, respectively. Under these conditions, the maximum TFC value is 17.73 μg QE/100 g fw. Figure 3d shows the influence of the factors duration and extractant, while the temperature and the hydro module are constants, 70 °C and 20, respectively.
The model describing the dependence of FRAP on the independent variables is quadratic and the results are presented in Table 7. The F-value of the model is 23.64, which indicates the significance. There is only a 0.01 chance that an F-value this large could occur due to noise.
Table 7.
ANOVA for Reduced Quadratic Model Response 3: FRAP.
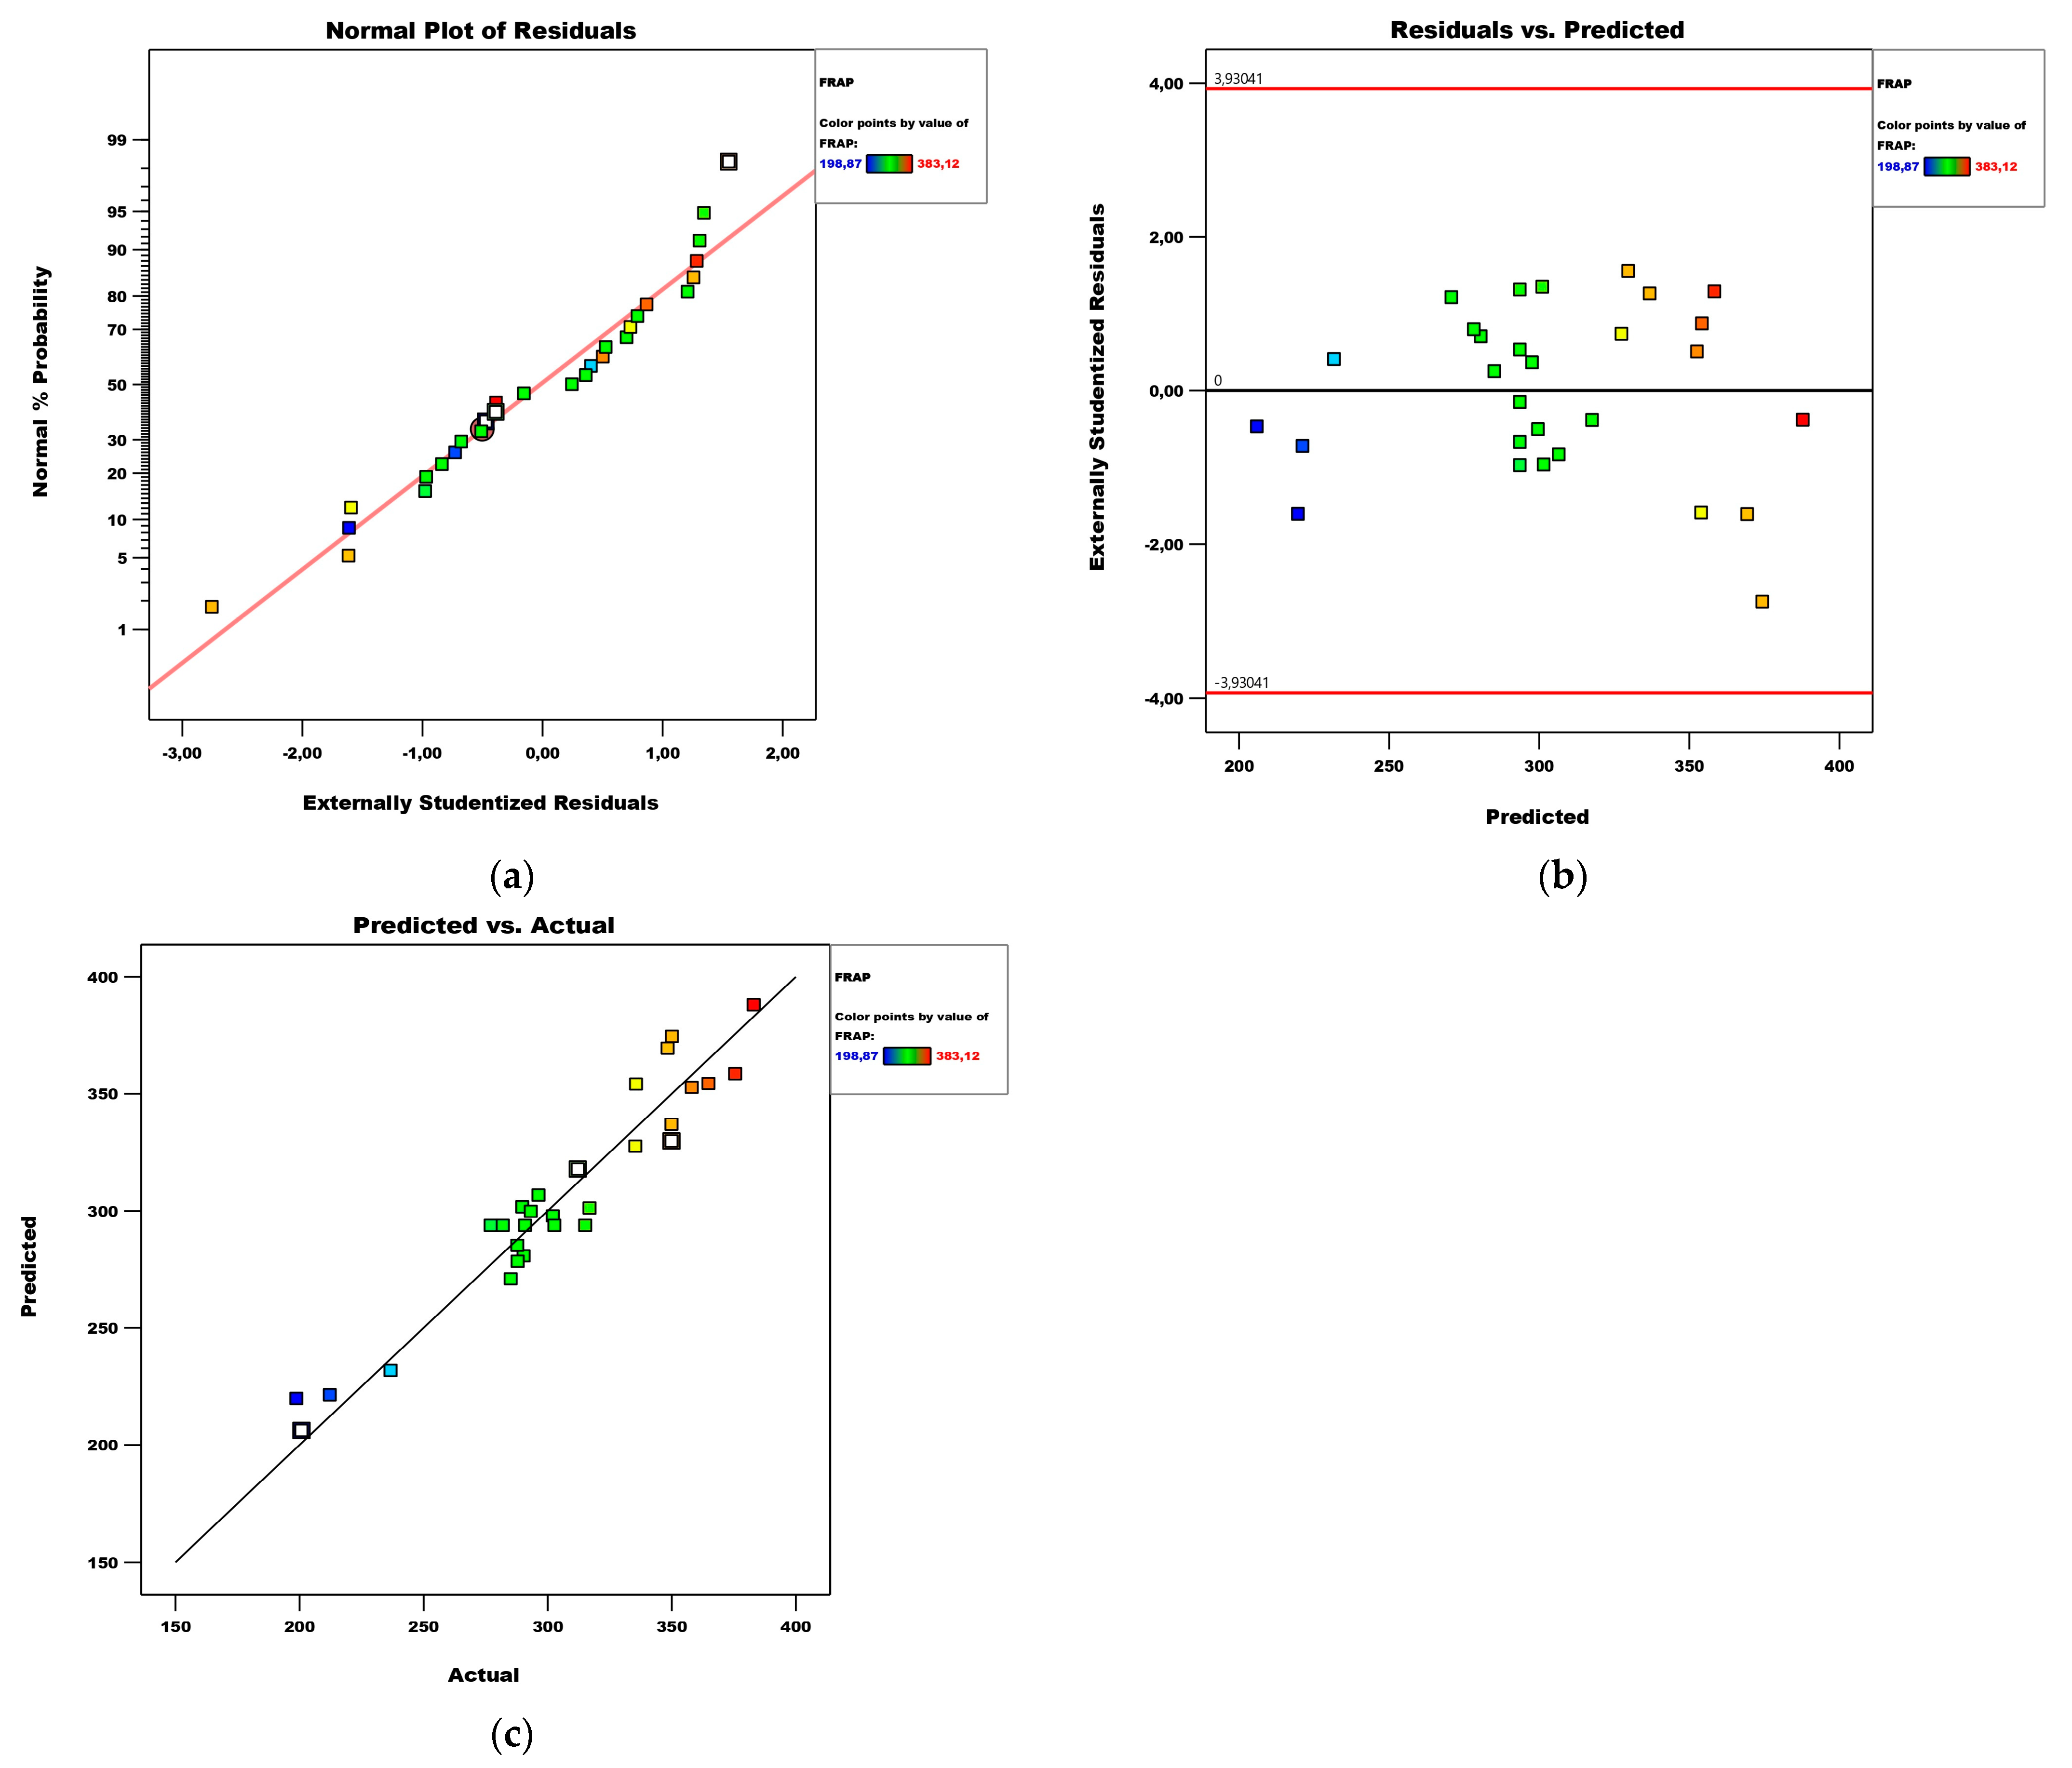
The coefficient of determination and the standard error in this case are, respectively, 0.92 and 13.07. Since the coefficient of determination is high, the larger value of the error is due to the significantly larger measured values (compared to the TPC and TFC models). This standard error value means that when estimating the FRAP value, a mean error of less than 13.07 μM TE/100 g fw can be expected.
Based on the diagnostics of the model shown in the plots, it can be said that the residuals are normally distributed and there are no extreme values among them (Figure 4).
Figure 4.
Diagnostics of the FRAP model: (a) normal plot of residuals; (b) residuals vs. predicted plot; (c) predicted vs. actual plot.
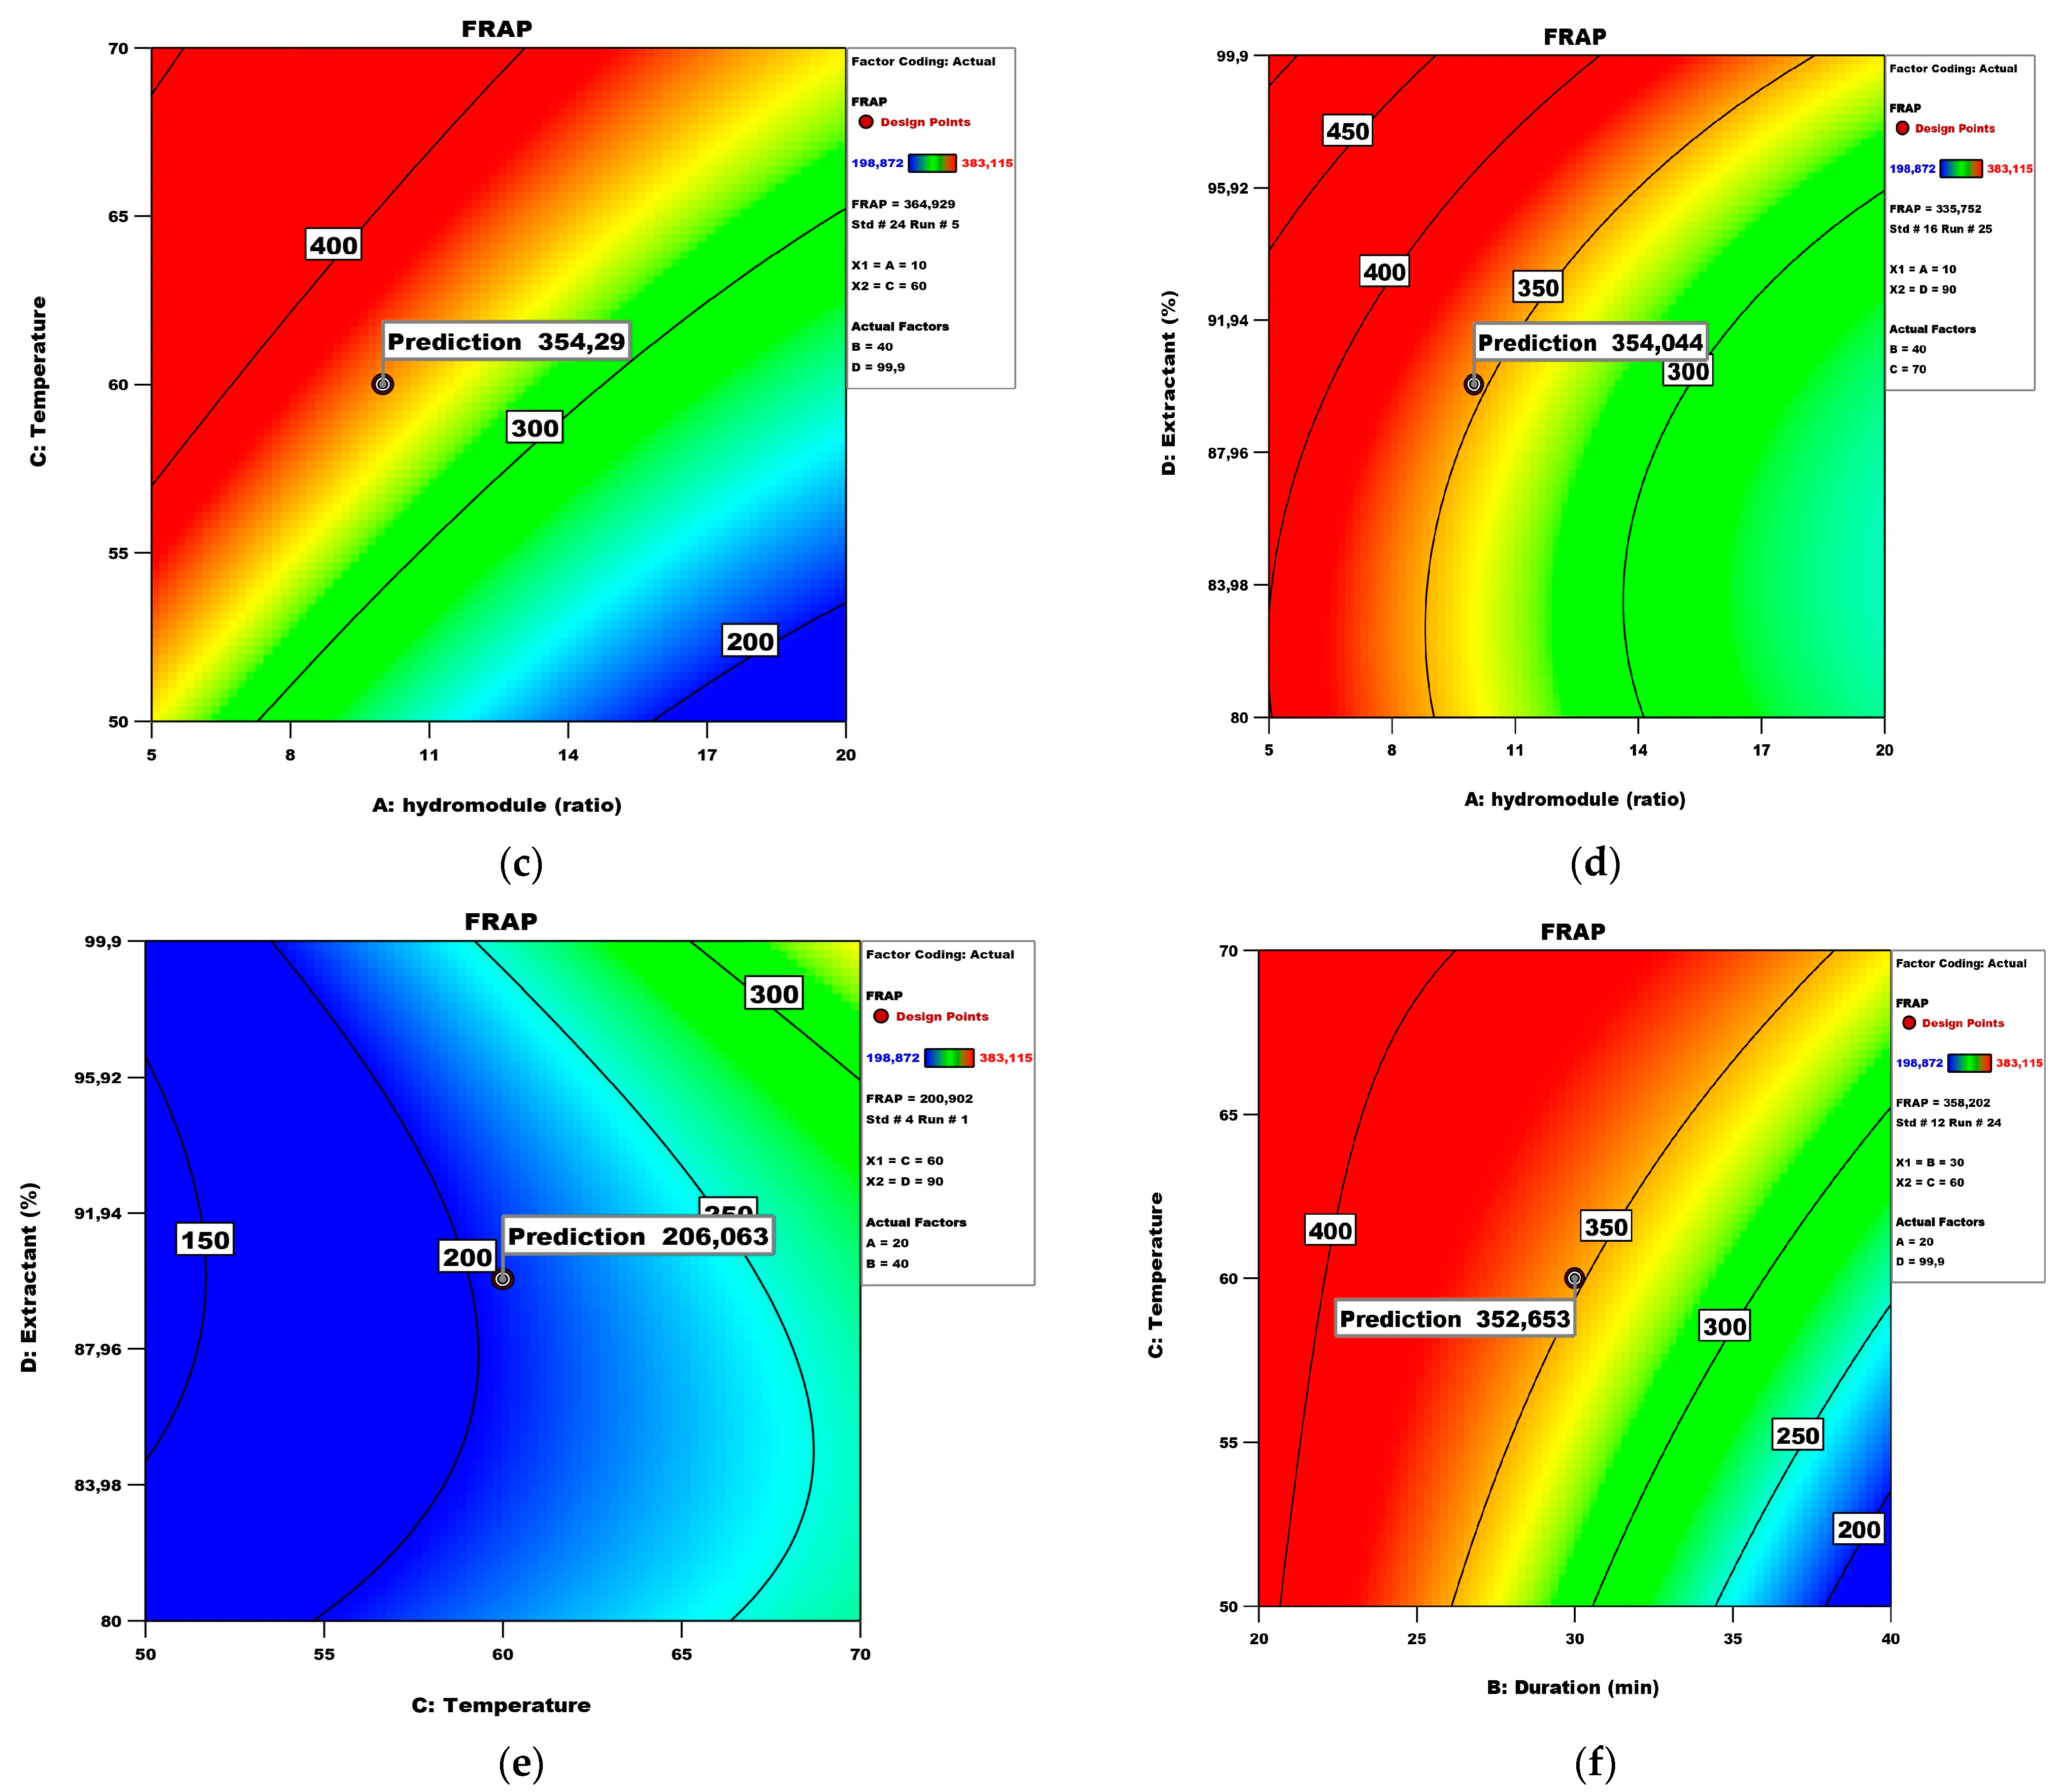
Following the perturbation and contour plots in Figure 5, the maximum FRAP values could be obtained with a hydro module 10 for a duration of 30 min. Temperature is revealed as the least significant. Figure 5d shows the effect of the hydro module and extractant on the FRAP while keeping duration and temperature at values of 40 min and 70 °C, respectively. Under these conditions, the maximum FRAP could be obtained with a hydro module of 10 and an extractant of 90%.

Figure 5.
FRAP model analysis: (a) Perturbation plot; (b) contour surface plots of FRAP against hydro module (ratio) and duration (min); (c) contour surface plots of FRAP against hydro module (ratio) and temperature; (d) contour surface plots of FRAP against hydro module (ratio) and extractant; (e) contour surface plots of FRAP against temperature and extractant; (f) contour surface plots of FRAP against duration (min) and temperature.
A suitable model has not been established to describe the dependence of the CUPRAC on the independent variables. A linear, 2FI, and quadratic model were tried, but all three were found to be insignificant (see Table 8, Table 9 and Table 10).
Table 8.
ANOVA for linear model Response 4: CUPRAC.
Table 9.
ANOVA for 2FI model Response 4: CUPRAC.
Table 10.
ANOVA for quadratic model Response 4: CUPRAC.
The model describing the dependence of DPPH on the independent variables is quadratic (Table 11).
Table 11.
ANOVA for Reduced Quadratic model Response 5: DPPH.
The coefficient of determination R2 and the standard error in this case are, respectively, 0.96 and 2.44. It can be seen that the coefficient of determination is high and the error value is small. This standard error value means that when estimating the DPPH value, a mean error of less than 2.44 μM TE/100 g fw can be expected. Diagnostics of the model are shown in the plots of the normal distribution of residuals, residuals versus predicted values, and predicted versus actual values, presented in Figure 6. Based on them, it can be said that the residuals are normally distributed and there are no extreme values among them.
Figure 6.
Diagnostics of the DPPH model: (a) normal plot of residuals; (b) residuals vs. predicted plot; (c) predicted vs. actual plot.
Figure 7 presents the perturbation and contour plots. The perturbation plot (Figure 7a) showed that the extractant and duration have the most significant influence, while the impact of temperature had no effect. Figure 7b revealed the effect of the hydro module and duration on the DPPH antioxidant activity of peach fruits while keeping temperature and extractant at values of 70 °C and 99.9%, respectively.

Figure 7.
DPPH model analysis: (a) Perturbation plot; (b) contour surface plots of DPPH against hydro module (ratio) and duration (min); (c) contour surface plots of DPPH against hydro module (ratio) and temperature; (d) contour surface plots of DPPH against hydro module (ratio) and extractant; (e) contour surface plots of DPPH against duration (min) and hydro module (ratio); (f) contour surface plots of DPPH against duration (min) and temperature.
The DPPH assay has been frequently used since its method was published in 1995. Researchers are still relying on it while evaluating the antioxidant capacity of plant matrices [29]. Under the abovementioned conditions, the maximum DPPH values (112.16 μM TE/100 g fw) could be obtained with a hydro module of 10 for a duration time of 30 min. Figure 7c shows the effect of the hydro module and temperature on the DPPH scavenging ability while keeping duration and extractant at values of 20 and 99.9, respectively. Under these conditions, the maximum DPPH values could be obtained with a hydro module of 10 and a temperature of 60 °C. Figure 7d shows the effect of the hydro module and extractant on the DPPH while keeping duration and temperature at values of 40 and 70 °C, respectively. Under these conditions, the maximum DPPH parameters could be obtained with a hydro module of 10 and an extractant of 90%. Figure 7e shows the effect of temperature and extractant on the DPPH while keeping the hydro module and duration at values of 20 and 40, respectively. Under these conditions, the maximum DPPH could be obtained at 60 °C and an extractant of 90%. Figure 7f shows the effect of duration and temperature on the DPPH while keeping the hydro module and extractant at values of 5 and 80, respectively. Under these conditions, the maximum DPPH (83.39 μM TE/100 g fw) could be obtained with a duration of 30 and a temperature of 60 °C. Other authors also present predicted values of antioxidant activity based on conditions like temperature, duration, and hydro module, stating that such results can aid in presenting the extract of choice as a functional ingredient [30]. It has to be noted that some extracts exhibit a slower reaction with the DPPH radical, resulting in less than the actual antioxidant capacity [31]. Thus, it is important to provide expected values under different conditions since most researchers are aiming at standardization of methods and reliability of results in different laboratories.
A quadratic model described the dependence of ABTS on the independent variables and the results are presented in Table 12.
Table 12.
ANOVA for Reduced Quadratic model Response 6: ABTS.
The coefficient of determination and the standard error in the ABTS model are 0.88 and 31.12, respectively. Since the coefficient of determination is high, it can be expected that the high error value is due to the large fluctuations (large variation range of ABTS). This standard error value means that when estimating the ABTS value, a mean error of less than 31.12 μM TE/100 g fw can be expected.
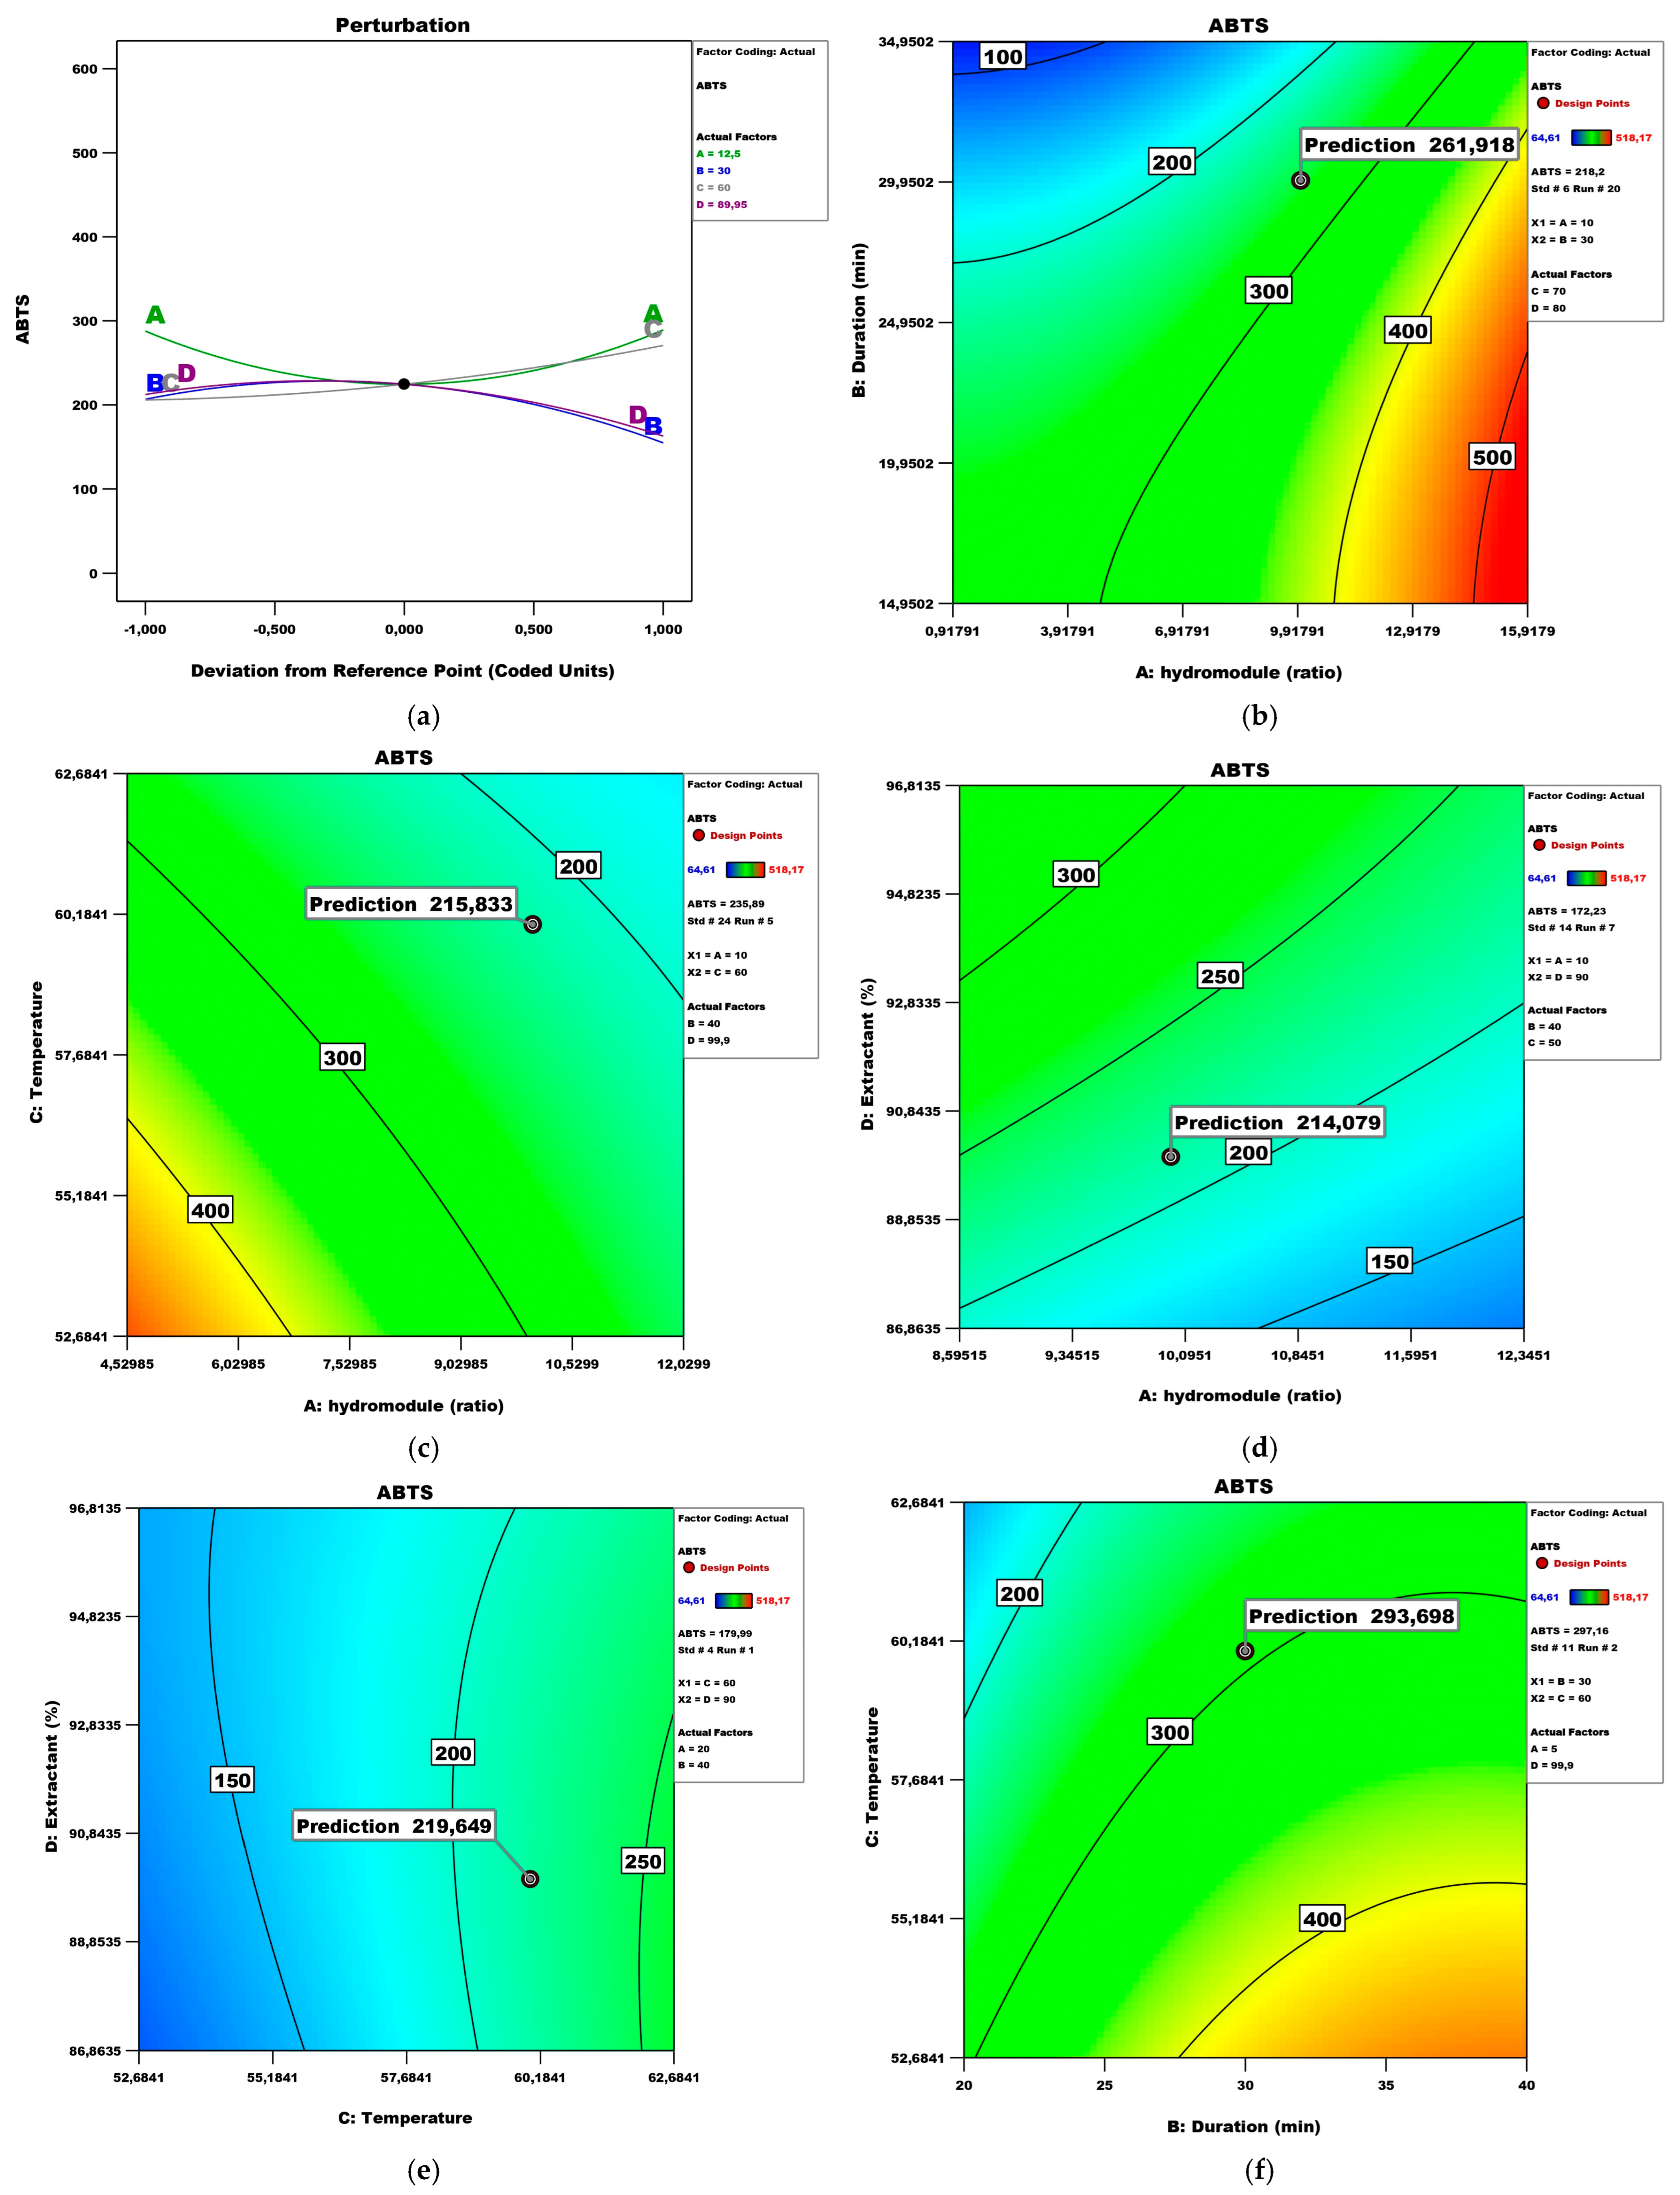
Figure 8 presents the perturbation and contour plots, where it can be seen that the hydro module, the duration, and the extractant have a quadratic influence. To the contrary, the temperature has a linear impact. Figure 8b shows the effect of the hydro module and duration on the ABTS values while keeping temperature and extractant at 70 °C and 99.9, respectively. Under these conditions, the maximum ABTS (216.50 μM TE/100 g fw) could be obtained with a hydro module of 10 and a duration time of 30 min. Other authors state that the UAE extraction of plant matrices reveals dose-dependent ABTS values [32].
Figure 8.
ABTS model analysis: (a) Perturbation plot; (b) contour surface plots of ABTS against hydro module (ratio) and duration (min); (c) contour surface plots of ABTS against hydro module (ratio) and temperature; (d) contour surface plots of ABTS against hydro module (ratio) and extractant; (e) contour surface plots of ABTS against temperature and extractant; (f) contour surface plots of ABTS against duration (min) and temperature.
Figure 8c shows the effect of the hydro module and temperature on the ABTS while keeping duration and extractant at values of 40 and 99.9, respectively. Under these conditions, the maximum ABTS could be obtained with a hydro module 10 and a temperature of 60 °C. Figure 8d shows the effect of the hydro module and extractant on the ABTS while keeping duration and temperature at values of 40 and 70 °C, respectively. Under these conditions, the maximum ABTS could be obtained with a hydro module of 10 and an extractant of 90. Figure 8e shows the effect of temperature and extractant on the ABTS while keeping the hydro module and duration at values of 5 and 20, respectively. Under these conditions, the maximum ABTS could be obtained at 60 °C and an extractant of 90. Figure 8f shows the effect of duration and temperature on the ABTS while keeping the hydro module and extractant at values of 5 and 99.9, respectively. Under these conditions, the maximum ABTS (461.67 μM TE/100 g fw) could be obtained with a duration of 30 and a temperature of 60 °C.
A quadratic model explained the dependence of α-glucosidase on the independent variables (Table 13). The coefficient of determination and the standard error in the Alfa-Gl model are, respectively, 0.97 and 0.0068. The extremely small error is due to both the high value of the coefficient of determination and the low measured values. This value of the standard error means that when evaluating the value of Alfa-Gl, an average error of less than 0.0068 IC 50 g/mL can be expected.
Table 13.
ANOVA for Reduced Quadratic model Response 7: Alfa-Gl.
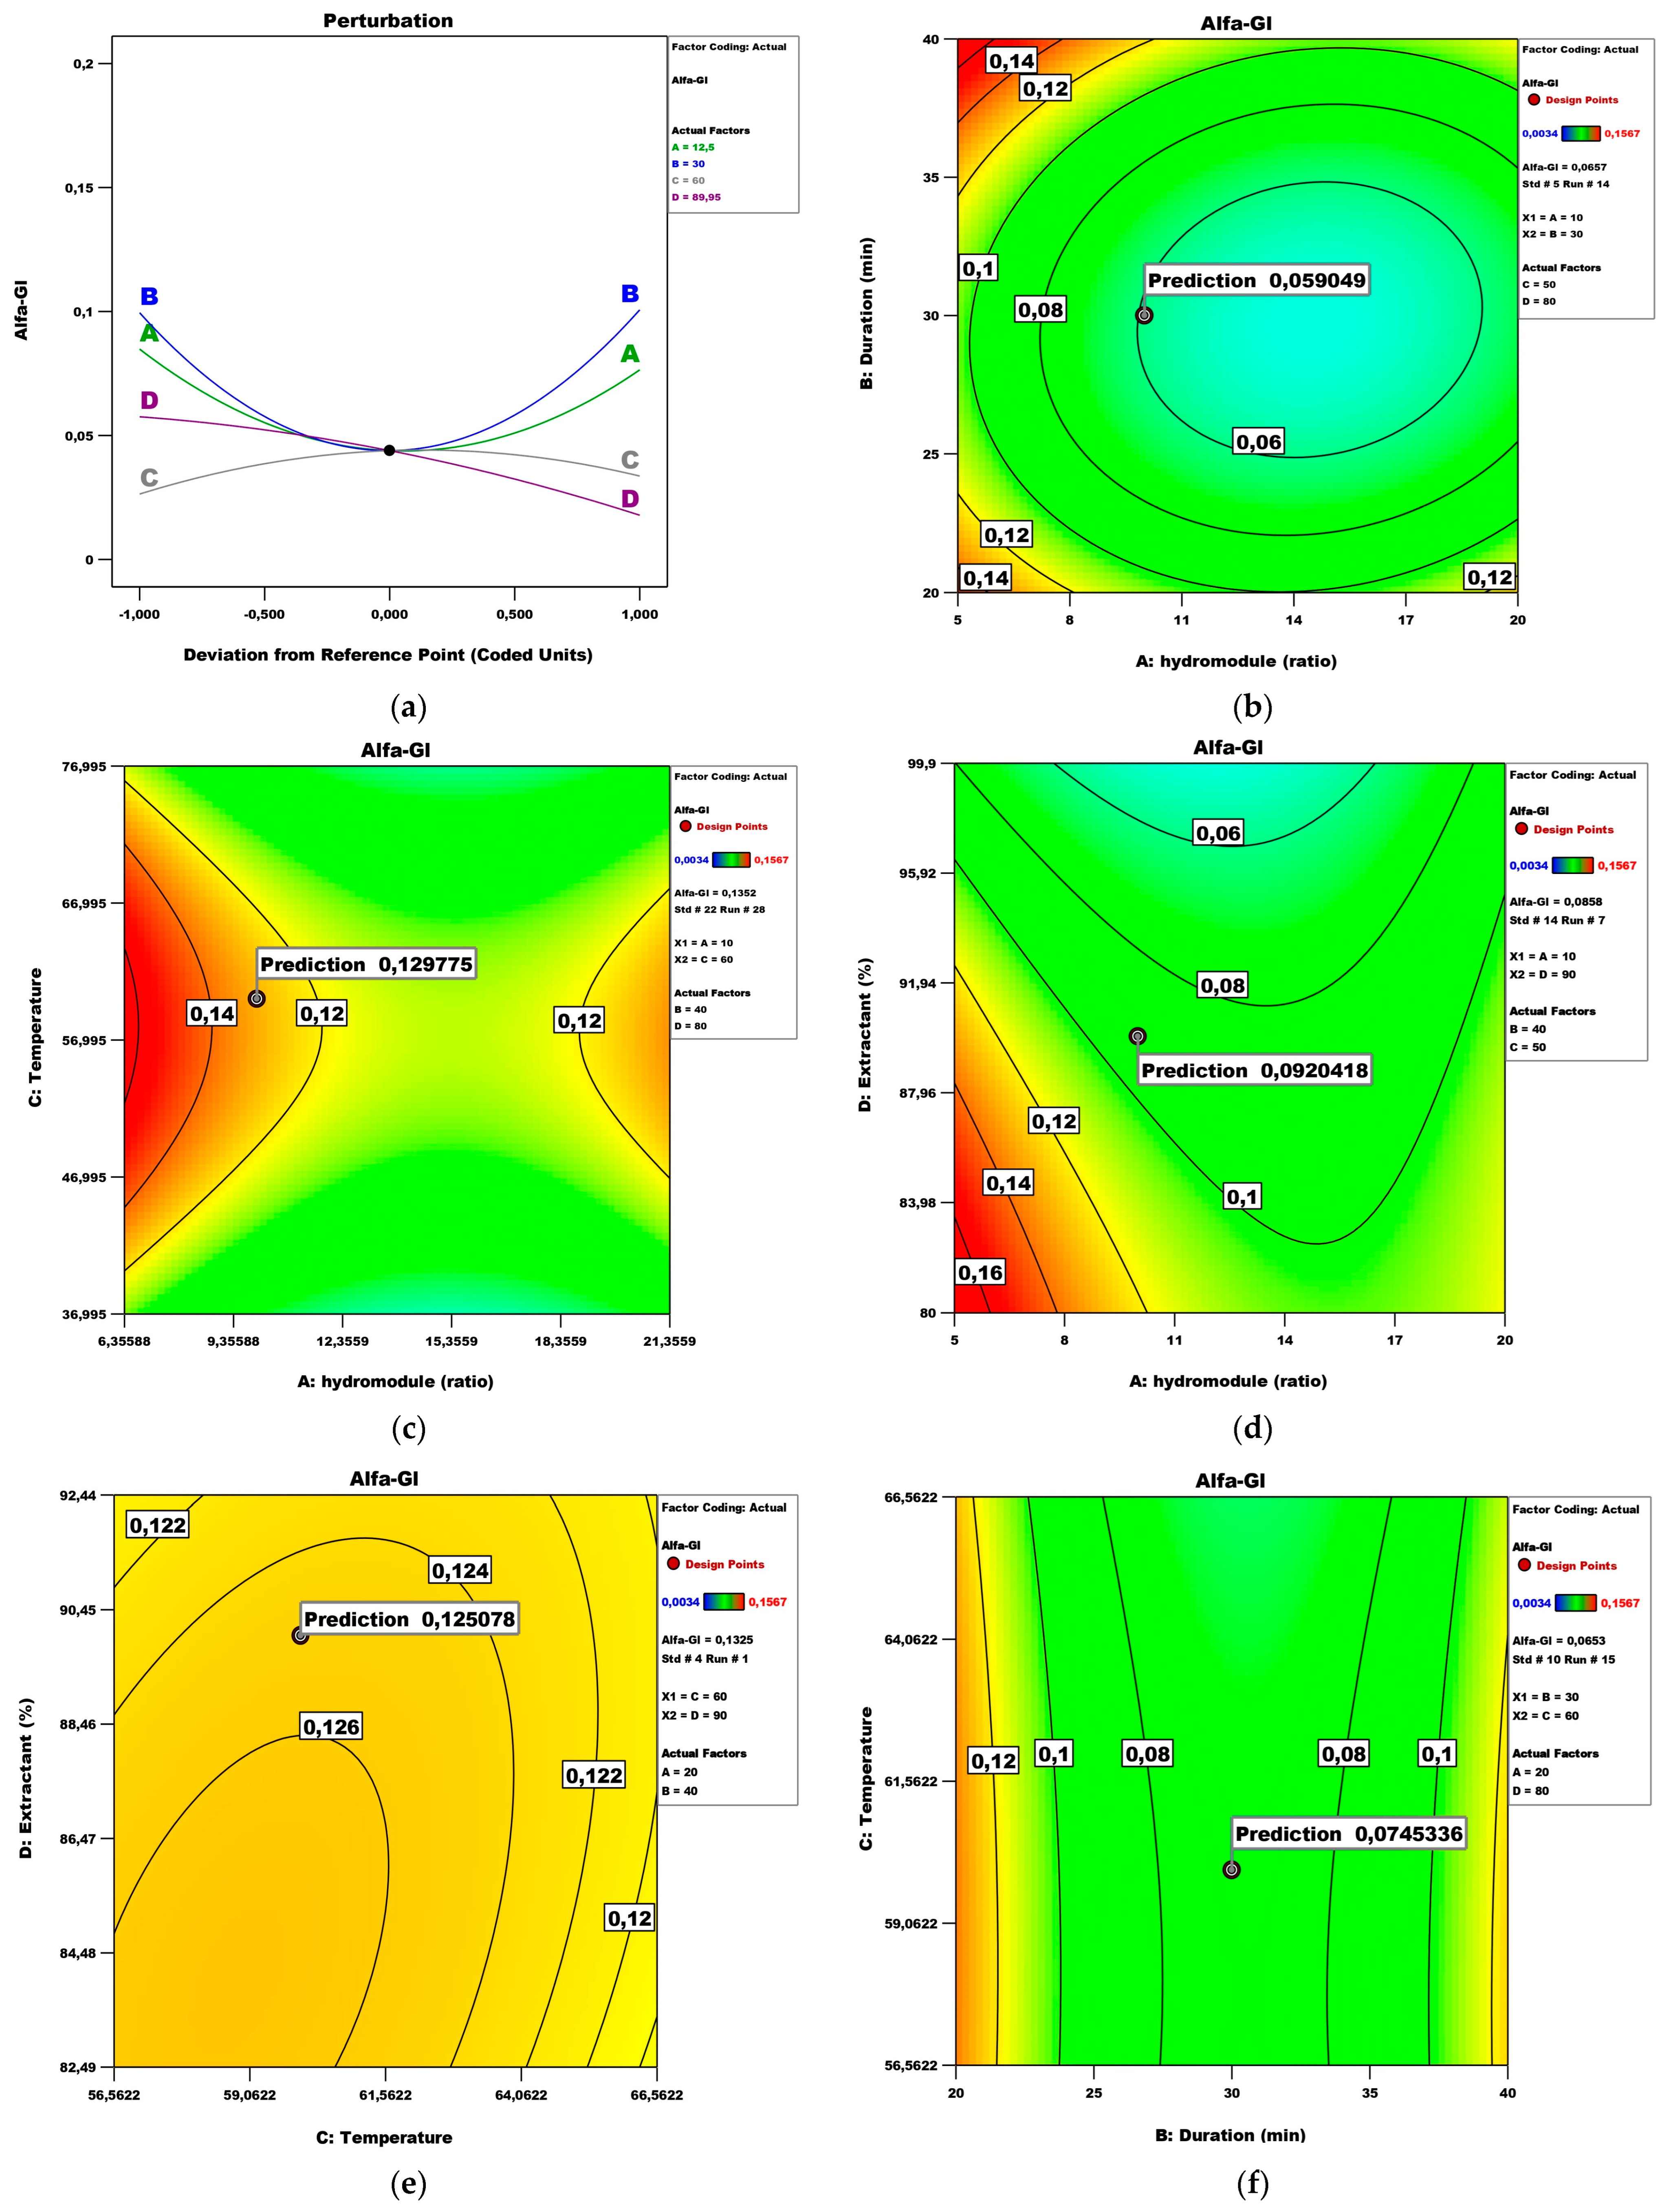
Figure 9 presents the perturbation and contour plots. The hydro module, duration, and extractant have a quadratic influence, while the temperature has a linear influence (Figure 9a). Figure 9b shows the effect of the hydro module and duration on the α-glucosidase while keeping temperature and extractant at 50 °C and 80%, respectively.
Figure 9.
α-glucosidase inhibition model analysis: (a) Perturbation plot; (b) contour surface plots of Alfa-Gl against hydro module (ratio) and duration (min); (c) contour surface plots of Alfa-Gl against hydro module (ratio) and temperature; (d) contour surface plots of Alfa-Gl against hydro module (ratio) and extractant; (e) contour surface plots of Alfa-Gl against temperature and extractant; (f) contour surface plots of Alfa-Gl against duration (min) and temperature.
Under these conditions, the maximum α-glucosidase inhibition (IC50 0.08 mg/mL) could be obtained with a hydro module of 10 for a duration time of 30 min. Other authors report twice the duration for ethanol extracts of Azadirachta indica leaves obtained by UAE needed for the inhibition of α-glucosidase [33]. Figure 9c shows the effect of the hydro module and temperature on the α-glucosidase inhibition potential while keeping duration and extractant at values of 20 and 80, respectively. Under these conditions, optimum results could be obtained with a hydro module of 10 and a temperature of 60 °C. Figure 9d shows the effect of the hydro module and extractant on the α-glucosidase inhibition while keeping duration and temperature at values of 40 min and 50 °C, respectively. In this view, the optimal conditions are a hydro module of 10 and an extractant of 90. Figure 9e shows the effect of the temperature and extractant on the α-glucosidase activity while keeping the hydro module and duration at values of 20 and 40, respectively. Under these conditions, maximal values could be obtained at 60 °C and an extractant of 90%. Figure 9f shows the effect of the duration and temperature on the α-glucosidase inhibition potential while keeping the hydro module and extractant at values of 20 and 99.9, respectively. Under these conditions, the optimal effect (IC50 0.13 mg/mL) could be achieved with a duration of 30 min and a temperature of 60 °C. Other authors [34] stated that solid/solvent ratio and extraction time were key process parameters in the optimization of extraction conditions of antioxidant and α-glucosidase inhibition of weed fruits.
A quadratic model revealed the dependence of acetylcholinesterase on the independent variables (Table 14). In this case, A, B, C, D, AB, AC, BC, BD, A2, B2, C2, and D2 are significant model terms. The coefficient of determination and the standard error in the AChE model are 0.98 and 0.031, respectively. The reasons for the small error are identical to those of the Alfa-Gl model—a high value of the coefficient of determination and low measured values. This standard error value means that when estimating the AChE value, a mean error of less than 0.031 IC20 g/mL can be expected.
Table 14.
ANOVA for Reduced Quadratic model Response 8: AChE.
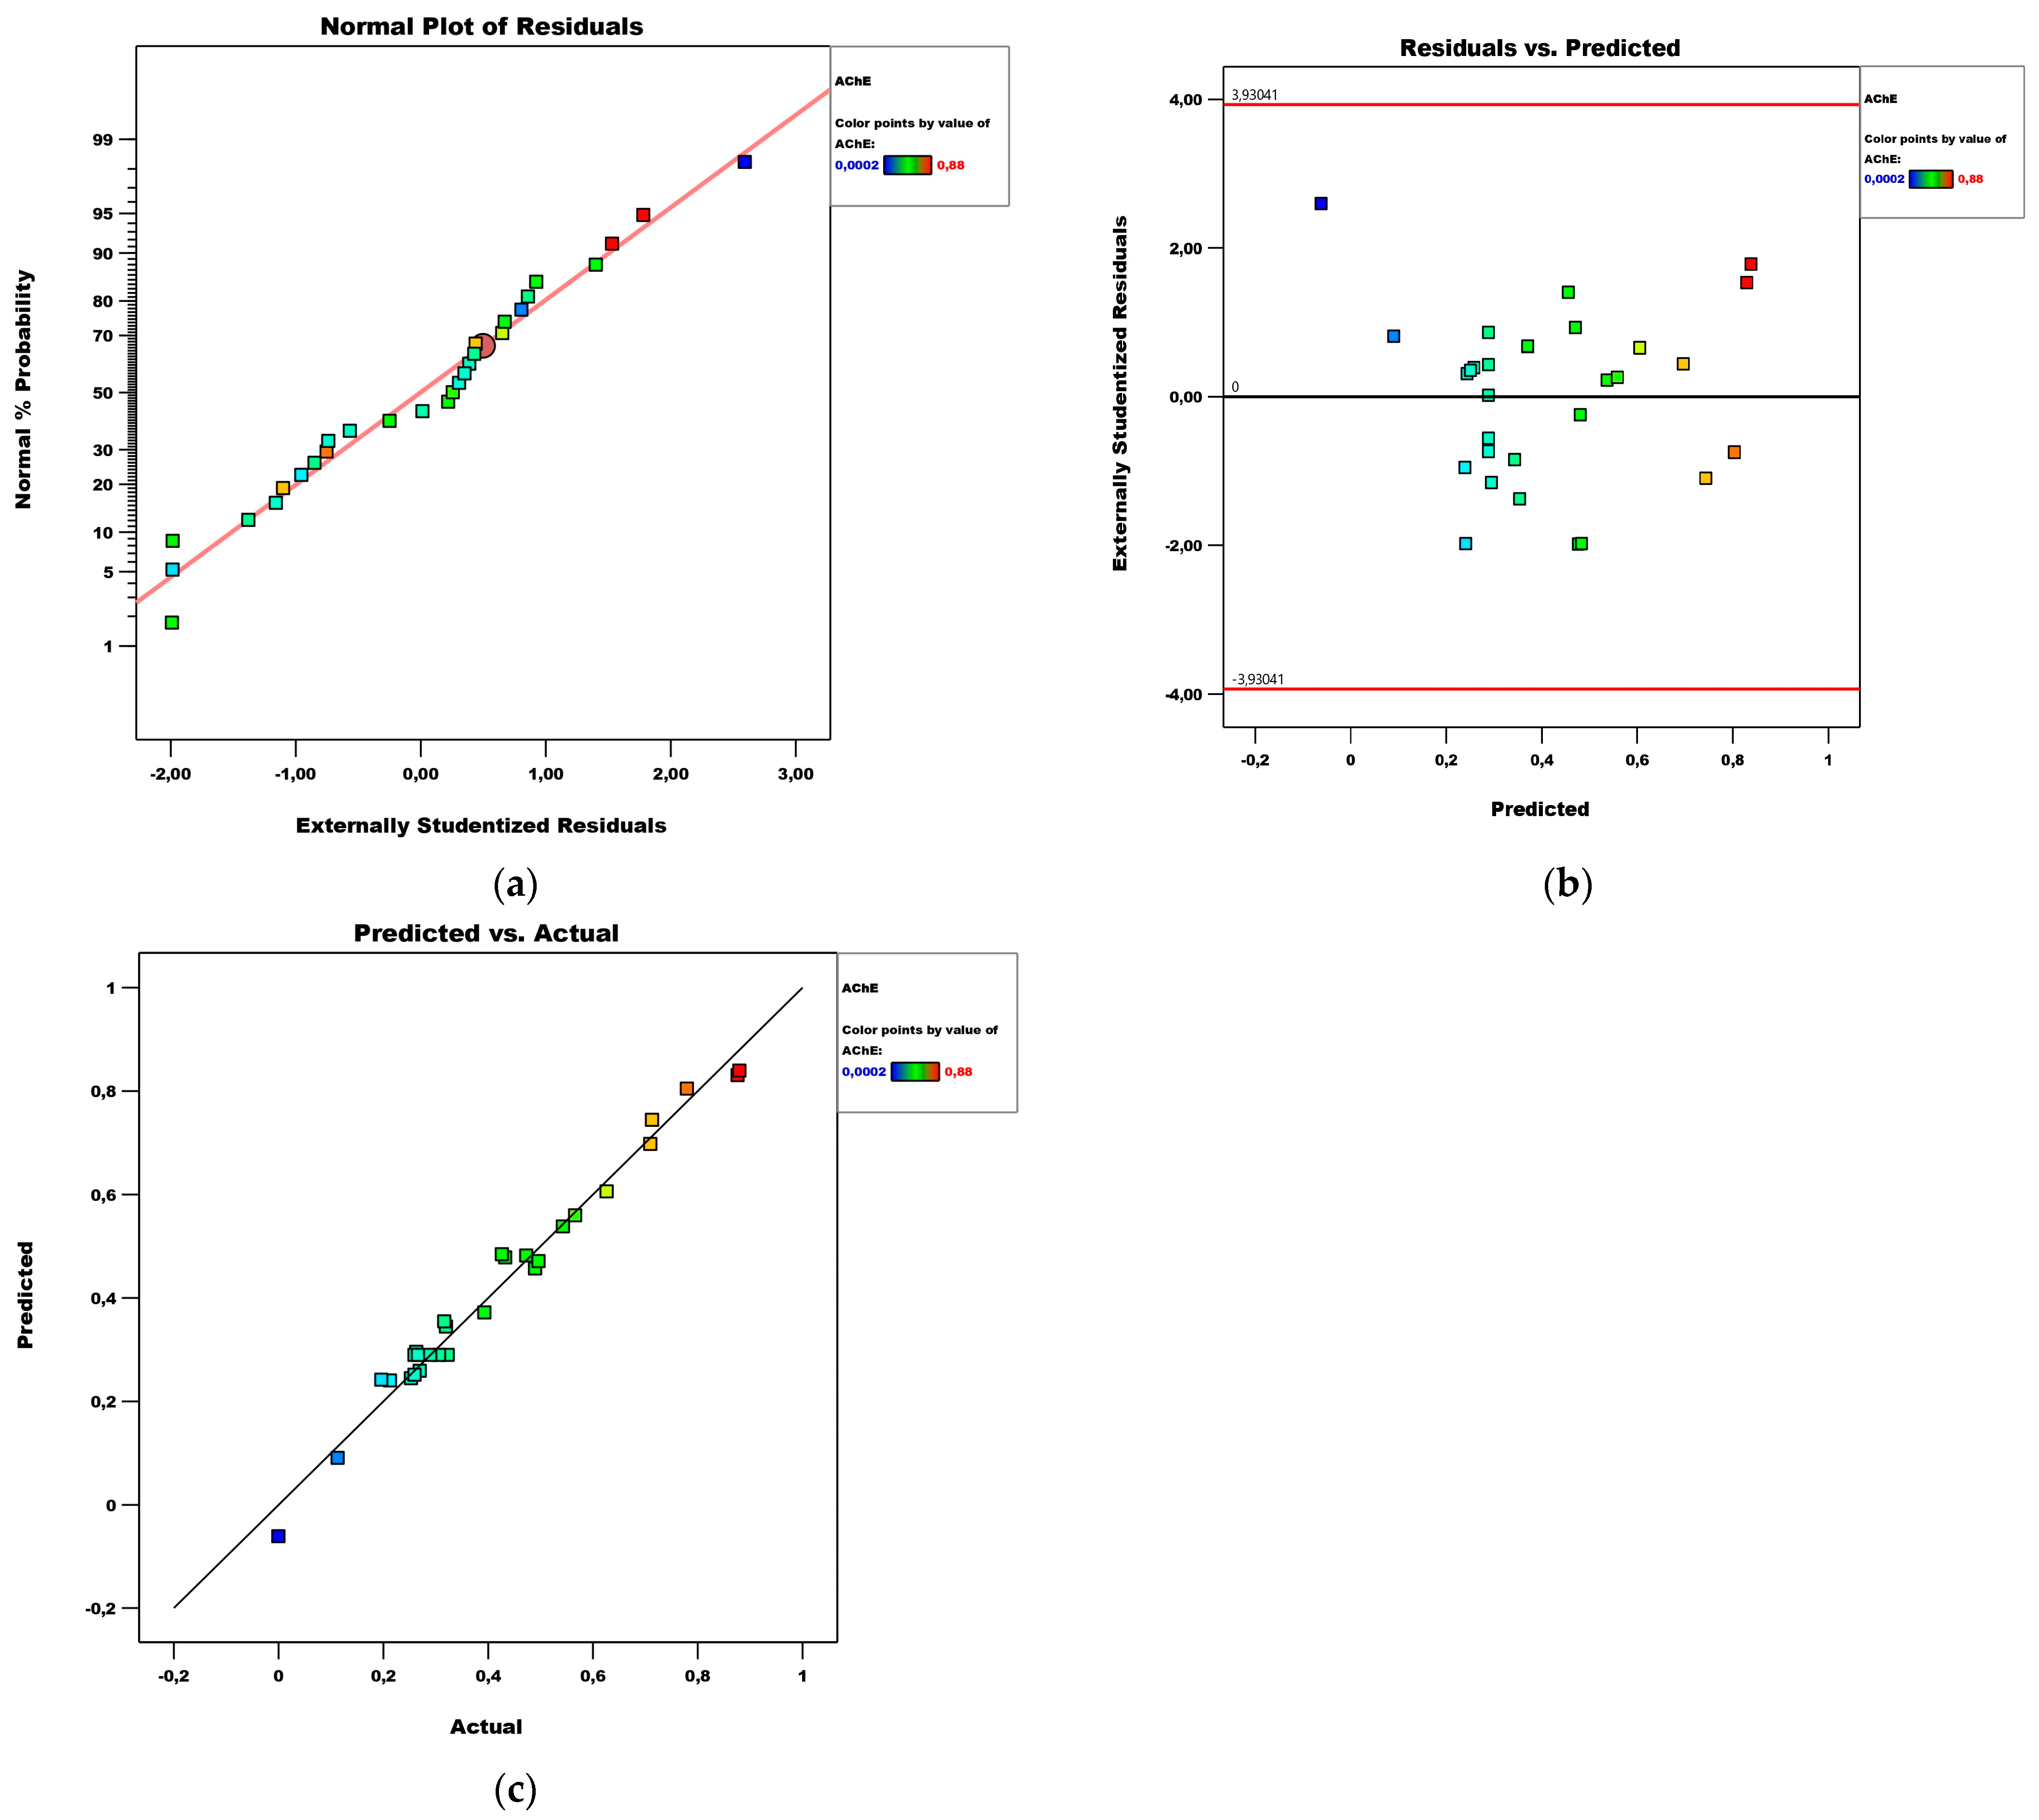
Diagnostics of the model are shown by plots of the normal distribution of residuals, residuals versus predicted values, and predicted versus actual values, presented in Figure 10. Based on them, it can be said that the residuals are normally distributed and there are no extreme values among them.
Figure 10.
Diagnostics of the AChE model: (a) normal plot of residuals; (b) residuals vs. predicted plot; (c) predicted vs. actual plot.
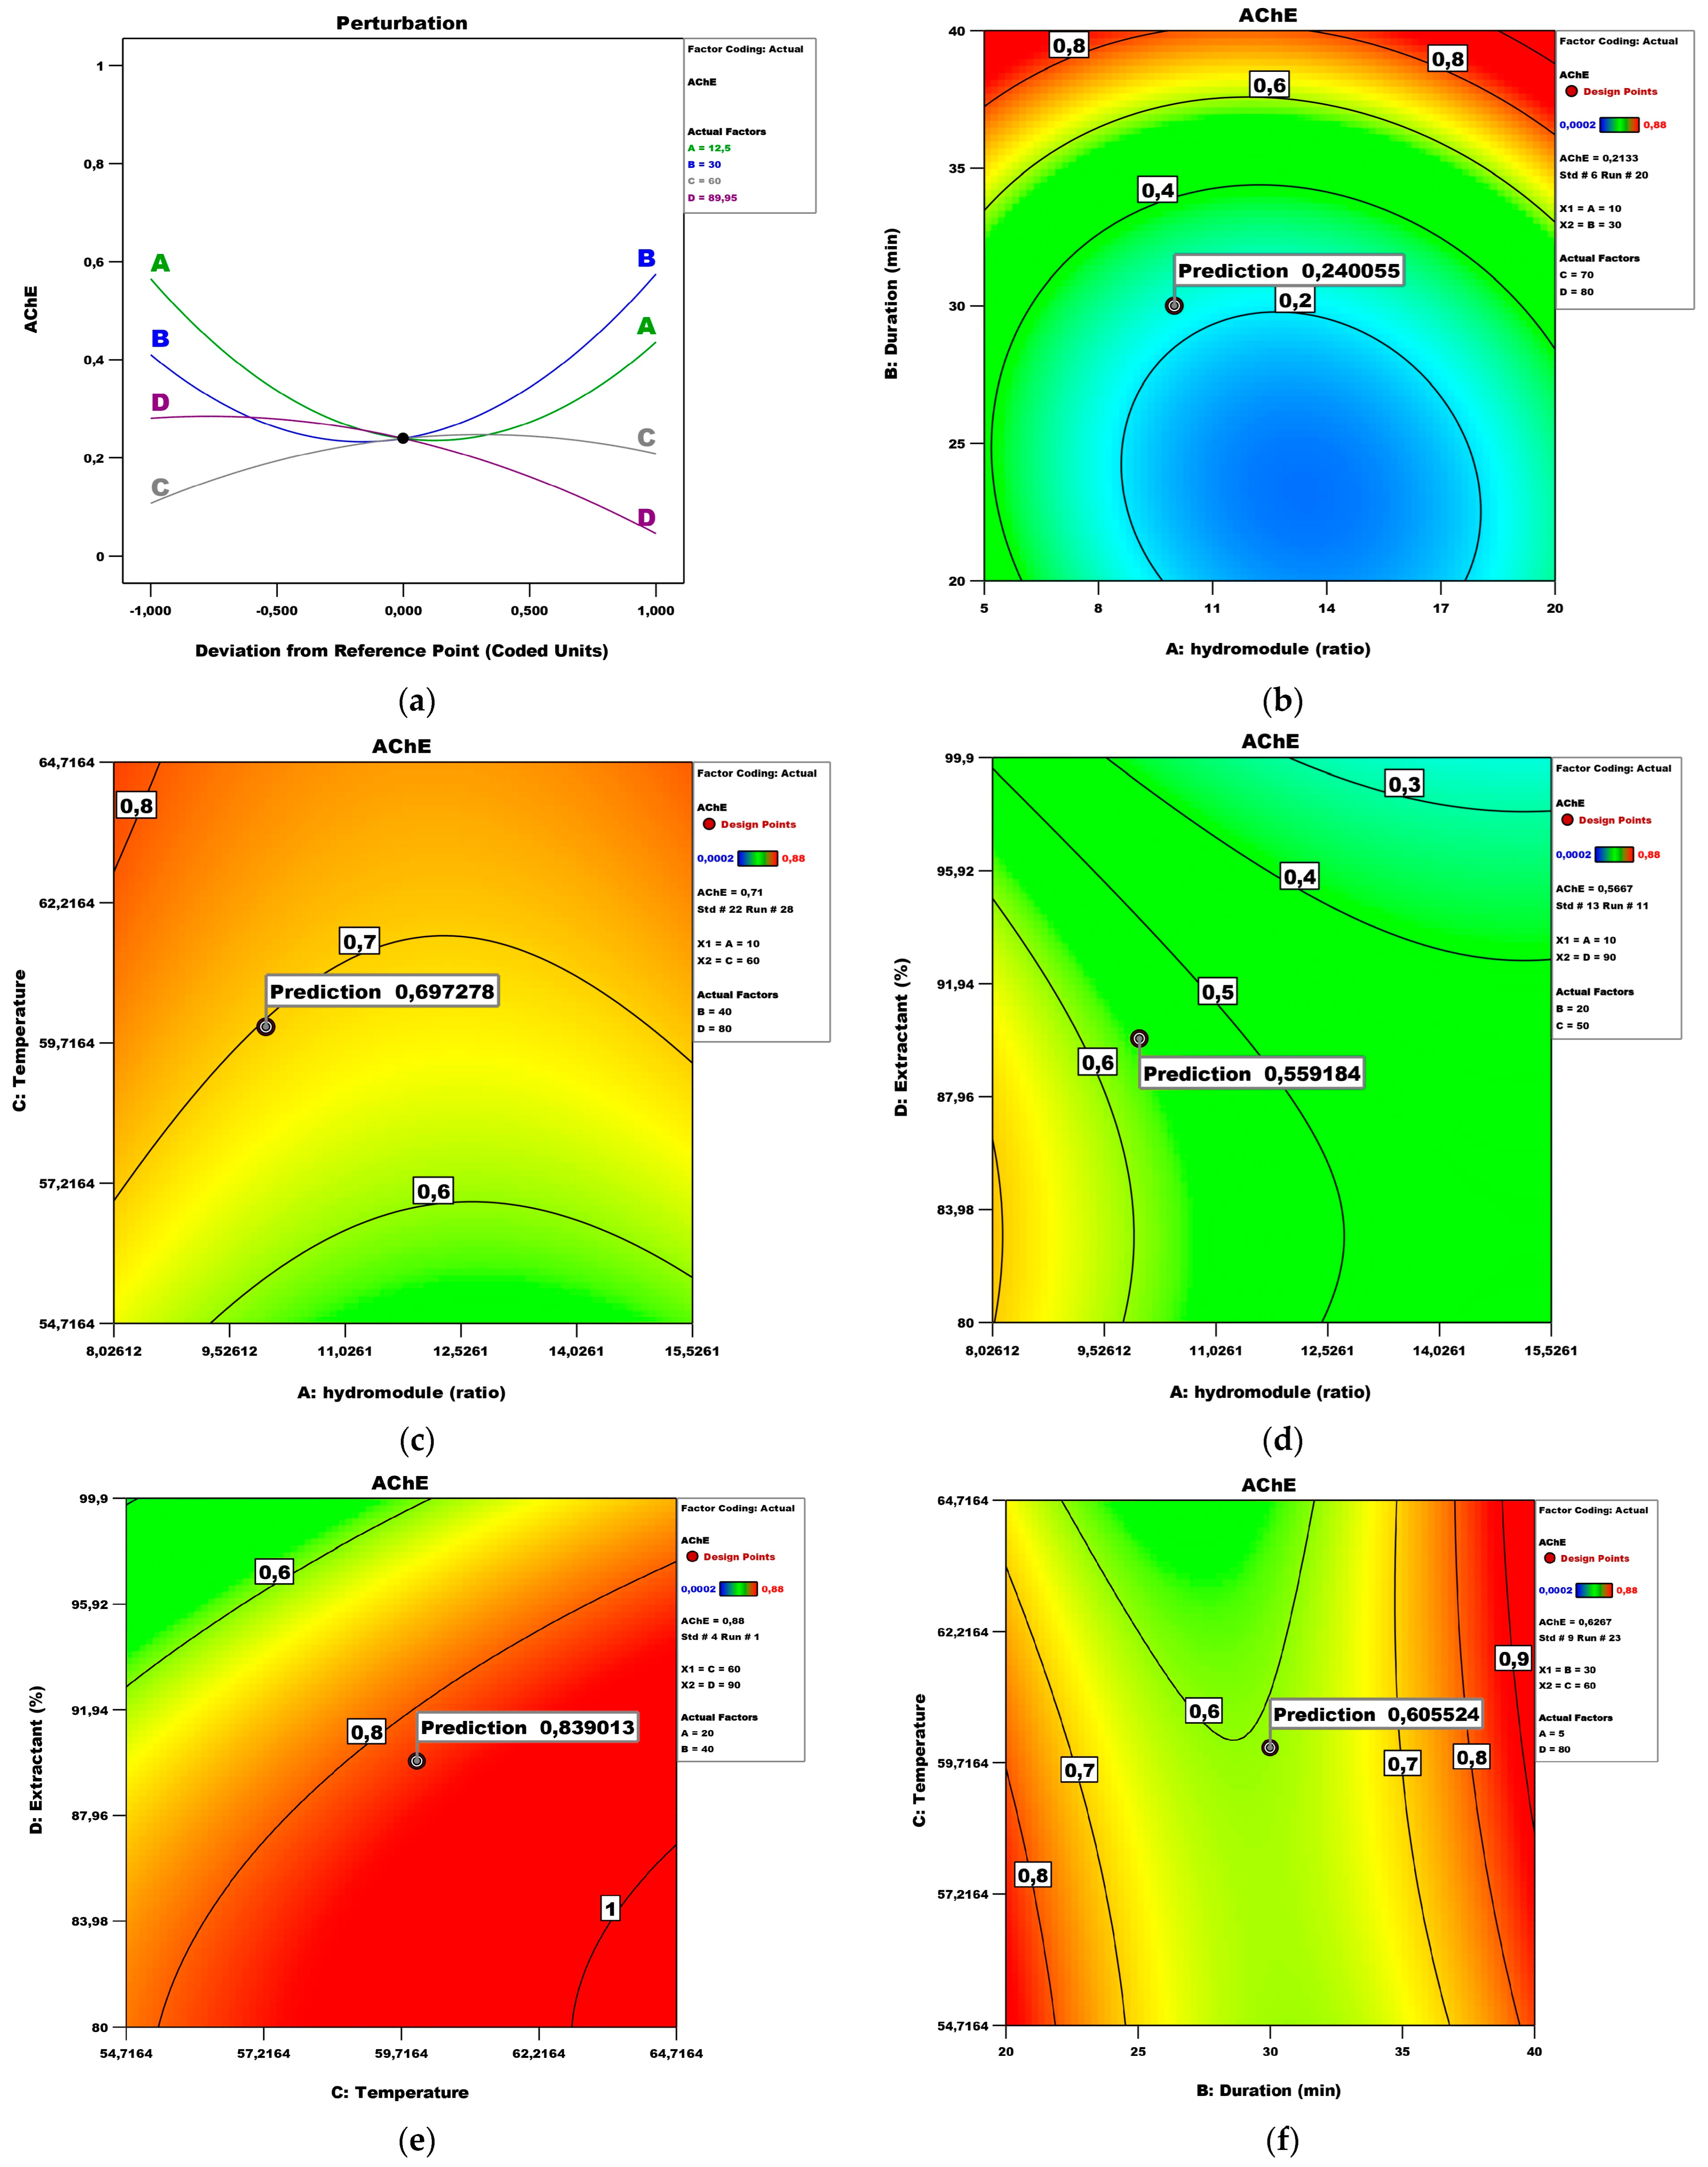
Figure 11 presents the perturbation and contour plots with a quadratic influence of the factors. The influence of the factors hydro module and duration is the most significant (Figure 11a). Figure 11b shows the effect of the hydro module and duration on the Ache inhibition potential while keeping the temperature and extractant at values of 70 °C and 80%, respectively. Under these conditions, the maximum AChE (IC20 0.27 mg/mL) could be obtained with a hydro module of 10 for a duration time of 30 min. Proposing optimal conditions for AChE inhibition is important not only because the topic is not well-exploited yet, but also because the treatment of Alzheimer’s and Parkinson’s diseases is gradually advancing. Any information that can spare resources and time is valuable for future industrial uses. Other authors confirm that RSM can be a useful prediction tool for the plants’ AChE inhibition potential [35].
Figure 11.
AChE inhibition model analysis: (a) Perturbation plot; (b) contour surface plots of AChE against hydro module (ratio) and duration (min); (c) contour surface plots of AChE against hydro module (ratio) and temperature; (d) contour surface plots of AChE against hydro module (ratio) and extractant; (e) contour surface plots of AChE against temperature and extractant; (f) contour surface plots of AChE against duration (min) and temperature.
Figure 11c shows the effect of the hydro module and temperature on the AChE while keeping the duration and extractant at values of 40 and 80, respectively. Under these conditions, the maximum Ache could be obtained with a hydro module of 10 and a temperature of 60 °C. Figure 11d shows the effect of the hydro module and extractant on the AChE while keeping the duration and temperature at values of 20 and 50 °C, respectively. Under these conditions, the maximum Ache could be obtained with a hydro module of 10 and an extractant of 90. Figure 11e shows the effect of the temperature and extractant on the AChE while keeping the hydro module and duration at values of 20 and 40, respectively. Under these conditions, the maximum Ache could be obtained at 60 °C and an extractant of 90%. Figure 11f shows the effect of the duration and temperature on the AChE while keeping the hydro module and extractant at values of 5 and 80, respectively. Under these conditions, the maximum AChE could be obtained with a duration of 30 and a temperature of 60 °C. Other authors have reported the optimal conditions for UAE in terms of high AChE-inhibitory activity to be the following: methanol concentration of 85.06%, ultrasonic time of 39.1 min, and material-to-liquid ratio of 1.06:10 (g/mL) [36].
In order for the conclusions from the dispersion analyzes to be sufficiently reliable, the following is necessary.
All samples must be drawn from normally distributed populations. To ascertain this, a normality check was performed. The Shapiro–Wilk test is a more appropriate method for small sample sizes (<50 samples), as is the case here. In this test, the null hypothesis states that the data were taken from a normally distributed population. Thus, when the p-value > 0.05, the null hypothesis is accepted and the data are assumed to be normally distributed. The results are presented in Table 15. The software product SPSS v.26 was used to obtain them. The reason is that the Design Expert v.13 software does not provide specific tools for performing tests for normality, homogeneity, etc., of populations such as those available in SPSS or other statistical software packages. Instead, Design Expert focuses on experimental design and analysis of experimental results. As can be seen from the last column of Table 15, all p-values are greater than 0.05, and therefore, the data are normally distributed. In fact, this is also evident from Figure 2a, Figure 4a, Figure 6a and Figure 10a.
Table 15.
ANOVA test of normality.
The samples must have a common variance. To verify this, a homogeneity test (Test of Homogeneity of Variance) was carried out in SPSS, i.e., hypotheses of equality of population variances were tested using Levene’s Test of Equality of Error Variances. For the condition of homogeneity of variances to be met, Levene’s test should not be statistically significant, i.e., p-value > 0.05. The homogeneity test results obtained are presented in Table 16. They show that the homogeneity requirement is met.
Table 16.
ANOVA test of Homogeneity of Variance.
A numerical optimization is implemented, which aims to find a point that maximizes the desirability function. Table 17 presents the constraints under which the optimization was performed. In reality, the desired effect is for values of the independent factors that are in the studied range to obtain maximum values for responses.
Table 17.
Optimization constraints.
Table 18 shows that all goals are joined into one desirability function, which ix based on various responses and factors. The suitable optimum formulation (Hydro module of 20, Duration of 39.328 min, Temperature of 70 °C, and Extractant of 96.638%) with high desirability of 0.703 was selected. The Design Expert v.13 software returns a table of 100 possible solutions. For brevity, only the first three of them are presented here.
Table 18.
Optimization solution.
4. Conclusions
The effect of UAE extraction conditions of Prunus persica L. from the “Filina” variety on the polyphenolic antioxidants was optimized using a Box–Behnken experimental design with four variables and three levels. Using the response surface method, the optimal extraction conditions for the extraction of bioactive compounds were found to be the following: hydro modulus of 20, duration of 39.33 min, temperature of 70 °C, and extractant of 96.64%. In addition, empirical relationships between input variables and responses have been established. For five of the responses, namely FRAP, DPPH, ABTS, α-glucosidase, and AChE, the dependence is second-order. The extractant and the duration are set as most important. The model for TPC is linear, while for TFC, the model is linear with interactions. The only non-reportable model is CUPRAC.
In conclusion, it can be said that Prunus persica L. can be used as a basis for the extraction of bioactive compounds and antioxidants to be put into functional foods and/or cosmetic preparations. This work can act as a core for other researchers to assess and quantify the biological activity of Prunus persica L. However, the purification of bioactive compounds and in vivo evaluation should be further investigated.
Author Contributions
Conceptualization, D.M., M.T. and I.D.; methodology, D.M., M.T. and I.D.; software, M.T.; validation, D.M. and M.T.; formal analysis, D.M. and I.D.; investigation, D.M.; resources, D.M.; data curation, D.M.; writing—original draft preparation, D.M., M.T., A.P. and I.D.; writing—review and editing, D.M., M.T., A.P., A.L. and I.D.; visualization, M.T.; supervision, D.M. and A.L.; project administration, D.M.; funding acquisition, D.M. All authors have read and agreed to the published version of the manuscript.
Funding
This work was partially supported by the Bulgarian National Science Fund, project no. KП-06-H37/23 (granted to Dasha Mihaylova).
Institutional Review Board Statement
Not applicable.
Informed Consent Statement
Not applicable.
Data Availability Statement
The raw data supporting the conclusions of this article will be made available by the authors on request.
Acknowledgments
This work was partially supported by the Bulgarian National Science Fund, project no. KП-06-H37/23 (granted to Dasha Mihaylova). The authors would like to express their gratitude to Argir Zhivondov from the Fruit Growing Institute, Plovdiv (Bulgaria), and his team for kindly providing the peach samples.
Conflicts of Interest
The authors declare no conflicts of interest. The funders had no role in the design of the study; in the collection, analyses, or interpretation of data; in the writing of the manuscript; or in the decision to publish the results.
References
- World Health Organization. Noncommunicable Diseases and Major Factors. In World Health Statistics 2023: Monitoring Health for the SDGs, Sustainable Development Goals; World Health Organization: Geneva, Switzerland, 2023. [Google Scholar]
- Popova, A.; Mihaylova, D.; Pandova, S.; Doykina, P. Research-Gap-Spotting in Plum–Apricot Hybrids—Bioactive Compounds, Antioxidant Activities, and Health Beneficial Properties. Horticulturae 2023, 9, 584. [Google Scholar] [CrossRef]
- Mihaylova, D.; Popova, A.; Desseva, I.; Petkova, N.; Stoyanova, M.; Vrancheva, R.; Slavov, A.; Slavchev, A.; Lante, A. Comparative Study of Early- and Mid-Ripening Peach (Prunus persica L.) Varieties: Biological Activity, Macro-, and Micro- Nutrient Profile. Foods 2021, 10, 164. [Google Scholar] [CrossRef]
- Mihaylova, D.; Desseva, I.; Popova, A.; Dincheva, I.; Vrancheva, R.; Lante, A.; Krastanov, A. GC-MS Metabolic Profile and α-Glucosidase-, α-Amylase-, Lipase-, and Acetylcholinesterase-Inhibitory Activities of Eight Peach Varieties. Molecules 2021, 26, 4183. [Google Scholar] [CrossRef]
- Li, Y.; Li, L.; Zhang, X.; Mu, Q.; Tian, J.; Yan, J.; Guo, L.; Wang, Y.; Song, L.; Yu, X. Differences in Total Phenolics, Antioxidant Activity and Metabolic Characteristics in Peach Fruits at Different Stages of Ripening. LWT 2023, 178, 114586. [Google Scholar] [CrossRef]
- Irakli, M.; Kleisiaris, F.; Kadoglidou, K.; Katsantonis, D. Optimizing Extraction Conditions of Free and Bound Phenolic Compounds from Rice By-Products and Their Antioxidant Effects. Foods 2018, 7, 93. [Google Scholar] [CrossRef]
- Liu, W.; Nan, G.; Farrukh Nisar, M.; Wan, C. Chemical Constituents and Health Benefits of Four Chinese Plum Species. J. Food Qual. 2020, 2020, 8842506. [Google Scholar] [CrossRef]
- Nawaz, H.; Shad, M.A.; Rehman, N.; Andaleeb, H.; Ullah, N. Effect of Solvent Polarity on Extraction Yield and Antioxidant Properties of Phytochemicals from Bean (Phaseolus vulgaris) Seeds. Braz. J. Pharm. Sci. 2020, 56, e17129. [Google Scholar] [CrossRef]
- Akinmoladun, A.C.; Falaiye, E.; Ojo, O.B.; Adeoti, A.; Amoo, Z.A.; Olaleye, M.T. Effect of Extraction Technique, Solvent Polarity, and Plant Matrix on the Antioxidant Properties of Chrysophyllum Albidum G. Don (African Star Apple). Bull. Natl. Res. Cent. 2022, 46, 40. [Google Scholar] [CrossRef]
- Kumar, K.; Srivastav, S.; Sharanagat, V.S. Ultrasound Assisted Extraction (UAE) of Bioactive Compounds from Fruit and Vegetable Processing by-Products: A Review. Ultrason. Sonochem. 2021, 70, 105325. [Google Scholar] [CrossRef]
- Andres, A.I.; Petron, M.J.; Lopez, A.M.; Timon, M.L. Optimization of Extraction Conditions to Improve Phenolic Content and In Vitro Antioxidant Activity in Craft Brewers’ Spent Grain Using Response Surface Methodology (RSM). Foods 2020, 9, 1398. [Google Scholar] [CrossRef]
- Iadecola, R.; Ciccoritti, R.; Ceccantoni, B.; Bellincontro, A.; Amoriello, T. Optimization of Phenolic Compound Extraction from Brewers’ Spent Grain Using Ultrasound Technologies Coupled with Response Surface Methodology. Sustainability 2022, 14, 3309. [Google Scholar] [CrossRef]
- Chen, S.; Zhang, H.; Yang, L.; Zhang, S.; Jiang, H. Optimization of Ultrasonic-Assisted Extraction Conditions for Bioactive Components and Antioxidant Activity of Poria Cocos (Schw.) Wolf by an RSM-ANN-GA Hybrid Approach. Foods 2023, 12, 619. [Google Scholar] [CrossRef]
- Kujala, T.S.; Loponen, J.M.; Klika, K.D.; Pihlaja, K. Phenolics and Betacyanins in Red Beetroot (Beta vulgaris) Root: Distribution and Effect of Cold Storage on the Content of Total Phenolics and Three Individual Compounds. J. Agric. Food. Chem. 2000, 48, 5338–5342. [Google Scholar] [CrossRef]
- Kivrak, I.; Kivrak, S. Antioxidant Properties, Phenolic Profile and Nutritional Value for Sorbus umbellata Fruits from Turkey. J. Nutr. Food Sci. 2014, 2, 1043. [Google Scholar]
- Brand-Williams, W.; Cuvelier, M.E.; Berset, C. Use of a Free Radical Method to Evaluate Antioxidant Activity. LWT—Food Sci. Technol. 1995, 28, 25–30. [Google Scholar] [CrossRef]
- Mihaylova, D.; Lante, A.; Krastanov, A. Total Phenolic Content, Antioxidant and Antimicrobial Activity of Haberlea Rhodopensis Extracts Obtained by Pressurized Liquid Extraction. Acta Aliment. 2015, 44, 326–332. [Google Scholar] [CrossRef]
- Re, R.; Pellegrini, N.; Proteggente, A.; Pannala, A.; Yang, M.; Rice-Evans, C. Antioxidant Activity Applying an Improved ABTS Radical Cation Decolorization Assay. Free Radic. Biol. Med. 1999, 26, 1231–1237. [Google Scholar] [CrossRef]
- Benzie, I.F.F.; Strain, J.J. [2] Ferric Reducing/Antioxidant Power Assay: Direct Measure of Total Antioxidant Activity of Biological Fluids and Modified Version for Simultaneous Measurement of Total Antioxidant Power and Ascorbic Acid Concentration. In Oxidants and Antioxidants Part A; Academic Press: Cambridge, MA, USA, 1999; Volume 299, pp. 15–27. ISBN 0076-6879. [Google Scholar]
- Apak, R.; Özyürek, M.; Karademir Çelik, S.; Güçlü, K. CUPRAC Method 2004, JAFC. J. Agric. Food Chem. 2004, 52, 7970–7981. [Google Scholar] [CrossRef]
- Lobbens, E.S.B.; Vissing, K.J.; Jorgensen, L.; van de Weert, M.; Jäger, A.K. Screening of Plants Used in the European Traditional Medicine to Treat Memory Disorders for Acetylcholinesterase Inhibitory Activity and Anti Amyloidogenic Activity. J. Ethnopharmacol. 2017, 200, 66–73. [Google Scholar] [CrossRef]
- Myers, R.H.; Montgomery, D.C.; Response, C.M.A.-C. Surface Methodology: Process and Product Optimization Using. In Wiley Series in Probability And Statistics, 4th ed.; John Wiley & Sons Inc.: Hoboken, NJ, USA, 2016; p. 894. [Google Scholar]
- Solal, S.; Djimtoingar, N.; Sarfo, A.; Derkyi, F.; Atta, K.; Yankyera, J.K.; Djimtoingar, S.S.; Sarfo, N.; Derkyi, A.; Kuranchie, F.A.; et al. A Review of Response Surface Methodology for Biogas Process Optimization. Cogent. Eng. 2022, 9, 2115283. [Google Scholar] [CrossRef]
- Sharma, K.; Ko, E.Y.; Assefa, A.D.; Ha, S.; Nile, S.H.; Lee, E.T.; Park, S.W. Temperature-Dependent Studies on the Total Phenolics, Flavonoids, Antioxidant Activities, and Sugar Content in Six Onion Varieties. J. Food Drug. Anal. 2015, 23, 243–252. [Google Scholar] [CrossRef]
- Medic, A.; Zamljen, T.; Hudina, M.; Veberic, R. Time-Dependent Degradation of Naphthoquinones and Phenolic Compounds in Walnut Husks. Biology 2022, 11, 342. [Google Scholar] [CrossRef]
- Mihaylova, D.; Popova, A.; Desseva, I.; Dincheva, I.; Tumbarski, Y. Valorization of Peels of Eight Peach Varieties: GC–MS Profile, Free and Bound Phenolics and Corresponding Biological Activities. Antioxidants 2023, 12, 205. [Google Scholar] [CrossRef]
- Filimon, R.V.; Bunea, C.I.; Bora, F.D.; Filimon, R.M.; Dunca, S.I.; Rózsa, S.; Ciurlă, L.; Patraș, A. Physico-Chemical Characterization, Phenolic Compound Extraction and Biological Activity of Grapevine (Vitis vinifera L.) Canes. Horticulturae 2023, 9, 1164. [Google Scholar] [CrossRef]
- Andriyani, R.; Kosasih, W.; Ningrum, D.R.; Pudjiraharti, S. Effect of Temperature, Time, and Milling Process on Yield, Flavonoid, and Total Phenolic Content of Zingiber Officinale Water Extract. IOP Conf. Ser. Earth Environ. Sci. 2017, 60, 012012. [Google Scholar] [CrossRef]
- Fadda, A.; Serra, M.; Molinu, M.G.; Azara, E.; Barberis, A.; Sanna, D. Reaction Time and DPPH Concentration Influence Antioxidant Activity and Kinetic Parameters of Bioactive Molecules and Plant Extracts in the Reaction with the DPPH Radical. J. Food Compos. Anal. 2014, 35, 112–119. [Google Scholar] [CrossRef]
- Hagar, A.; Fatihah, N.; Rani, A.; Ibrahim, M.; Ramli, N.; Ahmed, I.A.; Maleyki, A.; Jalil, M.; Nur, M.; Anuar, N. Optimization of extraction temperature and time on phenolic compounds and antioxidant activity of malaysian Propolis trigona spp. Aqueous extract using response surface methodology (Pengoptimuman Suhu Dan Masa Pengekstrakan Pada Sebatian Fenolik Dan Aktivikiti Antioksidan Daripada Ekstrak Akues Propolis Kelulut (Trigona spp.) Malaysia Menggunakan Kaedah Gerak Balas Permukaan). Malays. J. Anal. Sci. 2021, 25, 649–660. [Google Scholar]
- Villaño, D.; Fernández-Pachón, M.S.; Moyá, M.L.; Troncoso, A.M.; García-Parrilla, M.C. Radical Scavenging Ability of Polyphenolic Compounds towards DPPH Free Radical. Talanta 2007, 71, 230–235. [Google Scholar] [CrossRef]
- Biswas, A.; Dey, S.; Xiao, A.; Deng, Y.; Birhanie, Z.M.; Roy, R.; Akhter, D.; Liu, L.; Li, D. Ultrasound-Assisted Extraction (UAE) of Antioxidant Phenolics from Corchorus Olitorius Leaves: A Response Surface Optimization. Chem. Biol. Technol. Agric. 2023, 10, 64. [Google Scholar] [CrossRef]
- Mudaser, B.; Mumtaz, M.W.; Akhtar, M.T.; Mukhtar, H.; Raza, S.A.; Shami, A.A.; Touqeer, T. Response Surface Methodology Based Extraction Optimization to Improve Pharmacological Properties and 1H NMR Based Metabolite Profiling of Azadirachta Indica. Phytomed. Plus 2021, 1, 100015. [Google Scholar] [CrossRef]
- Ingawale, A.S.; Sadiq, M.B.; Nguyen, L.T.; Ngan, T.B. Optimization of Extraction Conditions and Assessment of Antioxidant, α-Glucosidase Inhibitory and Antimicrobial Activities of Xanthium strumarium L. Fruits. Biocatal. Agric. Biotechnol. 2018, 14, 40–47. [Google Scholar] [CrossRef]
- Kim, J.K.; Kim, C.R.; Lim, H.J.; Nam, S.H.; Joo, O.S.; Shin, D.H.; Shin, E.C. An Optimized Extraction Technique for Acetylcholinesterase Inhibitors from the Camellia Japonica Seed Cake by Using Response Surface Methodology. Biosci. Biotechnol. Biochem. 2014, 78, 1237–1241. [Google Scholar] [CrossRef]
- Meng, R.; Ou, K.; Chen, L.; Jiao, Y.; Jiang, F.; Gu, R. Response Surface Optimization of Extraction Conditions for the Active Components with High Acetylcholinesterase Inhibitory Activity and Identification of Key Metabolites from Acer truncatum Seed Oil Residue. Foods 2023, 12, 1751. [Google Scholar] [CrossRef] [PubMed]
Disclaimer/Publisher’s Note: The statements, opinions and data contained in all publications are solely those of the individual author(s) and contributor(s) and not of MDPI and/or the editor(s). MDPI and/or the editor(s) disclaim responsibility for any injury to people or property resulting from any ideas, methods, instructions or products referred to in the content. |
© 2024 by the authors. Licensee MDPI, Basel, Switzerland. This article is an open access article distributed under the terms and conditions of the Creative Commons Attribution (CC BY) license (https://creativecommons.org/licenses/by/4.0/).