Article

Insights on the Potential of Carob Powder (Ceratonia siliqua L.) to Improve the Physico-Chemical, Biochemical and Nutritional Properties of Wheat Durum Pasta

1
Faculty of Food and Tourism, Transilvania University of Brasov, Castelului 148, 500014 Brasov, Romania
2
Faculty of Materials Science and Engineering, Transilvania University of Brasov, Eroilor 29 Blvd., 500039 Brasov, Romania
3
Faculty of Food Engineering, University of Life Sciences “King Mihai I” from Timisoara, Calea Aradului 119, 300645 Timisoara, Romania
*
Authors to whom correspondence should be addressed.
Appl. Sci. 2023, 13(6), 3788; https://doi.org/10.3390/app13063788
Submission received: 5 February 2023 / Revised: 13 March 2023 / Accepted: 14 March 2023 / Published: 16 March 2023

Abstract

:
The aim of this research was to improve the physical-chemical properties and processability of wheat durum pasta while adding supplementary nutritional benefits. This was accomplished by incorporating carob powder into the conventional wheat pasta recipe. The study investigated the properties of pasta made with different proportions of carob powder (2%, 4%, 6% w/w) and evaluated its nutritional profile, texture, dough rheological properties and the content of bioactive compounds such as phenolic compounds. The physical and chemical properties (total treatable acidity, moisture content, and protein content), compression resistance, rheological properties of the dough and sensory analysis were also analyzed. Results showed that incorporating up to 4% carob powder improved the sensory and functional properties of the pasta. Additionally, the study found that the pasta contained phenolic compounds such as Gallic, rosmarinic, rutin and protocatechuic acids, ferulic, coumaric, caffeic acid, resveratrol and quercetin, and increasing the percentage of carob powder improved the polyphenolic content. The study concluded that it is possible to create innovative value-added pasta formulas using carob powder. Thus, the information revealed by this study has the potential to expand the portfolio of functional pasta formulations on the food market.

1. Introduction

Pasta represents one of the most consumed food products throughout the world, being distinguished by easiness and quickness of preparation [1]. It is an important source of carbohydrates (mainly starch), it contains proteins, a variable number of fibers and a very low concentration of fat [2].
The last report of the International Pasta Organization (IPO) indicated that 14.5 million tons of pasta were produced worldwide in 2018 [3] and there is an expected growth rate of 2.7% annually until 2025 [4]. Pasta is a popular food product in Europe, with high rates of consumption being reported in the Western region, in Italy, Spain and France; the Balkan region, in Greece; and in the Southern region; as well as in Chile, Argentina, Peru and Venezuela, according to a study conducted by Statista Global Consumer Survey [5] There is an increasing demand for food products with functional properties. These dietary items, also referred to as functional foods, can be enhanced, enriched or fortified.
To increase the nutritional value of the pasta, different studies have been carried out by adding different cereals (e.g., barley and pigmented cereals) [6,7], maize bran, grape marc and brewers spent grain flour [8], legume and pseudocereal flours [9,10,11] and ingredients from various origins, such as oregano and carrot leaf meal [12].
Plant phytochemicals and phenolic antioxidants, such as those found in fruits, vegetables, herbs and spices, have been identified as active ingredients for use in functional foods [4]. This aspect launched the opportunity to create new types of pasta, involving novel ingredients [13].
Therefore, in our study, we wanted to highlight the influence and benefits of carob powder on the quality of pasta. Carob, scientifically denominated Ceratonia siliqua L., is an ancient crop, cultivated in countries located in the Mediterranean area. The plant belongs to the Leguminosae (Fabaceae) family, being used by humans for nourishment since early times, according to archeologists. Carob powder can be used as an additive for enhancing the aromatic profile of products, as a coloring thickener agent, as a sweetener and as an anticoeliac agent [14] in the pharmaceutical industry. The nutritional value of carob was considered relevant due to its high content of dietary fiber and phenolic compounds [15]. Several studies have investigated the effect of the addition of carob flour in bread and bakery products, revealing the functional profile of the products [16,17,18,19].
Due to its sweetness and flavor similar to chocolate, as well as its low price, the carob milled into flour is widely used in the Mediterranean region as a cocoa substitute for sweets, biscuits and processed drinks production [20,21,22,23]. Additionally, the advantage of using carob powder as a cocoa substitute is that it does not contain caffeine and theobromine [24]. In the last years, carob pods have gained considerable attention because of their high carbohydrate and mineral content: many high-value-added products, such as lactic acid, mannitol, citric acid and pullulans, were produced from carob fermentation [25]. In parallel, carob pods have been used as a resource for bioethanol production. In Lebanon, carob pulp is mainly used for the preparation of carob syrup or carob molasses denoted ‘‘dibs”, which is consumed by the Lebanese population as a sweetener [26].
The idea behind this study focused on the fact that, to date, little information is available on the usefulness of carob as an unconventional ingredient for improving the physicochemical, biochemical and nutritional properties of durum wheat pasta. Only a few attempts to use carob flour as an alternative source of polyphenolic compounds to design new pasta formulations have been reported. In this respect, the studies by Biernacka et al. [27] and Seczyk et al. [28] are a valuable starting point for our research. In terms of dough processability and sensory properties of the pasta, a major influence is given by the level of ingredients incorporated and requires in-depth studies in order to optimize formulations. It has also been noted that the fortification of pasta with functional ingredients rich in polyphenolic compounds allows for increasing the content of bioactive compounds, but this effect may be limited to a different extent by several factors, including the binding of polyphenolic compounds with food matrix constituents as a result of interactions of these compounds with proteins and starch. [29].
Following the above information, the goal of this research was to highlight the beneficial properties of carob powder by using it in the production of composite flours in the proportions of 2%, 4% and 6% (w/w) to develop functional wheat durum pasta. For this purpose, the content of bioactive compounds such as individual phenolic compounds were studied, as well the physicochemical properties (total titratable acidity, moisture content, protein content), dough rheological properties and compression resistance, and the sensory analysis was conducted.

2. Materials and Methods

2.1. Raw Materials

The raw material used in the technological process of carob pasta is durum wheat semolina flour produced by Valse Mollen Denmark. Premium semolina is a grist of coarse, relatively uniformly sized particles (200–425 μm) of the endosperm with minimal fines (flour) and bran content. In the process of milling durum wheat to obtain flour of particle size 300–500 μm, wheat bran and germ are removed from the flour [30].
The commercial profile of semolina, according to the common European semolina specifications, included: moisture 15%, protein 12%, ash 0.88%, granulation: over 500 µm (0%), over 355 µm (20%), over 250 µm (45%), over 180 µm (20%), under 180 µm (15%) [30]. Supplementary nutritional parameters were provided by the producer: 1.9% fat, 68% carbohydrates, 3.5% fibers and 0.01% salt.
Carob (Ceratonia siliqua L.) flour used for sample preparation produced by Sanovita Valcea was purchased from a local specialized shop and stored in a dry place until use. The nutritional profile offered by the producer was: proteins (5.1%), lipids (0.3% of which was saturated), carbohydrates (80.7%) and fibers (10.8%).
Iodized salt used in pasta production was purchased from a local market and tap water used was collected from the national water distribution. Eggs were achieved from a local farm, produced in an organic method.

2.2. Pasta Preparation

The recipes of pasta with the addition of carob included mixtures in which the share of the mass of carob powder was 2%, 4% and 6% (m/m) of the mass of the mixture (100 g). A control sample with no addition of carob powder was also prepared. Thus, four pasta formulations were prepared. The recipe of the control sample consists of 100 g wheat flour, 37.5 mL of water, 1 g salt and 21 g egg. In pasta formulas with added carob, the wheat flour was replaced by a mixture of 98 g wheat flour and 2 g carob powder, 96 g wheat flour and 4 g carob powder and 94 g wheat flour and 6 g carob powder. Pasta sample coding is released in Table 1.
The pasta manufacturing process is shown in Figure 1.
The raw materials and ingredients were dosed, weighted and scaled before being mixed at 250 rpm for 15 min in a laboratory mixer (Tefal Wizzo–QB307, Tefal, Rumilly, France) until a homogenous and firm dough was obtained. The dough was then divided into two 50 g pieces and laminated with a laminating machine (Laica PM2000, LAICA S.p.A., Barbarano Mossano (VI), Italy), pressed to eliminate air bubbles and excessive water deposit until the moisture content of the dough was 12 percent and the thickness of 2.5 mm was achieved. Then, the dough sheet was cut into tagliatelle shapes with a width of 4 mm and then dried by using a drying rack (KitchenAid—Pasta Drying Rack 5KPDR) and a laboratory drying oven at 50 °C (Deca PT-40) until pasta moisture reached the value of 12% moisture/100 g of pasta. The samples were carried out in triplicate for each type of flour.

2.3. Rheological Properties of the Dough

The biaxial stretching rheological properties of the dough at constant hydration were determined with a Chopin alveograph (Chopin Technologies, F Model Alveographe NG, Chopin, France). The method is based on the tensile strength of a dough sheet that is rested for 20 min and then subjected to a constant air pressure current until it forms a bubble and subsequently breaks. The air pressure inside the bubble is recorded until the bubble breaks and is then extrapolated graphically as a curve that reflects the dough’s resistance to deformation [31].
The following parameters were recorded for each dough formulation: maximum overpressure P [mmH2O], swelling index G (mm) and deformation energy W (J). The indicator L (mm) represents the dough extensibility (mm), estimating its handling properties. The P/L ratio indicates the ratio between the dough’s toughness and its extensibility and is an important indicator along with W for characterizing flours for different bread and pastry products.

2.4. Extraction of Polyphenolic Compounds

The extraction of polyphenolic compounds was performed according to the method by Gaita et al. [29] by grinding the dry pasta samples and then performing in a hydroalcoholic medium with ethanol 45% (v/v). The solid ratio: solvent of 1:20 was stirred at a temperature of 25 °C for one hour, using the shaker Heidolph Promax 1020 (Heidolph Instruments GmbH & Co. KG, Schwabach, Germany). The extraction was filtered, and the obtained clear fractions were used for further analysis.

2.5. Determination of Total Phenolic Content and Polyphenolic Compounds Profile

Folin–Ciocalteu assay was used to determine the total phenolic content [32]. We used 0.5 mL from the extraction of each type of pasta treated with 1.25 mL of Folin–Ciocalteu reagent (Merck, Darmstadt, Germany) diluted 1:10 with water for this purpose. After incubating the sample for 5 min at room temperature, 1 mL Na2CO3 60 g/L was added. A UV-VIS spectrophotometer was used to measure sample absorption at 750 nm after 30 min of incubation at 50 °C (Analytic Jena Specord 205). The calibration curve was created with Gallic acid as the standard at concentrations ranging from 5–250 g/mL.
The results of total phenolic content (TPC) were expressed in micrograms of Gallic acid equivalents (GAE) per g of investigated sample.
The profile of polyphenolic compounds was determined using high-performance liquid chromatography coupled with mass spectrometry (LC-MS) as described by Abdel-Hameed et al. [33]. The main polyphenols in carob flour pasta samples were determined using LC-MS with SPD-10A UV (Shimadzu) and LC-MS 2010 detectors, column EC 150/2 NUCLEODUR C18 Gravity SB 150 × 2 mm × 5 μm. The following were the chromatographic conditions: mobile stages A: water with formic acid at pH-3, B: acetonitrile with formic acid at pH-3, gradient program: 0.01–20 min 5% B, 20.01–50 min 5% B, 5–55 min 5% B, 55–60 min 5% B. Temperature 20 °C, mobile phase 0.2 mL/min The monitoring wavelengths were 280 nm and 320 nm. The curve calibration was drawn between 20 and 50 µg/mL. The results were given in µg/mL.

2.6. Determination of Total Titratable Acidity (TTA)

The samples of pasta were weighed to 15 g and chopped into small pieces for an easement of the homogenization process. The resulting samples were mixed with 100 mL of distilled water in a glass flask until homogenization. Meanwhile, the titration agent was formulated (Sodium Hydroxide 0.1 N Belle Chemical LLC, Billings, MT, USA). Three drops of phenolphthalein 1% in alcoholic solution were added and the titration started drop by drop, continuing until the indicator turned light pink and persisted for 30 s. The results were the average value of the two measurements. Total titratable acidity (acidity degrees/100 g product) was evaluated using the relationship presented in Equation (1):
Total   Titratable   Acidity   ( acidity   degrees / 100   g   products ) = V × 0.1 m × 100

2.7. Determination of Moisture Content

The moisture content of pasta samples was determined by using the gravimetric method reported by Rios et al. [34] and detailed in ISO 712:2009 [35]. Samples were weighed to 5 g using an analytical balance into a weighting vial and dried using a drying stove at 130 °C until reaching constant weight. Each sample was analyzed in triplicate and the results were expressed as average. The results were reported as weight percentage (%).

2.8. Determination of Compression Resistance

The crushing resistance of pasta was performed using a compression kit tester (Zwick-Roell Z005, Zwick, Ulm-Einsingen, Germany) [27]. Each sample was tested in triplicate and the results were expressed as averages. Measurements were carried out using cooked pasta and chilled until reaching the room temperature of 22.5 °C. Each sample was placed on the inferior machine pan (Zwich Z005) and compressed using a compression kit (2.5 mm thick) at a speed of 25 mm/min. The test was performed for determining the maximum force necessary for sample compression until the structure is smashed at 70% strain.

2.9. Determination of Protein and Fiber Content

The protein content of obtained pasta samples was evaluated by using the Kjeldahl mineralization method after nitrogen analysis using spectrophotometric analysis, according to the method reported by Heeger et al. [36] and Rios et al. [34]. The calibration was performed using ammonium chloride (NH4Cl) and a conversion factor corresponding to the analyzed category was applied (5.7) to determine the protein content of the samples. The analysis was performed in triplicate and the results were expressed as the average of the three trials. The result was expressed as weight percentage (%). The fiber content was calculated taking into account the fiber content of raw materials and the recipe of pasta fabrication according to [37].

2.10. Sensory Evaluation

The overall acceptability of the pasta was evaluated by considering two profiles—visual profile and taste profile [28]. The visual profile included attributes such as color, appearance, attractiveness and overall acceptability, and the taste profile included flavor, taste, texture, consistency and aftertaste.
For performing the analysis, a 9-point hedonic scale was used. Each scale corresponded to a perception in order to facilitate data processing as follows: 1—“Dislike extremely”; 2—“Dislike very much”; 3—“Moderately dislike”; 4—“ Slightly dislike”; 5—“Neither like nor dislike”; 6—“ Slightly like”; 7—“ Moderately like”; 8—“Like very much”; and 9—“Like extremely”.
Sensory analysis was performed at the Faculty of Food and Tourism, Brasov, Romania. Panelists who declared suffering from different digestive problems were excluded from the study due to the high risk of aggravation of the diseases. While performing the analysis, the panelists were presented with a total of four samples of the product, as indicated in Table 1.
A number of 30 panelists aged 18–60 were requested to evaluate the samples. The participants in the study are persons with experience and competencies in sensory analysis, teachers and students who have studied and taught the mentioned subject. Panelists were asked to evaluate each sample for the assessed parameters. Panelists received the samples by turn in order to diminish the similarity and interdependence between samples with a 5-min rest before each sample tasting. Samples were coded accordingly to the codification mentioned above and each sample was distributed in glass containers at 20 ± 1 g and placed at a temperature in the range of 18–20 °C until serving. Panelists were served a glass of water as a palate cleanser. Consent for each panelist was required.

2.11. Statistical Analysis

Data analyses were performed using SPSS software (Statistical Package for Social Sciences Statistics, version 25.0.0, IBM, 2009, New York, NY, USA) and analyzed by ANOVA and Duncan’s multiple range test (scored as significant if p < 0.05). The analysis was made in triplicate and the results were reported as mean value ± standard deviation.

3. Results and Discussion

3.1. Dough Rheological Properties

The rheological behavior of doughs and the quality attributes of final goods are greatly influenced by the water absorption capacity of flours, which varies among different flour sources [38].
The rheological parameters of pasta dough formulations are given in Table 2.
In the case of using 4% w/w carob flour, it can be noticed that there was an improvement in the extensibility (L) of the dough and the swelling index (G) by up to 33%. The extensibility of the dough is influenced by the raw materials of the dough preparation. Dube et al. [39] reported that the extensibility of 100% wheat control dough progressively decreased from 156 mm to 77 mm for 40% sorghum wheat dough, while Sibanda et al. [40] also recorded similar results of a decrease in extensibility from 132 mm for 100% wheat control dough to 36 mm for 30%. The pasta supplemented with 10% carob fruit showed better texture parameters (less hard, less sticky and less adhesive) [41].
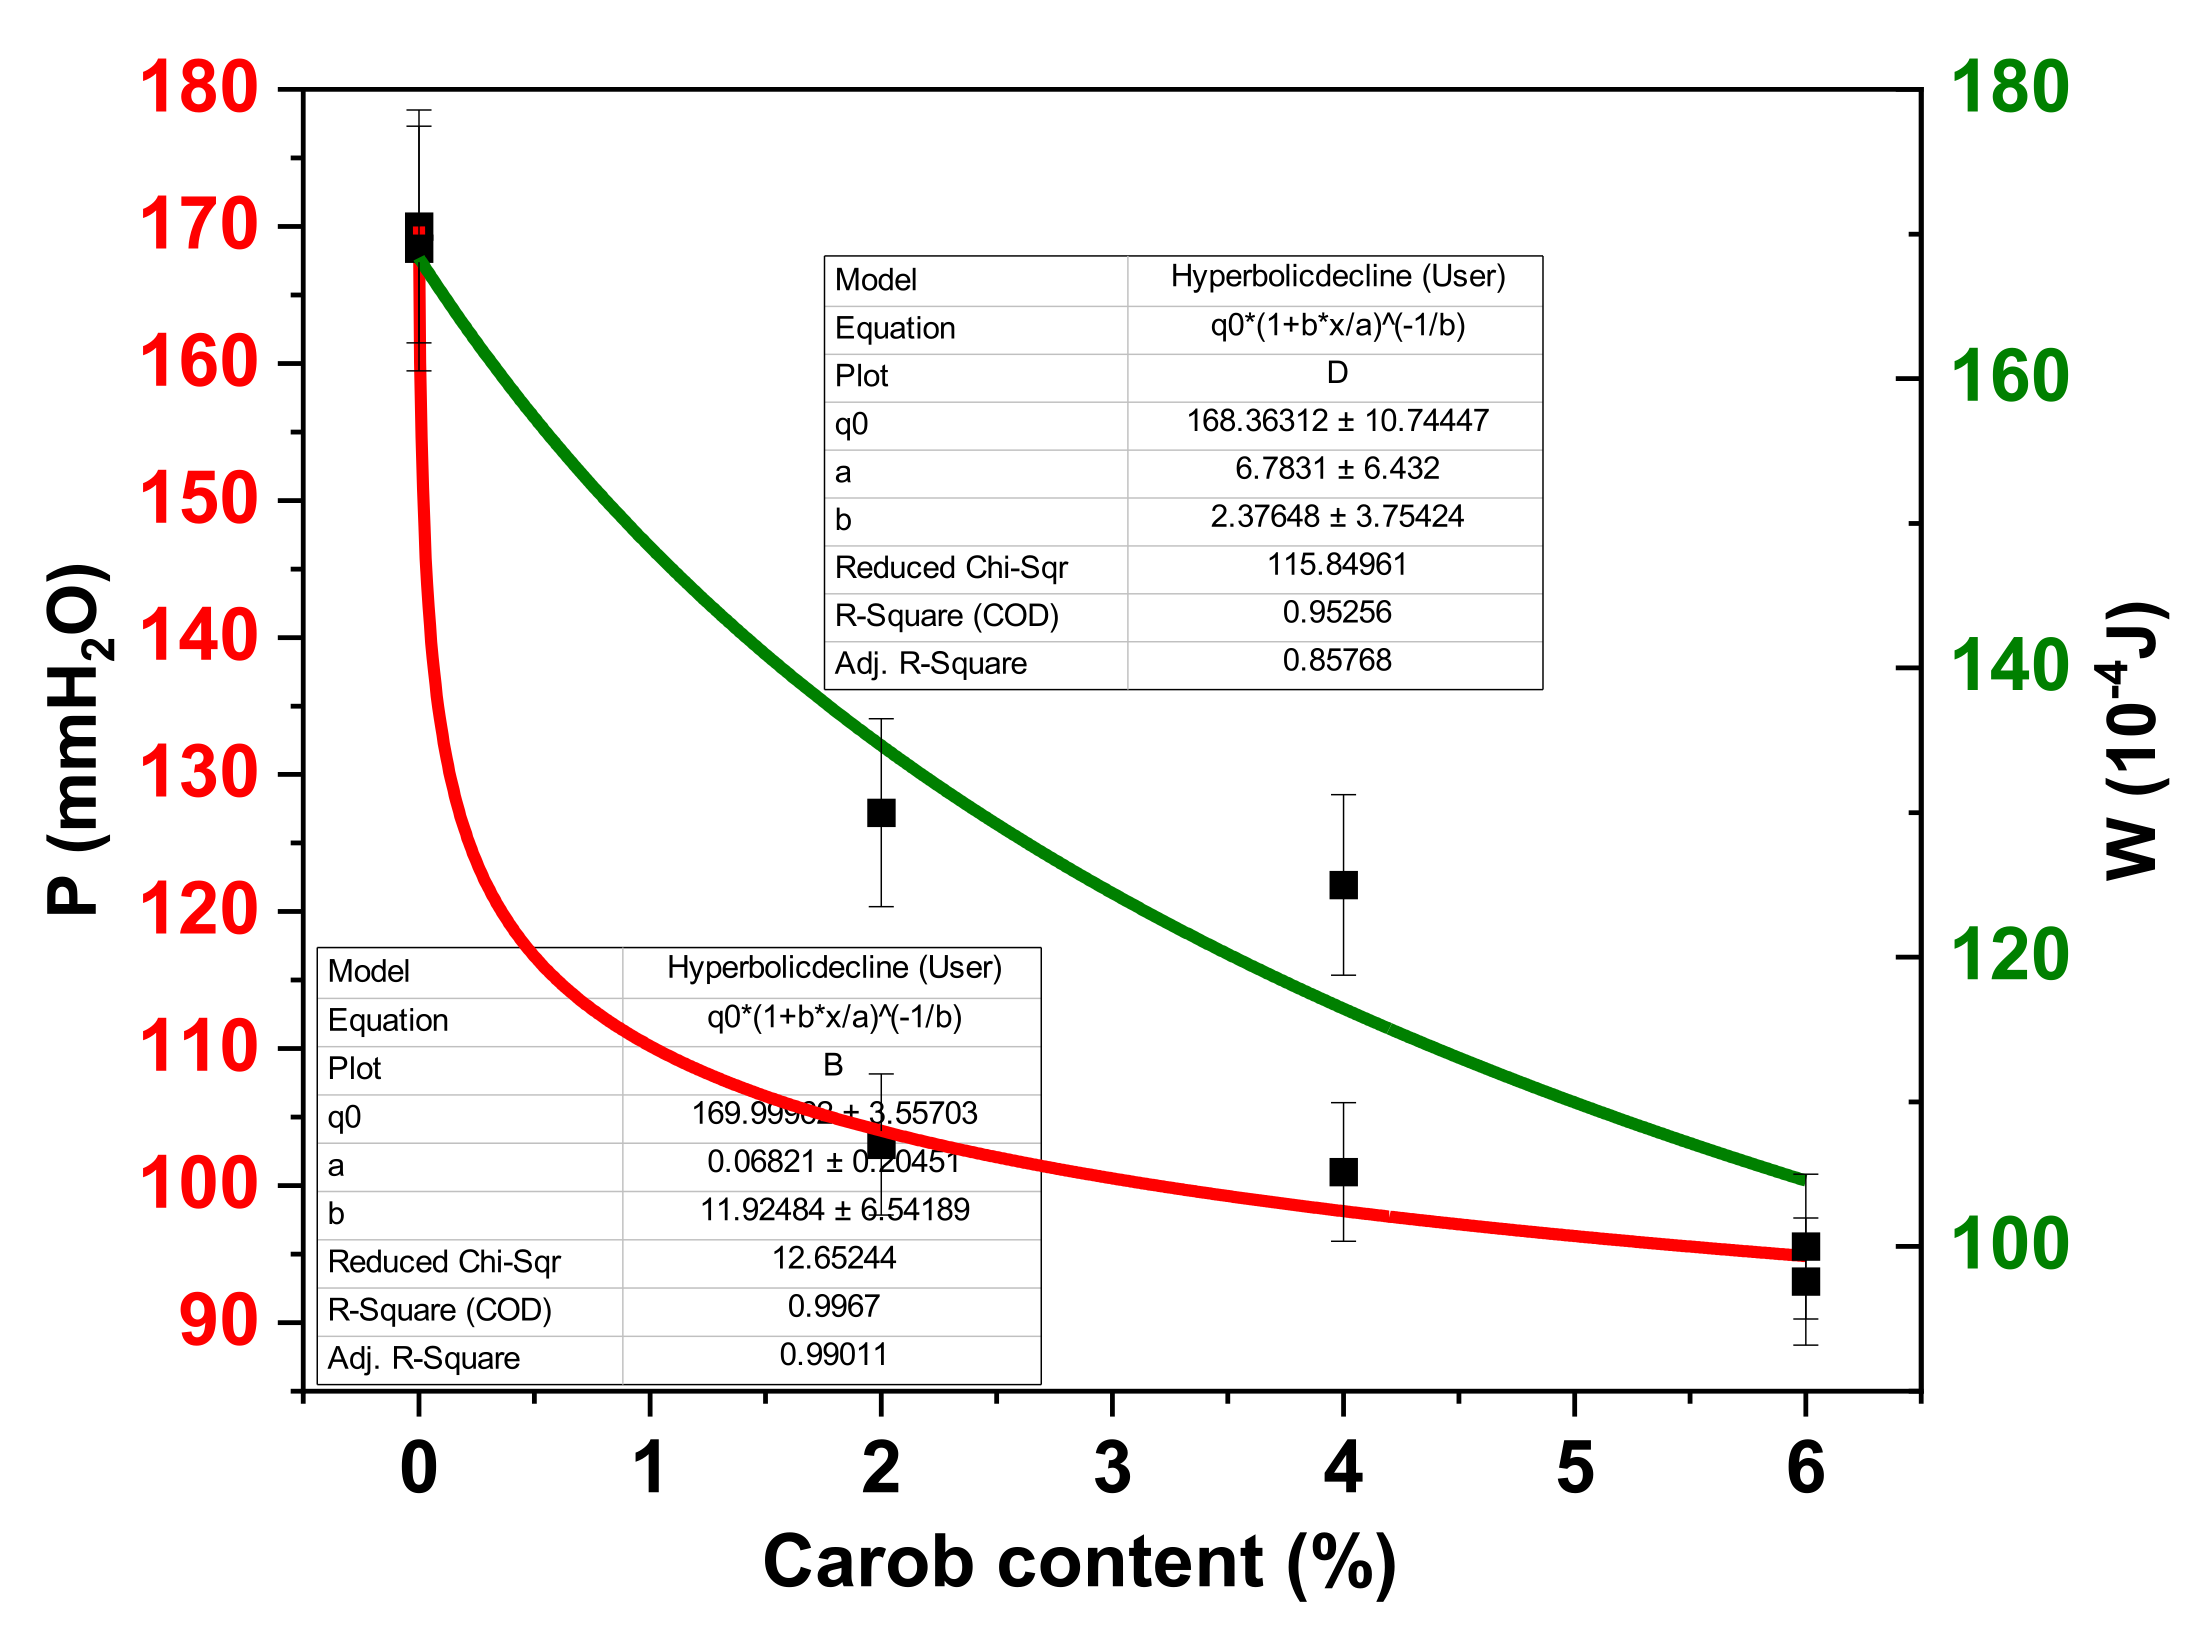
Figure 2 illustrates the variation of rheological parameters P and W with the amount of carob added to the pasta formulations.
Dough containing carob flour has the ability to retain gas and has a low capacity for extension without breaking. The dough with a more extensible character is particularly essential for improved gas retention during the process of baking which results in a good loaf volume [40].
The tenacity of the dough decreases by up to 40% with increasing carob content (the P and W values, Figure 2 and Table 2), which is probably due to the higher fiber content of the additive compared to neat semolina flour. However, this decrease is normal for a non-gluten additive and does not significantly alter the processability of the dough. The increased extensibility of the carob-containing flour can be attributed to the plasticizing effect of the carbohydrates present in the product. The formulations with 2% and 4% carob flour may offer a good balance between processability and extensibility [42].
The beneficial effects of enrichment with different flours/powders after frozen storage conditions have been reported in the literature [43]. The physical characteristics of frozen dough and semi-baked frozen samples with the addition of commercial soluble fibers or whole oat flour were determined after baking and compared with the fresh samples. The results highlighted that in semi-baked frozen samples the crumb elasticity increased by 18% in comparison to the respective fresh ones. Additionally, samples containing whole oats presented an increased water adsorption capacity. Further studies are needed to assess the influence of carob powder on the quality of frozen dough.

3.2. Physical and Chemical Properties

Titratable acidity, protein content, moisture and TPC of obtained samples are reported in Table 3.
Samples assessed after 2 h containing different proportions of carob flour showed higher titratable acidity contents compared to the control sample. It can be observed that, between samples, the differences were notable, with the highest value being recorded for the sample without carob powder (PM-2.21%) and the lowest value being recorded for the pasta with the highest concentration of carob powder P6CP—1.21%. Samples P4CP and P2CP showed lower values of 1.42% and 1.80%. The protein content showed slight differences between samples with the addition of carob flour and the blank sample. The most relevant development was recorded for sample P6CP—14.45% protein content due to the amount of carob flour added. Gopalakrishnan et al. [44] reported that the addition of sweet potato and fish powder in pasta raised the protein content to 12.84%.
The highest moisture content was recorded in the case of the sample with the highest content of carob powder, P6CP, (35.87%) and the lowest moisture content was recorded in the case of pasta without carob powder, PM, with 30.23%. Biernacka et al. [27] have stated that the pasta enriched with carob flour in various increasing proportions (1% to 5%) showed a certain correlation between the total phenolic content and antioxidant activity in pasta samples. The antioxidant profile of carob flour added in pasta samples revealed that the greatest value of total polyphenol content was noted for the sample containing the highest proportion of carob flour—6%—a fact that supports the statement that the addition of carob flour improves the antioxidant profile of samples. Values were considerably superior compared to the control sample. Similar to the present study, research developed by Biernacka et al. [27], Boroski et al. [12] and Zhu et al. [45] showed that the addition of carob powder in pasta in various proportions showed positive correlations concerning the TPC value. Makris et al. [46] reported that carob powder contains a higher ratio of antioxidants than red wines and can be considered a valuable source for pharmaceutical products due to its polyphenolic content. Issaoui et al. [47] reported that carob flour showed lower moisture values (13.40%, 13.50% and 13.700%) for carob pulp powder, (14.0%, 14.20%) respectively, for carob seed powder that was reflected in the final product’s moisture content.
It was observed that the higher the concentration of carob is in a food product, the higher the phenolic concentration will be. For example, Aydin et al. [48] reported that the addition of 42% carob flour in spread samples was 615.28 mg GAE/100 g, considerably higher compared to the results obtained in the current study, in which the highest addition content was 6% of carob powder. Additionally, Sebecic et al. [49] mentioned that the total phenol content of biscuit samples obtained with the addition of 25% carob flour was 5.53 g/kg biscuit compared to the sample with wheat flour, with 1.10 g/kg biscuit, and 1.60 g/kg of wheat whole grain flour.
The present study reported a superior value of TPC for the sample containing carob flour in proportion of 6% (461.10 mg GAE/100 g) in contrast with the control sample, with 239.07 mg GAE/100 g. The increase in the total polyphenol content of the samples containing carob powder was closely related to the method for obtaining the carob powder, the amount of carob powder introduced into the products, the methodology used to obtain the products and the biochemical reactions developed in the product matrix [50,51,52].
The results shown in Table 4 show that fortifying pasta with carob increased the level of individual phenolic compounds.
All analyzed compounds are present in the P6CP sample, which contains the highest level of carob. Similar values were obtained when pasta was fortified with grape pomace [53]. The addition of 3–9% grape marc to the pasta recipe resulted in an increase of individual polyphenolic compounds depending on the percentage added. For example, Gaita et al. [29] reported the following values for individual polyphenols in pasta enriched with grape marc: gallic acid (27.95–88.22 µg/g), caffeic acid (0.66–58.11 µg/g), epicatechin (10.29–14.92 µg/g), coumaric acid (0. 32–0.85 µg/g), ferulic acid (6.33–15.75 µg/g), rutin (0.14–18.56 µg/g), rosmarinic acid (26.1–38.53 µg/g), resveratrol (31.15–34.38 µg/g), quercetin (2.89–7.3 µg/g), kaempferol (19.73–54.24 µg/g).
The addition of carob flour has been found to increase the content of polyphenols; however, the increase is not linear but exponential.
This has been determined for quercetin, for which detectable values are available for all compositions. The increase may depend on the degree of mixing of the carob flour with the semolina dough and the distribution of these compounds in the flour.
Our findings are consistent with those of other authors such as Gaita et al. [29], who have stated that the improvement with natural phenolics can be influenced by a lot of factors, among which includes binding with food matrix components. In addition, Gaita et al. [29] and Sęczyk et al. [28] specified that the content of bioactive compounds may be influenced by the combination of proteins and phenolics content, such as hydrophobic interactions and hydrogen and ionic bonding. Frühbauerova et al. [54] conducted a study on the bioaccessibility of phenolics from carob pod powder prepared by cryogenic and vibratory grinding, and they showed that, from the 13 compounds involved in the UHPLC analysis, three were phenolic acids (vanillic, ferulic and cinnamic), three flavons (luteolin, apigenin and chrysoeriol), naringenin (flavanone) and quercitrin (glycoside form of flavonoid quercetin). The highest amount of quercitrin (44.54–64.68 μg/g), cinnamic acid (27.48–31.40 μg/g) and chrysoeriol (8.60–9.82 μg/g) have been found. The amount of the rest of the phenolic constituents ranged from 1.88 to 10.14 μg/g [55,56,57].
In our study, the highest number of compounds is also found in quercitrin, in P6CP (243.66 μg/g). The results shown in Table 4 show that fortifying pasta with carob increased the level of phenolic compounds.

3.3. Compression Resistance

The textural characteristics of products are crucial for fulfilling the acceptance of the consumers. During mastication, the brain processes the food’s physical features and evaluates its texture. The sensation of food texture is important in influencing consumers’ liking and preference for a food product [58].
Analyzing the values from the chart in Figure 3, it can be observed that the evolution of the values required for the crushing force of carob pasta is similar.
The differences were observed for the maximum values of crushing force, with the highest value being recorded for the sample with the lowest amount of carob powder added—P2CP with 2% of carob powder. The lowest value of the crushing force was recorded for the sample containing 6% carob powder—P6CP—compared to the control sample, where the crushing force was lower.
Regarding the pasta with 6% added carob powder, the elastoplastic curve remains constant for a longer period of time and the deformation of the carob pasta reaches 2.12 mm. After exceeding the flow area, the distinctive curves develop a new ascending tendency, the gradient being approximately identical.
Some researchers [58] used seedless carob flour for obtaining pastry filling and observed that the major content of carob flour added to the samples’ composition resulted in an increase in consistency and firmness, a fact that can be compared to the results of the crushing test from the current study, where the greatest deformation of samples was observed for the highest addition of carob powder—2.12 mm for samples with 6% carob powder addition. Additionally, a linear decrease in pasta cutting force was observed as the proportion of carob fiber increased. The same findings regarding the decreasing of crushing resistance from 1315.32 N in control to 1084.53 N in P6CP were observed in our study and can be attributed to the increase in the fiber content in the sample by 6% carob. The fiber content increased from 2.00 to 2.12% (Table 3) with the addition of carob powder in the pasta manufacturing recipe.
Research conducted by Biernacka et al. [27] showed that the cutting force required for carob flour pasta decreased while the content of carob flour in samples increased. In line with the current research, it can be stated that the high fiber content contributes to a weaker structure of the products due to the addition of fiber in the starch structure.

3.4. Sensory Analysis

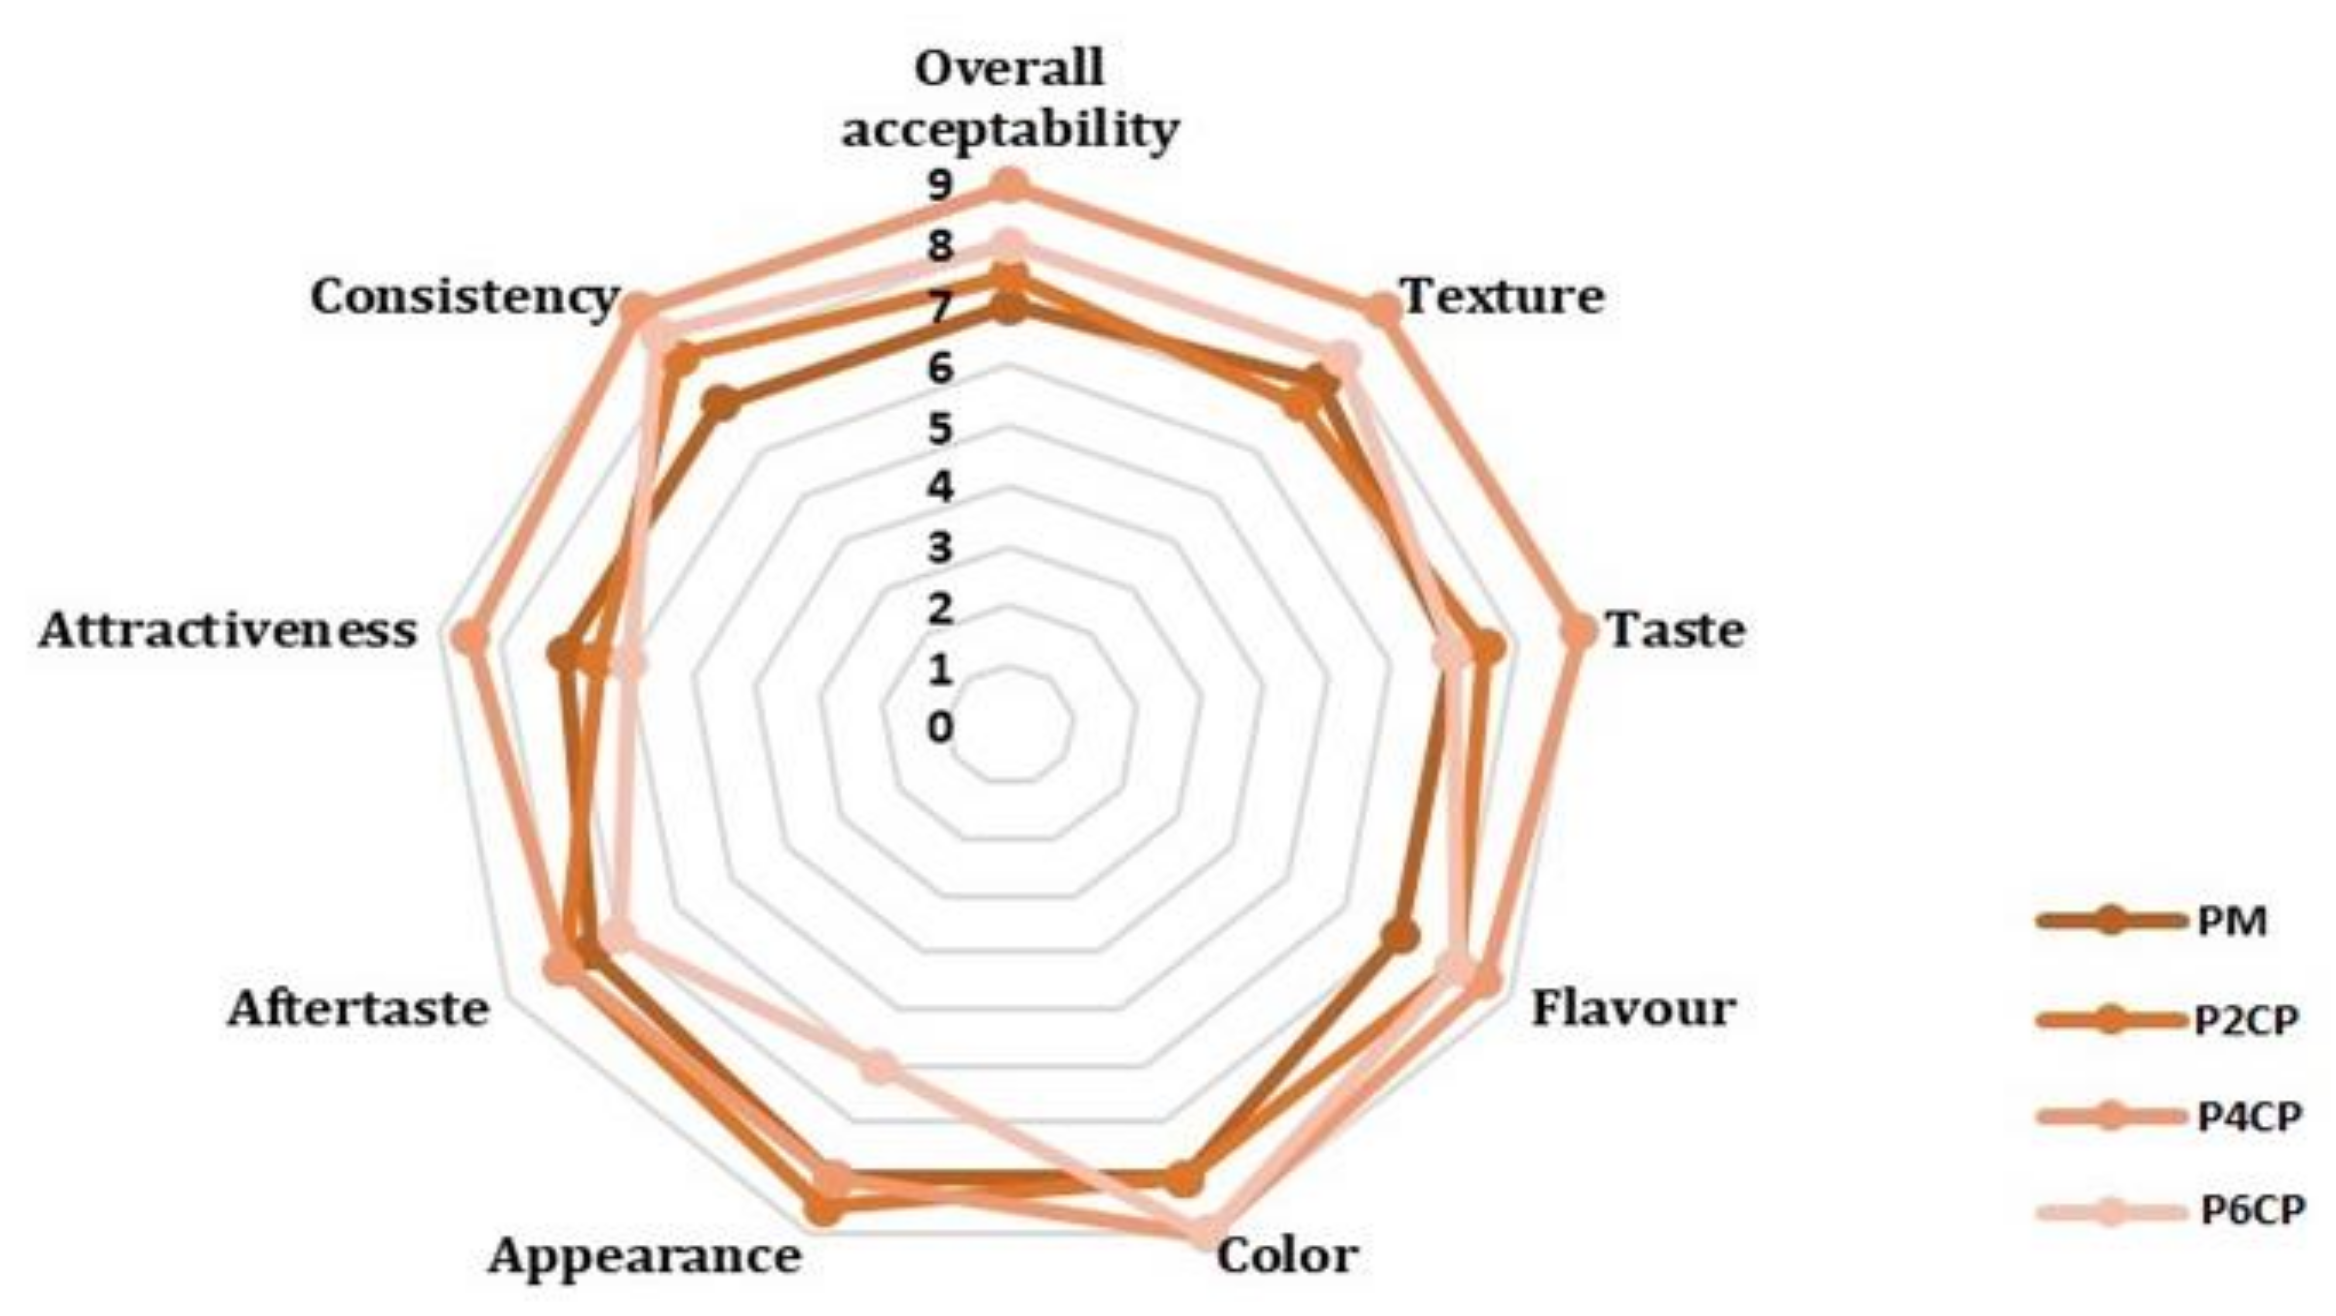
Figure 4 illustrates the sensory characteristics in terms of overall acceptability, consistency, attractiveness, aftertaste, appearance, color, flavor, taste and texture of pasta samples with different percentages of carob flour.
It can be observed that the pasta with a medium carob powder, P4CP, with the addition of 4% of carob powder was the most preferred due to its attributes, with a mean value of 8.62 ± 3.8 out of 9 points. This indicates that the consumer prefers a small amount of carob powder in pasta. The addition of a higher amount of carob powder was rejected; samples with 6% carob flour were undervalued by panelists. Based on texture, taste, color and consistency, sample P4CP was the most appreciated, being ranked with the highest value out of a possible 9 points. This was very close to sample P6CP, which had flavor, color and texture scoring 8 ± 7.3 points. Samples with 6% carob powder addition received the lowest scores due to the affected attractiveness and appearance. The sensory analysis is an important parameter to evaluate the adaptation of several pulses’ capacity in fresh pasta and if the addition of novel constituents in the structure of products influences the properties of final products and consumers’ perception.
It has been demonstrated that the addition of gluten-free flour to a pasta recipe alters the gluten network and reduces the overall structure of the pasta, resulting in a negative effect on sensory properties [53,55]. Furthermore, it may result in increased solid substance losses from pasta in cooking water. Darker color was observed when pasta was supplemented with 10% carob fruit which negatively influenced consumers’ perceptions [41]. Consumers rejected products with excessively high concentrations due to their dark color and bitter taste [58]. According to Dulger Altiner, D. and Hallac, S., 2020, the highest values in terms of sensory analysis were determined in the 20% carob flour addition to pasta [41].

4. Conclusions

The addition of 2%, 4% and 6% (w/w) carob flour to pasta recipes resulted in an increase in total polyphenol content. A more significant increase in the individual polyphenolic content is observed from the concentration of 4% carob flour. At a concentration of 2%, compared to the control sample, the increase was very small. It was also found that all the individual polyphenolic compounds analyzed are present in the P6CP sample, which contains the highest concentration of carob. Up to 6% carob flour in durum wheat flour strongly influenced the color of pasta. However, due to the difficulties that could arise during pasta processing, it is not recommended to use a concentration of carob flour greater than 6% in the pasta recipe because the consistency of the pasta dough will no longer be achieved based on the recipe used. In order to use a larger amount of carob flour, the basic recipe must be modified and more flour added, as the pasta dough becomes softer as the concentration of carob flour increases. Carob flour affects the kneading, modeling and drying processes due to a reduction in the elasticity of the dough caused by a reduction in the gluten content. The sample with a medium carob flour addition (4%) was the most appreciated for its properties, with an average score of 8.62 out of 9 points. At a lower concentration (2%), the color was much more intense compared to the sample without carob flour, but the taste was not very permeating. At a concentration of 6% carob flour, the color of the pasta was very intense and the taste was very carob. The results of the physico-chemical analyses carried out on all the pasta types were within the limits set by the standards.
Regarding the recommended amount of carob flour to be used in the pasta technological process, correlating the results of the physico-chemical properties, dough rheological properties, compression resistance and sensory analysis, a concentration of 4% is the most recommended. It can be concluded that carob flour has enhanced health-promoting properties and could be a useful additive for the production of pasta from common wheat.
In order to improve the functionality of carob pasta, future studies will be considered to supplement the fiber intake, but also to improve the sensory properties by adding natural aromatic compounds. The synergism created by the active principles of the ingredients will also be another direction for future research.

Author Contributions

Conceptualization, M.I.L. and C.M.C.; methodology, V.P.; software, C.B.; validation, E.A., M.-A.P. and M.I.L.; formal analysis, M.I.L.; investigation, C.P. and A.M.; resources, C.P.; data curation, A.M. and C.C.; writing—original draft preparation, M.I.L. and A.B.; writing—review and editing, M.I.L., E.A. and M.-A.P.; visualization, V.P.; supervision, M.I.L., E.A., M.-A.P., C.M.C. and V.P. All authors have read and agreed to the published version of the manuscript.

Funding

This research received no external funding.

Institutional Review Board Statement

Not applicable.

Informed Consent Statement

Not applicable.

Data Availability Statement

Not applicable.

Acknowledgments

The chemical research was performed in the Interdisciplinary Research Platform belonging to the University of Life Sciences “King Mihai I” from Timisoara, where the analyses were made.

Conflicts of Interest

The authors declare no conflict of interest.

References

  1. Kaur, G.; Sharma, S.; Nagi, H.P.S.; Ranote, P.S. Enrichment of pasta with different plant proteins. J. Food Sci. Technol. 2013, 50, 1000–1005. [Google Scholar] [CrossRef] [Green Version]
  2. Fuad, T.; Prabhasankar, P. Role of Ingredients in Pasta Product Quality: A Review on Recent Developments. Crit. Rev. Food Sci. Nutr. 2010, 50, 787–798. [Google Scholar] [CrossRef]
  3. IPO. 2019. Available online: https://internationalpasta.org/annual-report/ (accessed on 5 March 2023).
  4. Falciano, A.; Sorrentino, A.; Masi, P.; Di Pierro, P. Development of Functional Pizza Base Enriched with Jujube (Ziziphus jujuba) Powder. Foods 2022, 11, 1458. [Google Scholar] [CrossRef] [PubMed]
  5. Statista Global Consumer Survey. Available online: https://www.statista.com/chart/19776/gcs-pasta-consumption/ (accessed on 6 October 2020).
  6. Montalbano, A.; Tesoriere, L.; Diana, P.; Barraja, P.; Carbone, A.; Spano, V.; Parrino, B.; Attanzio, A.; Livrea, M.A.; Cascioferro, S.; et al. Quality characteristics and in vitro digestibility study of barley flour enriched ditalini pasta. LWT 2016, 72, 223–228. [Google Scholar] [CrossRef]
  7. Abdel-Aal, E.-S.M.; Young, J.C.; Rabalski, I. Anthocyanin Composition in Black, Blue, Pink, Purple, and Red Cereal Grains. J. Agric. Food Chem. 2006, 54, 4696–4704. [Google Scholar] [CrossRef]
  8. Spinelli, S.; Padalino, L.; Costa, C.; Del Nobile, M.A.; Conte, A. Food by-products to fortified pasta: A new approach for optimization. J. Clean. Prod. 2019, 215, 985–991. [Google Scholar] [CrossRef]
  9. Fares, C.; Menga, V. Effects of toasting on the carbohydrate profile and antioxidant properties of chickpea (Cicer arietinum L.) flour added to durum wheat pasta. Food Chem. 2012, 131, 1140–1148. [Google Scholar] [CrossRef]
  10. Lorusso, A.; Verni, M.; Montemurro, M.; Coda, R.; Gobbetti, M.; Rizzello, C.G. Use of fermented quinoa flour for pasta making and evaluation of the technological and nutritional features. LWT 2017, 78, 215–221. [Google Scholar] [CrossRef] [Green Version]
  11. Rizzello, C.G.; Verni, M.; Koivula, H.; Montemurro, M.; Seppa, L.; Kemell, M.; Katina, K.; Coda, R.; Gobbetti, M. Influence of fermented faba bean flour on the nutritional, technological and sensory quality of fortified pasta. Food Funct. 2017, 8, 860–871. [Google Scholar] [CrossRef]
  12. Boroski, M.; de Aguiar, A.C.; Boeing, J.S.; Rotta, E.M.; Wibby, C.L.; Bonafé, E.G.; de Souza, N.E.; Visentainer, J.V. Enhancement of pasta antioxidant activity with oregano and carrot leaf. Food Chem. 2011, 125, 696–700. [Google Scholar] [CrossRef]
  13. Teterycz, D.; Sobota, A.; Zarzycki, P.; Latoch, A. Legume flour as a natural colouring component in pasta production. J. Food Sci. Technol. 2020, 57, 301–309. [Google Scholar] [CrossRef] [PubMed] [Green Version]
  14. Testa, M.; Malandrino, O.; Santini, C.; Supino, S. Chapter 6—Nutraceutical and functional value of carob-based products The LBG Sicilia Srl Case Study. In Case Studies on the Business of Nutraceuticals, Functional and Super Foods; Woodhead Publishing Series in Consumer Science & Strategy Market; Woodhead Publishing: Sawston, UK, 2023; pp. 107–120. ISBN 9780128214084. [Google Scholar]
  15. Ortega, N.R.; Marcia, A.; Romero, M.; Reguant, J.; Motilva, M.J. Matrix composition effect on the digestibility of carob flour phenols by an in-vitro digestion model. Food Chem. 2011, 124, 65–71. [Google Scholar] [CrossRef]
  16. Azab, A. Carob (Ceratonia siliqua): Health, medicine and chemistry. Eur. Chem. Bull. 2017, 610, 456–469. [Google Scholar] [CrossRef] [Green Version]
  17. Boublenza, I.; Lazouni, H.A.; Ghaffari, L.; Ruiz, K.; Fabiano-Tixier, A.S.; Chemat, F. Influence of Roasting on Sensory, Antioxidant, Aromas, and Physicochemical Properties of Carob Pod Powder (Ceratonia siliqua L.). J. Food Qual. 2017, 2017, 1–10. [Google Scholar] [CrossRef] [Green Version]
  18. Papaefstathiou, E.; Agapiou, A.; Giannopoulos, S.; Kokkinofta, R. Nutritional characterization of carobs and traditional carob products. Food Sci. Nutr. 2018, 6, 2151–2161. [Google Scholar] [CrossRef]
  19. Tsatsaragkou, K.; Yiannopoulos, S.; Kontogiorgi, A.; Poulli, E.; Krokida, M.; Mandala, L. Effect of Carob Flour Addition on the Rheological Properties of Gluten-Free Breads. Food Bioproc. Tech. 2014, 7, 868–876. [Google Scholar] [CrossRef]
  20. Ayaz, F.A.; Torun, H.; Glew, R.H.; Bak, Z.D.; Chuang, L.T.; Presley, J.M.; Andrews, R. Nutrient content of carob pod (Ceratonia siliqua L.) flour prepared commercially and domestically. Plant Foods Hum. Nutr. 2009, 64, 286–292. [Google Scholar] [CrossRef]
  21. Bengoechea, C.; Romero, A.; Villanueva, A.; Moreno, G.; Alaiz, M.; Millán, F.; Puppo, M.C. Composition and structure of carob (Ceratonia siliqua L.) germ proteins. Food Chem. 2008, 107, 675–683. [Google Scholar] [CrossRef]
  22. Biner, B.; Gubbuk, H.; Karhan, M.; Aksu, M.; Pekmezci, M. Sugar profiles of the pods of cultivated and wild types of carob bean (Ceratonia siliqua L.) in Turkey. Food Chem. 2007, 100, 1453–1455. [Google Scholar] [CrossRef]
  23. Durazzo, A.; Turfani, V.; Narducci, V.; Azzini, E.; Maiani, G.; Carcea, M. Nutritional characterisation and bioactive components of commercial carobs flours. Food Chem. 2014, 153, 109–113. [Google Scholar] [CrossRef]
  24. Kumazawa, S.H.K.; Taniguchi, M.A.S.A.T.; Suzuki, Y.A.S.; Shimura, M.A.S.; Kwon, M.I.U.N.K.; Nakayama, T.S.N. Antioxidant activity of polyphenols in carob pods. J. Agricult. Food Chem. 2002, 50, 373–377. [Google Scholar] [CrossRef] [PubMed]
  25. Germec, M.; Turhan, I.; Karhan, M.; Demirci, A. Ethanol production via repeated-batch fermentation from carob pod extract by using Saccharomyces cevisiae in biofilm reactor. Fuel 2015, 161, 304–311. [Google Scholar] [CrossRef]
  26. Haddarah, A.; Ismail, A.; Bassal, A.; Hamieh, T.; Ioannou, I.; Ghoul, M. Morphological and chemical variability of Lebanese carob varieties. Eur. Sci. J. 2013, 9, 353–369. [Google Scholar]
  27. Biernacka, B.; Dziki, D.; Gawlik-Dziki, U.; Roozy, R.; Siastala, M. Physical, sensorial, and antioxidant properties of common wheat pasta enriched with carob fiber. LWT 2017, 77, 186–192. [Google Scholar] [CrossRef]
  28. Seczyk, L.; Swieca, M.; Gawlik-Dziki, U. Effect of carob (Ceratonia siliqua L.) flour on the antioxidant potential, nutritional quality, and sensory characteristics of fortified durum wheat pasta. Food Chem. 2016, 194, 637–642. [Google Scholar] [CrossRef] [PubMed]
  29. Gaita, C.; Alexa, E.; Moigradean, D.; Conforti, F.; Poiana, M.A. Designing of high value-added pasta formulas by incorporation of grape pomace skins. Rom. Biotechnol. Lett. 2020, 25, 1607–1614. [Google Scholar] [CrossRef]
  30. Gruber, W.; Sarkar, A. Chapter 8—Durum Wheat Milling. In American Associate of Cereal Chemists International, Durum Wheat, 2nd ed.; Sissons, M., Abecassis, J., Marchylo, B., Carcea, M., Eds.; AACC International Press: Washington, DC, USA, 2012; pp. 139–159. [Google Scholar]
  31. Hellin, P.; Escarnot, E.; Mingeot, D.; Gofflot, S.; Sinnaeve, G.; Lateur, M.; Godin, B. Multiyear evaluation of the agronomical and technological properties of a panel of spelt varieties under different cropping environments. J. Cereal Sci. 2023, 109, 103615. [Google Scholar] [CrossRef]
  32. Singleton, V.L.; Orthofer, R.; Lamuela-Raventos, R.M. Analysis of total phenols and other oxidation substrates and antioxidants by means of Folin-Ciocalteu reagent. Meth. Enzymol. 1999, 299, 152–178. [Google Scholar]
  33. Abdel-Hameed, E.S.; Bazaid, S.A.; Salman, M.S. Characterization of the phytochemical constituents of Taif rose and its antioxidant and anticancer activities. Biomed Res. Int. 2013, 2013, 1–13. [Google Scholar] [CrossRef] [Green Version]
  34. Rios, M.B.; Iriondo-DeHond, A.; Iriondo-DeHond, M.; Herrera, T.; Velasco, D.; Gomez-Alonso, S.; Callejo, M.J.; Dolores del Castillo, M. Effect of Coffee Cascara Dietary Fiber on the Physicochemical, Nutritional and Sensory Properties of a Gluten-Free Bread Formulation. Molecules 2020, 25, 1358. [Google Scholar] [CrossRef] [Green Version]
  35. ISO 712:2009 Cereals and Cereal Products–Determination of Moisture Content–Reference Method. Available online: https://www.sis.se/api/document/preview/911751/ (accessed on 15 December 2021).
  36. Heeger, A.; Kosinska-Cagnazzo, A.; Cantergiani, E.; Andlauer, W. Bioactives of coffee cherry pulp and its utilisation for production of Cascara beverage. Food Chem. 2017, 221, 969–975. [Google Scholar] [CrossRef] [PubMed]
  37. Calculator de Calorii—Numararea Caloriilor—Klorii. Available online: https://klorii.ro/ (accessed on 8 March 2023).
  38. Yazar, G.; Duvarci, O.; Tavman, S.; Kokini, J.L. Non-linear rheological behavior of gluten-free flour doughs and correlations of LAOS parameters with gluten-free bread properties. J. Cereal Sci. 2017, 74, 28–36. [Google Scholar] [CrossRef]
  39. Dube, N.M.; Xu, F.; Zhao, R. The efficacy of sorghum flour addition on dough rheological properties and bread quality: A short review. Grain Oil Sci. Technol. 2022, 4, 164–171. [Google Scholar]
  40. Sibanda, T.; Ncube, T.; Ngoromani, N. Rheological properties and bread making quality of white grain sorghum-wheat flour composites. Int. Food Sci. Nutr. Eng. 2015, 5, 176–182. [Google Scholar]
  41. Arribas, C.; Cabellos, B.; Cuadrado, C.; Guillamón, E.; Pedrosa, M.M. Cooking Effect on the Bioactive Compounds, Texture, and Color Properties of Cold-Extruded Rice/Bean-Based Pasta Supplemented with Whole Carob Fruit. Foods 2020, 9, 415. [Google Scholar] [CrossRef] [Green Version]
  42. Bchir, B.; Karoui, R.; Danthine, S.; Blecker, C.; Besbes, S.; Attia, H. Date, Apple, and Pear By-Products as Functional Ingredients in Pasta: Cooking Quality Attributes and Physicochemical, Rheological, and Sensorial Properties. Foods 2022, 11, 1393. [Google Scholar] [CrossRef] [PubMed]
  43. Mandala, I.; Polaki, A.; Yanniotis, S. Influence of frozen storage on bread enriched with different ingredients. J. Food Eng. 2009, 92, 137–145. [Google Scholar] [CrossRef]
  44. Gopalakrishnan, J.; Menon, R.; Padmaja, G.; Sajeev, M.S.; Moorthy, S.N. Nutritional and Functional Characteristics of Protein-Fortified Pasta from Sweet Potato. Food Sci. Nutr. 2011, 2, 944–955. [Google Scholar] [CrossRef] [Green Version]
  45. Zhu, F.; Li, J. Physicochemical and sensory properties of fresh noodles fortified with ground linseed (Linum usitassimum). LWT 2019, 101, 847–853. [Google Scholar] [CrossRef]
  46. Makris, D.P.; Kefalas, P. Carob pods (Ceratonia siliqua L.) As a source of polyphenolic antioxidants. Food Technol. Biotechnol. 2004, 42, 105–108. [Google Scholar]
  47. Issaoui, M.; Flamini, G.; Delgado, A. Sustainability Opportunities for Mediterranean Food Products through New Formulations Based on Carob Flour (Ceratonia siliqua L.). Sustainability 2021, 13, 8026. [Google Scholar] [CrossRef]
  48. Aydin, S.; Ozdemir, Y. Development and Characterization of Carob Flour Based Functional Spread for Increasing Use as Nutritious Snack for Children. J. Food Qual. 2017, 2017, 1–7. [Google Scholar] [CrossRef] [Green Version]
  49. Sebecic, B.; Vedrina-Dragojevic, I.; Vitali, D.; Hecimovic, M.; Dragicevic, I. Raw Materials in Fibre Enriched Biscuits Production as Source of Total Phenols. Agric. Conspec. Sci. 2007, 72, 265–270. [Google Scholar]
  50. Bastida, S.; Sánchez-Muniz, F.J.; Olivero, R.; Pérez-Olleros, L.; Ruiz-Roso, B.; Jiménez-Colmenero, F. Antioxidant activity of Carob fruit extracts in cooked pork meat systems during chilled and frozen storage. Food Chem. 2009, 116, 748–754. [Google Scholar] [CrossRef]
  51. Bissar, S.; Ozcan, M.M. Determination of quality parameters and gluten free macaron production from carob fruit and sorghum. Int. J. Gastron. Food Sci. 2022, 27, 100460. [Google Scholar] [CrossRef]
  52. Brassesco, M.E.; Brandao, T.R.S.; Silva, C.L.M.; Pintado, M. Carob bean (Ceratonia siliqua L.): A new perspective for functional food. Trends Food Sci. Technol. 2021, 114, 310–322. [Google Scholar] [CrossRef]
  53. Tolve, R.; Pasini, G.; Vignale, F.; Favati, F.; Simonato, B. Effect of Grape Pomace Addition on the Technological, Sensory, and Nutritional Properties of Durum Wheat Pasta. Foods 2020, 9, 354. [Google Scholar] [CrossRef] [Green Version]
  54. Frühbauerova, M.; Cervenka, L.; Hajek, T.; Pouzar, M.; Palarcík, J. Bioaccessibility of phenolics from carob (Ceratonia siliqua L.) pod powder prepared by cryogenic and vibratory grinding. Food Chemistry 2022, 377, 131968. [Google Scholar] [CrossRef]
  55. Benković, M.; Bosiljkov, T.; Semić, A.; Ježek, D.; Srečec, S. Influence of Carob Flour and Carob Bean Gum on Rheological Properties of Cocoa and Carob Pastry Fillings. Foods 2019, 8, 66. [Google Scholar] [CrossRef] [Green Version]
  56. Rayas-Duarte, P.; Mock, C.M.; Satterlee, L.D. Quality of spaghetti containing buckwheat, amaranth, and lupin flours. Cereal Chem. 1996, 73, 381–387. [Google Scholar]
  57. Marinelli, V.; Padalino, L.; Nardiello, D.; Del Nobile, M.A.; Conte, A. New approach to enrich pasta with polyphenols from grape marc. J. Chem. 2015, 2015, 1–8. [Google Scholar] [CrossRef] [Green Version]
  58. Chen, J.; Rosenthal, A. Modifying food texture. In Volume 1: Novel Ingredients and Processing Techniques; Woodhead Publishing: Cambridge, UK, 2015; pp. 3–22. [Google Scholar]
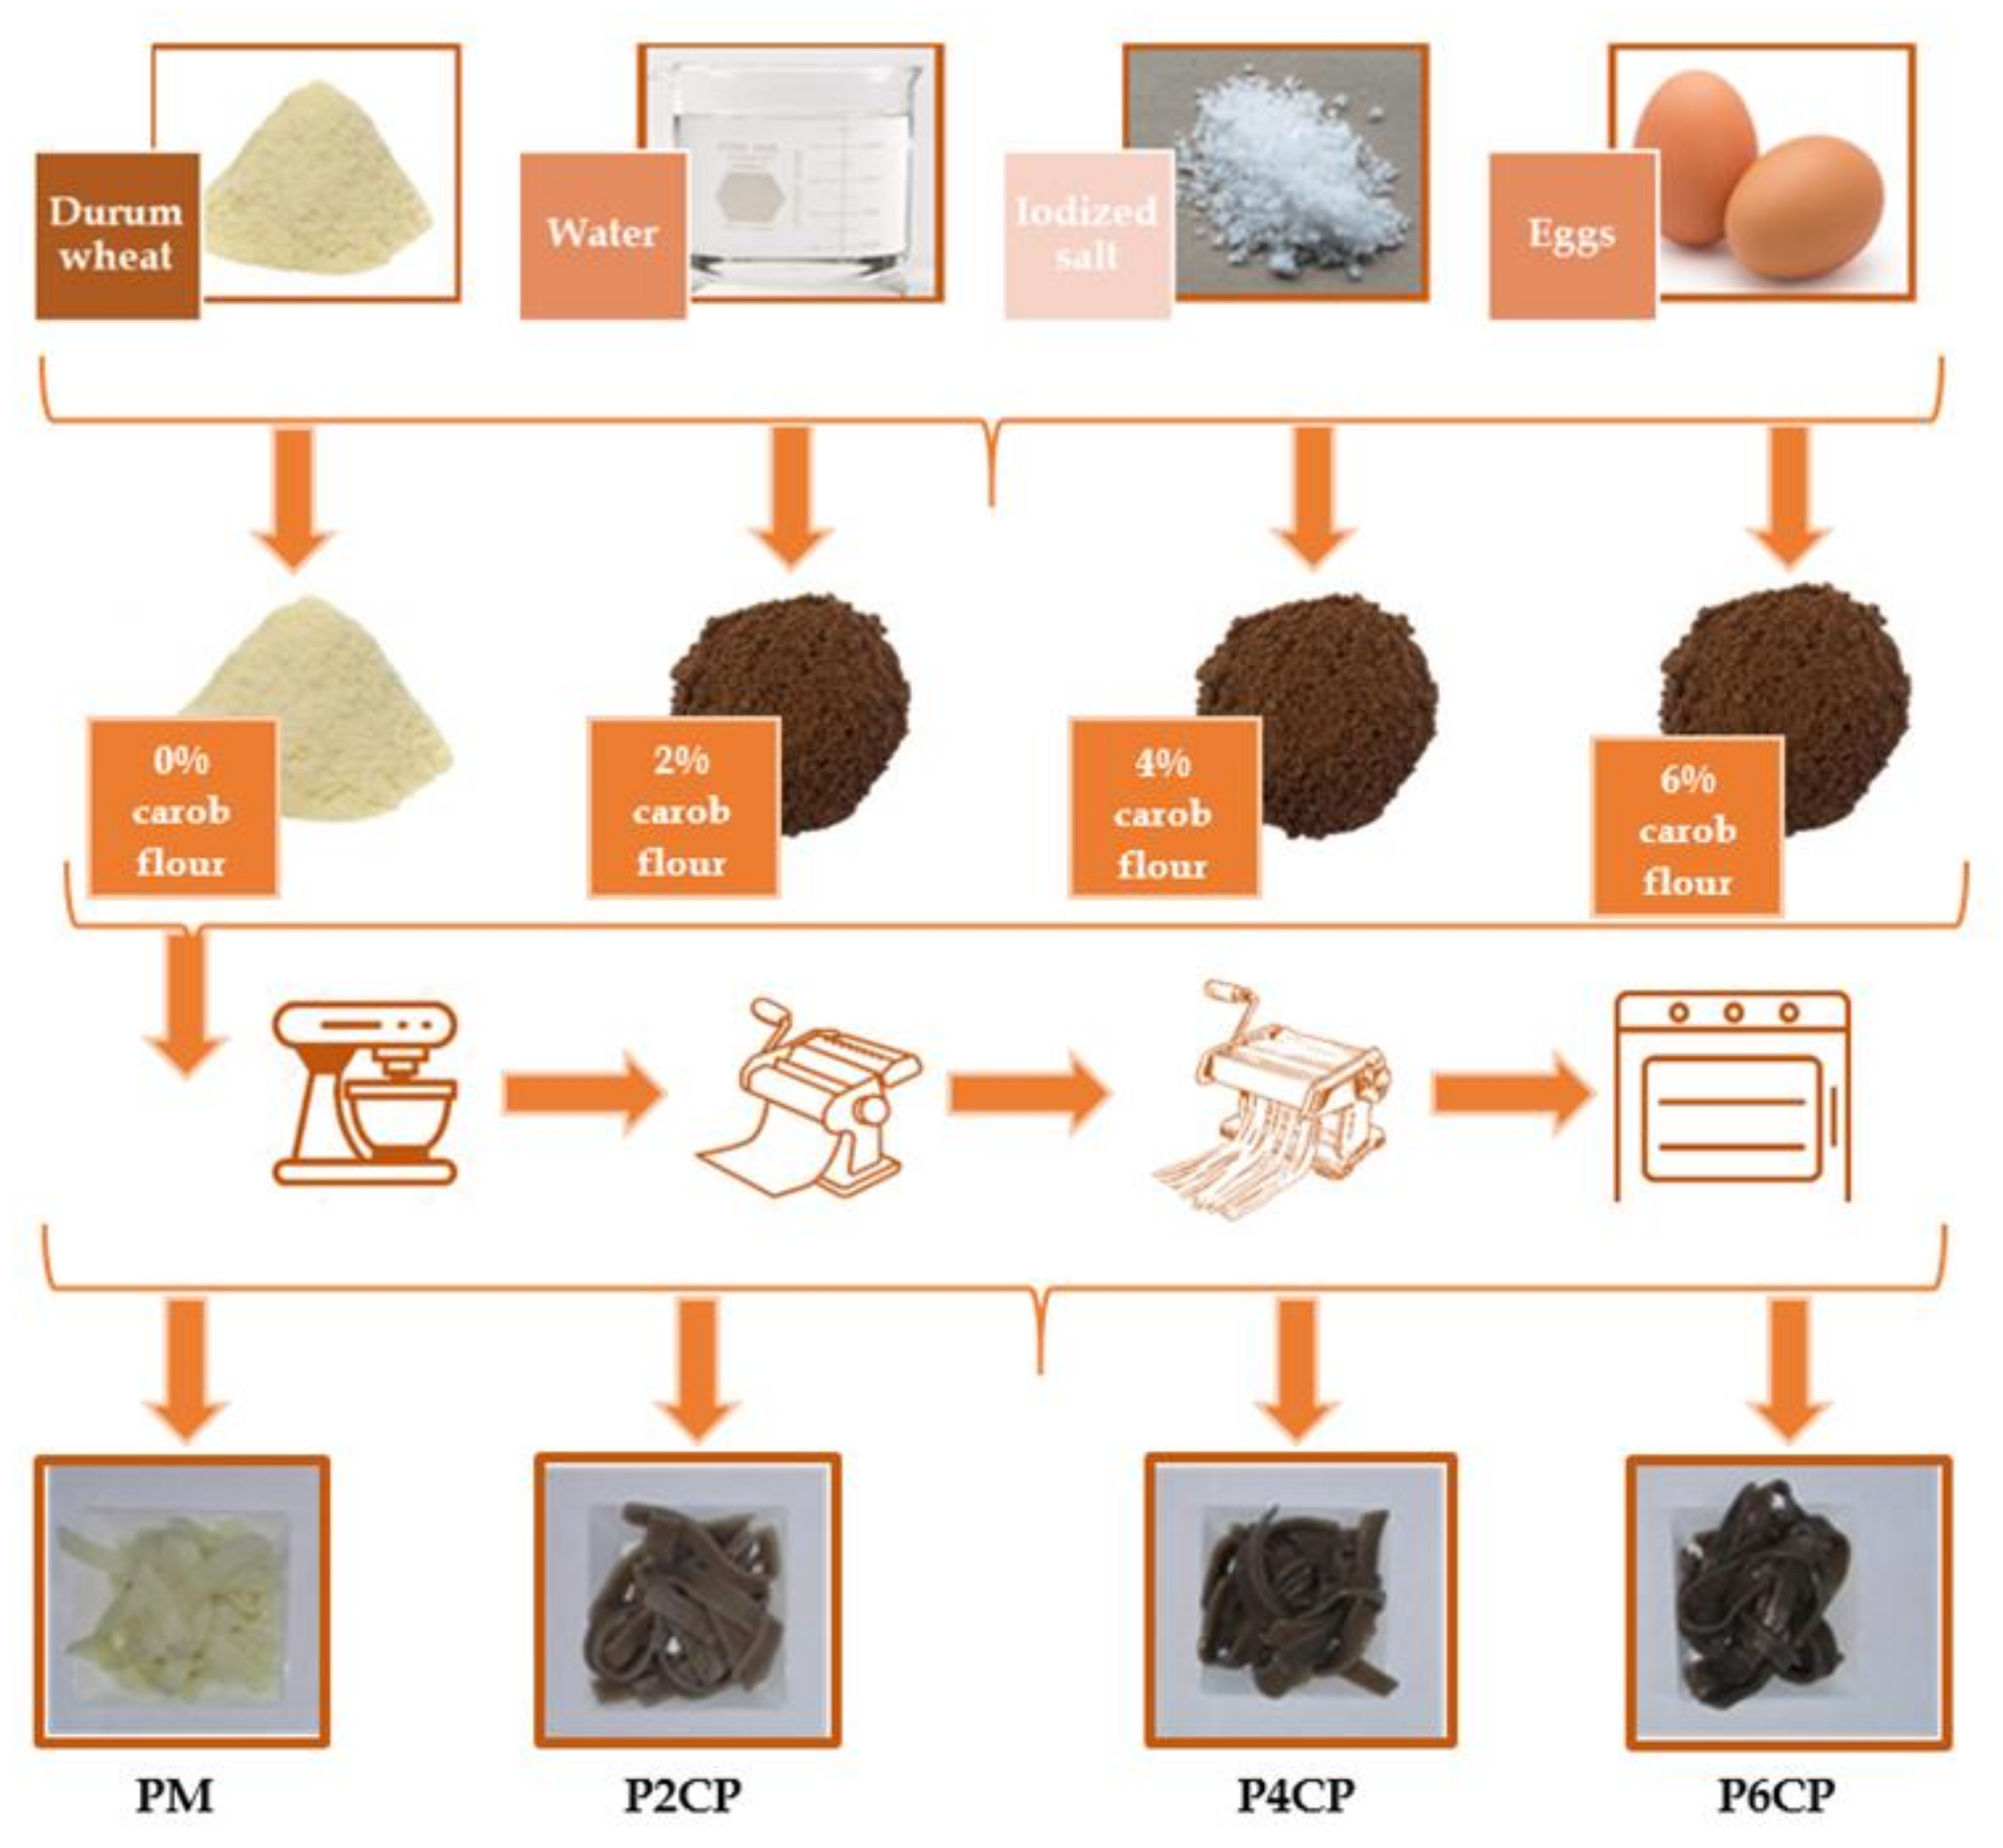
Figure 1. Pasta production method. PM: control sample; P2CP: sample with 2% (w/w) carob powder; P4CP: sample with 4% (w/w) carob powder; P6CP: sample with 6% (w/w) carob powder.
Applsci 13 03788 g001
Figure 2. Variation of rheological parameters P and W with the amount of carob.
Applsci 13 03788 g002
Figure 3. Crushing resistance of pasta samples with the addition of carob powder. PM: control sample; P2CP: sample with 2% (w/w) carob powder; P4CP: sample with 4% (w/w) carob powder; P6CP: sample with 6% (w/w) carob powder.
Applsci 13 03788 g003
Figure 4. Sensory analysis score of pasta samples with the addition of carob powder. PM: control sample; P2CP: sample with 2% (w/w) carob powder; P4CP: sample with 4% (w/w) carob powder; P6CP: sample with 6% (w/w) carob powder.
Applsci 13 03788 g004
Table 1. Sample coding.
TypeCodingPercentage (%) of Carob Flour Used in the Pasta Formulations
Control samplePM0
Sample with 2% carob flourP2CP2
Sample with 4% carob flourP4CP4
Sample with 6% carob flourP6CP6
Table 2. Rheological data for the pasta dough formulations.
ParameterPMP2CPP4CPP6CP
P (mmH2O)170 ± 0.15 a103 ± 0.09 b101 ± 0.03 b93 ± 0.01 c
L (mm)22 ± 0.05 a33 ± 0.12 b33 ± 0.09 b27 ± 0.06 c
G (mm)10.4 ± 0.11 a12.8 ± 0.13 b12.8 ± 0.07 b11.6 ± 0.05 c
W (10–4 J)169 ± 0.25 a130 ± 0.28 b125 ± 0.21 c100 ± 0.14 d
P/L7.73 ± 0.13 a3.12 ± 0.09 b3.06 ± 0.18 b3.44 ± 0.05 b
PM: control sample; P2CP: sample with 2% (w/w) carob powder; P4CP: sample with 4% (w/w) carob powder; P6CP: sample with 6% (w/w) carob powder. P: the maximum overpressure; L: extensibility; G: swelling index; W: strain energy; P/L: indicates the ratio between the tenacity of the dough and its extensibility. Values followed by different letters differ significantly by ANOVA test (p < 0.05).
Table 3. Samples assessment after 2 h from the pasta production process (dry pasta).
Parameter2 Hours
PMP2CPP4CPP6CP
Titratable acidity (%)2.21 ± 0.015 a1.80 ± 0.010 b1.42 ± 0.015 c1.21 ± 0.015 d
Protein content (%)14.03 ± 0.058 c14.17 ± 0.153 bc14.30 ± 0.100 ab14.45 ± 0.050 a
Moisture (%)30.23 ± 0.257 c32.03 ± 0.057 b33.07 ± 0.057 b35.87 ± 0.152 a
TPC (µg GAE/g)239.07 ± 0.010 d311.53 ± 0.025 c406.80 ± 0.100 b461.10 ± 0.100 a
Fiber (%) *2.002.042.082.12
PM: control sample; P2CP: sample with 2% (w/w) carob powder; P4CP: sample with 4% (w/w) carob powder; P6CP: sample with 6% (w/w) carob powder. Values followed by different letters differ significantly by ANOVA test (p < 0.05), * the fiber content was calculated according to the fiber content of raw materials and the recipe of pasta fabrication.
Table 4. Polyphenolic compounds identified in the dry pasta samples.
CompoundIon ModePolyphenolic Compounds (µg/g d.s.)
PMP2CPP4CPP6CP
Gallic acid169 ndnd 6.97 ± 0.07 a31.44 ± 0.18 b
Protocatechuic acid153ndnd19.93 ± 0.16 a51.14 ± 0.08 b
Caffeic acid179ndnd0.86 ± 0.05 a8.56 ± 0.11 b
Epicatechin289ndnd17.15 ± 0.13 a24.31 ± 0.17 b
p-Coumaric acid163ndnd0.30 ± 0.03 a0.30 ± 0.09 a
Ferulic acid193ndndnd0.23 ± 0.13 a
Rutin609ndnd 1.07 ± 0.06 a1.41 ± 0.16 b
Rosmarinic acid359ndndnd224.24 ± 0.32 a
Resveratrol227ndndnd0.85 ± 0.07 a
Quercetin301nd0.54 ± 0.02 a11.49 ± 0.11 b243.66 ± 0.25 c
Kaempferol285ndnd63.76 ± 0.17 a231.51 ± 0.32 b
nd—not detected; PM: control sample; P2CP: sample with 2% (w/w) carob powder; P4CP: sample with 4% (w/w) carob powder; P6CP: sample with 6% (w/w) carob powder. Values followed by different letters differ significantly by ANOVA test (p < 0.05).
Disclaimer/Publisher’s Note: The statements, opinions and data contained in all publications are solely those of the individual author(s) and contributor(s) and not of MDPI and/or the editor(s). MDPI and/or the editor(s) disclaim responsibility for any injury to people or property resulting from any ideas, methods, instructions or products referred to in the content.