Featured Application
HUD (head-up display) is of great significance to the development of automobile intelligent cockpits. The interface design of HUD has an impact on the cognitive load and situation awareness of drivers. Therefore, it is necessary to optimize and evaluate the interface design.
Abstract
Background: The interface design of in-vehicle head-up display (HUD) is an enlarging research area with interface usability as its core; usability reflects all perspectives of human—machine interaction and thus the evaluation and optimization of usability have multiple objectives. The evaluation and optimization of interface quality involved in usability are subjective and subconscious. Nevertheless, very little attention has been paid to these issues in optimizing usability across multiple objectives. Methods: In this paper, a hybrid scheme evaluation and optimization method based on entropy weight and VIKOR is proposed. First, according to the content of PSSUQ (Post Study System Usability Question), we have established a new usability evaluation system based on the characteristics of HUD. The entropy weight method was used to reduce the subjective factors of the decision-makers and to achieve the objective weight of each indicator. The VIKOR method was used for obtaining the order of alternate schemes and then the optimal interface design scheme was selected. Results: A case study was carried out to illustrate the applicability of the developed model in the usability evaluation of the HUD interface design. The results showed that scheme 1 was the optimized scheme, with minimal value of Si (0.141), Ri (0.119) and Qi (0.000) among the three schemes. When other decision-making methods were applied, the results showed that the optimized scheme was scheme 1, respectively, which verified the feasibility of the proposed method. The entropy—VIKOR model can be used to evaluate and optimize the HUD interface design effectively, which may serve as a reference for designers to achieve insights during the design process and scheme decision-making.
1. Introduction
With the growth and development of intelligent transportation, a great deal of in-vehicle information systems (IVIS), such as cellphones, instant messaging system and head-up displays (HUD), are constantly being added to cars and IVIS have developed from the display of early basic driving-related information to multidimensional interaction systems [1,2]. Panoramic screens are an important symbol of automotive digitization [3]. In particular, the major way to receive information is vision, accounting for 80 percent of all sensory channels [4,5]. Therefore, the visual interface design has great significance for driving safety and enhancing usability of human—machine interface (HMI).
There are many researches on the HUD interface evaluation problems, which can be divided into two kinds. One is to focus on the improvement the usability of the in-terface through the elements design of the interface; The other is to consider globally the level of usability of the interface and synthesize the research to aid deci-sion-making at the design stage. A simulation driving experiment on elder drivers was performed by Alexandra [6] to evaluate in-vehicle HMI usability and put forward a design strategy to promote HMI usability and user acceptance. Su [7] summarized the current research status of automated vehicle HMIs, and constructed an overall frame for usability of in-vehicle HMIs. Park [8] proposed several useful design principles for improving usability by analyzing the HUD interface through different methods. Li [9] tested the effect of three types of HUDs on skilled and novice drivers and evaluated their driving performance. On this basis, he presented a design optimization strategy for the HUD interface. Research from summative perspectives mainly concentrates on mobile applications, webpage interface or product design, while research on the in-vehicle HMI design is relatively few. The usability of in-vehicle HMIs varies significantly from that of mobile apps design or webpage design. Hence, our purpose is to explore the evaluation and optimization method for in-vehicle HUD design from the view of summary research.
As a part of numerical analysis, multi-criteria decision-making (MCDM) methods are used to handle complex evaluation and optimization problems using analytical methods [10]. All aspects of the existing MCDM problem are studied numerically, using theoretical development and a comprehension of numerical methods [11,12]. Xu [13] proposed an evaluation method that combines AHP and fuzzy comprehensive evaluation and applied it to the decision-making process for RV design schemes. The višekriterijumsko kompromisno rangiranje (VIKOR) method was used by Simab et al. [14] to select the best condition in a pumped hydro-thermal scheduling problem. Anna [15] applied the VIKOR method to calculate the parameters of the process based on entropy. Tiwari et al. [16] used soft set and entropy weight theory to obtain design specifications and customer needs qualitatively and then applied entropy weight methods to determine the best solution. Sarina et al. [17] proposed a complex product scheme joint variable weight VIKOR group decision-making method to achieve a balanced evaluation process between product scheme performance indicators and cost indicators with uncertainty in the weight of evaluation indicators.
Most of the current design scheme evaluation and optimization methods are qualitative, and the reviewers from different area of expertise hold various under-standing for evaluation criteria, which may contribute subjective bias in the results of design schemes evaluation [18]. In contrast, the VIKOR method, serving as a multi-attribute decision making method based on ideal point, has significant advantages in obtaining the necessity between ideal scheme and statistical analysis [19], which has a wide application in solving multi-criteria decision-making problems. Currently, there are few studies on the evaluation and optimization of HUD interface design by integrating entropy weight and VIKOR.
This paper first proposes an evaluation and optimization model of the HUD interface design, applying an entropy weight-based VIKOR method. To begin with, the entropy weight method was applied to decrease the subjective factors influence of decision-makers entrusted to the weight, and the objective weight of each indicator was obtained. Then, the VIKOR method was applied to attain the order the candidates with the best interface design scheme then being optimized. Three interface design schemes were taken as an example for case study and methods verification.
2. Theory Background
2.1. Entropy Weight
Entropy is a special measure of information and is mainly used to depict the degrees of fuzziness and intuitionism for a given information set [20]. It was first proposed in 1947 [21] and was further developed in 1982. The entropy weight method is based on the difference in data, and the weight of each indicator is obtained using the entropy calculation formula, which is widely used in various fields [22]. While subjective methods (e.g., Delphi and AHP) are used to determine the subjective weighting of criteria, objective methods like entropy weighting are used to remove artificial instabilities and produce more realistic results [23]. The entropy weight method can reflect the utility value of sample information entropy values without introducing subjective assumptions, producing an indicator weight that is more objective [24]. Subjective weights could be obtained directly from the decision makers’ opinions like many other MCDM processes [25]. When the method is applied, firstly, experts are invited to score the actual situation of the project and the initial matrix is obtained, then the initial matrix is normalized, the entropy value of each indicator is solved and the weight of each indicator is calculated.
2.2. VIKOR Method
Like the other MCDM problems, there are numerous influential factors in the product design process. TOPSIS and VIKOR are two typical multi-criteria compromise methods [26]. Among them, the VIKOR method can maximize group utility and its compromise solution can be accepted by decision-makers. VIKOR is a multi-attribute optimization decision-making method put forward by Opricovic in 1998 [27,28,29]. It introduces the multicriteria ranking indicator based on the specific measure of “proximity” to the “ideal” solution [30]. It is a compromise solution for optimizing multi-attribute decision-making, and it is also a decision-making method based on the ideal point method [31]. In the process of ranking, the VIKOR method ranks the advantages and disadvantages of the schemes to be evaluated by comparing the group utility value, regret value and comprehensive utility value and the optimal scheme obtained by this method is closest to the ideal scheme.
VIKOR is an operative tool in MCDM, especially in a situation where the decision-makers are not able or unsure how to express their preference at the beginning of system design [32]; however, it has great defects when used independently and it can solve different problems in combination with other methods. In this paper, the entropy weight method and VIKOR method are combined and the objective weight of each indicator is achieved using the entropy weight method. By applying the VIKOR method, the best order of alternative schemes that maximize group benefits and minimize individual regrets are obtained and the best product design scheme is obtained.
3. Proposed Methodology
With the entropy weight system, the subjective factors of decision-makers in weighting are excluded and the objective weights of each indicator are obtained. By using the VIKOR method, the best order of compromised candidate schemes to maximize group benefits and minimize individual regrets is obtained and the best product design scheme is obtained. The evaluation and optimization process of the design scheme based on the entropy weight and VIKOR method is shown in Figure 1.
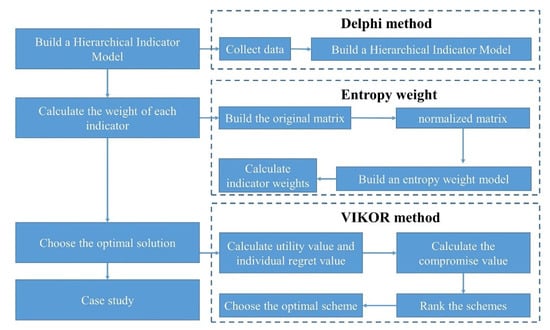
Figure 1.
Design scheme evaluation and optimization process based on entropy weight and VIKOR method.
3.1. Establishment of Evaluation Indicator Model
The optimization and evaluation of the interface design scheme is a complex, multi-indicator decision-making problem and the selection of the evaluation indicators has the characteristics of integrity and non-overlap. Interface design is an integrated system design, including function, layout and human factors as well as aesthetic aspects [33,34]. Taking the design of the in-vehicle HUD interface as an example, field research, online questionnaire surveys and user interviews are conducted to explore the factors affecting the design points of HUD interface [35,36]. In-vehicle HUD should first meet the basic functional requirements of information display and navigation and then increase the auxiliary functions of non-driving related tasks (NDRT) such as entertainment systems to improve the additional value of the product. When the driver interacts with HUD, the interface needs to be clearly visible and easy to read. Therefore, readability is also an evaluation indicator that cannot be ignored [37,38]. The ultimate goal of the design is to provide a better user experience. Aesthetic considerations in the design process can improve the user experience. Aesthetics can be analyzed by considering the color application, symbol design and interface layout.
Through the multi-round Delphi method [39], the collected data and evaluation indicator factors are analyzed and discussed. Combined with the PSSUQ (Post-Study System Usability Questionnaire) [40], three evaluation indicators of the level 1 criteria layer and 15 evaluation indicators of the level 2 criteria layer for the evaluation of in-vehicle HUD interface design schemes are ultimately obtained. The level-1 layer has three criteria: usability, information quality and interface quality. It has the requirements of independence, non-overlap and integrity. At the same time, it has a certain degree of progression in the experience level. A1–A4 represents the level-2 criterion layer of availability; B1–B4 represents the level-2 criterion layer of information quality; C1–C4 represents the level-2 criterion layer of interface quality, as shown in Table 1.

Table 1.
In-vehicle HUD interface design evaluation indicator system.
3.2. Weight Calculation of Each Indicator
3.2.1. Create an Initial Evaluation Matrix
According to the theoretical research of VIKOR [30], there are m solutions in the evaluation system and each solution has n evaluation indicators. The evaluation value of each indicator of the solution m is expressed by aij to establish the original matrix of m × n.
3.2.2. Normalized Evaluation Matrix
The matrix is normalized using the vector normalization method [41]. According to Equations (2) and (3), the cost type and beneficial type are normalized and the matrix Χ can be calculated as follows:
3.2.3. Establishing Entropy Weight Model
Based on the calculation model of the entropy weight method [24], after defining the m × n evaluation matrix, the attribute value proportion of the j-th decision indicator of the i-th scheme can be computed as:
Then calculate the entropy of the j-th decision indicator:
where k is constant, .
Finally, the entropy weight value of each indicator is expressed by the following equation:
3.3. Optimize the Design Scheme
3.3.1. Computation of utility value Si and individual regret Ri
is the negative ideal solution, .
3.3.2. Determine the Compromise Value of the Candidate Schemes Qi
In the last stage, the compromise value Qi can be calculated on the basis of the equation
where: ; ; ; ; ε- compromise coefficient, which is held as 0.5 [42], ε ∈ [0,1]. When ε > 0.5, it means taking the maximization of group interests as the decision basis. When ε < 0.5, the decision is based on individual regret minimization.
3.3.3. Determination of Optimal Scheme
The determination of the optimal scheme is divided into two steps:
- The alternatives are arranged into descending order by the values of Si, Ri and Qi;
- Ranked by Q from smallest to largest, option a1 at position 1 is the best option if it satisfies the following two conditions:
- Condition 1: , a2 is the second scheme by Qi value and m represents the number of alternative schemes.
- Condition 2: Acceptable decision stability, option a1 must be ranked first in Si or Ri values and remain stable in decision making.
If both conditions 1 and 2 are satisfied, a1 is the best scheme; if only condition 1 is satisfied, there is a compromise solution set {a1, a2}; if only condition 2 is satisfied, there is a compromise solution set {a1, a2,..., am} and the maximum value of m is determined by to determine the compromise solution set.
4. Case Study
4.1. HUD Interface Design
In this paper, three in-vehicle HUD interface designs were introduced to verify the proposed methodology. Based on the features of the HUD interface that has been mass-produced in the market at present, some key information was extracted about the interface design and an evaluation indicator system was set up (Table 1). Experts in HUD from a human factor and display technology perspective applied nine-level scales to assign the evaluation indicators and conduct a reliability and validity analysis of each indicator score in SPSS. The Cronbach α (0.860) and KMO coefficient (0.812) are both greater than 0.80, which showed the high reliability and rationality of these evaluation indicators.
The three candidate schemes are shown in Figure 2, Figure 3 and Figure 4 and we applied the Entropy Weight—VIKOR method to evaluate and optimize the design schemes. Each scheme includes the classic, minimalism and sport mode and the design elements and complexity of each mode are different. Here are three schemes as follows:
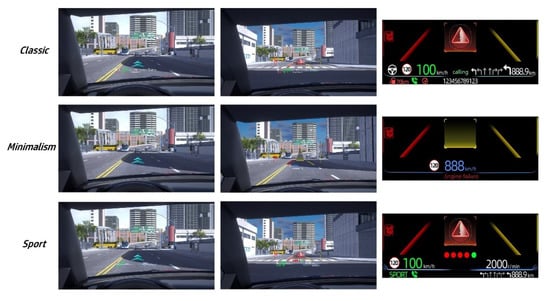
Figure 2.
HUD interface design scheme 1. This scheme adopts the solid boomerang navigation icon. The arrow thickness is appropriately increased in the design and the light and shadow effect is added to make it visually more stereoscopic. As for the WSP (warning system for pedestrians) and FCWS (forward collision warning system) design, the icons are designed in the form of squares as a whole and the specific presentation forms change with the different HUD system modes, e.g., in minimalism mode, only one semi-transparent warning rectangle is displayed.
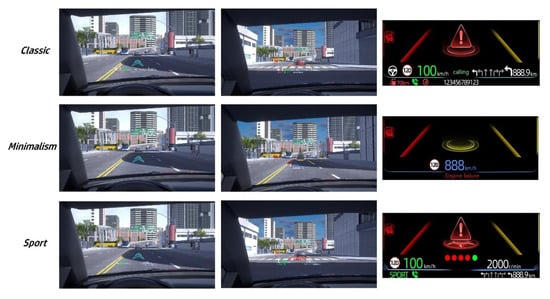
Figure 3.
HUD interface design scheme 2. Scheme 2 adopts hollow navigation arrows, which enhance the integration of AR icons and the real environment and avoid visual obstructions to road conditions. Cyclic annular warning icons are designed for the WSP and FCWS. To be specific, icons in sport mode are designed to be more dynamic and powerful.
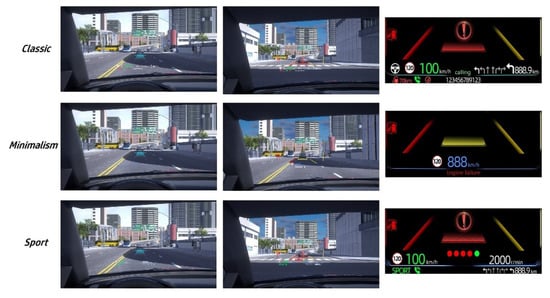
Figure 4.
HUD interface design scheme 3. The plane navigation arrow is used in scheme 3. Although it seems to occupy a lot of visual space, the plane arrow fades to transparent at its back end, so it is actually like a solid arrow with a tail outlined. Semi-transparent triangle background and circular warning icons are used for FCWS.
4.2. Optimizing Design Schemes
4.2.1. Establish an Initial Evaluation Matrix
A total of 20 R&D staff (designers and system testers) were recruited, including 10 males and 10 females (meanage = 32.5, SDage = 4.17). In accordance with the in-vehicle HUD interface design evaluation indicator system (Table 1), we used the nine-level scale (1–terrible, 9–excellent) to assign values to each evaluation indicator of the three design schemes, calculated their mean value and thus obtained the initial evaluation value of the scheme, as shown in Table 2, and established the initial evaluation matrix Α based on Table 2.
Table 2.
Initial evaluation value of schemes.
4.2.2. Normalized Evaluation Matrix
According to the calculation method of the VIKOR decision, all evaluation indicators in the evaluation system are of the beneficial type, so they were normalized using Equation (2) to obtain matrix Χ:
4.2.3. Computation of the Weight of Each Indicator Wj
We calculated the weight wj value of each indicator using Equation (7), as shown in Table 3.
Table 3.
Calculation of each indicator weight wj.
4.2.4. Optimizing the Design Scheme
On the basis of Equations (8) and (9), we calculated the Si, Ri and Qi of the three schemes respectively and arranged them in ascending order. The calculated values of the scheme evaluation are shown in Table 4.
Table 4.
Si, Ri and Qi of each scheme.
According to the evaluation VIKOR method best scheme, the schemes are arranged in ascending order of their compromise value Qi and are sorted into scheme 1, scheme 2 and scheme 3. Condition 1 is satisfied due to inequality ; a1 is the best ranking among Si and Ri values and the order of the group utility value and the individual regret value is the same as the compromise value, so condition 2 is satisfied. As a consequence, scheme 1 is the optimized scheme.
5. Discussion
5.1. Result Interpretation
In the calculation of the objective weight of each evaluation index, it was found that indicators B1 and B4 have the highest weight, reaching B1 = 0.5057, B4 = 0.4425, indicating that B1(the interface provides clear information) and B4(The information organization structure on the interface is clear) are the most significant indicators to the in-vehicle HUD interface. Combined with the design schemes, the background shapes of the warning signs for each scheme are rectangle, circle and triangle. Under the condition of equal length and width, the rectangular area is the largest, which can attract the attention of the driver to the greatest extent, occupy the largest visual area, rapidly improve the driver’s situational awareness level and enable him to quickly detect the danger and take action [43].
Furthermore, by retrospect of participants’ oral description after the experiment, several insights were found that could be beneficial during the design process. For example, concerning the navigation signs, the majority of participants denoted that the navigation arrows would block or interfere with the pointing arrows on the road in some cases, or be excessively analogous to the painted arrows on the road, resulting in cognitive confusion and thus reducing the performance of driving main tasks. This resembled the conclusion reached in the previous literature [44], so the participants were more drawn to the boomerang-type navigation sign, as illustrated in scheme 1.
5.2. Methods Validation
In this paper, an entropy-weight-based VIKOR method is proposed to optimize the scheme of in-vehicle interface design. A case study involving an HUD concept design was employed to demonstrate the proposed method. To verify the validity of the entropy weight and VIKOR design scheme evaluation and optimization method, we compared the proposed method with other decision-making methods, e.g., the FCE (fuzzy comprehensive evaluation) [45], the GRA (grey relational analysis) [46] and the TOPSIS method [47]. In addition, the schemes’ evaluation values and ranking results obtained with the three methods are shown in Table 5.
Table 5.
Evaluation results using different methods.
It can be seen from Table 5 that scheme 1 is the first-rate all along. Except for the deviation in ranking between scheme 2 and scheme 3 of the FCE method, the ranking of the other schemes is consistent, which proves the feasibility and rationality of the proposed method. Next, we will discuss the advantages of this proposed method and the other three MCDM methods respectively.
Compared to the fuzzy comprehensive evaluation method, the evaluation of the relative importance of each indicator element in the fuzzy comprehensive evaluation method had a degree of subjective uncertainty and could not solve the problem of repeated evaluation information caused by the correlation between indicator factors. In this paper, the entropy weight method was used to reduce the subjective factors in the weighting and a more objective weight model for design scheme evaluation was established to make the evaluation results more accurate. In addition, we found very few differences between the values of each scheme in the fuzzy comprehensive evaluation method and there will be ranking deviation (Table 5), and the order of scheme 2 and scheme 3 is opposite.
Compared to the TOPSIS method, the difference between the evaluation values calculated by the TOPSIS method was quite minor and the distribution was dense. However, the excessively accurate ranking appeared in reverse order and the final result was not necessarily the optimal scheme. In the ranking process using the VIKOR method, the advantages of the evaluation schemes were ranked by the comparison of group utility value, regret value and comprehensive utility value. The optimal scheme obtained using this method was the closest to the ideal scheme. As shown in Table 5, the difference between the scheme values calculated by the TOPSIS method was small, which may not be suitable for decision-making in mass schemes, and the VIKOR method will show greater advantages on this occasion.
When it comes to the grey relational analysis method, we generally invited several industry experts to score the schemes and obtain the grey correlation value, which was highly subjective and the difference between the decision-making values of each scheme was small. As shown in Table 5, the difference between the maximum value and the minimum value was only 0.42. When there are many schemes, however, it is not conducive for the decision-makers to make more objective judgments.
5.3. Limitations
Note that this study is intended to introduce a new methodology, certain aspects of the case study may seem incomplete or overlooked. For instance, fifteen usability evaluation indicators were selected, however, some specific characteristics exist for in-vehicle HUD interface, such as interface occlusion, information density and visualization degree, which could be improved in future studies. While HUD interfaces have been used as a case study, the proposed method can be applied to other HMIs as well. However, it is essential to re-analyze the design parameters and modify the usability evaluation system based on the concrete characteristics of the relevant interface.
The proposed method uses the objective entropy weight coefficient to determine the weight value of the scheme, completely excluding the subjective preference of decision makers in the traditional VIKOR method, and drawing on expert notation data and using entropy weight to determine its objective weight. This approach somewhat ignores the experience and preferences of decision makers. However, in the practical design evaluation work itself, the experience and preference of decision makers can play a role in benchmarking and correcting design schemes.
In further work, we will attempt to integrate human physiological factors, e.g., eye movement, EEG (electroencephalogram), fMRI (functional magnetic resonance), EDA (electrodermal activity) [48], when it comes to design evaluation and optimization.
6. Conclusions
The evaluation and optimization of HUD interface design is an important issue in user experiences in the automobile industry. To solve this problem, a hybrid model was proposed in this study by combining the entropy weight and VIKOR methods to offset the inadequacy of one single valuation method and the feasibility of the proposed model was verified by comparative analysis of three design schemes of in-vehicle HUD interface. The following findings emerged from this study:
- (1)
- The entropy weight—VIKOR evaluation model can preferably complement the lack of accuracy and objectivity of one single evaluation model and it can effectively improve the objectivity and accuracy of scheme evaluation results.
- (2)
- The entropy weight—VIKOR model is introduced for design evaluation and optimization, which helps designers determine the optimal design schemes and achieve valuable design insights.
- (3)
- The proposed method may be applied to evaluate the usability of various HMIs, even with subtle alterations to the evaluation system.
Author Contributions
Conceptualization, Y.C.; methodology, X.Z.; software, L.T.; validation, Y.C. and J.Y.; Investigation, Y.C. and J.Y.; resources, L.T.; writing—original draft preparation, Y.C. and J.Y.; writing—review and editing, X.Z.; visualization, Y.C. and L.T.; supervision, X.Z.; funding acquisition, Y.C. and X.Z. All authors have read and agreed to the published version of the manuscript.
Funding
This research was funded by the National First-class Curriculum Cultivation Project (2019YKF43) and Postgraduate Research & Practice Innovation Program of Jiangsu Province (KYCX21_2128).
Institutional Review Board Statement
Not applicable.
Informed Consent Statement
Not applicable.
Data Availability Statement
Not applicable.
Acknowledgments
This paper was funded by the National First-class Curriculum Cultivation Project (2019YKF43) and Postgraduate Research & Practice Innovation Program of Jiangsu Province (KYCX21_2128). We also thank Changan Automobile Group Co., Ltd. for assistance with the experiment.
Conflicts of Interest
The funders had no role in the design of the study; in the collection, analyses, or interpretation of data; in the writing of the manuscript; or in the decision to publish the results.
References
- Hao, T.; Zhengyu, T.; Chunhui, J. Design of Human-Computer Interface; Electronic Industry Press: Beijing, China, 2015; pp. 6–9. [Google Scholar]
- Liang, Y.; Reyes, M.L.; Lee, J.D. Real-Time Detection of Driver Cognitive Distraction Using Support Vector Machines. IEEE Trans. Intell. Transp. Syst. 2007, 8, 340–350. [Google Scholar] [CrossRef]
- Venkatasawmy, R. The Digitization of Cinematic Visual Effects: Hollywood’s Coming of Age; Lexington Books: Washington, DC, USA, 2012. [Google Scholar]
- Schewe, F.; Vollrath, M. Ecological interface design effectively reduces cognitive workload—The example of HMIs for speed control. Transp. Res. Part F Traffic Psychol. Behav. 2020, 72, 155–170. [Google Scholar] [CrossRef]
- Kuniyoshi, J.R.G.; Costa, A.T.; Figueira, A.C.; Kabbach, F.I., Jr.; Larocca, A.P.C. Driver’s visual perception as a function of age. Using a driving simulator to explore driver’s eye movements in vertical signs. Transp. Res. Interdiscip. Perspect. 2021, 11, 100460. [Google Scholar] [CrossRef]
- Voinescu, A.; Morgan, P.L.; Alford, C.; Caleb-Solly, P. The utility of psychological measures in evaluating perceived usability of automated vehicle interfaces—A study with older adults. Transp. Res. Part F Traffic Psychol. Behav. 2020, 72, 244–263. [Google Scholar] [CrossRef]
- Su, Y.; Tan, Z.; Dai, N. Changes in Usability Evaluation of Human-Machine Interfaces from the Perspective of Automated Vehicles. In Advances in Usability, User Experience, Wearable and Assistive Technology; Ahram, T.Z., Falcão, C.S., Eds.; AHFE, Lecture Notes in Networks and Systems; Springer: Cham, Switzerland, 2021; Volume 275. [Google Scholar] [CrossRef]
- Park, H.; Kim, K.-H. Efficient Information Representation Method for Driver-Centered AR-HUD System. In Design, User Experience, and Usability. User Experience in Novel Technological Environments; Marcus, A., Ed.; DUXU 2013. Lecture Notes in Computer Science; Springer: Berlin/Heidelberg, Germany, 2013; Volume 8014, pp. 393–400. [Google Scholar] [CrossRef]
- Li, R.; Chen, Y.V.; Zhang, L.; Shen, Z.; Qian, Z.C. Effects of perception of head-up display on the driving safety of experienced and inexperienced drivers. Displays 2020, 64, 101962. [Google Scholar] [CrossRef]
- Mojaver, P.; Khalilarya, S.; Chitsaz, A. Multi-objective optimization and decision analysis of a system based on biomass fueled SOFC using couple method of entropy/VIKOR. Energy Convers. Manag. 2020, 203, 112260. [Google Scholar] [CrossRef]
- Rasheed, M.; Alabdali, O.; Shihab, S. A New Technique for Solar Cell Parameters Estimation of The Single-Diode Model. J. Physics Conf. Ser. 2021, 1879, 032120. [Google Scholar] [CrossRef]
- Rasheed, M.; Mohammed, O.Y.; Shihab, S.; Al-Adili, A. A comparative Analysis of PV Cell Mathematical Model. J. Physics Conf. Ser. 2021, 1795, 012042. [Google Scholar] [CrossRef]
- Xu, X.Q.; Cheng, Y.S.; Cheng, G.Q. Research on the evaluation method and application of RV modelling based on AHP. Mech. Des. 2020, 37, 140–144. [Google Scholar] [CrossRef]
- Simab, M.; Javadi, M.S.; Nezhad, A.E. Multi-objective programming of pumped-hydro-thermal scheduling problem using normal boundary intersection and VIKOR. Energy 2018, 143, 854–866. [Google Scholar] [CrossRef]
- Fajdek-Bieda, A. Using Entropy-VIKOR method in chemical processes optimization. Procedia Comput. Sci. 2021, 192, 4208–4217. [Google Scholar] [CrossRef]
- Tiwari, V.; Jain, P.K.; Tandon, P. Product design concept evaluation using rough sets and VIKOR method. Adv. Eng. Informa. 2016, 30, 16–25. [Google Scholar] [CrossRef]
- Sarina; Zhang, S. Joint variable weight group decision making method for complex product design schemes. J. Zhejiang Univ. (Eng. Ed.) 2013, 47, 711–719. [Google Scholar]
- Zhang, H.; Lu, M.; Ke, X.; Yu, S.; Zhao, J.; Wu, Y.; Cheng, L.; Li, X. Evaluation model of black-start schemes based on optimal combination weights and improved VIKOR method. Int. J. Electr. Power Energy Syst. 2021, 129, 106762. [Google Scholar] [CrossRef]
- Shemshadi, A.; Shirazi, H.; Toreihi, M.; Tarokh, M. A fuzzy VIKOR method for supplier selection based on entropy measure for objective weighting. Expert Syst. Appl. 2011, 38, 12160–12167. [Google Scholar] [CrossRef]
- Yang, H.; Zhao, Y.; Zhao, Y.; Chen, N. Drivers’ visual interaction performance of on-board computer under different heat conditions: Based on ELM and entropy weight. Sustain. Cities Soc. 2022, 81, 103835. [Google Scholar] [CrossRef]
- Shannon, C.E. A mathematical theory of communication. Bell Syst. Tech. J. 1948, 27, 379–423. [Google Scholar] [CrossRef]
- Shannon, C.E.; Weaver, W. (Eds.) The Mathematical Theory of Communication; University of Illinois Press: Urbana, IL, USA, 1949. [Google Scholar]
- Deng, H.; Yeh, C.-H.; Willis, R.J. Inter-company comparison using modified TOPSIS with objective weights. Comput. Oper. Res. 2000, 27, 963–973. [Google Scholar] [CrossRef]
- Mohsen, O.; Fereshteh, N. An extended VIKOR method based on entropy measure for the failure modes risk assessment – A case study of the geothermal power plant (GPP). Saf. Sci. 2017, 92, 160–172. [Google Scholar] [CrossRef]
- Wu, J.-Z.; Zhang, Q. Multicriteria decision making method based on intuitionistic fuzzy weighted entropy. Expert Syst. Appl. 2011, 38, 916–922. [Google Scholar] [CrossRef]
- Jing, L.; Wang, J.; Xie, J.; Feng, D.; Wang, J.; Peng, X.; Jiang, S. A quantitative simulation-based conceptual design evaluation approach integrating bond graph and rough VIKOR under uncertainty. J. Clean. Prod. 2022, 380, 134928. [Google Scholar] [CrossRef]
- Liao, H.; Xu, Z. A VIKOR-based method for hesitant fuzzy multi-criteria decision making. Fuzzy Optim. Decis. Mak. 2013, 12, 373–392. [Google Scholar] [CrossRef]
- Tzeng, G.-H.; Lin, C.-W.; Opricovic, S. Multi-criteria analysis of alternative-fuel buses for public transportation. Energy Policy 2005, 33, 1373–1383. [Google Scholar] [CrossRef]
- Opricovic, S. Fuzzy VIKOR with an application to water resources planning. Expert Syst. Appl. 2011, 38, 12983–12990. [Google Scholar] [CrossRef]
- Khan, M.J.; Kumam, P.; Kumam, W. Theoretical justifications for the empirically successful VIKOR approach to multi-criteria decision making. Soft Comput. 2021, 25, 7761–7767. [Google Scholar] [CrossRef]
- Opricovic, S. Multi-criteria Optimization of Civil Engineering Systems; Faculty of Civil Engineering: Belgrade, Serbia, 1998. [Google Scholar]
- Opricovic, S.; Tzeng, G.-H. Compromise solution by MCDM methods: A comparative analysis of VIKOR and TOPSIS. Eur. J. Oper. Res. 2004, 156, 445–455. [Google Scholar] [CrossRef]
- Charissis, V.; Papanastasiou, S. Human–machine collaboration through vehicle head up display interface. Cogn. Technol. Work. 2008, 12, 41–50. [Google Scholar] [CrossRef]
- Park, J.; Abdel-Aty, M.; Wu, Y.; Mattei, I. Enhancing In-Vehicle Driving Assistance Information under Connected Vehicle Environment. IEEE Trans. Intell. Transp. Syst. 2019, 20, 3558–3567. [Google Scholar] [CrossRef]
- Beck, D.; Jung, J.; Park, J.; Park, W. A Study on User Experience of Automotive HUD Systems: Contexts of Information Use and User-Perceived Design Improvement Points. Int. J. Hum.–Computer Interact. 2019, 35, 1936–1946. [Google Scholar] [CrossRef]
- Betancur, J.A.; Villa-Espinal, J.; Osorio-Gómez, G.; Cuellar, S.; Suarez, D.R. Research topics and implementation trends on automotive head-up display systems. Int. J. Interact. Des. Manuf. (IJIDeM) 2018, 12, 199–214. [Google Scholar] [CrossRef]
- Blankenbach, K.; Buckley, E. Perceptual Effects of Laser-Based HUDs. J. Disp. Technol. 2012, 8, 194–197. [Google Scholar] [CrossRef]
- Chi, M.; Zhou, L. Research on Readability of Adaptive Foreground in Dynamic Background; Vergnano, A., Leali, F., Taiar, R., Eds.; Advances in Intelligent Systems and Computing; Springer: Cham, Switzerland, 2020; Volume 1131, pp. 1244–1249. [Google Scholar] [CrossRef]
- Brady, S.R. Utilizing and Adapting the Delphi Method for Use in Qualitative Research. Int. J. Qual. Methods 2015, 14. [Google Scholar] [CrossRef]
- Lewis, J.R. IBM computer usability satisfaction questionnaires: Psychometric evaluation and instructions for use. Int. J. Hum.–Computer Interact. 1995, 7, 57–78. [Google Scholar] [CrossRef]
- Çelen, A. Comparative Analysis of Normalization Procedures in TOPSIS Method: With an Application to Turkish Deposit Banking Market. Informatica 2014, 25, 185–208. [Google Scholar] [CrossRef]
- Cristóbal, J.R.S. Multi-criteria decision-making in the selection of a renewable energy project in spain: The Vikor method. Renew. Energy 2011, 36, 498–502. [Google Scholar] [CrossRef]
- Avetisyan, L.; Ayoub, J.; Zhou, F. Investigating explanations in conditional and highly automated driving: The effects of situation awareness and modality. Transp. Res. Part F Traffic Psychol. Behav. 2022, 89, 456–466. [Google Scholar] [CrossRef]
- Pfannmüller, L.; Kramer, M.; Senner, B.; Bengler, K. A Comparison of Display Concepts for a Navigation System in an Automotive Contact Analog Head-up Display. Procedia Manuf. 2015, 3, 2722–2729. [Google Scholar] [CrossRef]
- Wei, X.; Luo, X.; Li, Q.; Zhang, J.; Xu, Z. Online Comment-Based Hotel Quality Automatic Assessment Using Improved Fuzzy Comprehensive Evaluation and Fuzzy Cognitive Map. IEEE Trans. Fuzzy Syst. 2015, 23, 72–84. [Google Scholar] [CrossRef]
- Wei, G.-W. Gray relational analysis method for intuitionistic fuzzy multiple attribute decision making. Expert Syst. Appl. 2011, 38, 11671–11677. [Google Scholar] [CrossRef]
- Pan, J.; Cao, X.; Wang, D.; Chen, J.; Yuan, J. Vehicle Interior Sound Quality Evaluation Index Selection Scheme Based on Grey Relational Analysis. Fluct. Noise Lett. 2020, 19. [Google Scholar] [CrossRef]
- Pedersen, H.; Quist, J.S.; Jensen, M.M.; Clemmensen, K.K.B.; Vistisen, D.; Jørgensen, M.E.; Færch, K.; Finlayson, G. Investigation of eye tracking, electrodermal activity and facial expressions as biometric signatures of food reward and intake in normal weight adults. Food Qual. Preference 2021, 93, 104248. [Google Scholar] [CrossRef]
Disclaimer/Publisher’s Note: The statements, opinions and data contained in all publications are solely those of the individual author(s) and contributor(s) and not of MDPI and/or the editor(s). MDPI and/or the editor(s) disclaim responsibility for any injury to people or property resulting from any ideas, methods, instructions or products referred to in the content. |
© 2023 by the authors. Licensee MDPI, Basel, Switzerland. This article is an open access article distributed under the terms and conditions of the Creative Commons Attribution (CC BY) license (https://creativecommons.org/licenses/by/4.0/).