Abstract
In this paper, a prestressed precast reinforced concrete (PC) beam–column connection incorporating posttensioned debonded partial tendons is introduced for PC frame structure. Compared with the conventional cast-in-place frames and many previously proposed connections for PC frames, this connection has the advantage of self-centering and low damage in strong earthquakes. In addition, the debonded partial tendons can reduce the posttensioning demand and further reduce site labor during construction and repair. In order to establish a performance evaluation method for the ultimate flexural limit of the proposed PC connection, an analytical model was developed to accurately reflect the deformation compatibility and force equilibrium conditions of the PC beam and column members, as well as the debonded partial tendons. Based on this, iterative and direct evaluation methods for the strength and deformation of the PC connections, as well as the strains of the debonded tendons, were developed. The proposed methods were verified by cyclic loading test on the beam–column connection subassemblages. It is concluded that the proposed method is sufficiently accurate and simple to be applied in engineering design, and is helpful to guarantee the self-centering and low-damage characteristics of the proposed connection against a strong earthquake.
1. Introduction
Owing to their advantages of high quality control, high-speed construction and a reduction in site labor, precast reinforced concrete buildings have been widely adopted in many countries for more than 50 years [1,2,3,4,5]. To ensure the performance of precast RC structures against strong earthquakes, extensive work has been done to develop various beam–column connections with the goal of guaranteeing ductility and energy dissipation. Such examples include cast-in-place concrete connections [6,7,8,9], posttensioned stranded or bolted connections through end plates [10,11,12,13], and bolted connections through embedded steel plates [14,15], etc. All of the above connections exhibit a certain level of ductility and energy consumption, but at the expense of concrete damage and structural residual deformation, which is similar to the cast-in-place RC frames.
Focusing on the postearthquake repairability of the structures and continuity of the building operations, the prestressed precast RC structures (donated by PC structures in this work) will be one of the promising options. For the PC structures, the beam–column connection containing debonded prestressed steel tendons has been proposed by Priestley et al. [16,17,18]. The PC beams are connected to the multistory RC columns with prestressing tendons, which are debonded in a certain region. The deformation of the debonded PC connection is characterized by the near-rigid rotation of the PC beam and column members around the contact interface, and the crack openings are formed due to the separation at the beam–column interface. Therefore, the deformation of the debonded PC frames is mainly concentrated at the crack openings, while the deformation occurring on the beam and column members is relatively small. Meanwhile, because the strain in the tendons is uniformly distributed along the debonded length, the tendons remain within the yield limit, even when large deformations occur in the buildings. Due to these characteristics, the debonded PC frame can achieve self-centering even against strong earthquakes, while the damage to the PC beam and column members is quite minor. These advantages have been demonstrated by cyclic loading tests on beam–column connection subassemblages [18,19,20,21,22], shaking table tests on frames [23,24], as well as numerical simulations [25,26,27]. These advantages are expected to benefit the postearthquake repairability and continuous operation of the structure. Figure 1 gives the final damage map and the load–deformation relationship of a debonded PC subassemblage specimen representing an exterior beam–column connection tested by the authors [28], where it can be observed that only slight damage is generated on the specimen and the residual deformation is very small after a large deformation drift of 4%. Previous researchers have also applied similar connections with debonded tendons to other types of structural components, including concrete rocking walls [29,30,31,32,33,34], coupling beams between shear walls [35,36], rocking steel braced frames [37,38,39,40], beam–column connections in steel moment frames [41,42,43,44], rocking cross-laminated timber (CLT) panels [45,46], laminated veneer lumber (LVL) panels [47,48], and masonry walls [49,50]. All of these structural components were found to exhibit superior self-centering and low damage characteristics from the experimental studies.
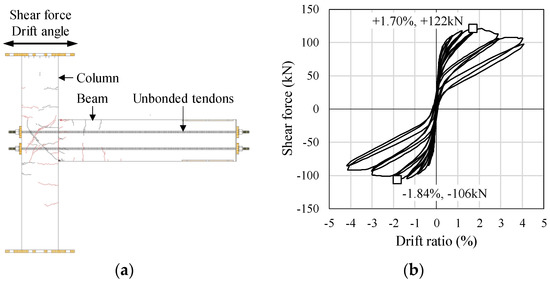
Figure 1.
Test result of PC beam−column connection subassemblage: (a) damage map after loading to 2.0% of drift angle; (b) load−deformation diagram.
The seismic performance of the debonded PC frames is dominated by the beam–column connections, and the frames are generally designed as strong column–weak beam systems to achieve ductile seismic behavior. Hence, an appropriate assessment of the load-bearing capacity and deformation of the debonded PC beam at the performance limit is essential for the correct simulation of the seismic response and reliable performance-based seismic design. One of the earliest studies on the ultimate flexural strength and deformation of debonded posttensioned beams was carried out by Ban and Muguruma [51], where concentrated vertical loads were considered. Regarding the debonded beam–column connection subassemblages shown in Figure 1, some existing methods [52,53] can directly calculate the ultimate flexural capacity at the beam ends when the strain at the extreme concrete fiber reaches the ultimate limit, but they cannot evaluate the corresponding beam deflection. Some other methods can evaluate the ultimate flexural capacity and deformation [17,54,55,56], but based on determined stresses and strains of the debonded tendons. Since the tendons remain elastic as a precondition for the connections to have the self-centering capacity, it is necessary to accurately evaluate the strain of the tendons at the ultimate flexural state.
In numerous previous studies [16,18,20,23,24], the tendons were designed to pass through the entire PC beams and even multiple spans of the entire frame. This arrangement allows the tensile stresses generated by the tendons to be distributed over a long range, thus ensuring that the tensile stresses do not exceed the yield limit, even when the tensile forces acting on the tendons are significant. However, when the size of structures becomes large, this through-length arrangement of tendons requires a high level of tensioning work to achieve the designed prestress level. In this paper, therefore, a PC beam–column connection with debonded partial tendons is introduced, and the direct evaluation methods for the ultimate flexural strength and deflection of the beam are developed. This method takes into account the different tensile forces of multiple debonded tendons, which cannot be considered by the existing methods [17,54,55,57,58].
In this work, the analytical model of the PC connections and the performance evaluation methods for the ultimate flexural limit are developed. Firstly, the relationships between the deformation and strain of concrete and tendons in each section of the beam are established based on the deformation compatibility and force equilibrium conditions. The analytical model considers the beam deformation developed in the prestressed concrete part and the reinforced concrete part. This analytical model is precise enough to facilitate a comprehensive evaluation of strength and deformation of the beam, as well as the strains of the debonded partial tendons, at the ultimate flexural limit. The accuracy of the evaluation method is verified by cyclic loading tests of the beam–column connection subassemblages.
2. Model of Beam–Column Subassemblage
2.1. Model Outline
The PC beam–column connection focused on in this study is illustrated in Figure 2. It is an example taken from previous experimental specimens by the authors, which will be further covered in Section 4. The precast RC column and beam, which were separately fabricated, are attached by the interface mortar between them. The posttension forces are then applied to the debonded partial tendons located within a certain distance from the beam end, so the precast beam consists of a PC zone and an RC zone. Herein, the beam zone containing the prestressed debonded tendons is defined as the PC zone, and the beam zone without tendons is defined as the RC zone. By utilizing this type of connection, several benefits such as easier assembly, easier replacement of damaged members or tendons, and cost savings by the use of shorter tendons will be expectable.
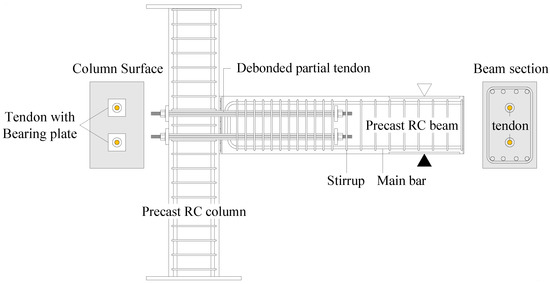
Figure 2.
Structural system of prestressed RC frame with debonded partial tendon.
The strength and the deformation at the flexural ultimate state are calculated based on an analytical model, which is based on ideas from [21,22] by the authors. The analytical model shown in Figure 3 represents the beam and column member of an exterior beam–column connection of the PC frames with debonded partial tendons. As explained above, it is noted that the zone (l’) with partial tendons is defined as the PC zone, and the zone (l-l’) without tendons is defined as the RC zone. As shown in Figure 3, when a lateral force is applied to the frame, the beam rotates as a near-rigid body, while the main crack opening takes place at the beam–column interface. Minor cracks might also occur especially in the RC zone if the bending moment exceeds the cracking limit (Mc) of the RC zone. It is noted that in this study, the case of unyielding longitudinal reinforcement in the RC zone was mainly considered, because little residual deformation and self-centering behavior are desired.
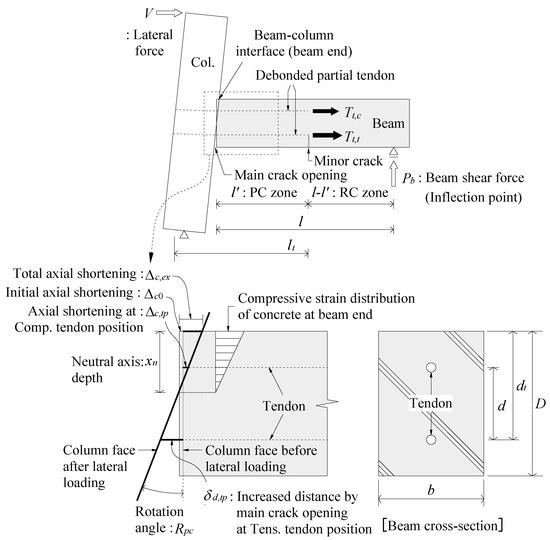
Figure 3.
Analytical model of exterior beam–column connection subassemblage of PC frame with debonded partial tendons.
Focusing on the PC zone, resulting from the concrete strain in the extreme compression fiber along the PC zone (l’), an axial shortening Δc,ex concentrates at the beam–column interface. According to the condition of deformation compatibility, elongation of the tensile side tendon is equal to the crack-opening distance δd,tp at the tendon location, and shortening of the compressive side tendon equals the concrete axial shortening Δc,tp at the tendon location. In addition, according to the condition of force equilibrium, the tensile resultant force of the tendons at the beam end equals the compressive resultant force of the concrete.
It is noted that, besides the debonded tendons, a small amount of longitudinal reinforcement is also arranged in the PC beams to hold the stirrups. In this study, for simplicity, the longitudinal bars are terminated at the beam end like the specimens described in Section 4.1. The effects of these bars on the bending moment at the beam end and the deflection of the PC beam are therefore ignored. In previous studies [18,19,20,59], the longitudinal bars passed through the beam–column interface and were fixed inside the PC column, in order to improve energy dissipation capacity of the connection. In that case, the evaluation methods proposed in this study are also applicable by simple extensions.
The analytical model visualizes the distribution and interrelationship of various parameters at any beam section, including the deformations, internal forces, strains and stresses of concrete and tendons. As described in the later subsections, the deformation compatibility and force equilibrium conditions are established based on these parameters through this analytical model.
2.2. Constitutive Model of Concrete and Tendons
The PC members considered in this study are made of high-strength concrete. When the concrete strain is less than the ultimate limit εcu, the stress–strain relationship is approximately linear, as shown in Figure 4 [28,60]. Therefore, the linear constitutive model shown in Figure 5a is employed for the high-strength concrete, and the elastic stiffness Ec is defined as the ratio of compressive strength σB to εcu. Meanwhile, the trilinear constitutive model in Figure 5b is employed for the tendons, where the elastic limit point (εte, σte) separates the elastic stage and the stiffness decreasing stage, while the yielding point (εty, σty) separates the stiffness decreasing stage and the postyielding stage where the stiffness is very small. The two points can be determined from the tensile test of tendons, where the elastic limit point and the yielding point are obtained by 0.01% and 0.2% offset methods, respectively [61]. This trilinear model can reflect the gradual degradation of tendon stiffness from the elastic stage to the postyielding stage. Based on the trilinear constitutive model, the equations for tendon tensile force Tt can be obtained as follows.
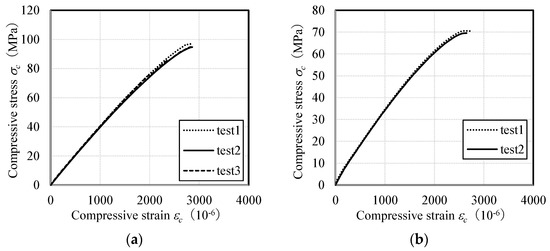
Figure 4.
Compressive stress−strain relations of concrete by material tests: (a) PCX01; (b) PCJ06.
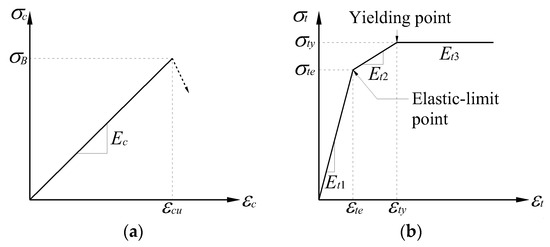
Figure 5.
Constitutive model: (a) high-strength concrete; (b) tendons.
2.3. Force Equilibrium Condition
As shown in Figure 6, at the end of the PC zone, the force equilibrium condition given by Equation (2) exists between the tensile resultant force of tendons (Tt,t + Tt,c) and the compressive resultant force of concrete (Cc).
where b is the beam width, and Tt,t and Tt,c are the tendon forces on the tensile and compressive sides, respectively.
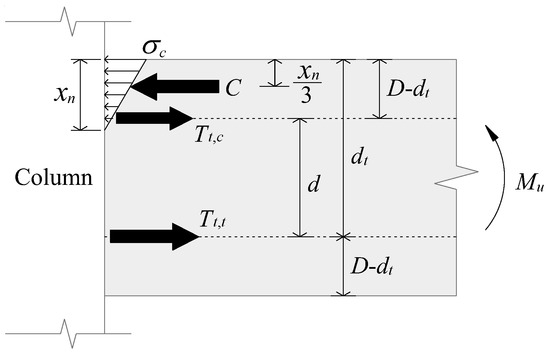
Figure 6.
Force equilibrium condition at beam end.
2.4. Deformation Compatibility Condition
Once the main crack opens at the beam–column interface, for arbitrary section in the PC zone, compressive strain is generated from the ultimate compression fibers to the neutral axis. As an accumulation of the compressive strain in all sections within the PC zone (l’), the axial shortening Δc,ex occurs at the extreme compression fiber of the beam end. In addition, the prestress of tendons causes an additional concrete axial shortening Δc0 at the beam end, which is equal to the product of the initial concrete compressive strain εc0 and the length l’ of the PC zone. As mentioned in Section 2.1, the opening distance δd,tp equals the elongation of the tensile side tendon, while the concrete axial shortening Δc,tp equals the shortening of the compressive side tendon. Based on the deformation compatibility conditions and the plane section assumption of the concrete cross-section at the beam end, as shown in Figure 3, the concrete axial shortening Δc,tp at the compressive side tendon position and the opening distance δd,tp at the tensile side tendon position can be expressed as Equations (3) and (4).
where D is the beam depth, dt is the distance between the extreme compression fiber and the tendon position on the tensile side, εt,c and εt,t are the tendon strains on the compressive and tensile sides. εt0 is the initial tensile strain of tendons due to the pre-tension force, and εc0 denotes the initial compressive strain of the concrete caused by the same reason. The total length of the partial tendons is lt. The tendon deformations can be calculated by multiplying the tendon strains with lt. By solving Equations (3) and (4), εt,c and εt,t can be expressed as Equations (5) and (6).
2.5. Evaluation of Concrete Axial Shortening Δc,ex
In Equations (3) and (4), the concrete axial shortening Δc,ex is a crucial value for accurate deformation evaluation, which has not been considered in previous studies [17,55]. Δc,ex is then evaluated based on the force equilibrium condition between the tendons and the concrete. Because Tt,t and Tt,c are constant along the debonded tendon length (l’), Cc should be equal at arbitrary beam section in the PC zone. By considering the linear distribution of bending moment along the beam, the constant compressive resultant force of concrete and its linear stress–strain models given in Section 2.1, the concrete strain distribution along the PC zone can be expressed as shown in Figure 7. Accordingly, Δc,ex can be calculated by Equation (7) as the integral of the concrete strains (εnx) at the extreme compression fiber. The detail derivation of Equation (7) can be found in Appendix A. Based on Δc,ex, εt,c and εt,t obtained from the analytical model, evaluation methods for the beam strength and deformation at the ultimate flexural limit state are proposed in the next chapter.
where l is the distance from the beam–column interface to the inflection point, d is the distance between the tendon positions on the compressive and tensile sides, and β is a coefficient defined by Equation (8).
where dt,t is the distance from the tendon position on the tensile side to the position of tensile resultant force of tendons. The coefficient β makes it possible to consider the difference between the tendon forces. As the tendon force on the tensile side (Tt,t) becomes larger relative to that on the compressive side (Tt,c), the value of β decreases and the position of tendon forces shifts to the tensile side. β equals 0.5 when the tendons have same tensile forces.
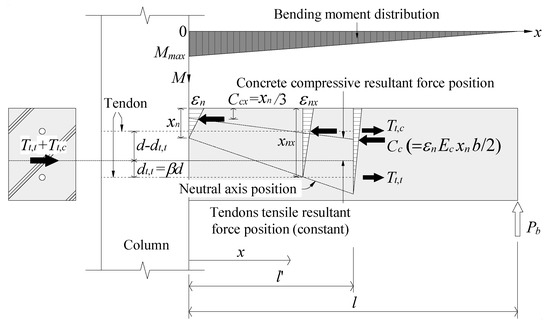
Figure 7.
Compressive and tensile resultant forces at arbitrary beam section of PC zone.
3. Evaluation of Ultimate Flexural Limit State
In this chapter, general equations for the strength and deformation at the ultimate flexural limit state are introduced, and then the iterative and simplified evaluation methods are separately proposed. In this study, the ultimate flexural limit is defined as the state where the concrete strain at the extreme compression fiber reaches the ultimate strain (εcu = 0.003) and the spalling of cover concrete begins.
3.1. Bending Moment at Beam–Column Interface
The ultimate flexural strength is evaluated by considering the force equilibrium between the tendons and concrete at the beam end of the PC zone. As shown in Figure 6, with respect to the position of Cc, the ultimate bending moment (Mb,u) at the beam end of PC zone can be calculated from Equation (9), and the corresponding ultimate shear force at the beam inflection point (Pb,u) can be calculated from Equation (10). Evaluation methods for the unknowns (xn, Tt,c, Tt,t) will be introduced in Section 3.3 and Section 3.4.
It is noted that the triangular stress distribution of concrete compressive stress is employed as in Figure 6. For the stress distribution actually in a parabolic form, the triangular distribution is an approximation. Due to this approximation, the distance from the tendon forces (Tt,t and Tt,c) to the concrete compressive resultant forces (C) might be overestimated. However, the compressive resultant force is underestimated by the triangular distribution simultaneously, when the stress at the extreme fiber is identical (σB). The high-strength concrete considered in this work also has a nearly linear stress–strain relationship. Therefore, the evaluation error of the ultimate bending moment (Mb,u) due to the approximated triangular distribution is considered to be slight.
After obtaining the bending moment at the beam end and the shear force at the beam inflection point, the stress distribution at column sections could be calculated by equilibrium conditions and sectional analysis.
3.2. Beam Deflection Angle
As mentioned earlier, the PC zone rotates as a near-rigid body. Although there is no yielding of longitudinal reinforcement occurs in the RC zone, the RC zone might also have small deformation. Thus, the beam deflection angle consists of two parts developing from the PC zone and the RC zone, which are denoted by Rpc,u and Rrc,u, respectively. The rotation angle developing at the beam–column interface due to the main crack opening can be calculated from Equation (11), and considered as the beam deflection angle (Rpc,u) of the PC zone.
On the other hand, the beam deflection angle of RC zone, Rrc,u, is calculated from Equation (12) based on the trilinear bending moment–deflection angle relation shown in Figure 8 [62].
where Mb,rc is the moment force acting on the boundary between PC and RC zones at ultimate flexural state, which can be calculated based on the calculated Mb,u at the linearly distributed bending moment shown in Figure 7. The cracking drift angle (Rc), the cracking moment (Mc), the initial stiffness (Kc), the yielding drift angle (Ry), the yielding moment (My) and the secant stiffness (αy) at the yielding point are calculated by Equation (13) through (19) according to the AIJ provision [62], where αy was evaluated from the test results of over 200 specimens in order to estimate the yielding drift angle of RC members [63].
where Ze is the section modulus of RC zone, at is the cross-sectional area of longitudinal reinforcement, d is the effective depth, n is Young’s modulus ratio of reinforcement and concrete, and pt is the longitudinal reinforcement ratio.
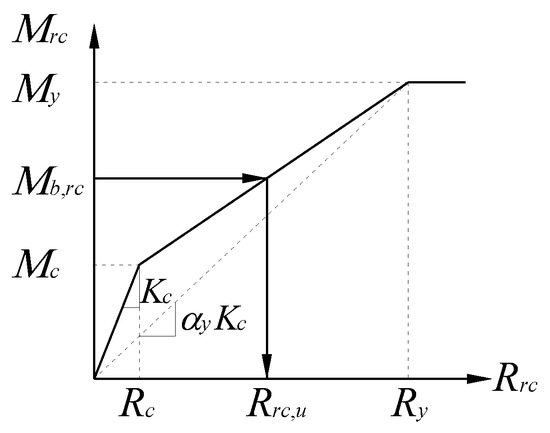
Figure 8.
Load–deflection angle of RC member.
As can be seen from Figure 8 and Equation (12), the case of Rrc,u less than Ry is taken into account and the case of Rrc,u beyond Ry is not considered because the longitudinal reinforcement yielding is not allowed, as mentioned earlier. It should be noted that all these equations are usually applied to predict and reproduce the lateral load–deformation curves of test results in Japan. As a result, the total beam deflection angle (Rb,u) can be estimated from Equation (20).
3.3. Iterative Evaluation Procedure
The tendon forces (Tt,c, Tt,t) in Equation (2) are first assumed. For example, Tt,c and Tt,t might be assumed at the yielding limit by considering the yielding strain εty. Then, by substituting σB for σc, the initial value of the neutral axis depth (xn) and the coefficient β can be calculated by Equations (2) and (8). Based on the obtained xn and β, and by substituting εcu (=0.003) for εn, the concrete axial shortening Δc,ex can be obtained from Equation (7). The tendon strains (εt,c, εt,t) thus can be obtained by Equations (5) and (6), and the corresponding tendon forces Tt,c and Tt,t are calculated by Equation (1). Then the initially assumed values of Tt,c and Tt,t are replaced by the calculated ones, and this is repeated until the calculated values are sufficiently close to the values in the last step.
After the calculated values of Tt,c and Tt,t converge, accurate xn and β can be obtained by Equations (2) and (8), respectively. They are then substituted into Equation (7) to calculate the accurate Δc,ex. Subsequently, the ultimate bending moment Mb,u and shear force Pb,u can be obtained by Equations (9) and (10), and the beam deflection angle Rb,u can be calculated by Equations (11), (12) and (20).
Similar iterative methods have been adopted by the authors in [21,22], while other design methods based on iterative processes were also proposed in previous studies (e.g., [57,58]), but not aimed at the PC connections with debonded partial tendons.
3.4. Simplified Evaluation Procedure
The iterative method presented above includes the convergence procedure and requires excessive computational costs, especially in a design practice involving large-scale or complex structures. Consequently, a simplified method is also proposed here based on the approximation of Δc,ex. The flexural ultimate strength, deformation, and the corresponding tendon strains can be determined directly by the simplified method.
Similar to the previous study by the authors [21,22], it is assumed that along the PC zone (l’), the concrete strains εnx at the extreme compression fiber distribute in a logarithmic form, as illustrated in Figure 9. The approximation of concrete axial shortening can thus be calculated as Equation (21) and denoted by Δ*c,ex.
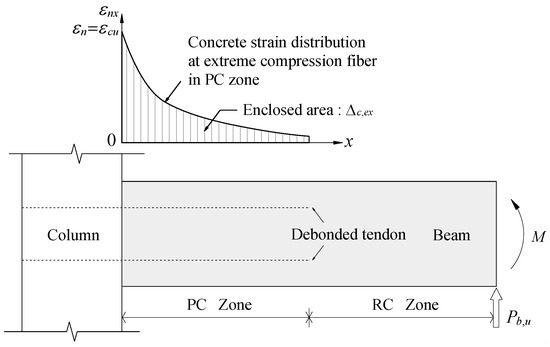
Figure 9.
Concrete strain distribution at extreme compression fiber in PC zone.
Then, substituting Δ*c,ex into Equations (5) and (6) gives the expressions for the tendon strain εt,c and εt,t, which contain the unknown neutral axis depth xn. Substituting the expressions into Equation (1) and assuming that εt,c and εt,t are between the elastic limit εte and the yield limit εty, the expressions for Tt,c and Tt,t can be obtained. Next, by substituting the expressions of Tt,c and Tt,t into Equation (2), Equation (22) is derived, which is a quadratic equation with respect to xn.
By solving for xn and substituting it into Equations (5) and (6), values of εt,c and εt,t can be calculated based on Δ*c,ex given by Equation (21). Then, Pb,u and Rb,u can be calculated using the similar steps as in the iterative method.
It is noted that if the tendon length is extremely short, the tendon might yield before the beam reaches the ultimate flexural state, which was actually found in the specimen PCJ05, as shown later in Section 4.2. In this specimen, the tendon length inside the beam was set to be only 1.0D, where D is the beam depth, and the strain (= 7085 μ) of the tensile side tendon just exceeded the yielding limit εty (=7010μ) at the ultimate limit. However, it is judged to be just slightly exceeding the yielding limit, and in practice, it would be an exceptional case, since an unyielding tendon is favorable. In addition, limiting the strain value of the tendon to εty can provide conservative estimation of the ultimate deformation of the beam.
The simplified method proposed above is based on the approximation of concrete axial shortening Δ*c,ex. Because the beam deflection angle of the PC zone (Rpc,u) is directly related to Δ*c,ex, the approximation might result in lower accuracy of the evaluation result of beam deflection angle, as shown in Section 4.3. Therefore, two coefficients are introduced as Equation (23), and the ratio of the accurate Δc,ex and the approximated Δ*c,ex can be given as Equation (24), based on Equations (7), (21) and (23).
The ratio is denoted by correction factor ξ, and by multiplying ξ, the evaluation result Rpc,u through the simplified method could be corrected to have higher accuracy.
In the simplified method, after xn is obtained by solving Equation (22), the tendon forces, the coefficient β, γ and χ, and the correction factor ξ can be calculated step by step. It is noted that although the variables (xn, εt,c, and εt,t) used in the calculation of γ and χ are obtained based on the approximated Δ*c,ex, its difference from the accurate Δc,ex will not lead to large errors in γ or χ. This hypothesis is reasonable because of the uniform distribution of εt,c and εt,t along the debonded partial tendons. The changes in εt,c and εt,t caused by the change in Δ*c,ex would be minor, as well as the consequent change in the resultant force of tendons. Therefore, the errors in β, γ and χ due to the error in Δ*c,ex would not be significant, and the correction factor ξ based on the less accurate Δ*c,ex could still ensure the corrected Rpc,u to be accurate enough.
4. Verification of Evaluation Methods
Previous cyclic loading tests conducted by the authors and their results are briefly introduced, and accuracy of the iterative method is verified by the test results. Evaluation results of the simplified method are then compared with the iterative method.
4.1. Outline of Previous Experiments
Two PC beam–column subassemblage specimens (PCJ05, PCJ06) and two PC cantilever beam-type specimens (PCX01, PCX02) tested by the authors [28,60] are presented here. The details of the specimens are shown in Figure 10, and their properties are briefly summarized in Table 1. The test setup of the specimens is given in Figure 11. The precast RC column and beam members were fabricated independently, and they were attached by the interface mortar. The posttension force was then applied to the debonded partial tendons. Specimen PCJ05 has the shortest tendon length, while the other specimens have almost the same tendon length. The initial prestressing ratio (λ), which is the ratio of the total initial prestress force ΣTt0 to the total yielding force ΣσtyAt of the tendons, ranged from 0.5 to 0.8. As shown in Figure 11a, the PC beams of specimens PCX01 and PCX02 were set vertically, and cyclic loads were applied to the inflection point. A linear slider and a pin-connecting device were attached to the loading point to ensure simple horizontal loading. Peak drift angles of 0.1, 0.2, 0.4, 0.67, 1.0, 2.0, 3.0, 4.0, and 5.0 percent were included by the loading plan, and two cycles were loaded for each peak drift angle. For the subassemblage specimens PCJ05 and PCJ06 shown in Figure 11b, the beam members were supported by a horizontal roller, while the bottom of the columns was supported by a universal joint. The horizontal cyclic load and the constant axial compressive load (axial compression ratio of 0.09) were applied at the top of the columns through a tridirectional joint by three oil jacks. The specimens were loaded for two cycles with peak drift angles of 0.25 and 0.5 percent, and for three cycles with peak drift angles of 1.0, 1.5, 2.0, 3.0 and 4.0 percent, successively.
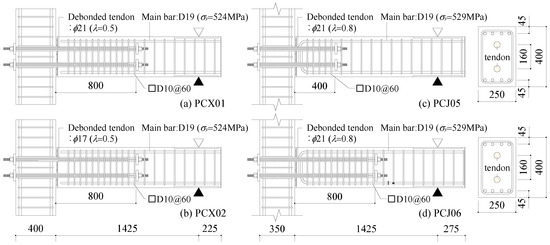
Figure 10.
Specimen details (mm).

Table 1.
Specimen properties.
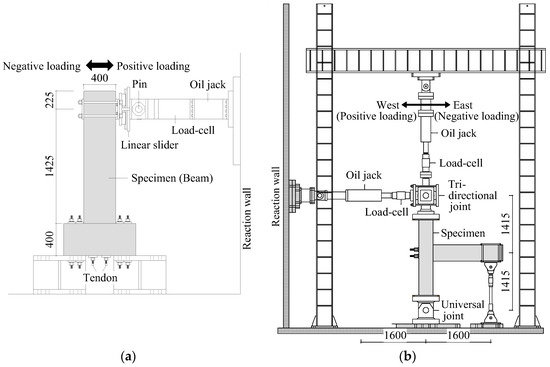
Figure 11.
Test setup: (a) PCX01 and PCX02; (b) PCJ05 and PCJ06 (mm).
For all the specimens, the flexural failure begins from the cover concrete spalling occurring at the beam–column interface, at which the PC connection reaches its maximum strength. The yielding of longitudinal reinforcement did not occur in either the PC or RC zones. Crack maps of the beams in specimens PCJ05 and PCJ06 after the final peak drift angle are presented in Figure 12. The crack positions and the lengths were traced from the photographs taken in the tests. The crack widths were also measured visually with a crack scale.
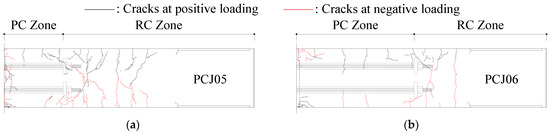
Figure 12.
Crack maps: (a) PCJ05; (b) PCJ06.
Regarding the columns, the subassemblage specimens PCJ05 and PCJ06 are designed according to the strong column–weak beam concept. Thus, almost no crack was observed at the columns and the beam–column joints.
Most of the deformation in PC beams was resulted from the main crack opening at the beam–column interface, but some cracks can also be observed around the boundary between the PC and RC zones. The maximum crack width gradually increased with the increase in peak drift angles. In addition, the cracks increase when the tendon length becomes shorter, as can be seen in PCJ05, because the bending moment at the boundary of RC zone is larger. The maximum crack width at the maximum peak drift angle of 4% was just 0.2 mm, and the maximum residual crack width at the unloaded state was less than 0.06 mm. This suggests that even when the PC connection has experienced considerably large deformation under strong earthquakes, the postearthquake residual cracks could be very slight compared to the monolithic connections, reflecting the low-damage advantage of the PC connections.
Figure 13 shows the beam shear force (Pb)–beam deflection angle (Rb) relationship obtained from the tests. In the figure, the ultimate flexural points, which are the maximum strength points, and the yielding points of the tendons are plotted. From the test results, for PCJ05 with shorter tendon, the maximum strength point and the tendon yielding point occurred at the smaller deflection angle. When the initial prestressing force became lower (PCX01 and PCX02), the maximum strength and yielding of the tendons occurred at the larger deflection angles. Moreover, if the tendon amount was reduced (PCX02), the maximum strength decreased. It can be also seen in Figure 13 that the residual deformation gradually increased after the yielding of tendons, so setting the tendon length is very crucial to guarantee the self-centering behavior, especially for the case of debonded partial tendons.
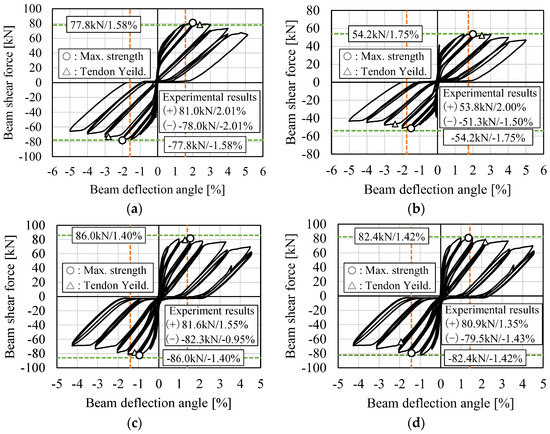
Figure 13.
Load−deflection curves of PC beams and experiment−calculation comparisons: (a) PCX01; (b) PCX02; (c) PCJ05; (d) PCJ06. The dashed lines represents the evaluated values of Pb,u and Rb,u.
4.2. Comparison of Evaluation and Experimental Results
The evaluation accuracy of the iterative procedure is verified by the corresponding test data. The test and evaluation results of the beam shear force (Pb,u), the beam deflection angle (Rb,u), and tendon strains (εt,c and εt,t) were compared in Figure 12 and Figure 13. In the legend of Figure 14, (+) and (–) represent the values at the positive and negative loadings. To measure the tendon strains εt,c and εt,t, strain gauges were attached to the tendons at the beam–column interface. The test data at both the positive and negative loadings are compared with the evaluation results. For the ultimate shear force Pb,u, the evaluation errors of the iterative method are within 10%.
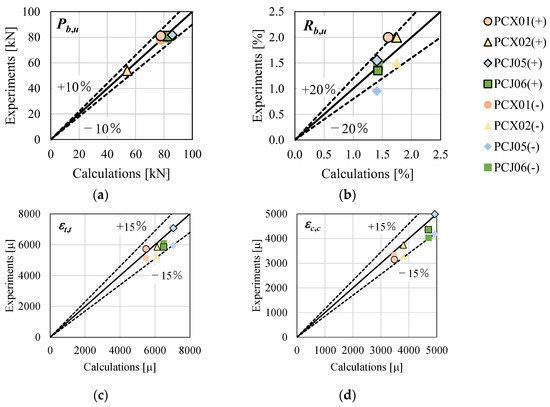
Figure 14.
Comparison of iterative method results and test data: (a) beam shear forces; (b) beam deflection angles; (c) strain of tensile side tendons; (d) strain of compression side tendons.
It is noted that the test results of Pb,u for PCX01, PCJ05, and PCJ06 do not show much difference. The average Pb,u of the positive and negative loadings for the three specimens are 79.5 kN, 82.0 kN, and 80.2 kN, respectively. Although the evaluation results of Pb,u seem to have larger variation than the test results, the evaluation errors relative to the average Pb,u are within 5%. In addition, the test results of Pb,u increase in the order of PCX01, PCJ06, and PCJ05, and the same order could be found in the evaluation results. Therefore, the evaluation results exhibit good agreement with the test results.
The evaluation results of Rb,u are found to be less accurate, and the errors were almost less than 20%. It is noted that the calculated deformation of the PC zone was dominant in all the specimens, and for the specimens PCX01, PCX02 and PCJ06, the deformation of the RC zone was less than 10% of the total beam deformation. Meanwhile, the RC zone deformation increased to 29% for PCJ05, since the bending moment and the length of the RC zone were relatively larger than the other specimens. With respect to the tendon strains εt, the evaluation errors are within 15%. From Figure 12 and Figure 13, the ultimate flexural points determined by the iterative method (intersections of the dashed lines representing the evaluated Pb,u and Rb,u) correspond well with the test results. Therefore, the iterative method has good accuracy, and the analytical model is able to faithfully reflect the seismic behavior of the PC beam–column connection subassemblages with debonded partial tendons.
4.3. Verification of Simplified Method
The beam shear forces (Pb,u) evaluated by the iterative and simplified methods are compared in Figure 15. Without the correction of concrete axial shortening Δ*c,ex introduced in Section 3.4, the errors of the simplified method relative to the iterative one are found to be within 5%. As the beam deflection angle (Rb,u) is calculated directly based on the value of Δc,ex, the values of Δc,ex evaluated by the simplified method with and without the correction are compared in Figure 16a. The corresponding values of Rb,u are compared in Figure 16b. It is clear that the improvement in evaluation accuracy is significant, and the maximum error for Rb,u is reduced from 30% to less than 5%. Correspondingly, change in the errors of Δc,ex before and after the correction has a similar tendency. Therefore, the correction is able to ensure the evaluation accuracy of the simplified method is similar to the iterative method.
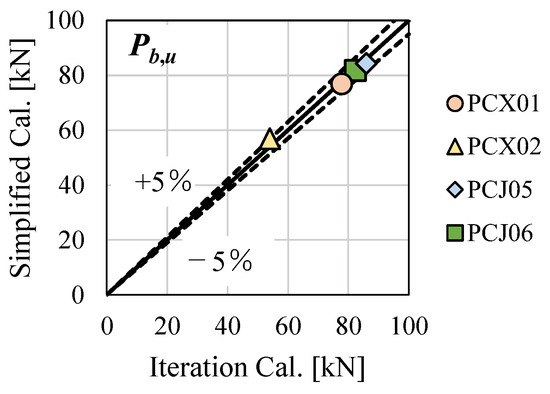
Figure 15.
Evaluation accuracy of Pb,u by simplified method without correction.
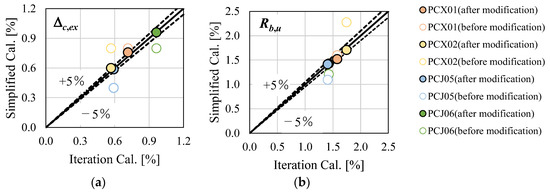
Figure 16.
Evaluation accuracy of Δc,ex and Rb,u by simplified method before and after correction: (a) Dc,ex; (b) Rb,u.
5. Conclusions and Future Work
In this paper, a PC beam–column connection incorporating pretensioned debonded partial tendons is introduced. To more accurately evaluate the performance of this connection at the flexural ultimate limit, an analytical model is adopted to reflect the deformation compatibility and force equilibrium conditions of the PC beam and column members, as well as the unbonded tendon in a precise manner. Based on this, iterative and direct methods for evaluating the ultimate performance of the beam are proposed. The proposed method is verified by cyclic loading test on the beam–column subassemblages. The main conclusions can be summarized as follows.
- The analytical model can more comprehensively and accurately consider the stress–strain distribution of concrete and tendons at each section of the PC beam, and also consider the unequal tensile forces of multiple partial tendons. However, the existing methods cannot evaluate the ultimate deformation of the connection or give the exact tendon strain at the ultimate state. Some other methods can only consider equal axial forces of multiple tendons or cannot be applied in the case of the partial tendons. Therefore, the proposed analytical model and methods are superior to most existing ones.
- The proposed evaluation method can reasonably evaluate the ultimate bending moment at the beam end, the corresponding beam deflection and the tendon strains with good accuracy. The evaluation errors for the ultimate bending moment were within 10%, and for the beam deflection angle the errors were almost less than 20%. With respect to the tendon strains, regardless of the tendon positions, the evaluation errors were within 15%. The good evaluation accuracy indicates the proposed analytical model can reflect the behavior of the PC beam–column connection properly.
- The iterative method using the iterative process is proposed, and then simplified to the direct method, which does not require the iterative calculation process, by means of the approximation of axial concrete shortening at the beam–column interface. The simplified method can give evaluations of similar accuracy as the iterative one by introducing the correction factor, which is therefore more suitable for engineering design.
- The self-centering and low-damage characteristics of the proposed PC connection are confirmed by cyclic loading tests. Through the comprehensive evaluation of the ultimate performance of the connection, the self-centering and low-damage characteristics could be guaranteed in strong earthquake by preventing concrete spalling or tendons yielding, while the bearing and deformation capacity of the connection could be fully utilized.
By applying the analytical model and design method proposed in this paper, the performance at other limit states of the debonded PC connection could be further evaluated, so that the entire deformation–restoring force relationship of the connection could be obtained. On this basis, design parameters such as sectional area, length, and prestressing level of the debonded partial tendons could be optimized. In addition, by using the deformation–restoring force relationship, the semiplastic hinges in the frame structures created by the debonded PC connection are simulated. Based on this, further research could be conducted on seismic performance of the frames. Such a debonded PC frame has self-centering and low-damage characteristics and thus exhibits superior resilience under strong earthquakes. Using dampers to enhance the energy dissipation and control the seismic response will further improve the structural performance. These issues will be considered in following studies.
Author Contributions
Conceptualization, K.J., L.H. and K.K.; Methodology, K.J. and R.O.; Investigation, K.J., L.H. and R.O.; Writing—original draft, K.J. and L.H.; Writing—review & editing, K.J., L.H., R.O. and K.K. All authors have read and agreed to the published version of the manuscript.
Funding
The financial support of the Research Project Grant(B) (Institute of Science and Technology of Meiji University, Principal Investigator Kiwoong Jin) and Science and Technology Program of Guangzhou, China (202102020395) is greatly appreciated.
Institutional Review Board Statement
Not applicable.
Informed Consent Statement
Not applicable.
Data Availability Statement
Not applicable.
Acknowledgments
The authors also thank Ayana Ueno (JR East Design, Former Graduation Student of Meiji University) for participating in the Research.
Conflicts of Interest
The authors declare no conflict of interest.
Appendix A
At the inflection point of the beam, only the shear force acts at the beam section. This is simulated by applying the concentrated force Pb at the beam end of the subassemblage, as shown in Figure 7. In this case, the bending moment at each section of the beam is linearly distributed, which is zero at the inflection point and maximum at the beam–column interface. Because the tendons are debonded, their tensile resultant force (Tt,c + Tt,t) and position dt,t are constant at any section within the PC zone. As such, the distance between the tensile resultant force and the concrete compressive resultant force (Cc) must vary linearly within the PC zone, and consequently distribution of the distance from the ultimate compression fiber to Cc (Ccx) should also be linear.
Considering the bending moment at the beam–column interface and arbitrary beam section in the PC zone, the relationship among Tt,c, Tt,t and Ccx can be expressed as Equation (A1). The distance Ccx thus can be derived as Equation (A2). The neutral axis depth xnx at an arbitrary beam section is given by Equation (A3), and equals three times Ccx, since the concrete compressive strain distributions are triangular.
Since Cc is equal at any beam section within the PC zone, and also the distribution of compressive strain is assumed to be linear, the concrete strain εnx at the extreme compression fiber can be calculated by Equations (A4) and (A5). Furthermore, since the axial shortening of concrete Δc,ex generated at the beam end of the PC zone is resulted from the accumulation of εnx along the PC zone, Δc,ex can be obtained by integrating εnx, as in Equation (A6), and the result is the same as Equation (7).
References
- Park, R. Seismic design and construction of precast concrete buildings in New Zealand. PCI J. 2002, 47, 60–75. [Google Scholar] [CrossRef]
- Priestley, M.J. Overview of PRESSS Research Program. PCI J. 1991, 36, 50–57. [Google Scholar] [CrossRef]
- Yee, A.A. Social and environmental benefits of precast concrete technology. PCI J. 2001, 46, 14–19. [Google Scholar] [CrossRef]
- Shiohara, H.; Watanabe, F. The Japan PRESS precast concrete connection design. In Proceedings of the 12th World Conference of Earthquake Engineering, Aukland, New Zealand, 30 January 2000. [Google Scholar]
- Jaillon, L.; Poon, C.S. Sustainable construction aspects of using prefabrication in dense urban environment: A Hong Kong case study. Constr. Manag. Econ. 2008, 26, 953–966. [Google Scholar] [CrossRef]
- Bull, D.K.; Park, R. Seismic resistance of frames incorporating precast prestressed concrete beam shells. PCI J. 1986, 31, 54–93. [Google Scholar] [CrossRef]
- Alcocer, S.M.; Carranza, R.; Perez-Navarrete, D.; Martinez, R. Seismic tests of beam-to-column connections in a precast concrete frame. PCI J. 2002, 47, 70–89. [Google Scholar] [CrossRef]
- Parastesh, H.; Hajirasouliha, I.; Ramezani, R. A new ductile moment-resisting connection for precast concrete frames in seismic regions: An experimental investigation. Eng. Struct. 2014, 70, 144–157. [Google Scholar] [CrossRef]
- Guan, D.; Guo, Z.; Xiao, Q.; Zheng, Y. Experimental study of a new beam-to-column connection for precast concrete frames under reversal cyclic loading. Adv. Struct. Eng. 2016, 19, 529–545. [Google Scholar] [CrossRef]
- French, C.W.; Hafner, M.; Jayashankar, V. Connections between precast elements failure within connection region. J. Struct. Eng. 1989, 115, 3171–3192. [Google Scholar] [CrossRef]
- Nakaki, S.D.; Englekirk, R.E.; Plaehn, J.L. Ductile connectors for a precast concrete frame. PCI J. 1994, 39, 46–59. [Google Scholar] [CrossRef]
- Nzabonimpa, J.D.; Hong, W.-K.; Kim, J. Nonlinear finite element model for the novel mechanical beam-column joints of precast concrete-based frames. Comput. Struct. 2017, 189, 31–48. [Google Scholar] [CrossRef]
- Li, S.; Li, Q.; Zhang, H.; Jiang, H.; Yan, L.; Jiang, W. Experimental study of a fabricated confined concrete beam-to-column connection with end-plates. Constr. Build. Mater. 2018, 158, 208–216. [Google Scholar]
- Choi, H.K.; Choi, Y.C.; Choi, C.S. Development and testing of precast concrete beam-to-column connections. Eng. Struct. 2013, 56, 1820–1835. [Google Scholar] [CrossRef]
- Ghayeb, H.H.; Razak, H.A.; Sulong, N.H. Development and testing of hybrid precast concrete beam-to-column connections under cyclic loading. Constr. Build. Mater. 2017, 151, 258–278. [Google Scholar] [CrossRef]
- Cheok, G.S.; Lew, H.S. Performance of precast concrete beam-to-column connections subject to cyclic loading. PCI J. 1991, 36, 56–67. [Google Scholar] [CrossRef]
- Priestley, M.N.; Tao, J. Seismic response of precast prestressed concrete frames with partially debonded tendons. PCI J. 1993, 38, 58–69. [Google Scholar] [CrossRef]
- Priestley, M.N.; MacRae, G.A. Seismic tests of precast beam-to-column joint subassemblages with unbonded tendons. PCI J. 1996, 41, 64–81. [Google Scholar] [CrossRef]
- Cheok, G.S. A hybrid reinforced precast frame for seismic regions. PCI J. 1997, 42, 20–32. [Google Scholar]
- Wang, H.; Marino, E.M.; Pan, P.; Liu, H.; Nie, X.J. Experimental study of a novel precast prestressed reinforced concrete beam-to-column joint. Eng. Struct. 2018, 156, 68–81. [Google Scholar] [CrossRef]
- Jin, K.; Song, S.; Kitayama, K.; Hao, L. Detailed evaluation of the ultimate flexural states of beams in unbonded precast prestressed concrete frames. Bull. Earthq. Eng. 2019, 17, 1495–1519. [Google Scholar] [CrossRef]
- Jin, K.; Hao, L.; Kitayama, K. Direct evaluation method for load-deformation curve of precast prestressed concrete frame with different tendon forces. Bull. Earthq. Eng. 2021, 19, 3597–3626. [Google Scholar] [CrossRef]
- Priestley, M.J.; Sritharan, S.; Conley, J.R.; Pampanin, S. Preliminary results and conclusions from the PRESSS five-story precast concrete test building. PCI J. 1999, 44, 42–67. [Google Scholar] [CrossRef]
- Lu, X.; Cui, Y.; Liu, J.; Gao, W. Shaking table test and numerical simulation of a 1/2-scale self-centering reinforced concrete frame. Earthq. Eng. Struct. Dyn. 2015, 44, 1899–1917. [Google Scholar] [CrossRef]
- Rahman, M.A.; Sritharan, S. Performance-based seismic evaluation of two five-story precast concrete hybrid frame buildings. J. Struct. Eng. 2007, 133, 1489–1500. [Google Scholar] [CrossRef]
- Morgen, B.G.; Kurama, Y.C. Seismic response evaluation of posttensioned precast concrete frames with friction dampers. J. Struct. Eng. 2008, 134, 132–145. [Google Scholar] [CrossRef]
- Wang, H.; Marino, E.M.; Pan, P. Design, testing and finite element analysis of an improved precast prestressed beam-to-column joint. Eng. Struct. 2019, 199, 109661. [Google Scholar] [CrossRef]
- Song, S.; Kurimoto, K.; Jin, K.; Kitayama, K.; Kanemoto, K.; Tajima, Y. Seismic performance of unbonded precast prestressed reinforced concrete frame with different lengths of tendon. In Summaries of Technical Papers of Annual Meeting; Architectural Institute of Japan (AIJ): Kobe, Japan, 2014. [Google Scholar]
- Kurama, Y.C. Hybrid post-tensioned precast concrete walls for use in seismic regions. PCI J. 2002, 47, 36–59. [Google Scholar] [CrossRef]
- Holden, T.; Restrepo, J.; Mander, J.B. Seismic performance of precast reinforced and prestressed concrete walls. J. Struct. Eng. ASCE 2003, 129, 286–296. [Google Scholar] [CrossRef]
- Smith, B.J.; Kurama, Y.C.; McGinnis, M.J. Design and Measured Behavior of a Hybrid Precast Concrete Wall Specimen for Seismic Regions. J. Struct. Eng. ASCE 2011, 137, 1052–1062. [Google Scholar] [CrossRef]
- Sritharan, S.; Aaleti, S.; Henry, R.S.; Liu, K.-Y.; Tsai, K.-C. Precast concrete wall with end columns (PreWEC) for earthquake resistant design. Earthq. Eng. Struct. Dyn. 2015, 44, 2075–2092. [Google Scholar] [CrossRef]
- Gavridou, S.; Wallace, J.W.; Nagae, T.; Matsumori, T.; Tahara, K.; Fukuyama, K. Shake-Table Test of a Full-Scale 4-Story Precast Concrete Building. I: Overview and Experimental Results. J. Struct. Eng. 2017, 143, 04017034. [Google Scholar] [CrossRef]
- Twigden, K.; Henry, R.J.; Engineering, E. Shake table testing of unbonded post-tensioned concrete walls with and without additional energy dissipation. Soil Dyn. Earthq. Eng. 2019, 119, 375–389. [Google Scholar] [CrossRef]
- Kurama, Y.C.; Weldon, B.D.; Shen, Q.J. Experimental evaluation of posttensioned hybrid coupled wall subassemblages. J. Struct. Eng. 2006, 132, 1017–1029. [Google Scholar] [CrossRef]
- Weldon, B.D.; Kurama, Y.C. Experimental evaluation of posttensioned precast concrete coupling beams. J. Struct. Eng. 2010, 136, 1066–1077. [Google Scholar] [CrossRef]
- Midorikawa, M.; Azuhata, T.; Ishihara, T.; Wada, A.J.; Dynamics, S. Shaking table tests on seismic response of steel braced frames with column uplift. Earthq. Eng. Struct. Dyn. 2006, 35, 1767–1785. [Google Scholar] [CrossRef]
- Sause, R.; Ricles, J.; Roke, D.; Chancellor, N.; Gonner, N. Seismic performance of a self-centering rocking concentrically-braced frame. In Proceedings of the 9th US National and 10th Canadian Conference on Earthquake Engineering, Toronto, ON, Canada, 25 July 2010. [Google Scholar]
- Eatherton, M.R.; Ma, X.; Krawinkler, H.; Deierlein, G.G.; Hajjar, J.F. Quasi-Static Cyclic Behavior of Controlled Rocking Steel Frames. J. Struct. Eng. 2014, 140, 04014083. [Google Scholar] [CrossRef]
- Eatherton, M.R.; Hajjar, J.F. Hybrid simulation testing of a self-centering rocking steel braced frame system. Earthq. Eng. Struct. Dyn. 2014, 43, 1725–1742. [Google Scholar] [CrossRef]
- Christopoulos, C.; Filiatrault, A.; Uang, C.M.; Folz, B. Posttensioned energy dissipating connections for moment-resisting steel frames. J. Struct. Eng. ASCE 2002, 128, 1111–1120. [Google Scholar] [CrossRef]
- Garlock, M.M.; Ricles, J.M.; Sause, R.J. Experimental studies of full-scale posttensioned steel connections. J. Struct. Eng. 2005, 131, 438–448. [Google Scholar] [CrossRef]
- Kim, H.-J.; Christopoulos, C.J. Friction damped posttensioned self-centering steel moment-resisting frames. J. Struct. Eng. 2008, 134, 1768–1779. [Google Scholar] [CrossRef]
- Vasdravellis, G.; Karavasilis, T.L.; Uy, B. Finite element models and cyclic behavior of self-centering steel post-tensioned connections with web hourglass pins. Eng. Struct. 2013, 52, 1–16. [Google Scholar] [CrossRef]
- Ho, T.X.; Dao, T.N.; Aaleti, S.; van de Lindt, J.W.; Rammer, D.R. Hybrid system of unbonded post-tensioned CLT panels and light-frame wood shear walls. J. Struct. Eng. 2017, 143, 04016171. [Google Scholar] [CrossRef]
- Ganey, R.; Berman, J.; Akbas, T.; Loftus, S.; Dolan, J.D.; Sause, R.; Ricles, J.; Pei, S.; van de Lindt, J.; Blomgren, H.-E. Experimental Investigation of Self-Centering Cross-Laminated Timber Walls. J. Struct. Eng. 2017, 143, 04017135. [Google Scholar] [CrossRef]
- Iqbal, A.; Pampanin, S.; Palermo, A.; Buchanan, A.H. Performance and Design of LVL Walls Coupled with UFP Dissipaters. J. Earthq. Eng. 2015, 19, 383–409. [Google Scholar] [CrossRef]
- Iqbal, A.; Smith, T.; Pampanin, S.; Fragiacomo, M.; Palermo, A.; Buchanan, A.J. Experimental performance and structural analysis of plywood-coupled LVL walls. J. Struct. Eng. 2016, 142, 04015123. [Google Scholar] [CrossRef]
- Rosenboom, O.A.; Kowalsky, M.J. Reversed in-plane cyclic behavior of posttensioned clay brick masonry walls. J. Struct. Eng. 2004, 130, 787–798. [Google Scholar] [CrossRef]
- Hassanli, R.; ElGawady, M.A.; Mills, J.E. Experimental investigation of in-plane cyclic response of unbonded posttensioned masonry walls. J. Struct. Eng. 2016, 142, 04015171. [Google Scholar] [CrossRef]
- Ban, S.; Muguruma, H. Ultimate strength of post-tensioned unbonded beams, part 1: Study on bending behaviors of post-tensioned unbonded beams. Trans. Archit. Inst. Jpn. 1956, 60, 641–644. [Google Scholar]
- Morgen, B.G.; Kurama, Y.C. Seismic design of friction-damped precast concrete frame structures. J. Struct. Eng. -ASCE 2007, 133, 1501–1511. [Google Scholar] [CrossRef]
- Koshikawa, T. Moment and energy dissipation capacities of post-tensioned precast concrete connections employing a friction device. Eng. Struct. 2017, 138, 170–180. [Google Scholar] [CrossRef]
- Matsumora, M.; Koshikawa, T.; Kikuchi, M. Evaluation of ultimate strength and rotation angle for unbonded post-tensioned precast concrete beams by using section analysis. J. Struct. Constr. Eng. 2014, 79, 1005–1013. [Google Scholar] [CrossRef]
- El-Sheikh, M.T.; Sause, R.; Pessiki, S.; Lu, L.W. Seismic behavior and design of unbonded post-tensioned precast concrete frames. PCI J. 1999, 44, 54–71. [Google Scholar] [CrossRef]
- Tsuda, K. A study on the calculation method for flexural behavior of unbonded pre-stressed concrete beam. Struct. Const. Eng. 2015, 710, 659–668. [Google Scholar] [CrossRef]
- Stanton, J.F.; Nakaki, S.D. Design Guidelines for Precast Concrete Seismic Structural Systems; Department of Civil Engineering, University of Washington: Seattle, WA, USA, 2002. [Google Scholar]
- Hawileh, R.; Tabatabai, H.; Rahman, A.; Amro, A. Non-dimensional design procedures for precast, prestressed concrete hybrid frames. PCI J. 2006, 51, 110. [Google Scholar] [CrossRef]
- Nakaki, S.D.; Stanton, J.F.; Sritharan, S. An Overview of the PRESSS Five-Story Precast Test Building. PCI J. 1999, 44, 26–39. [Google Scholar] [CrossRef]
- Jin, K.; Ueno, A.; Baba, R.; Kitayama, K. Seismic performance of precast prestressed reinforced concrete frame with partial unbonded tendon. Proc. Jpn. Concr. Inst. 2020, 42, 397–402. [Google Scholar]
- Guidelines for Structural Design and Construction of Prestressed Concrete Buildings Based on Performance Evaluation Concept (Draft); Architectural Institute of Japan (AIJ): Tokyo, Japan, 2015.
- AIJ Standard for Structural Calculation of Reinforced Concrete Structures; Architectural Institute of Japan (AIJ): Tokyo, Japan, 2018.
- Sugano, S. Study on hysteretic characteristics of reinforced concrete members. Concr. J. 1973, 11, 1–9. [Google Scholar]


Disclaimer/Publisher’s Note: The statements, opinions and data contained in all publications are solely those of the individual author(s) and contributor(s) and not of MDPI and/or the editor(s). MDPI and/or the editor(s) disclaim responsibility for any injury to people or property resulting from any ideas, methods, instructions or products referred to in the content. |
© 2023 by the authors. Licensee MDPI, Basel, Switzerland. This article is an open access article distributed under the terms and conditions of the Creative Commons Attribution (CC BY) license (https://creativecommons.org/licenses/by/4.0/).