Article

Seismic Performance of Ductile Column with Rectangular Hollow Cross-Section in RC Building

Department of Architecture, School of Science and Technology, Meiji University, Kawasaki-shi 214-8517, Kanagawa, Japan
*
Author to whom correspondence should be addressed.
Appl. Sci. 2023, 13(4), 2234; https://doi.org/10.3390/app13042234
Submission received: 10 January 2023 / Revised: 7 February 2023 / Accepted: 7 February 2023 / Published: 9 February 2023
(This article belongs to the Special Issue Advances in Seismic Performance Assessment)

Abstract

:
In order to reduce the self-weight of RC buildings and increase cost-savings, the seismic performance of rectangular hollow sectioned columns was investigated by experimental and analytical studies. Cyclic loading tests were carried out under compression axial force ratios from 0.16 to 0.3, and hysteresis curves, failure patterns, strain distributions of reinforcement, flexural and shear deformations, and energy absorption capacity were discussed in detail. Based on the experiments, under an axial force ratio of 0.16, the structural performances between hollow and solid sectioned columns were found to be almost equivalent. When the axial force ratio increased to 0.3, the structural performance was almost the same until the 2.0% drift angle; however, sudden deterioration of the load-bearing capacity occurred, with concrete compressive failure at the plastic hinge region near the column end. By means of numerical investigations by cross-sectional and FEM analysis, it was found that such brittle failure was induced by the neutral axis location and the concrete stress concentration on the hollow cross-section. Therefore, the appropriate separation of the hollow section from the plastic hinge region is recommended when the neutral axis is located beyond the flange at the ultimate flexural state.

1. Introduction

Reinforcement concrete (RC) buildings tend to have high self-weight due to their member size and material characteristics. Thus, sometimes, the seismic force acting on the building might become greater than other structural systems. Since the self-weight of a building greatly relates to its seismic force, a reduction in self-weight will contribute to a reduction in the seismic force, especially in RC buildings. Hollow cross-sections are one of the promising methods for self-weight reduction. At the same time, they allow for cost-saving and an environmentally sustainable society.
Many bridge structures have RC hollow piers, since larger flexural stiffness and strength can be obtained compared to solid piers with the same materials and mass. Accordingly, there are some previous studies which focused on the structural performance of hollow bridge piers [1,2,3,4,5,6,7,8,9,10,11,12,13,14,15,16,17,18,19,20]. Chung et al. [1] carried out quasistatic tests to investigate the seismic performance of circular hollow bridge piers under the experimental parameters of confinement steel ratios, axial forces, and retrofitting effects by glass fibers. Lee et al. [2] conducted cyclic loading tests under axial force ratios from 0.065 to 0.15, and the relationship between axial compressive force and deformation capacity was studied. Osada et al. [3] focused on the seismic strengthening of hollow circular piers with reinforced cut-off planes and variable wall thickness. Ranzo et al. [4] conducted cyclic loading tests with large-scaled specimens, and the shear strength degradation model and the failure mode of circular hollow columns were investigated. Previous studies [5,6,7] have also focused on the seismic capacity of circular hollow columns, and their load-bearing capacity and ductility were discussed. However, the cross-section shapes, in the previous studies mentioned above, were circular, and those columns were mainly for the use of bridge structures. Besides, more detailed discussions on the differences between solid and hollow cross-sections seem to be required, and most studies consider somewhat small axial force ratios. Won et al. [8] carried out an experimental study with circular hollow RC columns; however, they focused on the structural performance under a uniaxial compressive load. Liang et al. [9] also investigated the confinement effect of circular hollow concrete columns subjected to concentric axial compressive loading by analytical study.
The structural characteristics and seismic capacity of the rectangular hollow cross-section have been much less investigated than those of circular ones. For RC rectangular cross-sections, Calvi et al. [10] employed hollow bridge pier specimens with different axial force ratios, and the load-deflection curve was investigated by experimental and numerical studies. Han et al. [11] carried out cyclic bilateral loading tests with hollow cross-sectioned specimens and reported high ductility and a viscous damping ratio even under the bilateral loadings. Previous studies [12,13] have also focused on rectangular hollow cross-sections, and the seismic capacity of old bridge columns was investigated. Shen et al. [14,15] conducted dynamic shaking table tests, and the seismic performance was investigated under axial force ratios of 0.05 and 0.1. Mo et al. [16] and Yeh et al. [17,18] studied the evaluation method of the load-displacement relationship for rectangular cross-sections, through experimental and analytical studies. Kim et al. [19] carried out an analytical study on the structural performance of internally confined hollow RC columns with a polygonal cross-section. Martínez-Martín et al. [20] studied the optimization design method of RC-elevated water tanks under seismic loads, where the column had a rectangular hollow cross-section. Nevertheless, in most cases, detailed comparisons of solid and hollow cross-sections have seemed to be somewhat insufficient, and relatively small axial force ratios, less than 0.2, were adopted. Moreover, the previous studies mentioned above mainly focus on bridge piers, high-speed railways, wind towers, etc.; therefore, the cross-section details, such as the arrangement and regulations of the reinforcement, the cross-tie, and the size, would be quite different from the RC columns of building structures.
Focusing on RC buildings, conventionally, the reduction of self-weight has been achieved by increasing the material strength and reducing the cross-sectional area of members [21]. In the case of secondary members, the self-weight reduction has been achieved by providing slabs with void space and using autoclaved lightweight aerated concrete for non-structural walls [22,23]. However, few attempts have been made towards self-weight reduction for major structural components such as columns and beams for RC buildings. Therefore, in this study, to better understand the structural performance of RC columns with rectangular hollow sections in building structures, cyclic loading tests were conducted under compression axial force ratios from 0.16 to 0.3. Based on the experimental data and relevant analysis, the hysteresis curves and failure processes of solid and hollow sectioned columns were compared, and flexural behaviors, shear behaviors, and deformation capacity were investigated in detail. The application scope of hollow RC columns with rectangular cross-sections, to building structures, was also discussed, based on the relationship between the axial compression load and neutral axis positions at the ultimate flexural state.

2. Experimental Program

To investigate the structural performance of RC columns with rectangular hollow cross-sections, cyclic loading tests were carried out. Five specimens were designed based on three key parameters. Three key parameters are the axial force ratio, the hollow section ratio (r: cross-sectional area excluding hollow section/full cross-sectional area), and the tip position of the taper (see Figure 1b). The specimen details are explained below.

2.1. Specimen Details

Figure 1 shows the specimen details, and Table 1 summarizes the specimen properties. Material characteristics are listed in Table 2 and Table 3. The specimens are about 1/3 scale, assuming columns at the lower level of a high-rise residential building (about 20-story). Per the AIJ standard [24], more than 4 longitudinal bars should be placed in RC columns, and the reinforcement ratio should be more than 0.8%. For the transverse reinforcement, the reinforcement ratio should be larger than 0.2%, and its spacing should be less than 100 mm, within the range from column ends to 1.5D, where D is the cross-section height of the column. 135 or 180 degree hooks are also required for transverse reinforcement.
The specimens were scaled down and designed according to the AIJ standard. The hollow parts consist of square and taper sections, as can be seen in Figure 1, to reduce the stress concentration. The hollow section ratio (r) of the specimen was set around 0.8, as shown in Table 1. For the N-series with the axial force ratio of 0.16, two specimens were fabricated, which are a solid-sectioned specimen (CM1) and a hollow-sectioned specimen (CM2). In the S-series with the axial force ratio around 0.3, three specimens were fabricated: one solid-sectioned specimen (CM11) and two hollow-sectioned specimens (CM12 and CM13). The difference between the two hollow-sectioned specimens was the tip position of taper sections. In CM12, the tip position started from both column ends. However, in CM13, the tip position was planned at 0.75D away from both column ends. As explained later, CM13 was planned after the experiment of CM12, because of an unexpected failure, a concrete compressive failure, had developed in the plastic hinge region near the column end of CM12. The higher strength concrete was used for hollow-sectioned specimens so that the axial force ratios of solid and hollow-sectioned specimens became almost the same. The concrete mix proportion is shown in Table 4, where the water–cement ratio of solid-sectioned specimens was 36% and that of hollow-sectioned specimens was 28%. The concrete mix proportion, generally employed for high-rise building construction in Japan, was used. Although the hollow section reduces the moment of inertia and thus the flexural stiffness, higher strength concrete usually has a higher Young’s modulus. As a result, hollow-sectioned specimens have an equivalent flexural stiffness to solid-sectioned specimens.
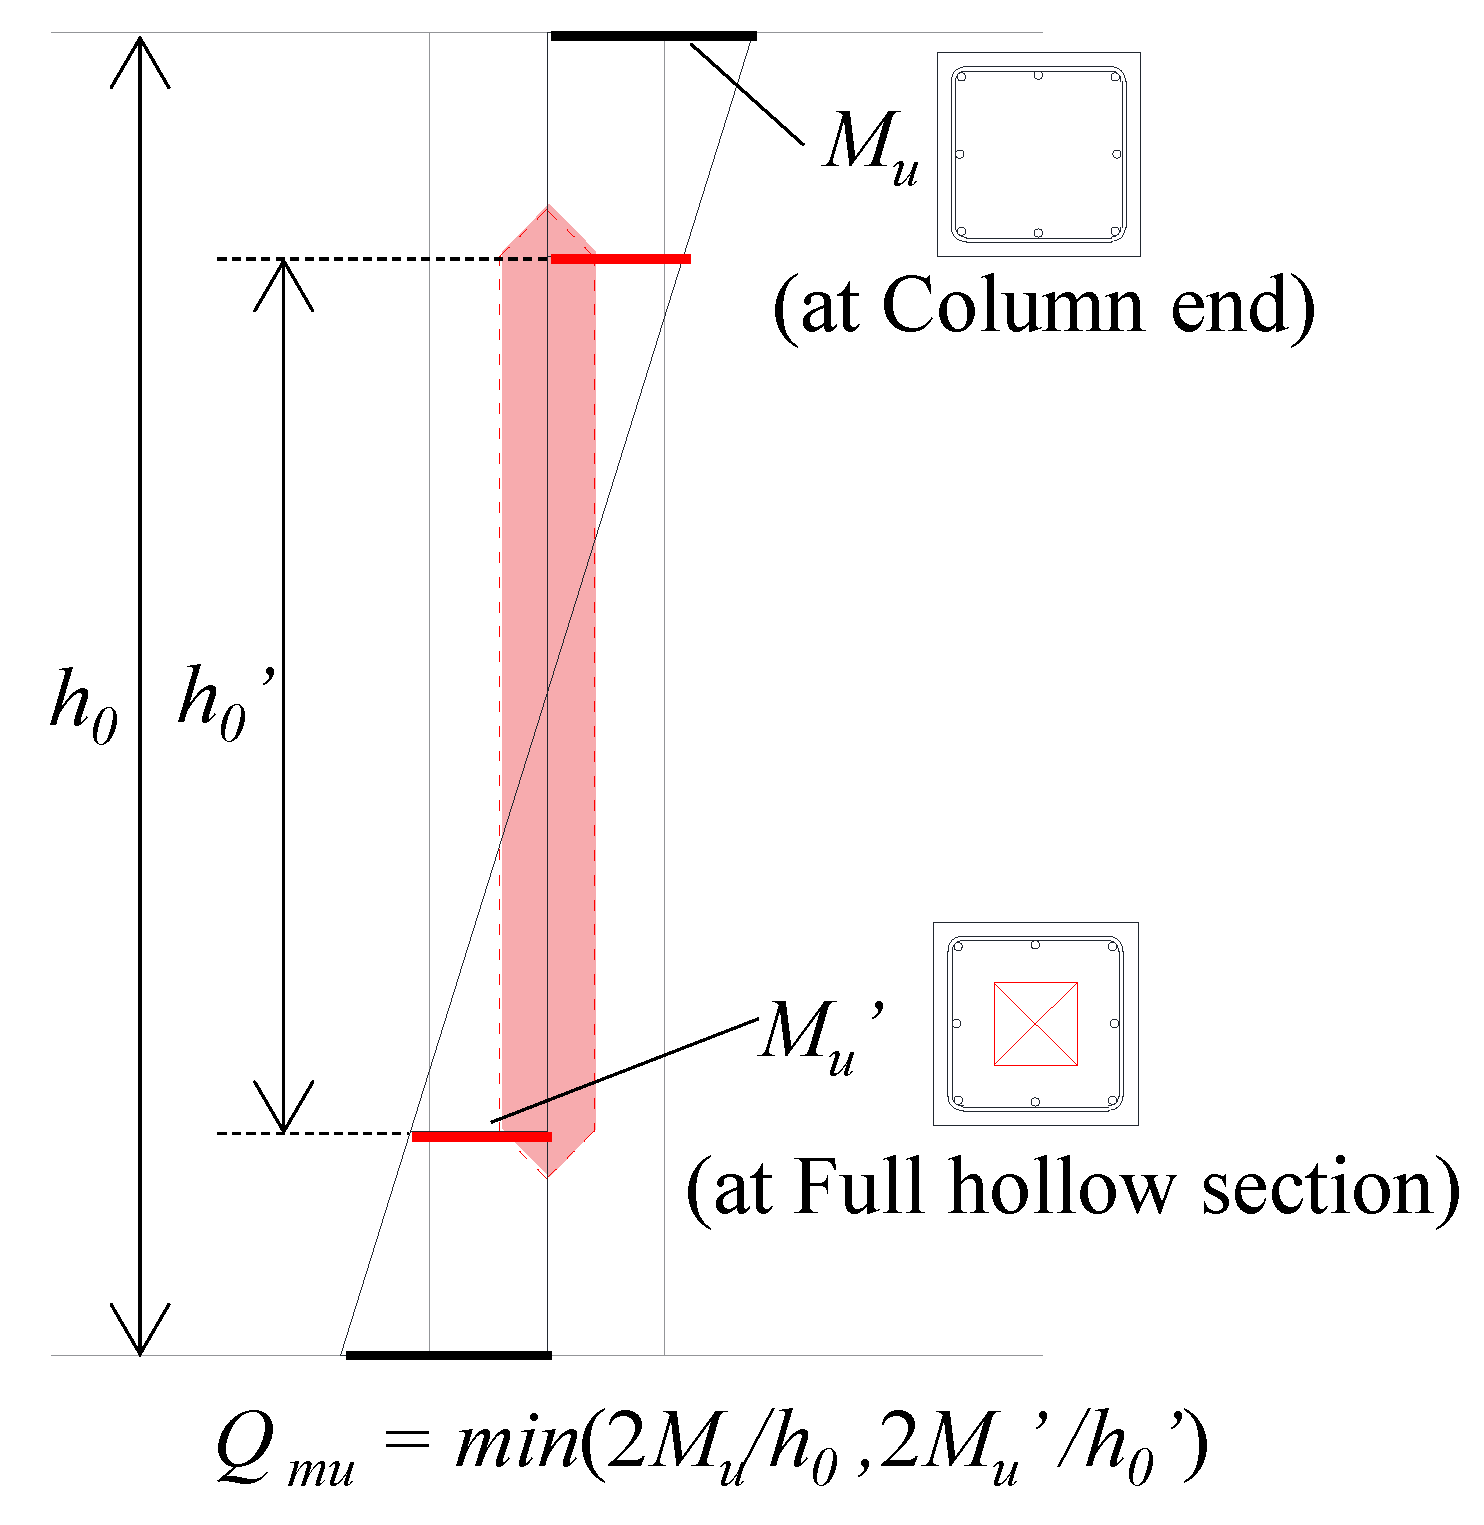
Calculation results of the ultimate flexural strength (Qmu) and the shear strength (Qsu,mean) are listed in Table 5. As illustrated in Figure 2, to estimate Qmu, ultimate flexural moment capacity at the positions of column ends (Mu) and at full hollow sections (Mu) were first calculated, based on the cross-sectional analysis with plane-section assumption. Herein, the ultimate strain εcu at the concrete compression fiber was set to 0.003, with an equivalent rectangular stress block coefficient [24]. The stress–strain relationship by Popovics [25] was employed for the concrete, and a bi-linear model was applied for the steel. The smaller value of Qmu, which is either 2Mu/h0 or 2Mu/h0′, was adopted, in which h0 and h0′ represent the clear height and the height between both full hollow sections, respectively, as can be seen in Figure 2. In all specimens, Qmu was determined by 2Mu/h0. Qsu,mean was calculated based on Equation (1) by Arakawa [24], which is generally used for shear capacity estimation in Japan. It should also be noted that the column cross-section width excluding the hollow cross-section width (b’) was employed for the calculation of Qsu,mean to consider the effect of the hollow cross-section.
Q s u , m e a n = { 0 . 115 k u k p ( 18 + F c ) M / Q d + 0.12 + 0.85 p w σ w y + 0 . 10 σ 0 }  
where ku is the correction coefficient based on effective column cross-section height (0.75 for N-series specimens and 0.85 for S-series specimens), kp is 0.82pt0.23, pt is the longitudinal tensile reinforcement ratio (%), Fc is the compressive strength of concrete (MPa), pw is the transverse reinforcement ratio, σwy is the yield strength of transverse reinforcement (MPa), σ0 is the axial stress (MPa), N is the axial force, b is the column cross-section width, D is the column cross-section height, M/Q is the shear span ratio, j is the moment arm length from compressive to tensile resultant forces calculated by 7/8d, and d is the effective column cross-section height. In Equation (1), the value of M/Q should be between 1 and 3; namely, when M/Q < 1, M/Q = 1, and when M/Q > 3, M/Q = 3.
It should be also noted that, as mentioned earlier, b’ was used instead of b for hollow-sectioned specimens, to consider conservative calculations of the shear capacity. From the calculation results of Qsu/Qmu in Table 5, all specimens were designed to have flexural failure mode and expected to have ductile behaviors.

2.2. Loading Program and Instrumentation

The loading system is drawn schematically in Figure 3. The lateral actuator was set at the middle height of the specimen, and a pantograph was placed at the top of the specimen. A constant axial force was introduced into the column using two vertical actuators at symmetrical positions. The lateral load was applied as a displacement control with lateral drift angles R of ±0.25%, ±0.5%, ±1.0%, ±1.5%, ±2.0%, ±3.0%, and ±4.0%, where 2 cycles for each peak drift were imposed. Then, a pushover loading for R of +5.0% was planned. Herein, the drift angel R was defined as “lateral deformation/column clear height”.
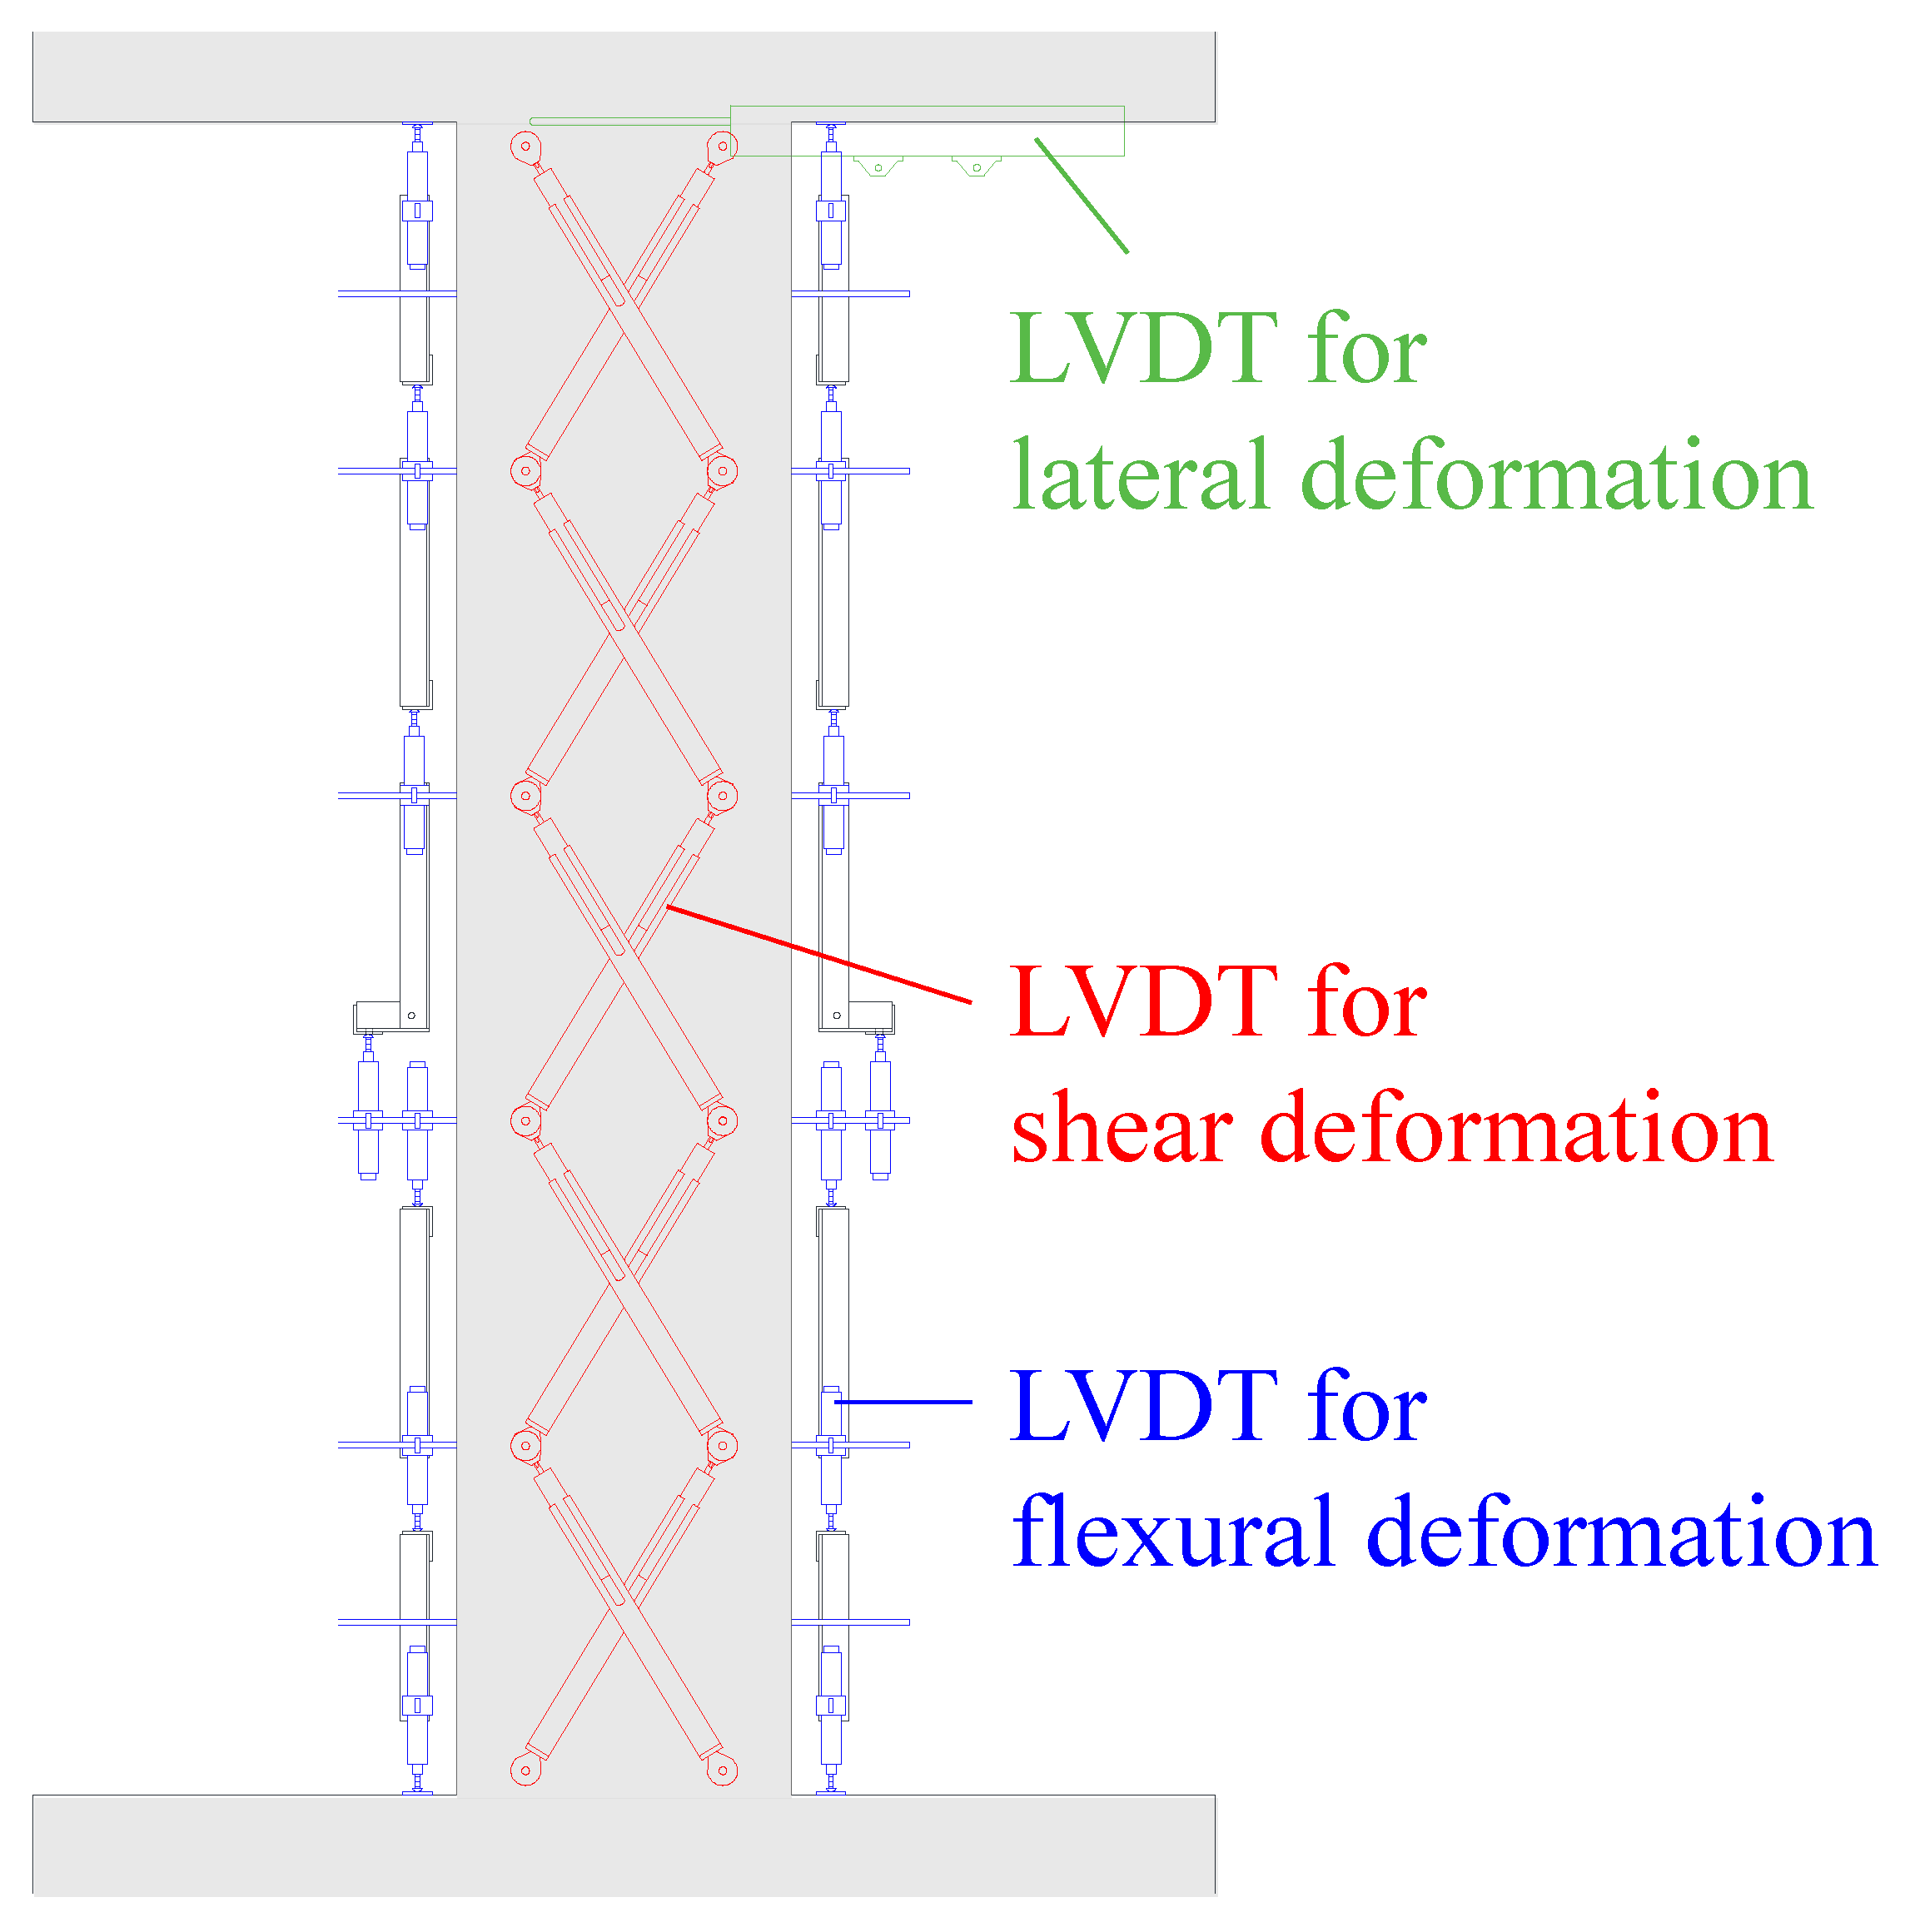
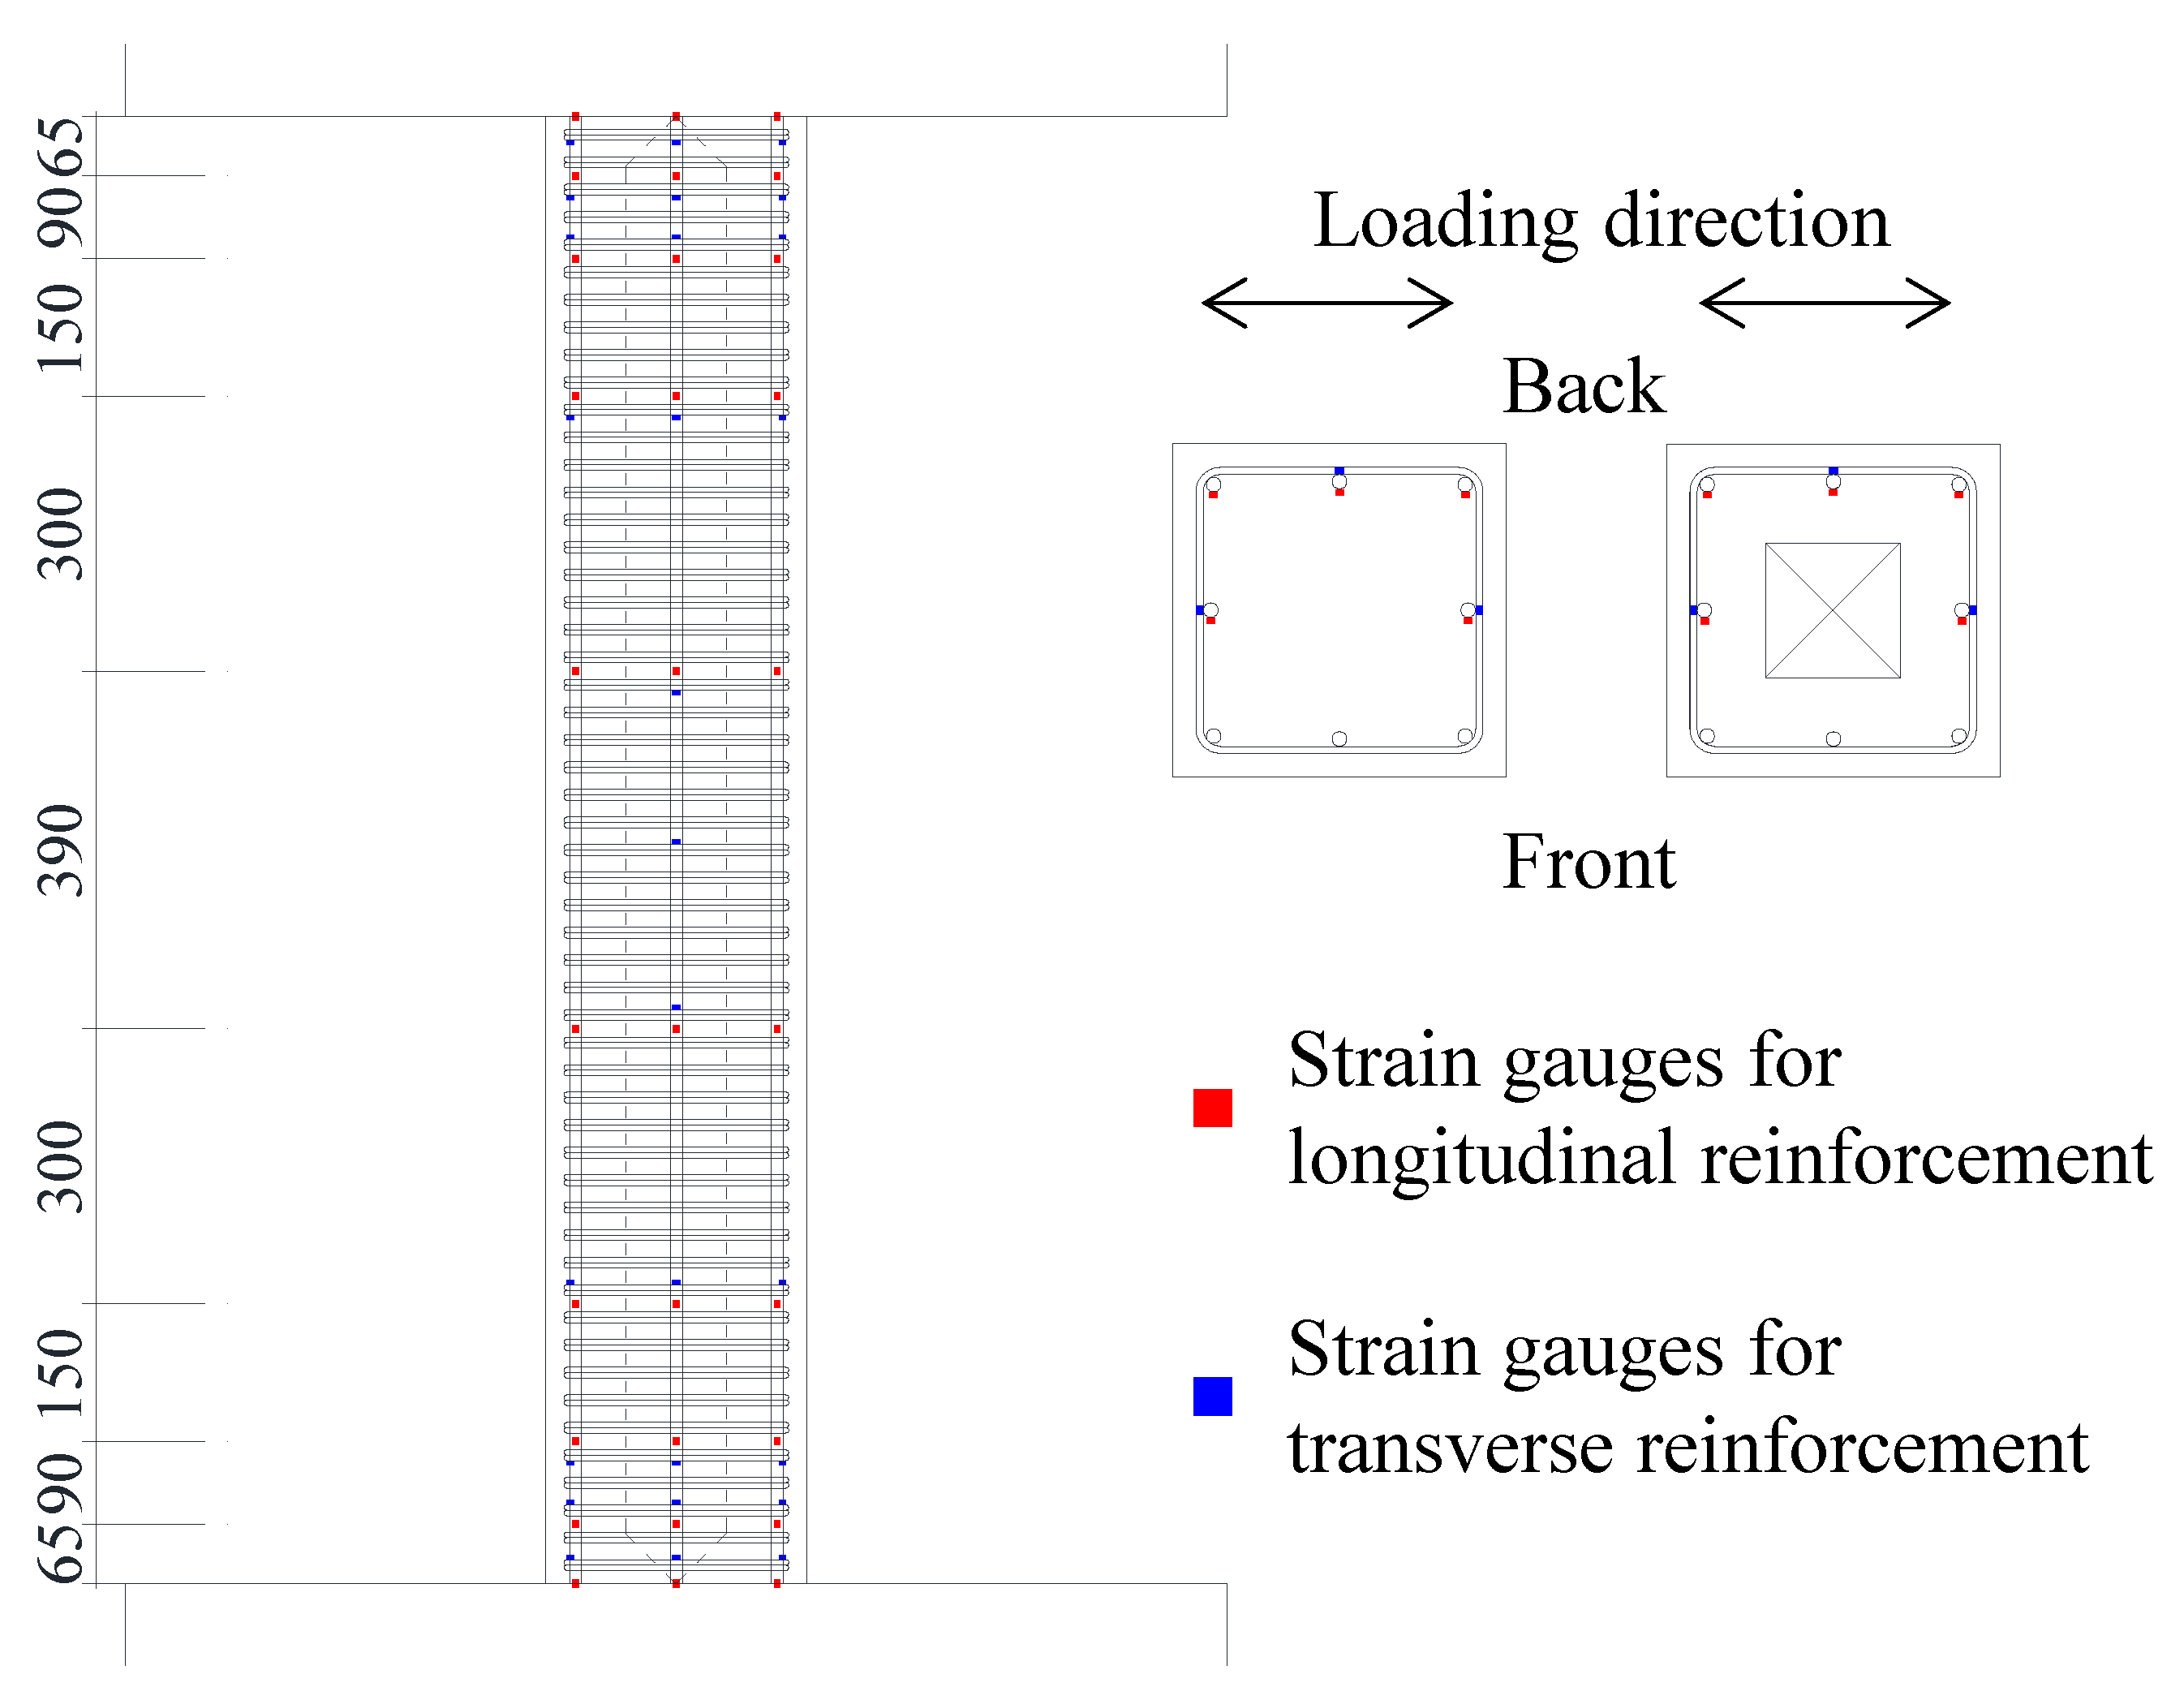
As shown in Figure 4, during the loading test, flexural and shear deformations were measured by displacement transducers (LVDTs), respectively, at each column section. The strains of longitudinal and transverse reinforcement were also measured by strain gages. Especially, for the detailed investigation of the effect by the hollow cross-section on the reinforcement, as well as to understand the differences between solid and hollow cross-sections, a large number of strain gauges were attached to the reinforcement, as shown in Figure 5. Flexural and shear deformations, as well as strain distributions on the longitudinal and transverse reinforcement, will be discussed in Section 4.

3. Experiment Results

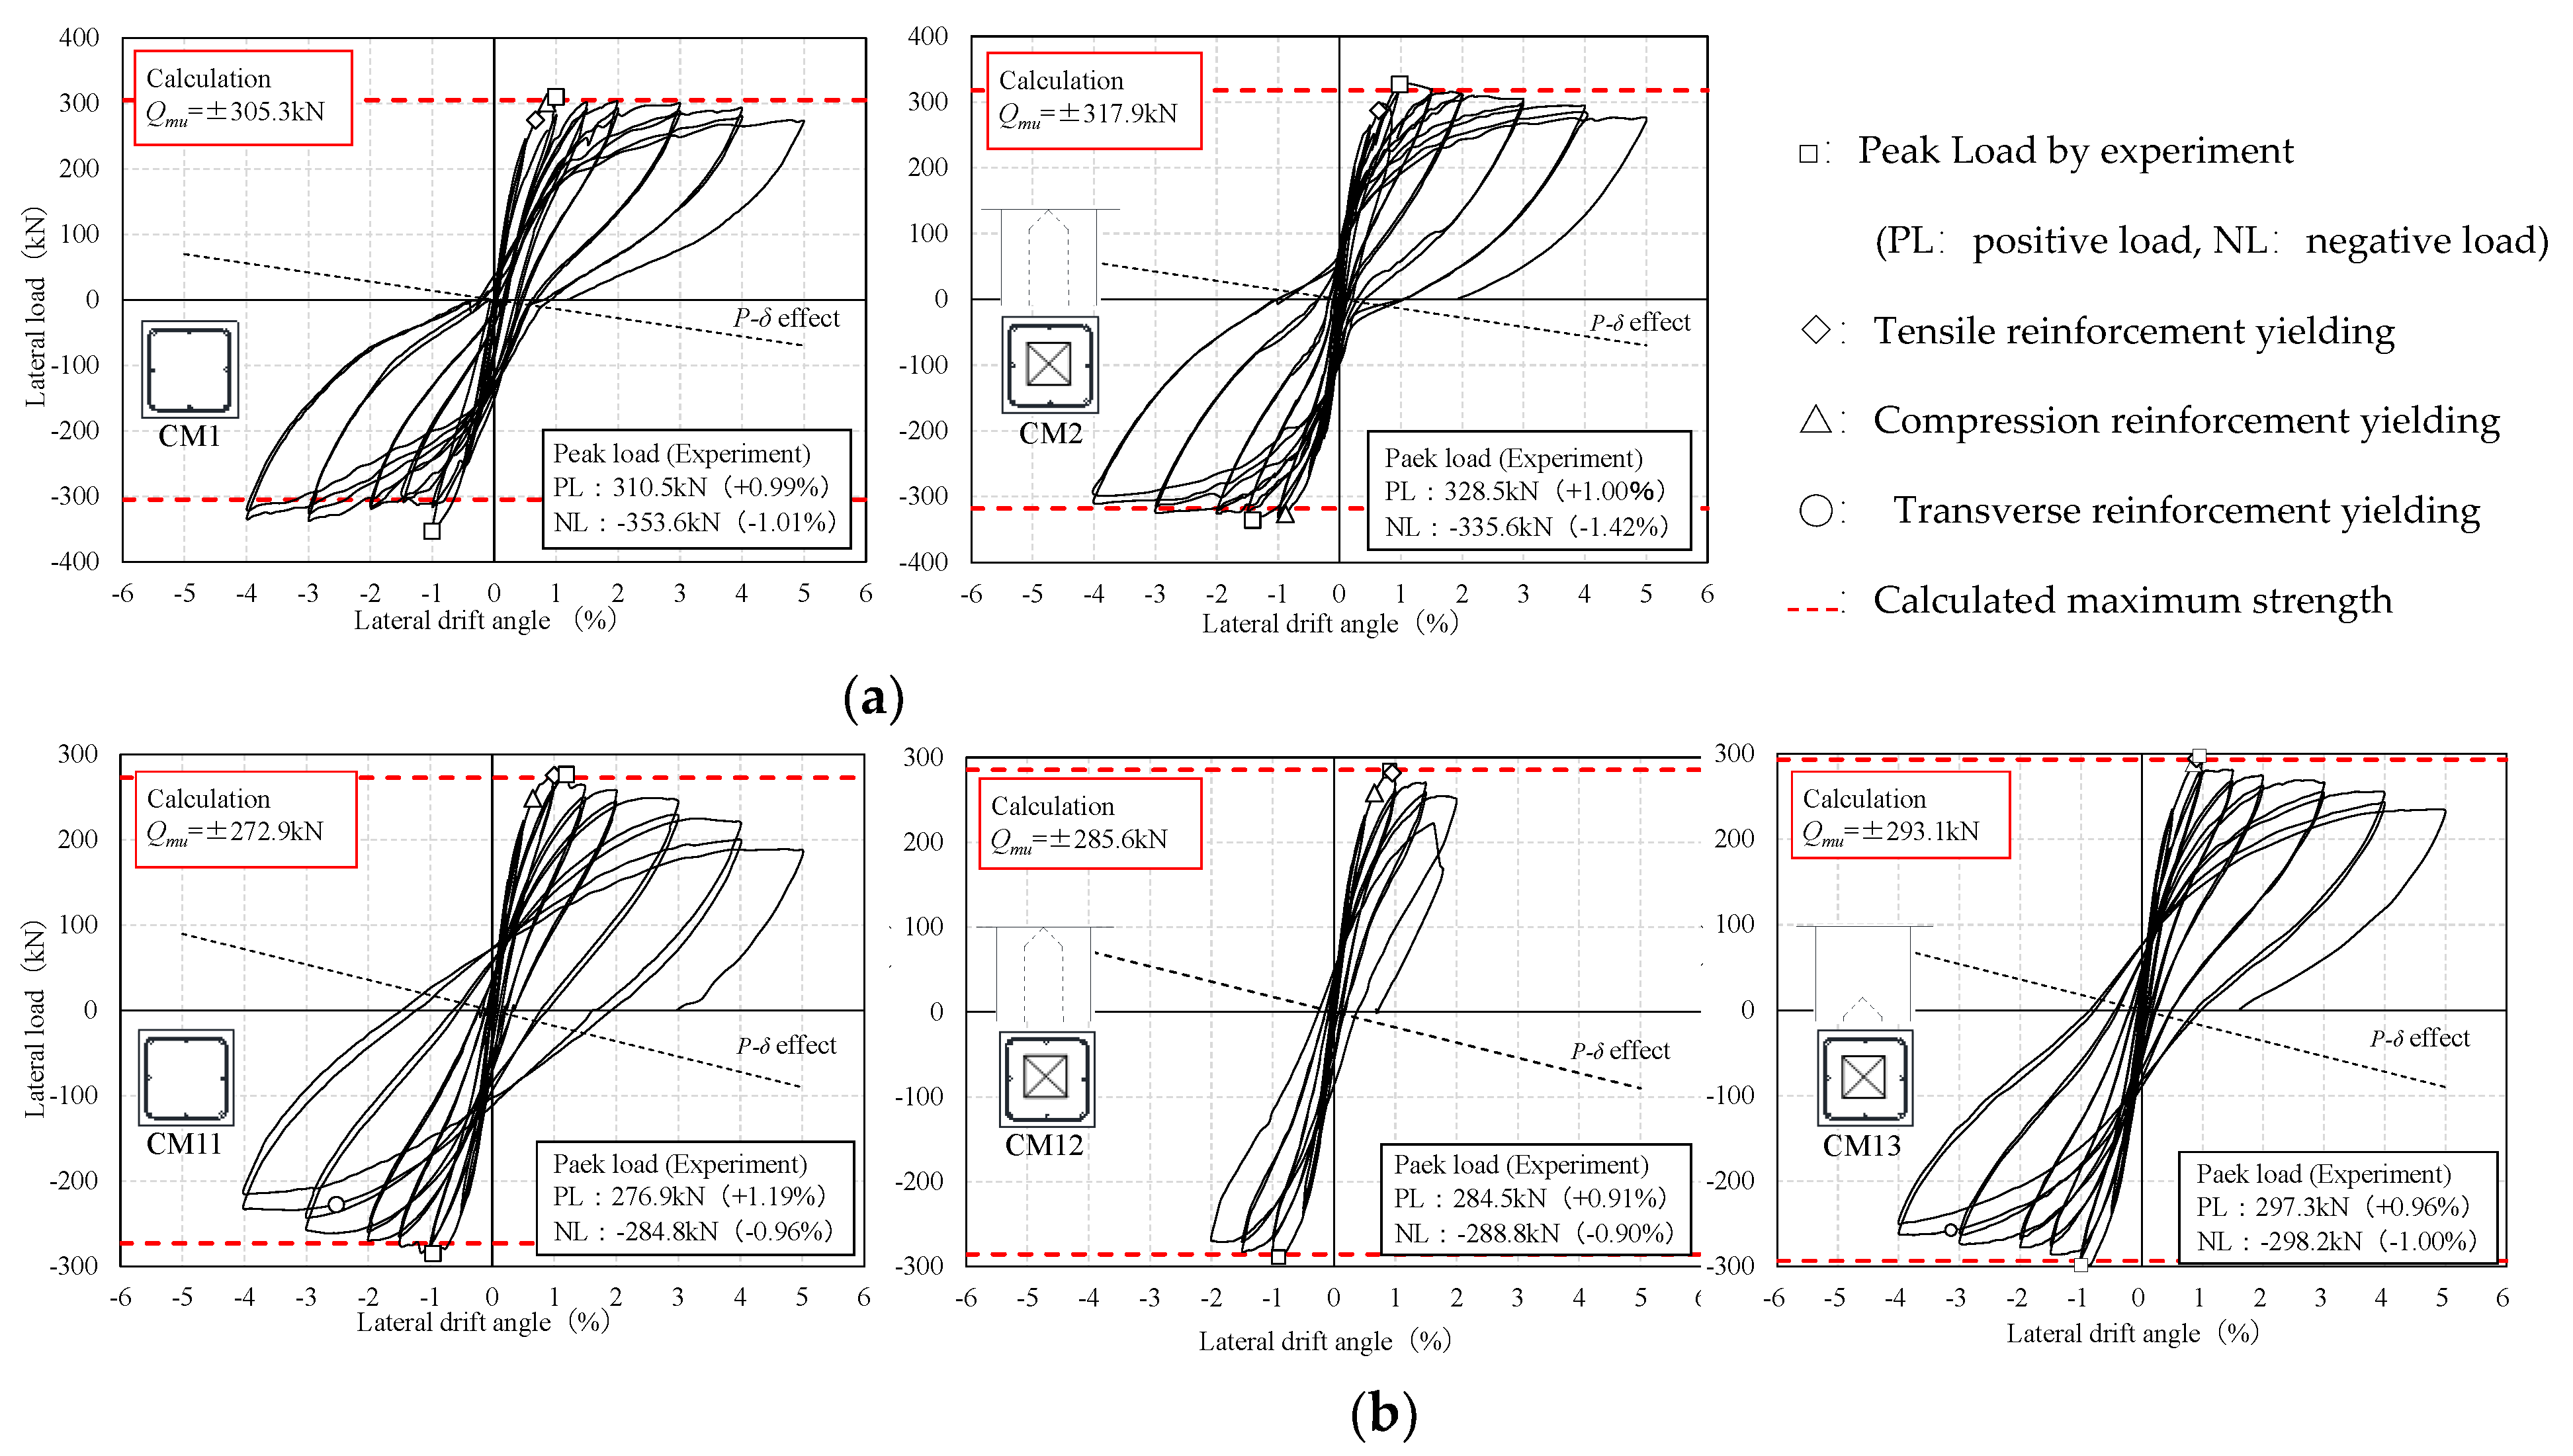
Figure 6 shows the hysteresis curve of each specimen, and Figure 7 shows the crack development of each specimen at the final loading stage. In Figure 7, the blue and red lines represent the cracks that occurred during the positive and negative loadings, respectively. The maximum strength by experiment results and calculations using cross-sectional analysis is summarized in Table 6. The main failure process and noticeable characteristics on the hysteresis curve of each specimen are as follows.

3.1. Failure Process and Hysteresis Curve of N-Series (η = 0.16)

As shown in Figure 6, in the solid-sectioned CM1, the flexural cracks occurred at R = +0.1%, following which stiffness degradation was observed. After that, the yielding of tensile reinforcement was found at R = +0.76%, and that of compression reinforcement was confirmed at R = +0.95%. A shear crack was observed at around the peak drift angle of R = +1.0%, and the maximum strength was recorded with the spalling-off of cover concrete near the column ends. At the loading stage of R = −1.0%, an axial force that was about 10% larger than expected was introduced to the specimen; therefore, the peak strength at the negative loading was higher than the positive loading. After the maximum strength, no significant strength reduction was observed up to +5.0% loading.
The hollow-sectioned CM2 also had an initial stiffness which was substantially equivalent to that of the solid-sectioned CM1, since higher strength concrete was employed in CM2. Flexural cracks occurred at R = +0.1% and, at 0.5% loading, a flexural-shear crack occurred in the tapered section near the column ends. Although a shear crack was observed earlier than CM1, there was no significant change in the load-deflection curve. At the loading stage of R = +0.82%, the tensile reinforcement yielded, and at R = −0.94%, the compression reinforcement yielded, and the yielding timing of the longitudinal reinforcement was found almost the same as CM1. The cover concrete was then slightly crushed near R = 1.0% and the maximum strength was recorded at R = +1.0% and −1.42%. After that, until the extremely large deformation state of R = +5.0%, no significant strength degradation was generated. The residual strength was maintained as larger than 80% of the maximum strength, and almost the same hysteresis curve as for CM1 was exhibited. As mentioned earlier, the maximum flexural strength (Qmu) was calculated based on the cross-sectional analysis. As a result, the ratios of calculations to experiments of the maximum strength were found in the range of 1.03~1.06, and it was found that the ultimate flexural strength could be accurately evaluated from the plane-section assumption even in the case of hollow cross-sections.
As can be seen in Figure 7, comparing the solid-sectioned CM1 and the hollow-sectioned CM2, flexural and shear cracks were likely to concentrate on the region from the column ends to 1.0D in both specimens, and the maximum flexural crack width occurred in the column ends. In CM1 and CM2, the maximum flexural crack widths at the loading peak were about 1.7 mm and 2.0 mm, and the maximum residual flexural crack widths were about 0.45 mm and 0.35 mm, respectively. Also, the maximum shear crack width was observed within 1.0D from the column ends, and there was no significant difference in both specimens. The crack numbers, as well as the cracks developing patterns, in both specimens, were found to be almost the same regardless of the presence of hollow sections. It should be noted that, in CM2, some vertical cracks were observed in the hollow-sectioned parts, which were considered to be induced by the axial compression force, as can be seen in Figure 7. However, their widths, less than 0.03 mm, were extremely small until the final loading peak, and they almost closed at the unloading stage.

3.2. Failure Process and Hysteresis Curve of S-Series (η = 0.3)

In the solid-sectioned CM11, with relatively high axial force, the flexural cracks were found at R = +0.1%, and their propagation was initiated from this drift angle. At around 1.0% loading, a flexural-shear crack developed, and the maximum strength was recorded with the cover concrete spalling near the column ends. During +1.0% loading, the yielding of compression reinforcement was found at R = +0.66%, and that of tensile reinforcement was confirmed at R = +1.0%. After that, the load-bearing capacity seemed to gradually decrease, and at the final drift peak of +5.0%, it dropped to 67% of the maximum strength. However, it should be noted that such a reduction in strength can be attributed to the P-Δ effect, which is plotted by a dot-line in Figure 6, and it was not caused by structural performance deterioration.
The hollow-sectioned CM12 also had a flexural crack during +0.1% loading, and its initial stiffness was found to be substantially equivalent to that of the solid-sectioned CM11. Similar to CM11, the compression yielding of longitudinal reinforcement was found at R = +0.66%, and the maximum load was recorded at R = +0.91% with the covering concrete spalling. In addition, the yielding of tensile reinforcement was observed at R = +0.95% during +1.0% loading, and then the maximum strength at the negative loading was recorded at R = −0.90%. Although the total number of cracks was found to be slightly more than that for CM11, no significant change was observed in the hysteresis curve until the peak drift angle of the maximum strength. Nevertheless, at the second loading cycle of R = +2.0%, the sudden concrete crushing developed intensively at the position around 0.5D from the top end, where the hollow sections exist, and then the load-bearing capacity abruptly reduced, as shown in Figure 6. The ratio of calculations to experiments of the maximum strength was 1.00~1.01, and it showed good accuracy in the case of relatively high axial force. As explained, CM12 had almost the same load-deflection relationship as the solid-sectioned CM11 until the development of flexural failure. However, after that, the brittle failure was followed by sudden concrete compressive failure near the plastic hinge region, observed as approximately 0.5D, and at this time, the shear reinforcement yielding did not occur. Because severe concrete crushing, which accelerated the partial loss of the cross-sectional area, developed at the flange of the hollow section, the damaged hollow section could not afford to sustain the high axial compression force. From this observation, the application of the hollow-sectioned column is found to have an important relationship with the compressive axial force level; therefore, the appropriate application scope will be also explained in the next section.
Therefore, the hollow sectioned CM13 was designed to prevent such unexpected compressive failure under a high compressive axial force by replacing the tip position of taper sections at 0.75D away from both column ends, as mentioned earlier. During +0.1% loading, CM13 also had flexural cracks exhibiting, an equivalent initial stiffness with CM11 and CM12. Until 1.0% loading, the total number of cracks was found to be less than that for CM12, and the hysteresis curve was almost the same as for the solid-sectioned CM11. During +1.0% loading, the longitudinal reinforcement yielded, and the maximum strength was recorded at R = +0.96%, along with the cover concrete spalling near the column ends. After that, at R = −1.00%, the lateral strength reached its maximum at the negative loading. Although the load-bearing capacity seemed to gradually decrease due to the P-Δ effect, 78% of the maximum strength was kept until the final drift peak of R = +5.0%, which is extremely large deformation. In addition, the evaluation accuracy for the maximum strength was in the range of 1.00~1.02, which indicates a good agreement.
The crack patterns and damage conditions are shown in Figure 7. For all specimens CM11~CM13, flexural-shear cracks propagated from the column end to 1.0D; however, this tendency was initiated from the early stage in CM12. Compared to CM12, the concentration of severe concrete damage on column ends could be prevented in CM13 by controlling the hollow-section position. Some vertical cracks were also observed in the hollow-sectioned parts of CM12 and CM13. Nevertheless, those crack widths were less than 0.03 mm until the final loading peak, which can be ignorable, and they almost closed when unloaded. By controlling the hollow-section position, it is confirmed that the hollow-sectioned columns with high compressive axial force can also have similar structural performances to solid ones.

4. Discussion

In this section, a more detailed discussion on the differences between solid- and hollow-sectioned columns is carried out. Strain distributions of the reinforcement, the flexural and shear deformations, and equivalent viscous damping ratios are compared in all specimens. The application scope of hollow-sectioned RC columns to building structures is also suggested, based on the experimental and analytical investigations.

4.1. Strain Distribution of Reinforcement

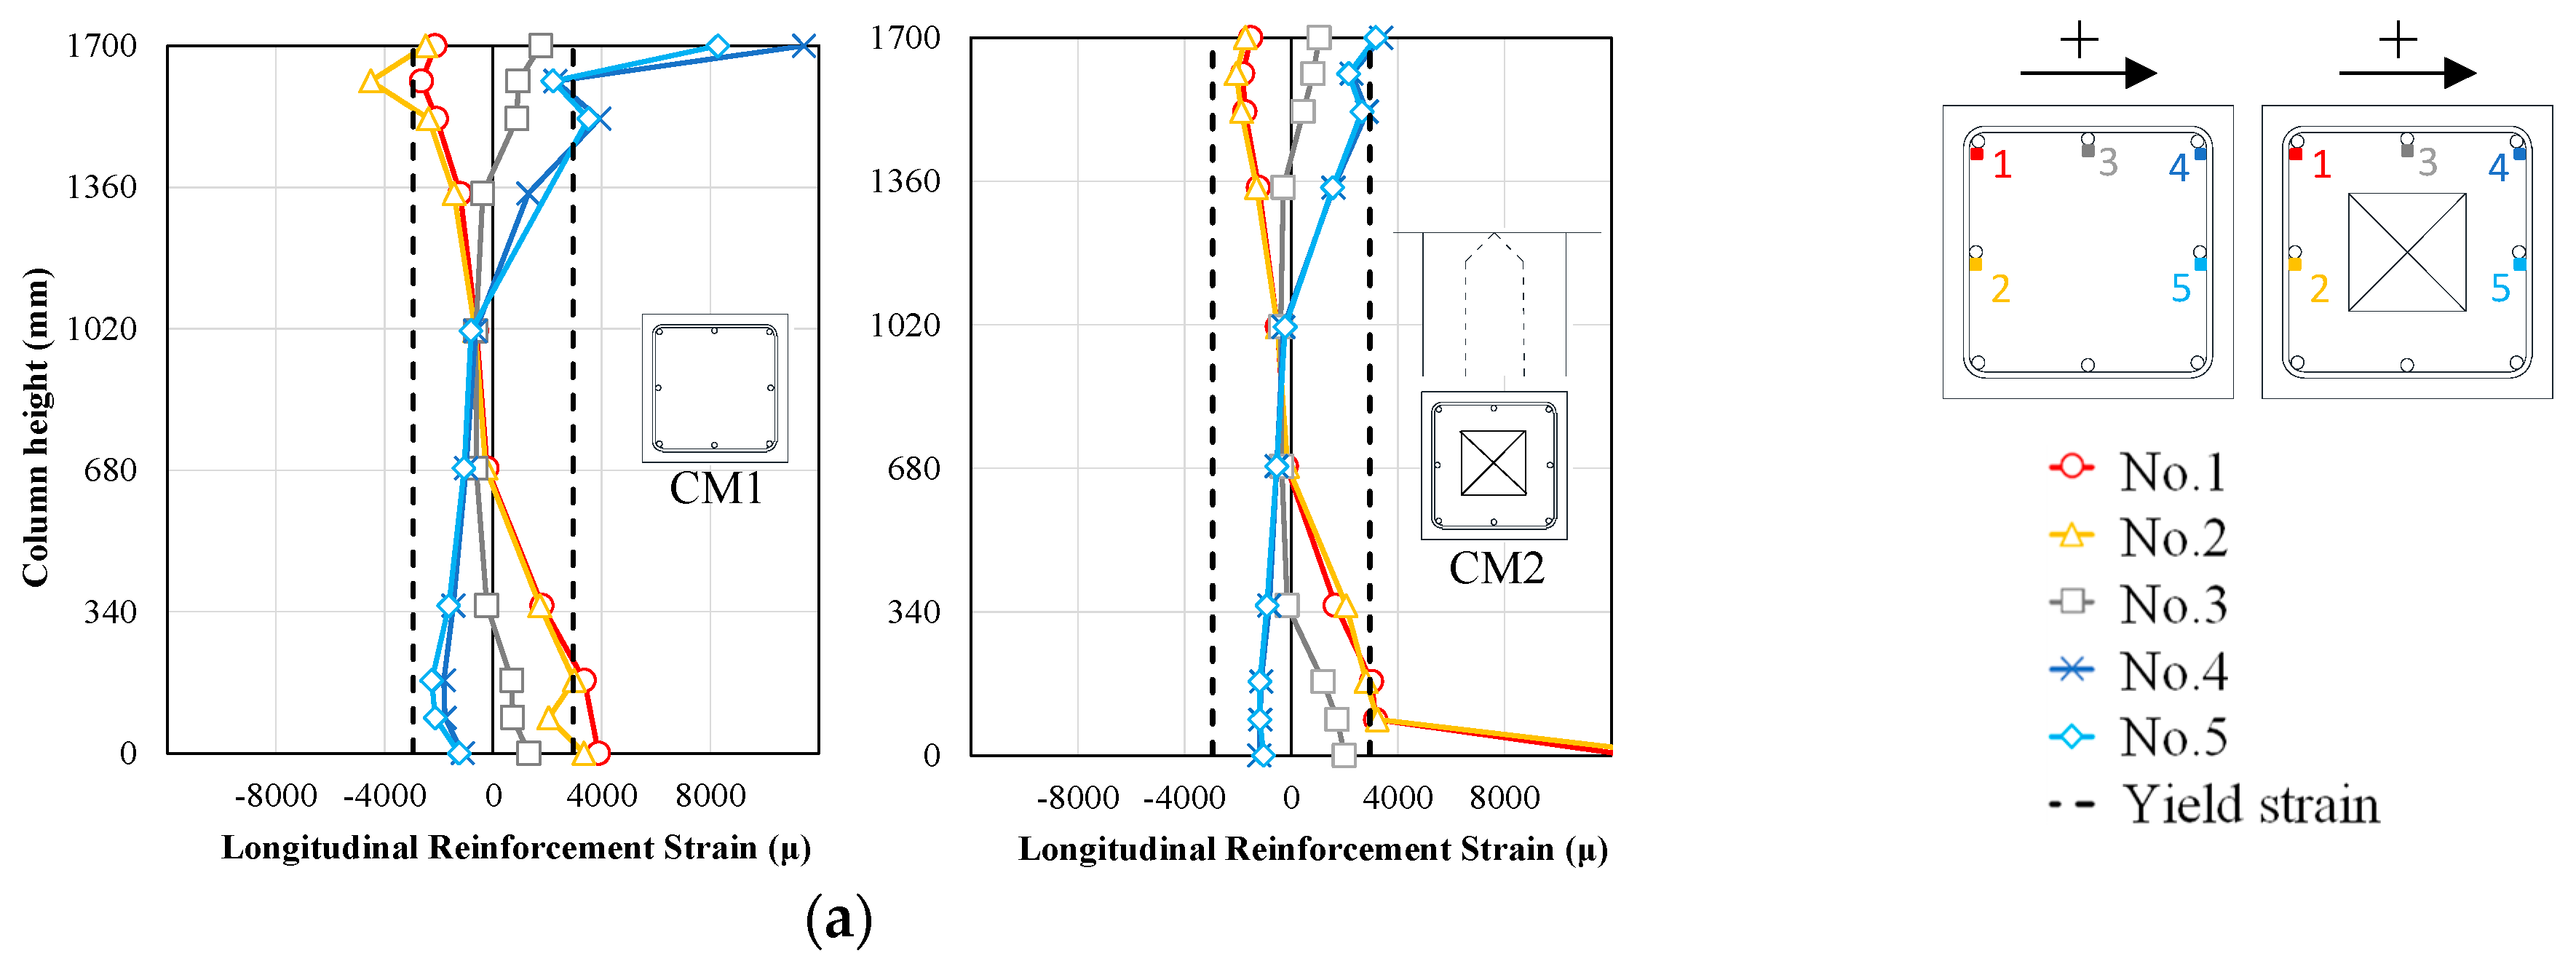
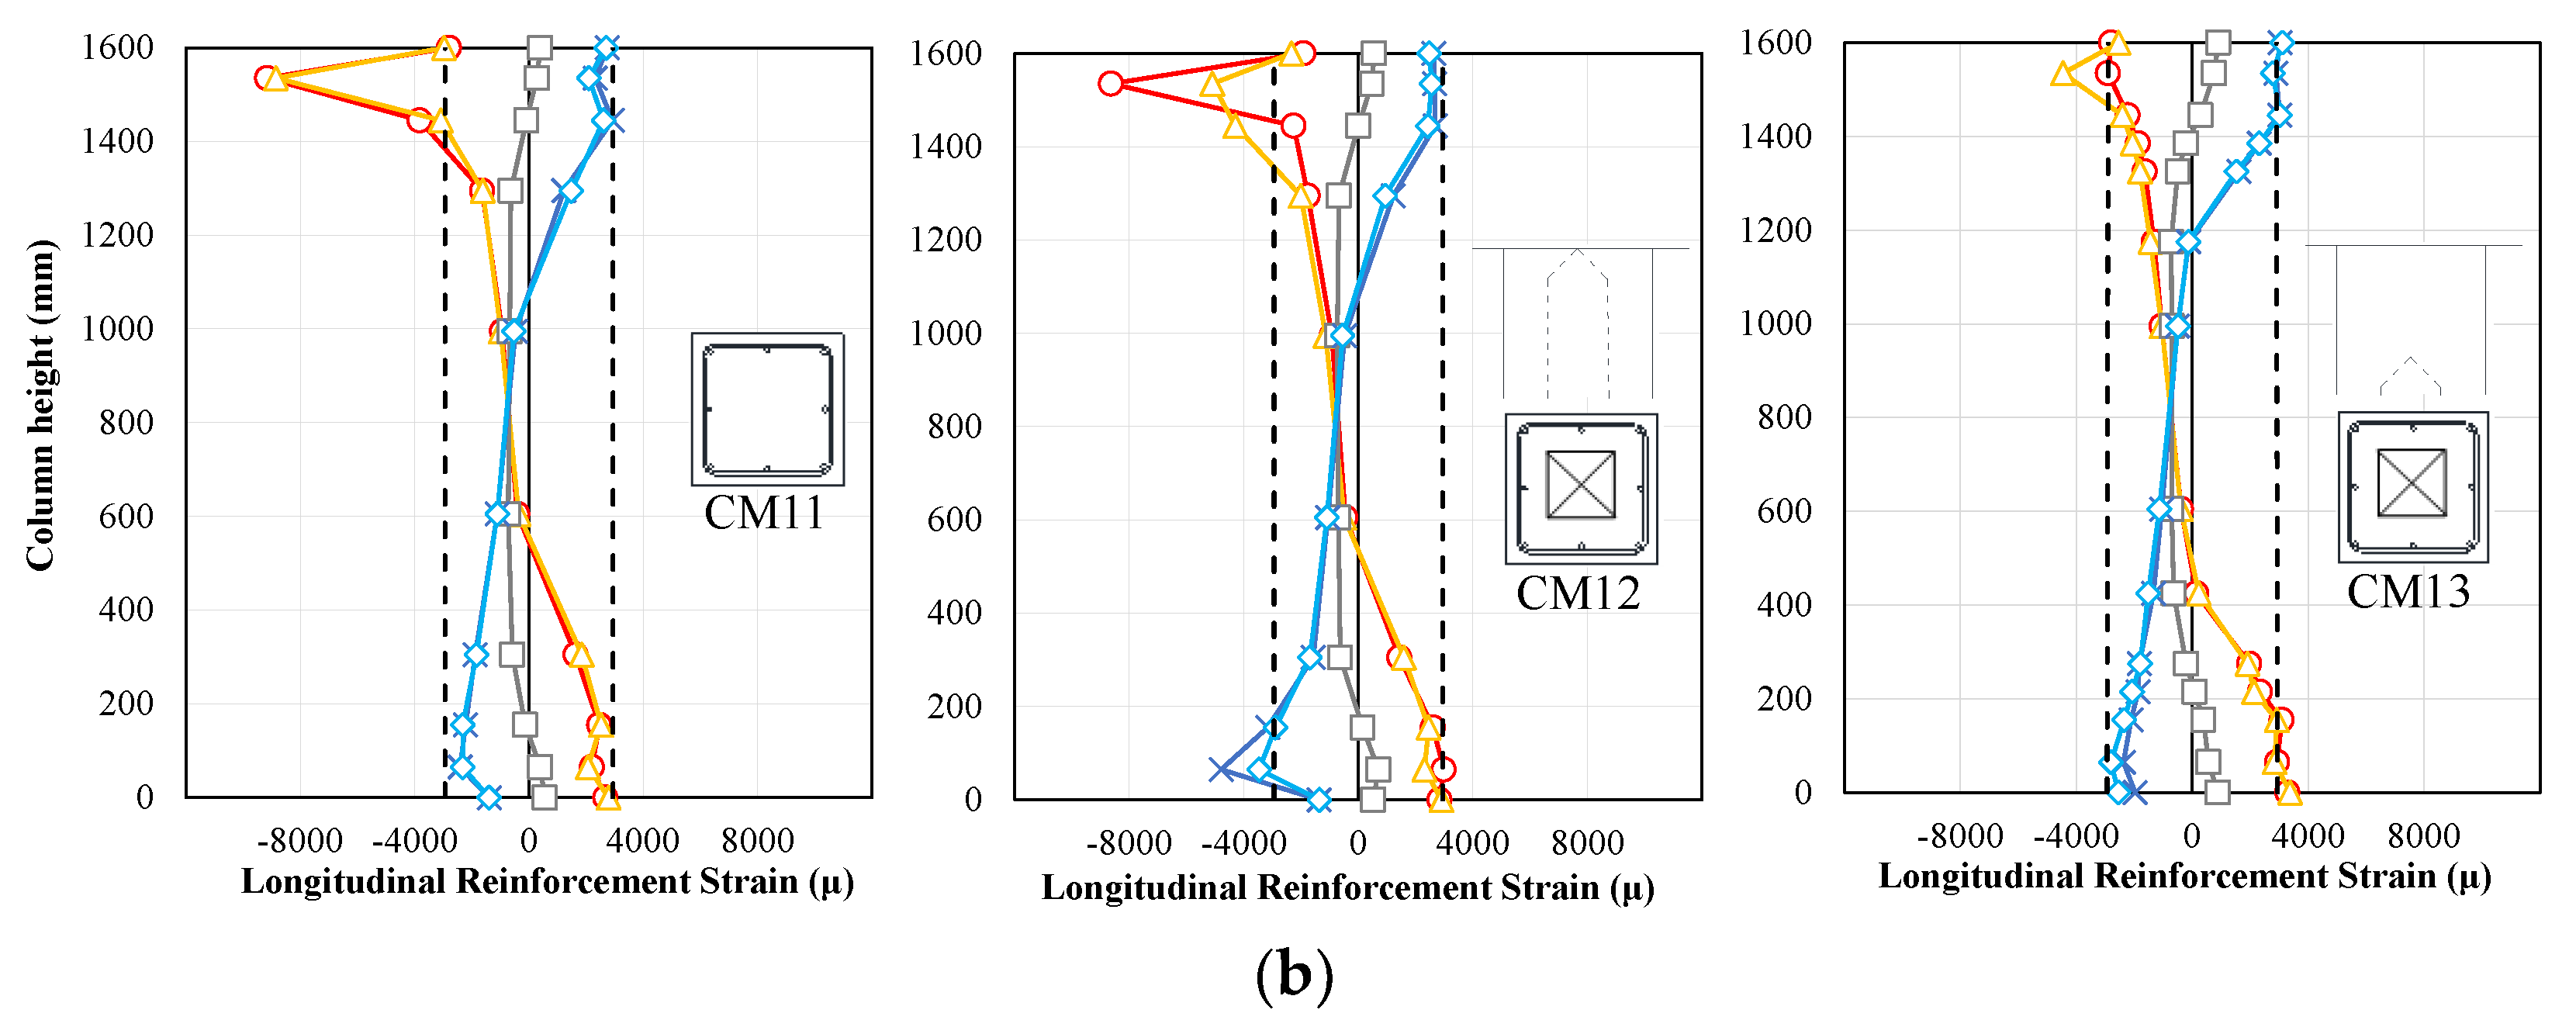
Figure 8 shows the strain distribution of the longitudinal reinforcement at R = 1.0%, which is the peak drift angle just after the maximum strength in all specimens. As mentioned earlier, in this study, strain gauges were attached to five locations of the longitudinal reinforcement, to examine the effect of hollow cross-sections. In Figure 8, the vertical axis shows the positions of the attached strain gauges, and strain distributions at No.1~No.5 are plotted as red, orange, gray blue, and light blue, respectively. If there were some significant effects caused by the use of hollow cross-sections, the strains of No.1 and No.2, or those of No.4 and No.5, would show quite different values from each other. In the hollow-sectioned CM 2 of N-series, the strain values of No.1 and 2, as well as No.4 and No.5, are almost the same as each other, and there is little difference in the strains of the longitudinal reinforcement. The strains are likely to increase abruptly after yielding; therefore, slight differences were found in a couple of the strains which were close to the column end. However, except for such strains, the strain distributions of longitudinal bars are almost consistent in the vertical direction of CM1 and CM2, which are solid and hollow-sectioned specimens. A similar tendency was observed in both specimens until the end of the loading. Also, in CM11~CM13 of S-series, the strain values of No.1 and No.2, as well as No.4 and No.5, are almost the same as each other, and such results were found during the end of the loading. Therefore, it can be said that the presence or absence of the hollow cross-sections has little effect on the strains of the longitudinal reinforcement under the axial force ratio up to 0.3, when the columns have ductile behaviors.
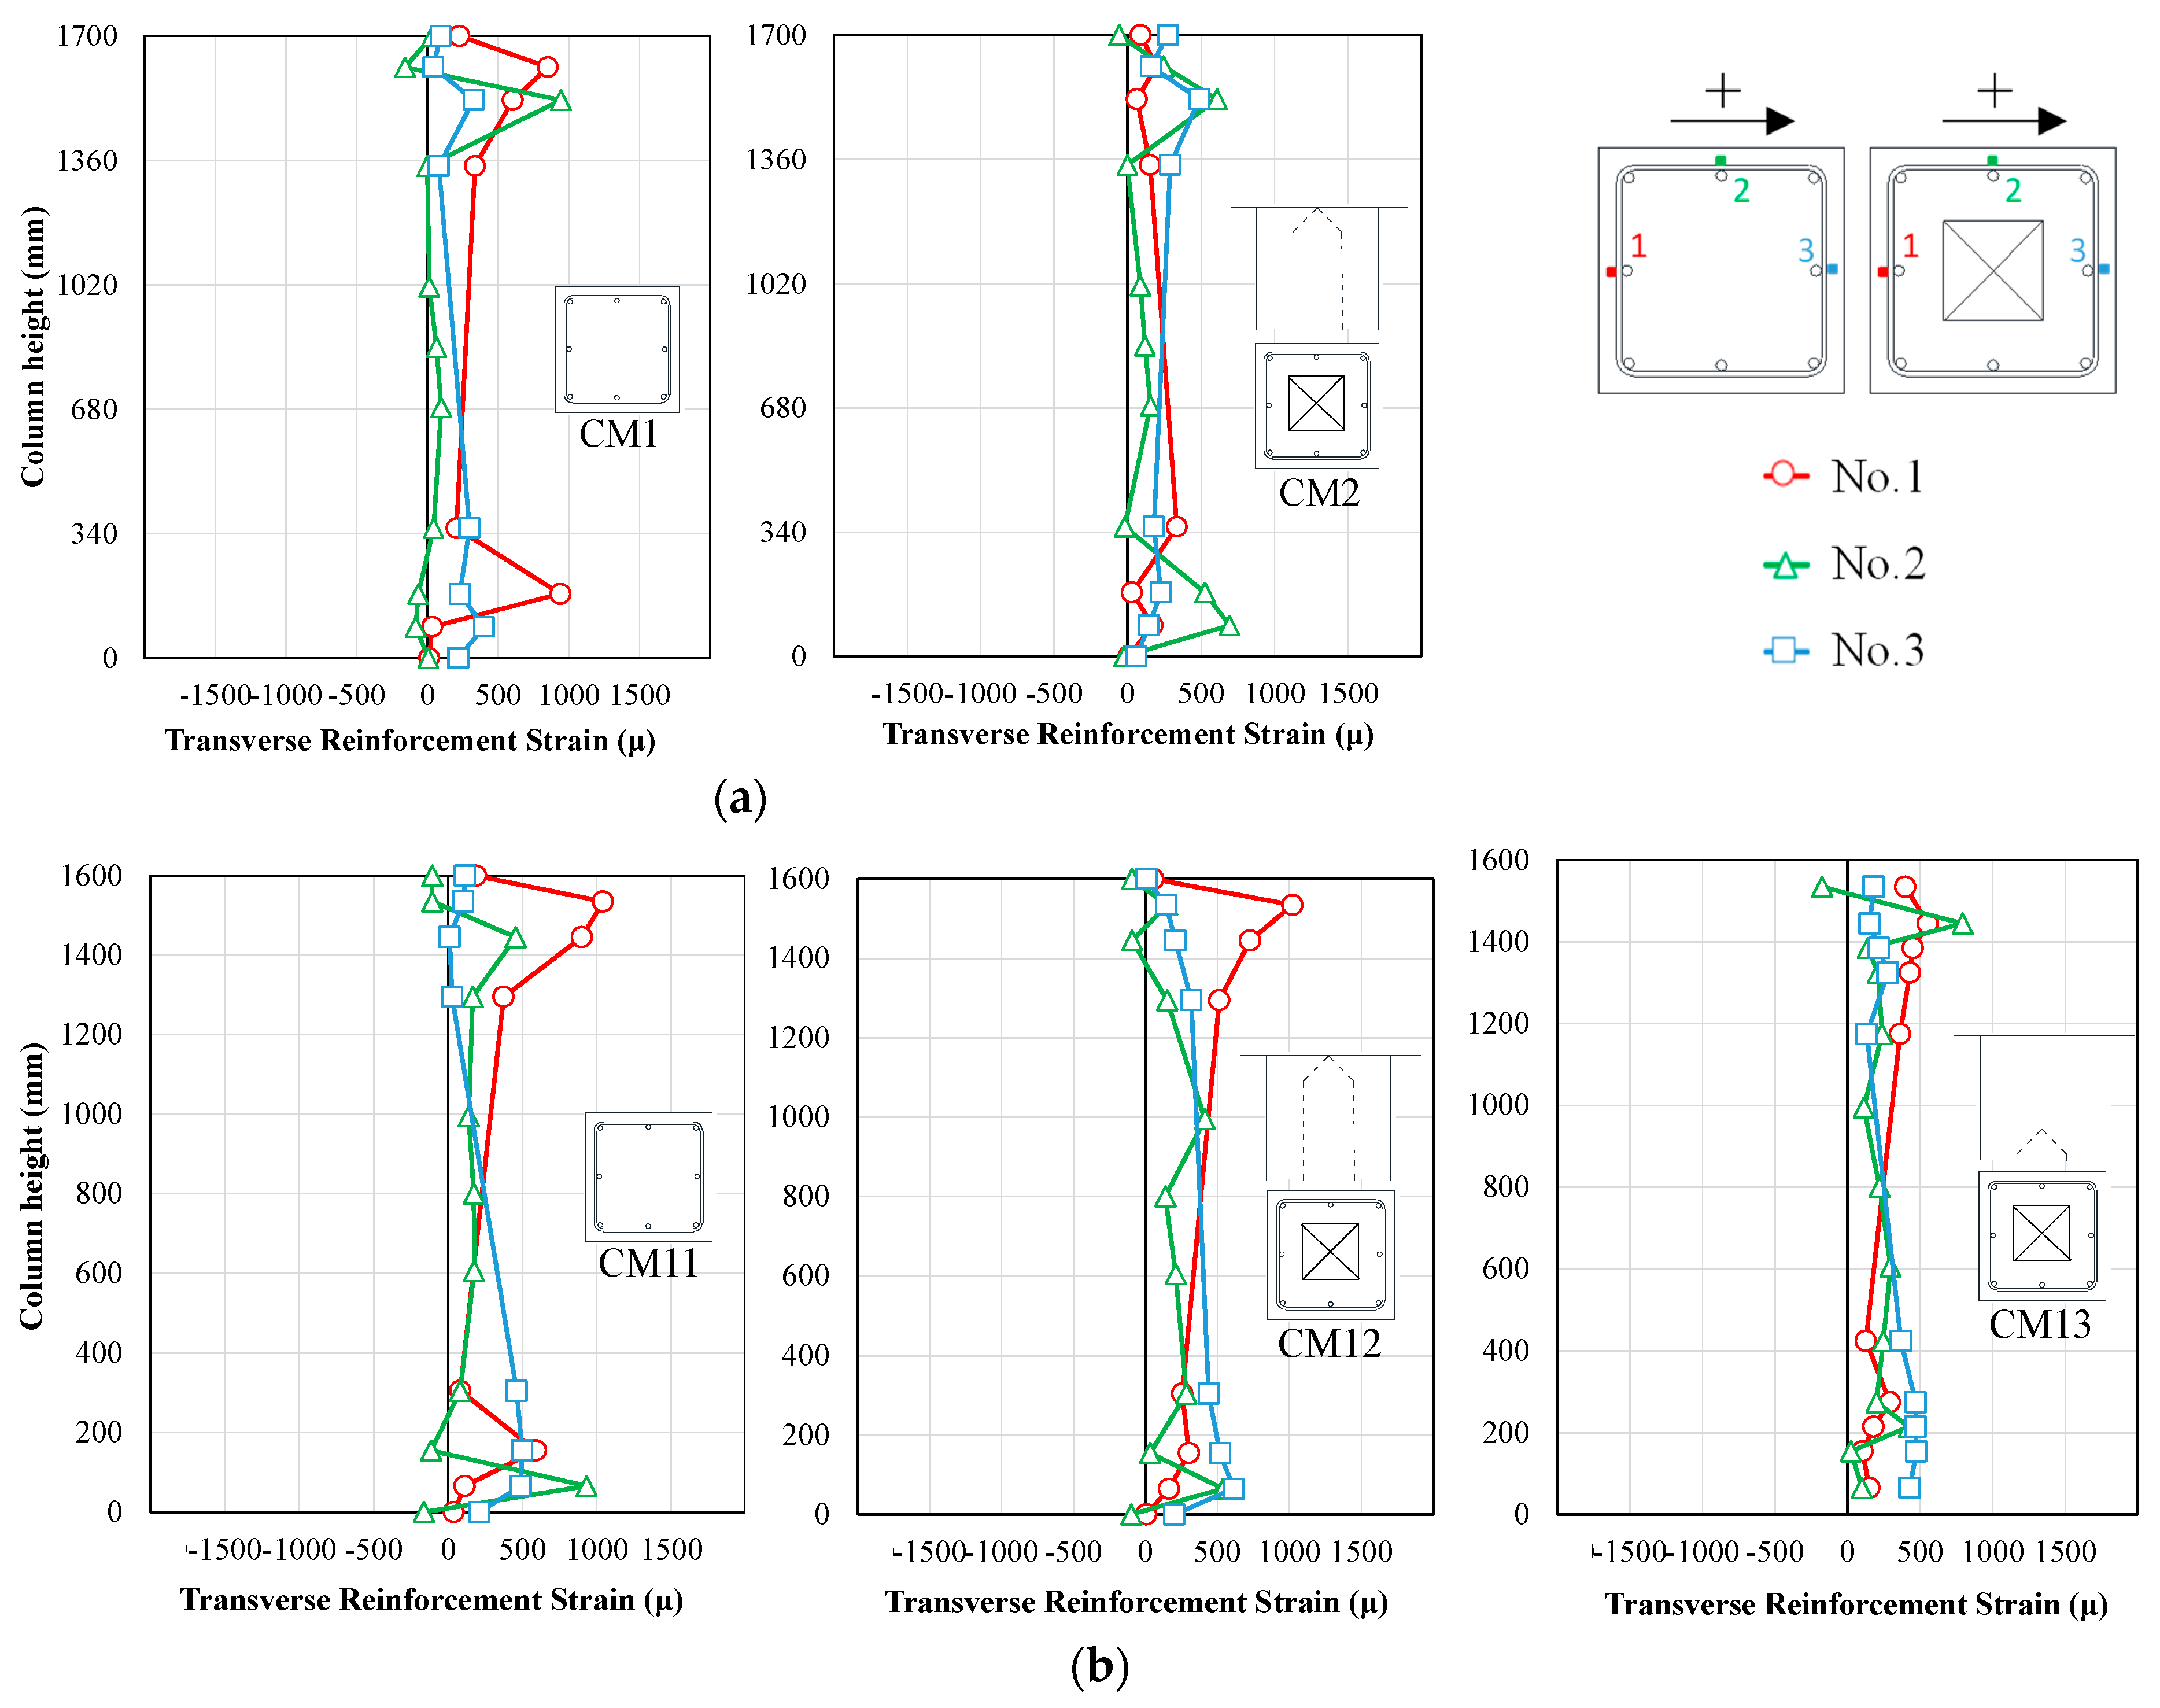
Strain gauges were also attached to the transverse reinforcement to understand the effect had by the use of hollow cross-sections. Figure 9 shows the strain distributions of the transverse reinforcement in each specimen at R = 1.0%. Strain distributions at No.1~No.3 are expressed in red, green, and light blue, respectively. Comparing CM1 and CM2 of the N-series, with solid and hollow sections, the strain distributions were found to be approximately the same in both specimens. Since CM11~CM13 of the S-series, with a higher axial force ratio, showed the same tendency, the effects of hollow sections on transverse reinforcement strains are also considered to be small when the columns fail in the flexural dimension.

4.2. Flexural and Shear Deformation Distribution

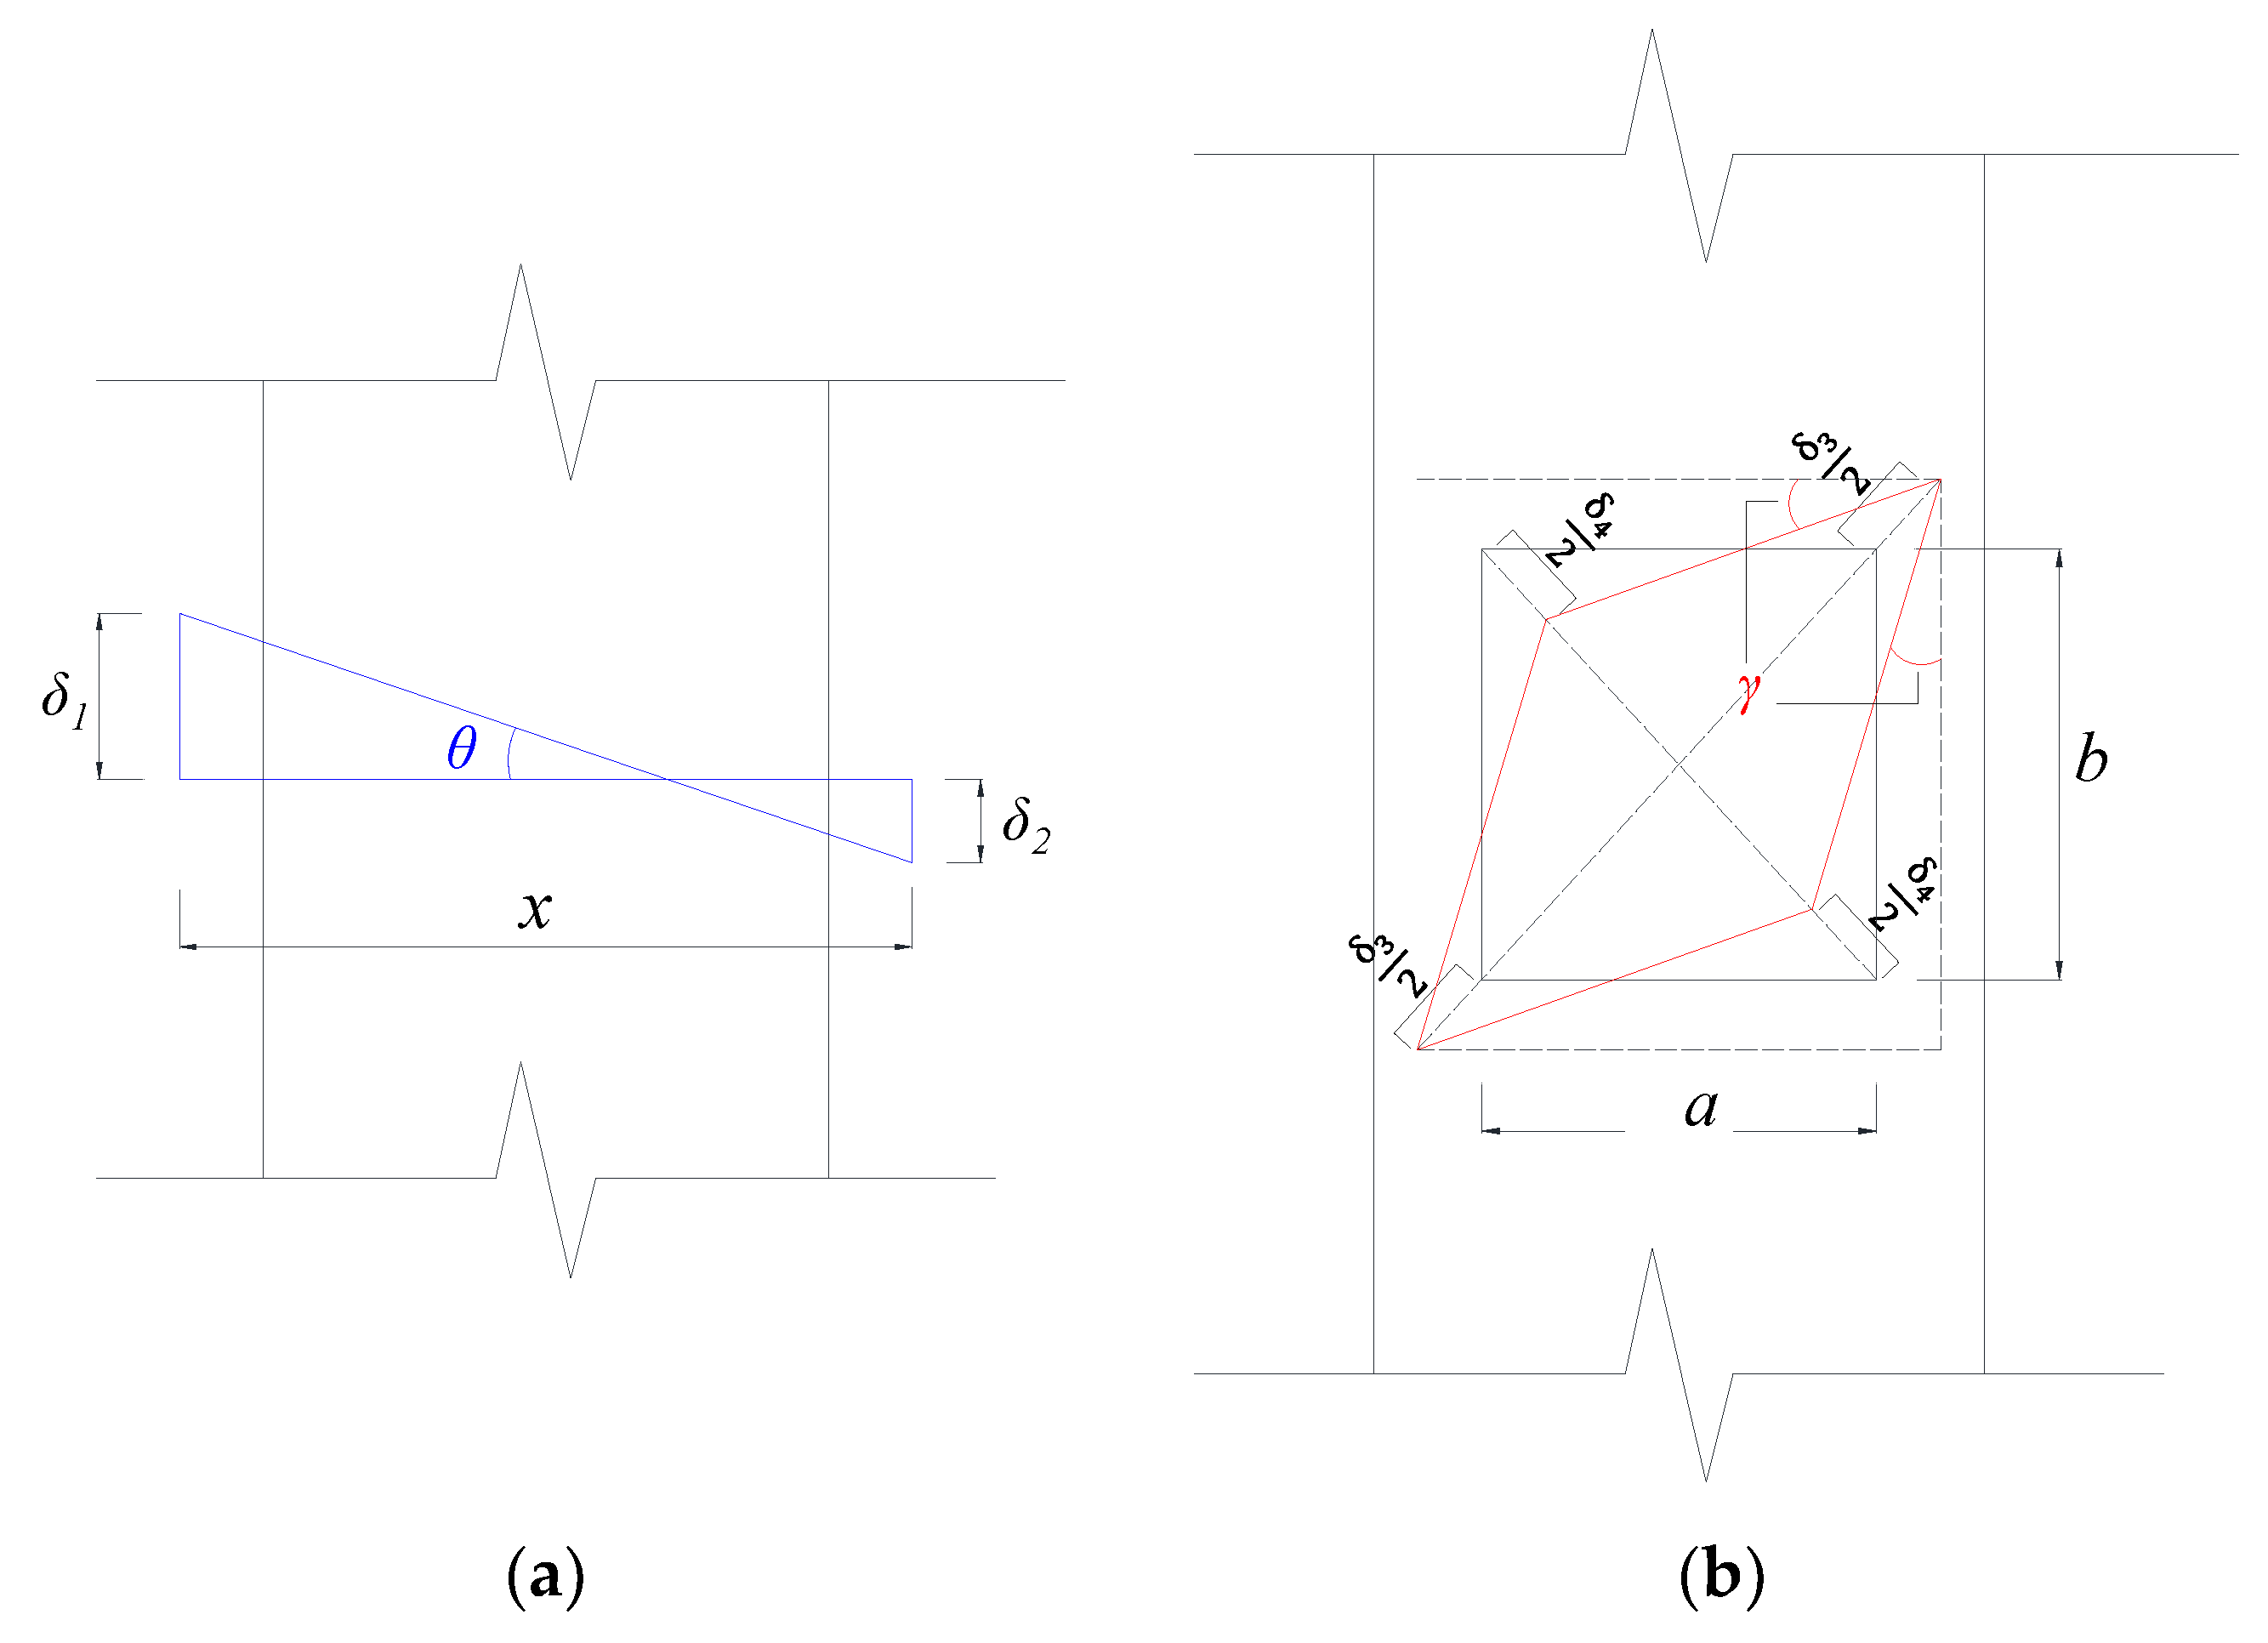
To investigate the difference in deformation patterns between solid- and hollow-sectioned columns, the flexural and shear deformation distributions were calculated as follows. As mentioned earlier, the column height was divided into seven or five sections, and the rotation angle (θ) by flexural deformation and the shear strain (γ) by shear deformation, in each section, were calculated. Based on Figure 10, the rotation angle (θ) and the shear strain (γ) were calculated using Equations (2) and (3), respectively.
θ = δ 1 δ 2 x
γ = a 2 + b 2 2 a b ( δ 3 + δ 4 )
where x is the distance between measurement points by LVDTs, δ1 and δ2 are the variation value in each LVDT in the vertical direction, a and b are the horizontal and vertical distance between measurement points by LVDTs, and δ3 and δ4 are the variation value in each LVDT in the diagonal direction, respectively.
Figure 11a shows the flexural and shear deformation distributions of N-series specimens at R = 4.0%. From the flexural deformation distribution, it is confirmed that the inflection points of both specimens were generally located in the middle of the column height. Comparing the solid-sectioned CM1 and the hollow-sectioned CM2, the deformation at the hollow parts was expected to increase in CM2; however, the flexural deformation distribution was almost the same as that of CM1. The shear deformation at both column ends tended to become larger than other sections due to the damage concentration, and their distribution was also found to be almost the same in both specimens. Although the moment of inertia and cross-sectional area decreased at the hollow cross-sections, higher strength concrete with a higher Young’s modulus was employed in CM2, and it is considered to result in similar deformation patterns in both specimens.
Figure 11b shows the flexural and shear deformation distributions of S-series specimens at R = 2.0%. For the flexural deformation, CM12 and CM13 had deformation distributions that were almost equivalent to that of the solid-sectioned CM11 in the same way as the N-series. Moreover, for the shear deformation distributions, those of hollow-sectioned specimens were almost equal to that of the solid-sectioned one, as observed in the N-series. As mentioned above, this similarity can be attributed to the concentration of damage on the column ends, and the use of higher strength concrete in hollow-sectioned specimens (CM2, CM12, and CM13). Also, it is concluded that, as long as severe damage on the hollow sections can be avoided, the deformation patterns will not be changed.

4.3. Equivalent Viscous Damping Ratio

The difference in energy absorption capacity, between solid and hollow sectioned columns, was inspected by comparing their equivalent viscous damping ratios (heq). Figure 12 shows the heq distributions along with the peak drift angles in all specimens. Herein, heq was calculated by using the second cycle loops of the hysteresis curves. The values of heq in CM1, CM11, CM2, and CM13 were calculated up to R = 4.0%, whereas that of CM12 was calculated until R = 1.5%, which was the drift angle just before the sudden drop in load-bearing capacity.
As can be seen in Figure 12, heq gradually increased with the increase in drift angles in all specimens. Although slight differences in heq values, approximately within ±1.5%, were found between the solid- and hollow-sectioned specimens, their development and tendency were almost the same. CM12 also exhibited the same heq values as CM11, until the development of the unexpected failure. From these observations, before the brittle failure, it is confirmed that no degradation in energy absorption capacity occurred even in the cases with hollow cross-sections, which is attributed to equivalent hysteresis loops, failure patterns, and deformation patterns.

4.4. Neutral Axis Location

As explained earlier, the hollow-sectioned CM12 of the S-series, having an axial force ratio of 0.3, experienced an abrupt reduction in load-bearing capacity at the second loading cycle of R = 2.0%, before the shear reinforcement yielding. At this time, concrete compressive failure, at the plastic hinge region near the column end, suddenly occurred, resulting in brittle failure. On the other hand, such a failure pattern did not develop in the hollow-sectioned CM2 of the N-series with an axial force ratio of 0.16.
To comprehend the reason for this, the location of the neutral axis (xn), at the ultimate flexural state, was investigated in the cross-sectional analysis, which was explained in Section 2. The calculated xn at the ultimate flexural state, in CM2 and CM12, are shown in Figure 13. In CM2, with an axial force ratio of 0.16, the neutral axis has been found to be located on the flange of the cross-section, which means the concrete compressive stress does not work on the hollow section at the ultimate flexural state. Therefore, the compressive stress distribution of the concrete, at the plastic hinge region, is expected to be similar to that of a solid cross-section. However, in CM12, having an axial force ratio of 0.3, xn increased due to higher compressive axial force, and the neutral axis has been estimated to be located on the web beyond the flange, which means that the concrete compressive stress acts on the hollow section at the ultimate flexural state. Therefore, if the neutral axis exists on the web of plastic hinge regions, the concrete compressive stress on the hollow section is likely to increase rapidly, due to the concrete crushing, at around the ultimate flexural state. This is the reason why the deformation capacity was drastically improved in the CM13, in which the position of the hollow sections was appropriately adjusted. Simultaneously, such adjustment, avoiding hollow sections from plastic hinge regions, would be an effective solution to ensure enough ductility against large compressive axial forces.
In the previous studies [2], the structural performance of cylindrical bridge piers with circular hollow sections was investigated by introducing different axial force ratios. From the experimental results, the deformation capacity tended to reduce, when the neutral axis location exceeded the flange of hollow cross-sections, which is consistent with the results of rectangular cross-sections in this study. Although further study is required, the relationship between the magnitude of the compressive axial force and the neutral axis location at the ultimate flexural state is one of the important factors in determining the deformation capability and the application scope of RC columns with rectangular hollow cross-sections. If the neutral axis, at the flexural state, is expected to be located on the web of the hollow cross-section, as confirmed by the results of the hollow-sectioned CM13, the failure mode and ductility can be ensured by properly separating the hollow section from the plastic hinge region. Therefore, it is recommended that the position of the neutral axis against the design axial force, at the ultimate flexural state, be calculated and checked for the use of hollow-sectioned columns. At the same time, focusing on the total collapse buildings where the flexural hinges occur at the beam ends, these hollow-sectioned columns would be applicable to the second floor or higher, since no flexural hinges develop in those columns.

4.5. Finite Element Analysis

In addition to the cross-sectional analysis above, a finite element (FEM) analysis was performed to further grasp the seismic behaviors of the specimens.

4.5.1. Analysis Outline

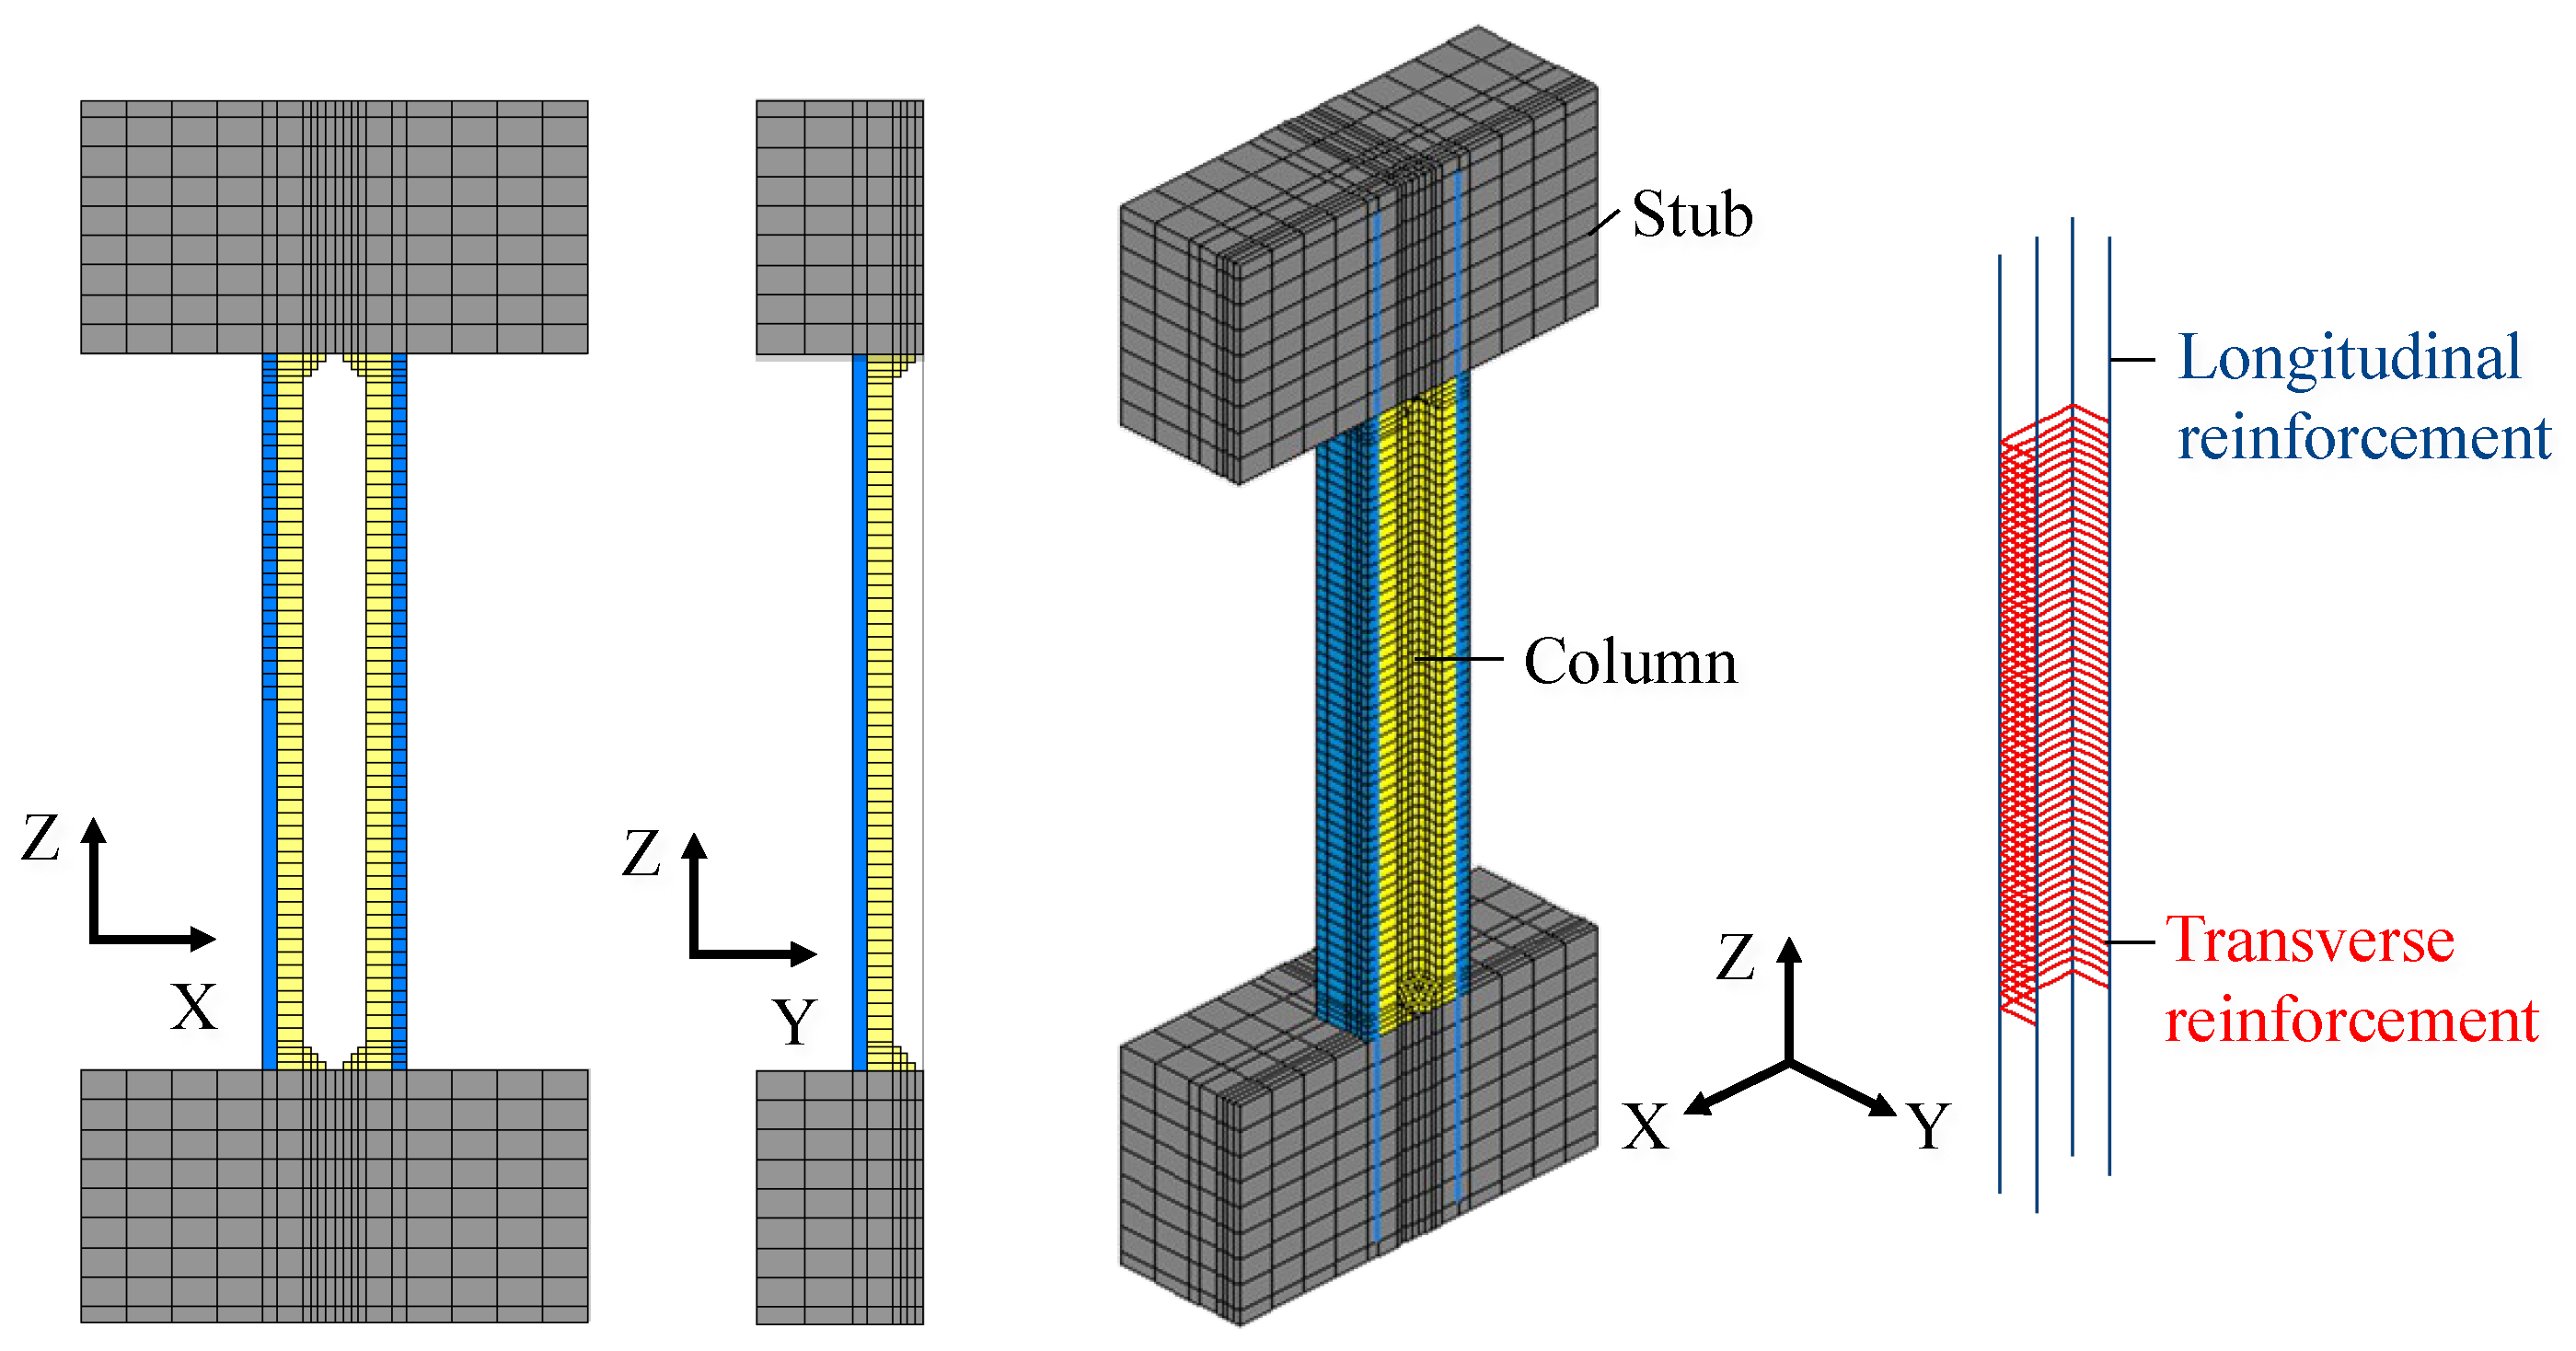
The nonlinear FEM analysis was carried out by FINAL [26], which is commonly used for RC structure analysis in Japan. Figure 14 shows the geometry of the FEM model and meshing. The concrete was modeled as hexahedral elements, and truss elements were assigned for the reinforcing bars. The bond-slip behavior between the concrete and reinforcement was also considered. Since the hexahedral elements were assigned for the concrete, the tapered shape of the hollow part was reproduced by a fine stair-stepped shape, as shown in Figure 14. Half of the specimen was modeled by utilizing the symmetric condition, and the displacement in the Y direction was constrained. The axial load was provided as distributed axial forces in the Y direction on the top of the upper stub, and then the lateral displacement was applied to the top of the upper stub, as was done in the experiment.
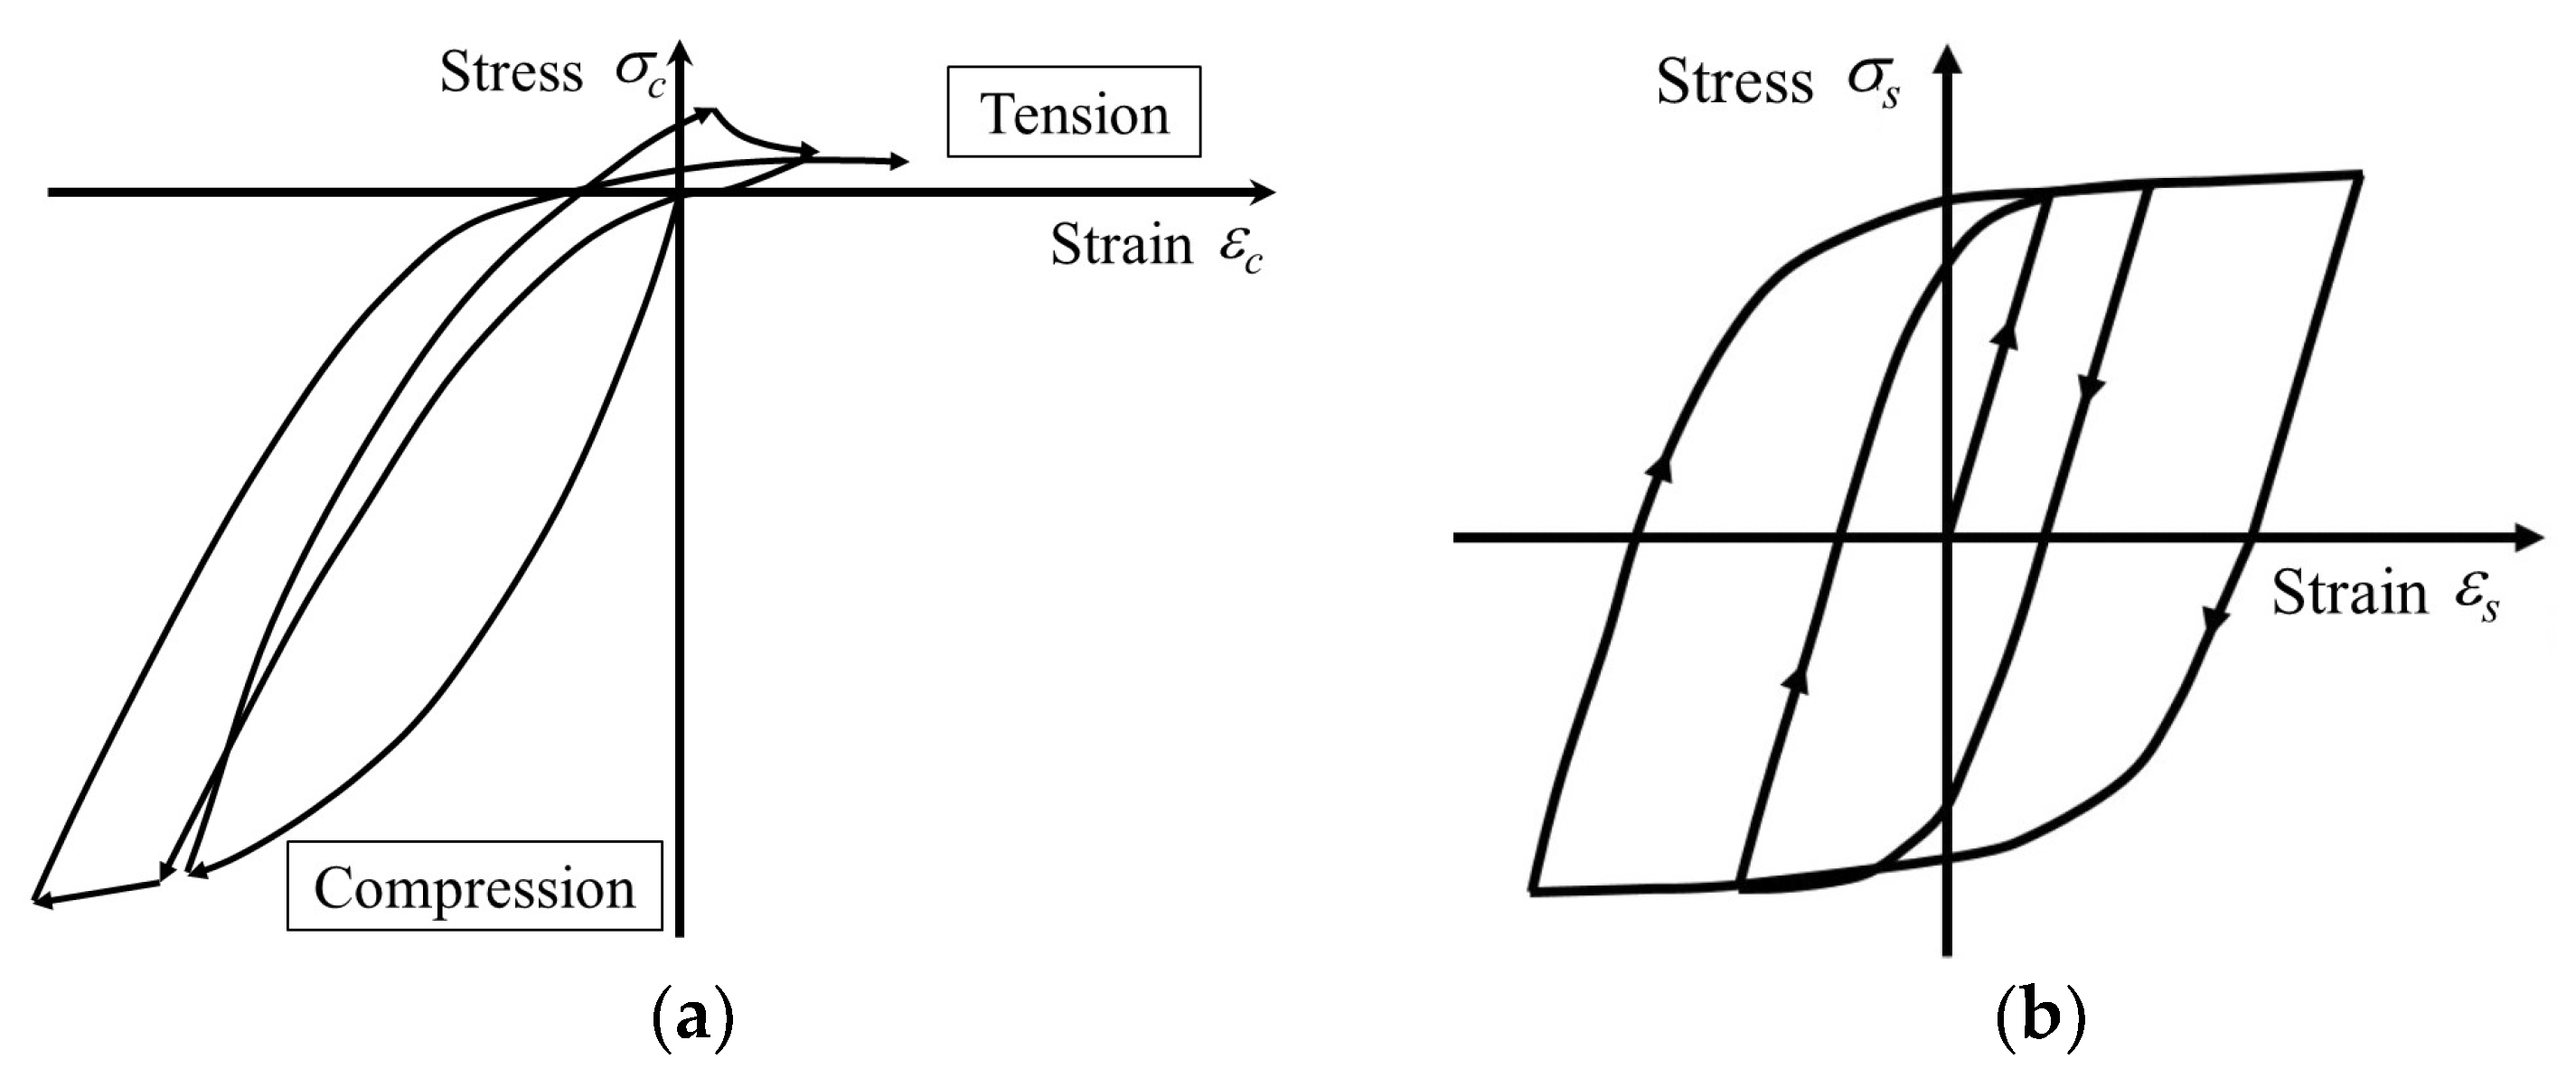
Stress–strain hysteretic models of the concrete and steel, as well as the bond-slip model between them, are shown in Figure 15 and Figure 16, respectively. For the concrete, the hysteresis curve described by Naganuma et al. [27] was employed, and the modified Ahmad model [28,29] was used in the stress-increasing region up to the peak strength. Regarding the characteristics of the softening region after the peak, the Nakamura–Higai model [30] was assigned for the core concrete, while the constitutive model with sharp stress degradation after the peak was employed for the cover concrete [26]. Ottosen’s four-parameter model [31], adopting the coefficients of Hatanaka et al. [29], was used for the failure condition under the triaxial stress. The tension behavior of the concrete was assumed to be linear until the crack development, and after cracking, the tensile softening property was modeled according to Izumo et al. [32]. Concerning the constitutive law of reinforcing bars, the modified Menegotto–Pinto model [33] was used for the hysteresis curve. The envelope was set to be bilinear and the stiffness after the yielding was assumed to be 1/1000Es, in which Es represents Young’s modulus. The slip-bond relationship between the concrete and longitudinal reinforcement was modeled according to Naganuma et al. [34] and the AIJ guidelines [35].

4.5.2. Analysis Result

In Figure 17, the hysteresis curves obtained by the experiments and FEM analysis are compared. The analysis results are shown up to the drift angle, where the maximum strength was almost confirmed with stable analysis results. The drift angle of longitudinal reinforcement yielding is plotted with ◇. The maximum strength by experiments and FEM analysis is summarized in Table 7. Comparing the analysis with the test results, the initial stiffness was almost the same. In all specimens, the yielding of longitudinal reinforcement occurred near the column end at around R = 1.0%, and the hysteresis curves agree well with the experimental results. The ratios of experiments to calculations of the maximum strength were found in the range of 0.83~1.07, and the FEM analysis showed reasonable correspondence with the experiments.
To understand the compressive stress state of the hollow-sectioned specimens with a higher axial force ratio, the concrete stress of CM12 and CM13 was investigated from the analysis. Figure 18 shows the minimum principal stress distribution of CM12 and CM13 at R = 1.0%, where the blue and the red colors represent the largest compressive and tensile stress, respectively. In CM12, where the brittle failure occurred, the concrete compressive stress was concentrated at the top of the hollow part, marked by a dotted circle, and the value exceeded approximately 1.15 times the concrete compressive strength (uniaxial compressive strength). The compressive stress seems to increase by multi-directional compression, and it is confirmed that a severe stress concentration developed due to the high axial load. However, in CM13, where the position of the hollow part was adjusted from the column end, the compressive stress at the top of the hollow part was almost half of the concrete compressive strength, and the successful reduction of the compressive stress was verified from the analysis.

5. Conclusions

In this study, detailed investigations on RC columns with rectangular hollow cross-sections, in building structures, were carried out to understand their structural characteristics and seismic performance. The following are the major findings obtained from this study.
1.
Although the moment of inertia and cross-sectional area decreased in the hollow-sectioned column, by using higher strength concrete with a higher Young’s modulus, the initial lateral stiffness of the hollow-sectioned column could be reproduced as that of the solid-sectioned column.
2.
In the hollow-sectioned columns, the experimental maximum strength was 1.00~1.06 times the ultimate flexural strength estimated by the cross-sectional analysis using plane section assumption, and the calculations showed good agreement with the experiments. Accordingly, the maximum strength evaluation by the plane section assumption is also effective for the RC columns with rectangular hollow cross-sections.
3.
Under an axial force ratio of 0.16, the structural performances between hollow- and solid-sectioned columns were found to be almost equivalent, because their hysteresis curves, failure patterns, strain distributions of reinforcement, flexural and shear deformations, and energy absorption capacity were almost the same.
4.
In the hollow-sectioned specimen CM12 with an axial force ratio of 0.3, the structural performance was almost the same until the 2.0% drift angle; however, sudden deterioration of the load-bearing capacity occurred at the second loading cycle, with concrete compressive failure occurring at the plastic hinge region near the column end. Such brittle failure was induced by the location of the neutral axis at the ultimate flexural state, which was estimated to exist beyond the flange of the hollow cross-section.
5.
In the hollow-sectioned specimen CM13 with an axial force ratio of 0.3, the position of hollow sections was, therefore, planned at 0.75D from the column end, beyond the plastic hinge regions. Then, the structural performance between the hollow- and solid-sectioned columns was found to be almost the same.
6.
The relationship between the magnitude of the compressive axial force and the neutral axis location at the ultimate flexural state was found to be one of the crucial factors for the deformation capacity and the application scope of RC columns with rectangular hollow cross-sections. If the neutral axis is located within the flange of the cross-section, the concrete compressive stress does not work on the hollow section; therefore, the compressive stress distribution of concrete, at the plastic hinge region, would be similar to that of a solid cross-section. On the other hand, if the neutral axis exists on the web of plastic hinge regions, the concrete compressive stress on the hollow cross-section is likely to increase abruptly, due to the concrete crushing, at around the ultimate flexural state.
7.
The nonlinear FEM analysis was carried out to further grasp the structural behaviors of the rectangular hollow sectioned columns. The drift angles of reinforcement yielding, the maximum strength, and the hysteresis curves by the analysis reasonably corresponded with the experiments. The compressive stress concentration of concrete at the hollow-cross section near the column end was also observed from the minimum principal stress distribution by the analysis, which is considered to result in abrupt brittle failure.
Therefore, as explained in this study, for the use of RC columns with rectangular hollow cross-sections, it is recommended that the neutral axis position against the design axial force, at the ultimate flexural state, be calculated and checked in advance. If the neutral axis is located on the web of the hollow cross-section, the failure mode and ductility can be ensured by properly separating the hollow section from the plastic hinge region. Simultaneously, for the total collapse buildings in which the flexural hinges develop at the beam ends, RC columns with rectangular hollow cross-sections would be applicable on the second floor or higher, because no flexural hinges are expected to occur in those columns. It is also noted that many RC buildings in Japan have columns with square cross-sections; therefore, the structural performance of square cross-sections is mainly focused on in this study. On the other hand, some RC buildings also have circular columns, and an appropriate comparison between square and circular columns with hollow cross-sections in building structures is further required to be studied in future research.

Author Contributions

Conceptualization, K.J.; Investigation, K.J., K.Y. and R.T.; Resources, K.Y. and R.T.; Data curation, K.Y. and R.T.; Writing—review & editing, K.J.; Visualization, K.J.; Supervision, K.J.; Funding acquisition, K.J. All authors have read and agreed to the published version of the manuscript.

Funding

This research received no external funding.

Institutional Review Board Statement

Not applicable.

Informed Consent Statement

Not applicable.

Data Availability Statement

Not applicable.

Acknowledgments

This work was supported by the Joint Research between Meiji University (Principal Investigator: Kiwoong Jin) and Sumitomo Mitsui Construction. The financial support by Sumitomo Mitsui Construction is greatly appreciated. The authors also thank Taiga Inoue (Nishimatsu Construction, Former Graduation Student, Meiji University) for participating in the Joint Research.

Conflicts of Interest

The author declares no conflict of interest.

List of Symbols

bcolumn width
bcolumn width excluding hollow cross-section
Dcross-section height of column
deffective cross-section height of column
EsYoung’s modulus
εcuultimate concrete strain at the compression fiber
Fccompressive strength of concrete
h0clear height
h0′height between both full hollow sections
ηaxial force ratio
jmoment arm length from compressive to tensile resultant force
M/Qshear span ratio
Muultimate flexural moment capacity at solid section
Muultimate flexural moment capacity at fully hollowed section
Naxial force
ptlongitudinal tensile reinforcement ratio
pwtransverse reinforcement ratio
Qmuultimate flexural strength
Qsu,meanultimate shear strength
Rdrift angle
rhollow section ratio
σ0axial stress
σwyyield strength of transverse reinforcement
heqequivalent viscous damping ratio

References

  1. Chung, Y.S.; Han, G.H.; Lee, K.K.; Lee, D.H. Quasistatic test for seismic performance of circular hollow RC bridge pier. J. Earthq. Eng. Soc. Korea 1999, 3, 41–54. (In Korean) [Google Scholar]
  2. Lee, J.H.; Choi, J.H.; Hwang, D.K.; Kwahk, I.J. Seismic Performance of Circular Hollow RC Bridge Columns. J. Civ. Eng. 2015, 19, 1456–1467. [Google Scholar] [CrossRef]
  3. Osada, K.; Yamaguchi, T.; Ikeda, S. Seismic performance and the strengthening of hollow circular RC piers having reinforced cut-off planes and variable wall thickness. Concr. Res. Technol. 1999, 10, 13–24. (In Japanese) [Google Scholar] [CrossRef]
  4. Ranzo, G.; Priestley, M.J.N. Seismic performance of large RC circular hollow columns. In Proceedings of the 12th World Conference on Earthquake Engineering, Auckland, New Zealand, 30 January–4 February 2000. [Google Scholar]
  5. Sun, C.H.; Kim, I.H. Improvement of seismic detailing of bridge columns with hollow sections. J. Earthq. Eng. Soc. Korea 2011, 15, 75–78. (In Korean) [Google Scholar]
  6. Whittaker, D.; Park, R.; Carr, A.J. Experimental tests on hollow circular concrete columns for use in offshore concrete platforms. In Proceedings of the Pacific Conference on Earthquake Engineering, Wairakei, New Zealand, 5–8 August 1987. [Google Scholar]
  7. Yeh, Y.-K.; Mo, Y.L.; Yang, C.Y. Seismic performance of hollow circular bridge piers. ACI Struct. J. 2001, 98, 62–871. [Google Scholar]
  8. Won, D.; Kim, S.; Seo, J.; Kang, Y.J. Experimental study of composite hollow RC column under uniaxial compressive load. Appl. Sci. 2019, 9, 373. [Google Scholar] [CrossRef]
  9. Liang, X.; Sritharan, S. Effects of confinement in circular hollow concrete columns. J. Struct. Eng. 2018, 144, 1–13. [Google Scholar] [CrossRef]
  10. Calvi, G.M.; Pavese, A.; Rasulo, A.; Bolognini, D. Experimental and numerical studies on the seismic response of RC hollow bridge piers. Bull. Earthq. Eng. 2005, 3, 267–297. [Google Scholar] [CrossRef]
  11. Han, Q.; Du, X.; Zhou, Y.; Lee, G.C. Experimental study of hollow rectangular bridge column performance under vertical and cyclically bilateral loads. Earthq. Eng. Eng. Vib. 2013, 12, 433–445. [Google Scholar] [CrossRef]
  12. Mander, J.B.; Priestley, M.J.N.; Park, R. Behavior of ductile hollow reinforced concrete columns. Bull. N. Z. Soc. Earthq. Eng. 1983, 16, 273–290. [Google Scholar]
  13. Pinto, A.; Molina, J.; Tsionis, G. Cyclic tests on large-scale models of existing bridge piers with rectangular hollow cross-section. Earthq. Eng. Struct. Dyn. 2003, 32, 1995–2012. [Google Scholar] [CrossRef]
  14. Shen, Y.; Gu, S. Shake table test for reinforced concrete hollow rectangular pier. J. Archit. Civ. Eng. 2018, 35, 28–133. [Google Scholar]
  15. Shen, Y.; Wei, B. Shaking Table Test Study on Seismic Performance of Hollow Rectangular Piers. Adv. Civ. Eng. 2019, 2019, 7508759. [Google Scholar] [CrossRef]
  16. Mo, Y.L.; Nien, I.C. Seismic performance of hollow high-strength concrete bridge columns. J. Bridge Eng. 2002, 7, 338–349. [Google Scholar] [CrossRef]
  17. Yeh, Y.-K.; Mo, Y.L.; Yang, C.Y. Full-scale tests on rectangular hollow bridge piers. Mater. Struct. 2002, 35, 117–125. [Google Scholar] [CrossRef]
  18. Yeh, Y.-K.; Mo, Y.L.; Yang, C.Y. Seismic performance of rectangular hollow bridge columns. J. Struct. Eng. 2002, 128, 60–68. [Google Scholar] [CrossRef]
  19. Kim, S.; Hong, H.; Han, T. Behavior of an internally confined hollow reinforced concrete column with a polygonal cross-section. Appl. Sci. 2021, 11, 4302. [Google Scholar] [CrossRef]
  20. Martínez-Martín, F.; Yepes, V.; González-Vidosa, F.; Hospitaler, A.; Alcalá, J. Optimization design of RC elevated water tanks under seismic loads. Appl. Sci. 2022, 12, 5635. [Google Scholar] [CrossRef]
  21. Kondo, I.; Suzuki, T.; Sugino, H. Damage control design of flexible RC tall building using high-strength materials. AIJ J. Technol. Des. 2001, 14, 73–78. (In Japanese) [Google Scholar] [CrossRef] [PubMed]
  22. Morooka, S.; Kunieda, H.; Ogiwara, Y. Estimation of bending rigidity and stress concentration of circular hole void slab. AIJ J. Technol. Des. 2002, 67, 133–137. (In Japanese) [Google Scholar]
  23. Matsushita, F.; Shibata, S.; Nakamura, F.; Asano, T. Durability improvement for autoclaved aerated concrete (AAC): Development of high carbonation-resistant AAC. AIJ J. Technol. Des. 1999, 5, 33–36. (In Japanese) [Google Scholar] [CrossRef] [PubMed]
  24. Architectural Institute of Japan (AIJ). AIJ Standard for Structural Calculation of Reinforced Concrete Structures; Architectural Institute of Japan: Tokyo, Japan, 2018. [Google Scholar]
  25. Popovics, S. A Numerical Approach to the Complete Stress-Strain Curve of Concrete. Cem. Concr. Res. 1973, 3, 583–599. [Google Scholar] [CrossRef]
  26. ITOCHU Techno-Solutions Corporation. Concrete Structures Non-Linear Finite Element Analysis Program FINAL ver.11; ITOCHU Techno-Solutions Corporation: Tokyo, Japan, 2019. (In Japanese) [Google Scholar]
  27. Naganuma, K.; Ohkubo, M. An analytical model for reinforced concrete panels under cyclic stresses. J. Struct. Constr. Eng. 2000, 536, 135–142. (In Japanese) [Google Scholar] [CrossRef]
  28. Ahmad, S.H.; Shah, S.P. Complete Triaxial Stress-Strain Curve for Concrete. J. Struct. Div. 1982, 108, 728–742. [Google Scholar] [CrossRef]
  29. Naganuma, K. Stress-strain relationship for concrete under triaxial compression. J. Struct. Constr. Eng. 1995, 474, 163–170. (In Japanese) [Google Scholar] [CrossRef]
  30. Nakamura, H.; Higai, T. Compressive Fracture Energy and Fracture Zone Length of Concrete. Semin. Post Peak Behav. RC Struct. Subj. Seism. Load 1999, 2, 259–272. [Google Scholar]
  31. Ottosen, N.S. A failure criterion for concrete. J. Eng. Mech. 1977, 103, 527–535. [Google Scholar] [CrossRef]
  32. Izumo, J.; Shima, H.; Okamura, H. Analytical model for reinforced concrete panel elements subjected to in-plane forces. In Proceedings of the Japan Concrete Institute, Tokyo, Japan, 1–3 July 1987. (In Japanese). [Google Scholar]
  33. Ciampi, V.; Eligehausen, R.; Bertero, V.V.; Popov, E.P. Analytical Model for Concrete Anchorages of Reinforcing Bars under Generalized Excitations; Report NO. UCB/EERC-82/23; University of Berkeley: Berkeley, CA, USA, 1982. [Google Scholar]
  34. Naganuma, K.; Yonezawa, K.; Kurimoto, O.; Eto, H. Simulation of nonlinear dynamic response of reinforced concrete scaled model using three-dimensional finite element method. In Proceedings of the 13th World Conference on Earthquake Engineering, Vancouver, BC, Canada, 1–6 August 2004. [Google Scholar]
  35. Architectural Institute of Japan (AIJ). Design Guidelines for Earthquake Resistant Reinforced Concrete Buildings Based on Inelastic Displacement Concept; Architectural Institute of Japan: Tokyo, Japan, 1999. [Google Scholar]
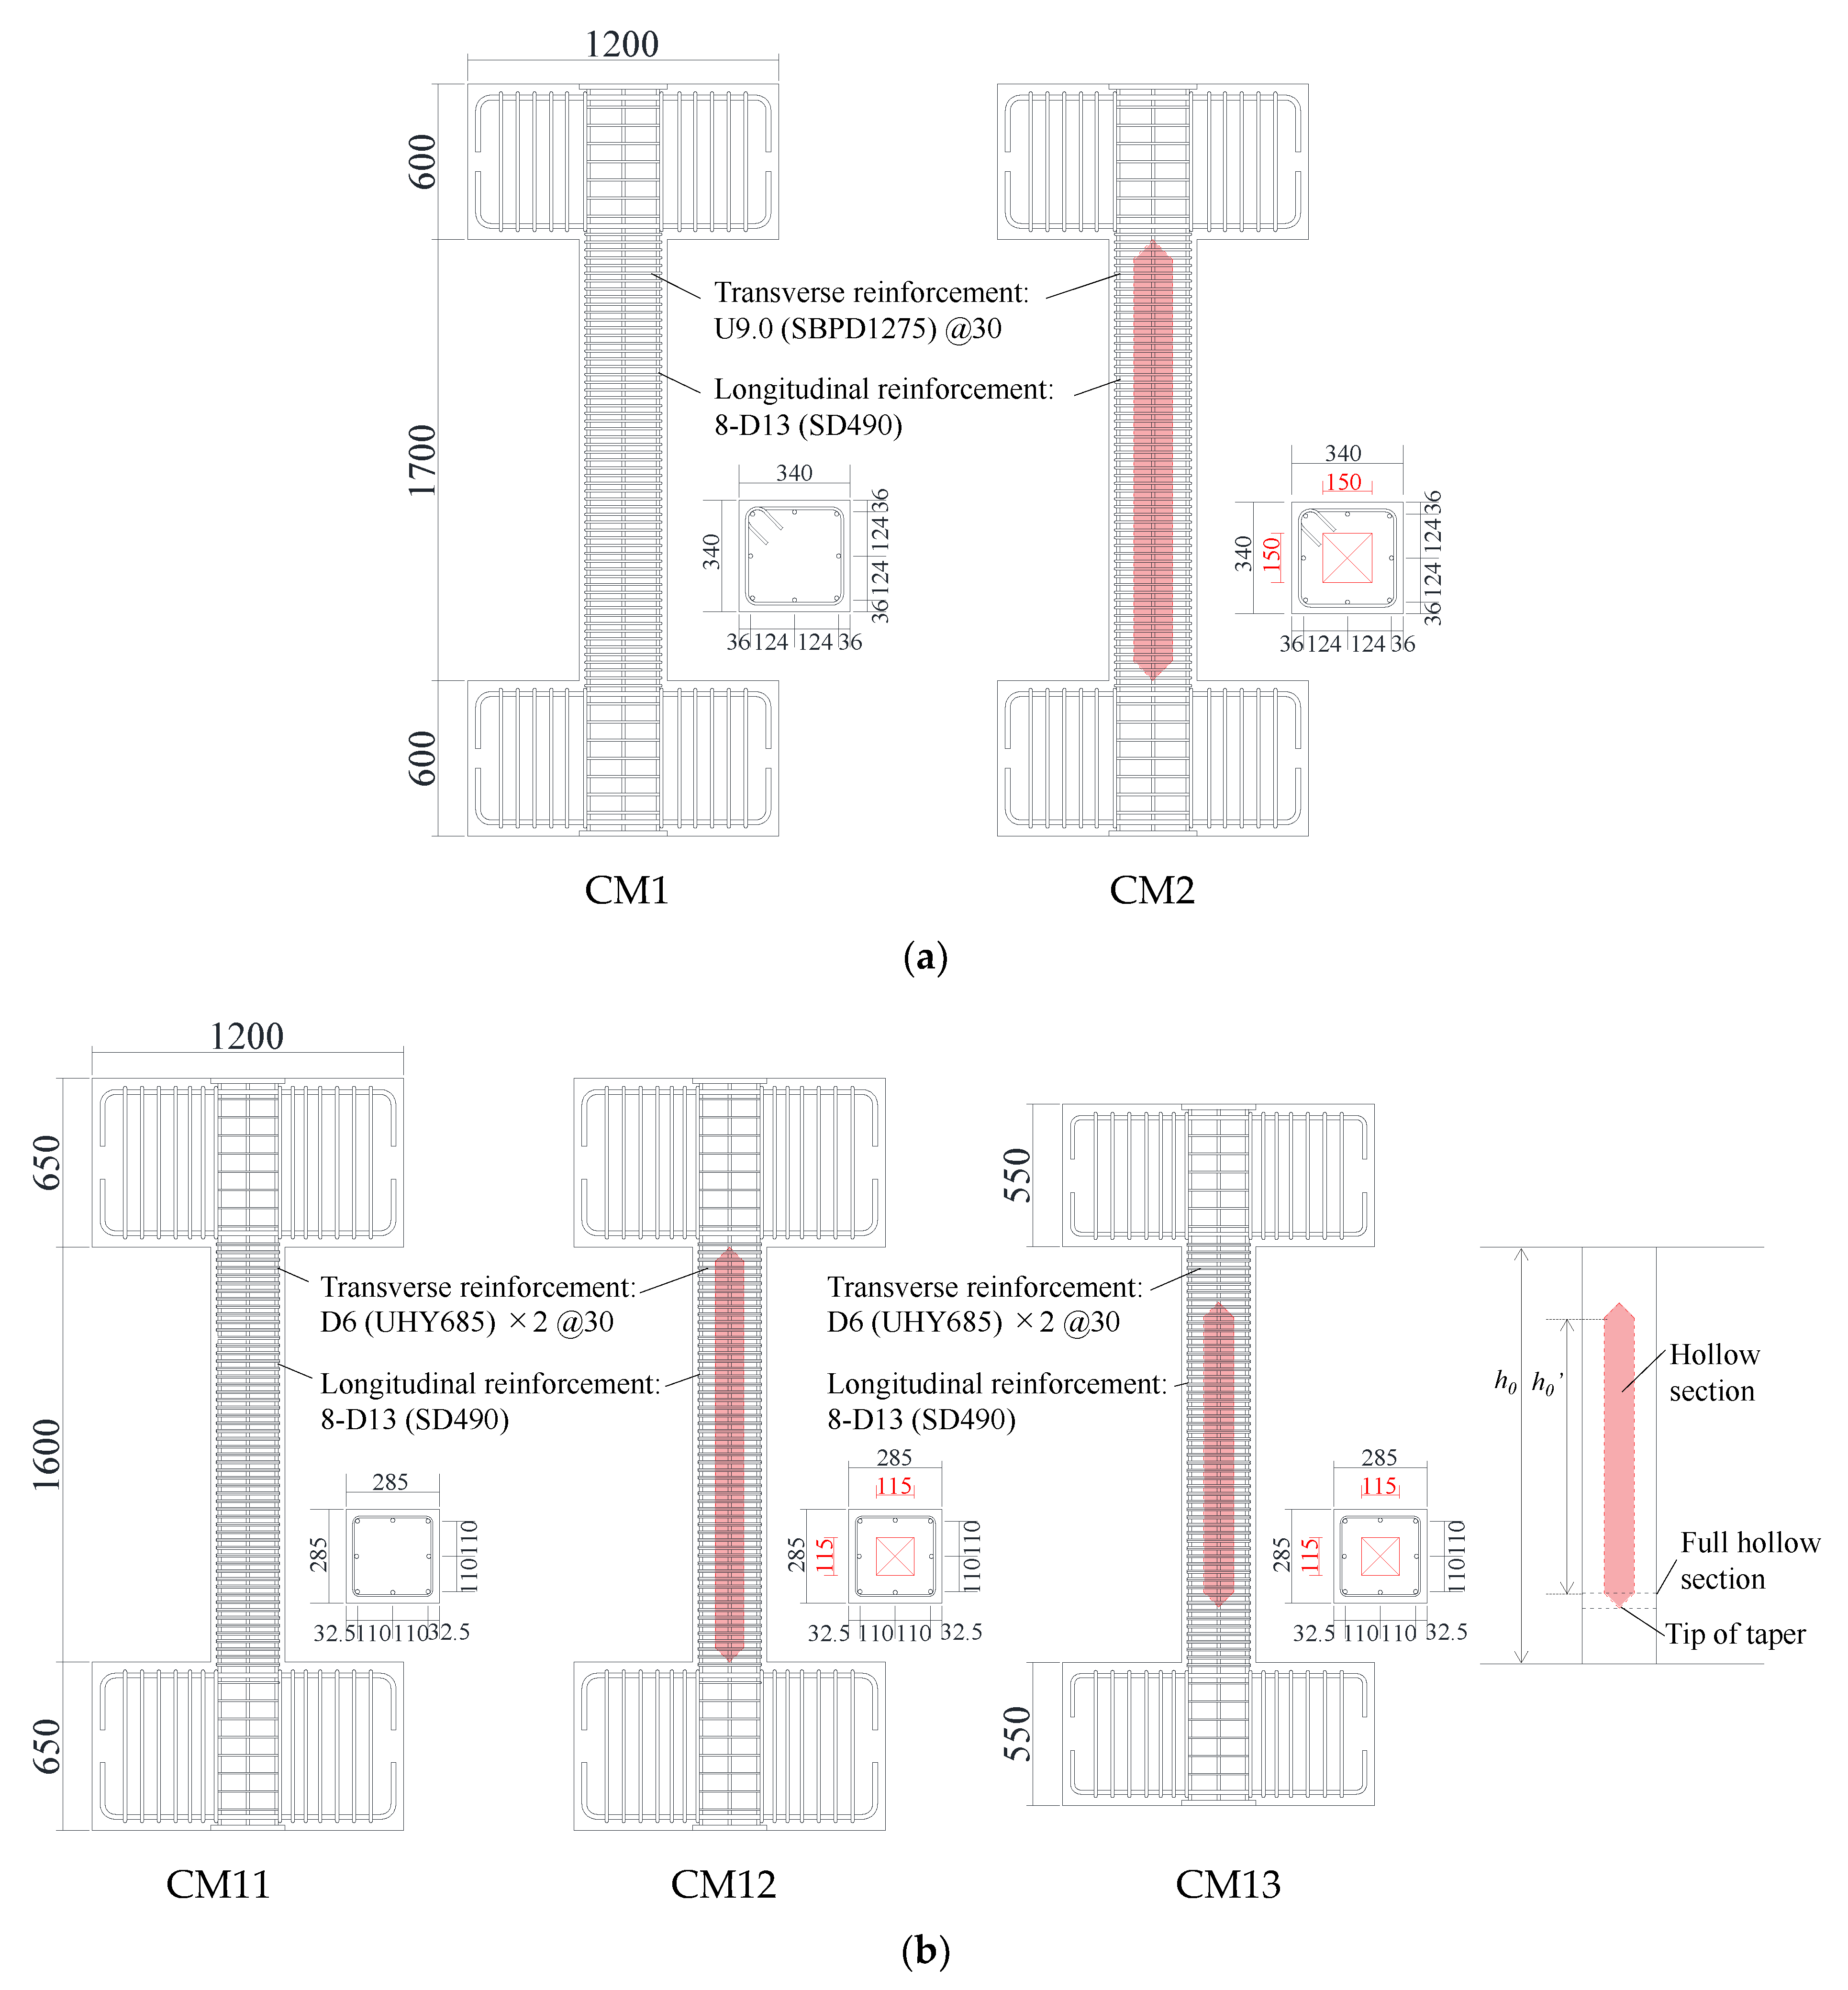
Figure 1. Specimen details: (a) N-series; (b) S-series.
Applsci 13 02234 g001
Figure 2. Calculation method of Qmu.
Applsci 13 02234 g002
Figure 3. Test setup (example of CM11).
Applsci 13 02234 g003
Figure 4. Details of measurement schemes (example of CM1).
Applsci 13 02234 g004
Figure 5. Strain gauges on longitudinal and transverse reinforcement.
Applsci 13 02234 g005
Figure 6. Hysteresis curves: (a) N-series; (b) S-series.
Applsci 13 02234 g006
Figure 7. Crack patterns: (a) N-series; (b) S-series.
Applsci 13 02234 g007
Figure 8. Strain distributions of longitudinal reinforcement (R = 1.0%): (a) N-series; (b) S-series.
Applsci 13 02234 g008aApplsci 13 02234 g008b
Figure 9. Strain distributions of transverse reinforcement (R = 1.0%): (a) N-series; (b) S-series.
Applsci 13 02234 g009
Figure 10. Calculation method of deformation: (a) rotation angle by flexural deformation; (b) shear strain by shear deformation.
Applsci 13 02234 g010
Figure 11. Deformation distribution: (a) N-series (R = 4.0%); (b) S-series (R = 2.0%).
Applsci 13 02234 g011
Figure 12. Equivalent viscous damping ratios: (a) N-series; (b) S-series.
Applsci 13 02234 g012
Figure 13. Neutral axis positions at ultimate flexural state by cross-sectional analysis: (a) CM2; (b) CM12 and CM13.
Applsci 13 02234 g013
Figure 14. Geometry of Finite element model and meshing.
Applsci 13 02234 g014
Figure 15. Stress–strain hysteretic model: (a) concrete; (b) steel.
Applsci 13 02234 g015
Figure 16. Bond-slip model between concrete and reinforcement.
Applsci 13 02234 g016
Figure 17. Comparison of hysteresis curves: (a) N-series; (b) S-series.
Applsci 13 02234 g017aApplsci 13 02234 g017b
Figure 18. Minimum principal stress distribution of concrete (R = 1.0%): (a) CM12; (b) CM13.
Applsci 13 02234 g018
Table 1. Specimen properties.
SeriesSpecimenCross-SectionTip Position
of Taper *b
Longitudinal
Reinforcement
Transverse ReinforcementAxial Force (kN)
(η: Axial Force Ratio)
Solid/
Hollow
r *a
NCM1solid1.00 8-D13
(SD490)
U9.0@30
(SBPD1275)
1400 (0.16)
CM2hollow0.810D
SCM11solid1.00 8-D13
(SD490)
D6 × 2@30
(UHY685)
1800 (0.28)
CM12hollow0.840D1800 (0.30)
CM130.75D1800 (0.28)
*a r: Hollow section ratio. *b Distance from column end.
Table 2. Material characteristics of reinforcement.
Yield Strength (MPa) *aYield Strain (μ) *a
D13 (SD490)5372944
D6 (UHY685)7005426
U9.0 (SBPD1275)13738884
*a Strength and strains by 0.2% offset method.
Table 3. Material characteristics of concrete.
SeriesSpecimenCompressive Strength (MPa)Tensile Strength (MPa)
NCM1744.47
CM2934.85
SCM11784.11
CM12884.60
CM13954.38
Table 4. Concrete mix proportion (kg/m3).
SeriesSpecimenCementWaterSandGravelAdmixture
S1 *aS2 *b
NCM15231885383707006.54
CM26721883872648508.74
SCM115231885383707006.54
CM126721883872648508.74
CM136721883872648508.74
*a Land sand. *b Crushed sand.
Table 5. Strength calculation results.
SeriesSpecimenQmu (kN)Qsu,mean (kN)Qsu,mean/Qmu
NCM1305.3598.71.96
CM2317.9435.31.37
SCM11272.9442.01.62
CM12285.6321.61.13
CM13293.1327.91.12
Table 6. Maximum strength by experiment and calculation (cross-sectional analysis).
SeriesSpecimenExperiment (kN)Calculation
(Cross-Sectional Analysis) (kN)
Experiment/Calculation
Positive LoadingNegative LoadingPositive LoadingNegative Loading
NCM1310.5−353.6305.31.021.16
CM2328.5−335.6317.91.031.06
SCM11276.9−284.8272.91.011.04
CM12284.5−288.8285.61.001.01
CM13297.3−298.2293.11.011.02
Table 7. Maximum strength by calculation (FEM analysis) and experiment.
SeriesSpecimenCalculation (FEM) (kN)Experiment (kN)Calculation (FEM)/Experiment
Positive L.Negative L.Positive L.Negative L.Positive L.Negative L.
NCM1332.7−317.2310.5−353.61.070.90
CM2308.9−305.7328.5−335.60.940.91
SCM11253.6−235.8276.9−284.80.920.83
CM12275.7−255.4284.5−288.80.970.88
CM13279.3−246.3297.3−298.20.940.83
Disclaimer/Publisher’s Note: The statements, opinions and data contained in all publications are solely those of the individual author(s) and contributor(s) and not of MDPI and/or the editor(s). MDPI and/or the editor(s) disclaim responsibility for any injury to people or property resulting from any ideas, methods, instructions or products referred to in the content.