1. Introduction
A recent review provides a comprehensive overview about climate change effects in the Baltic Sea region [
1]. Examples are increasing air and water temperatures, longer warm and cold spells, reduced snow and ice in winter, increasing risks of heavy precipitation and droughts, and changes in solar radiation, cloudiness, river discharge and salinity. These changes cause multiple problems and threats, not only for the flora and fauna in coastal and marine ecosystems, but also for society [
1].
For coastal areas, climate-change-induced sea level rise is the main problem. The sea level rise in the Baltic Sea is close to the global average of 3–4 mm per year, with significant differences between Baltic regions and depending on the assessed time period. The sea level will continue to rise at an increasing rate and in 2100 may be 1 m higher compared to the 1990s [
1]. The south-western Baltic Sea faces an additional problem: a sinking coast by about 0.5 mm per year [
2] resulting from glacial isostatic subsidence. Therefore, climate change and sea level rise are an increasing problem, especially for the south-western Baltic Sea coast.
The Baltic Sea is a micro-tidal sea, with a tidal range of about 0.2 m only. Storm surges in the western Baltic frequently cause increased sea levels of 1–1.5 m, with a maximum sea level above 3 m observed in 1872. Extreme sea levels become more frequent with rising mean sea level [
3] and are a hazard for the low-lying coasts of the southwestern Baltic Sea region.
Climate change at the southern Baltic Sea coast requires fast adaptation. In general, adaptation has to take place not only on a local scale but also integrated at large scales to avoid a shift of risks from one area to another [
4]. Therefore, coasts need effective and comprehensive climate change and sea level rise adaptation planning. However, presently the list of short-comings is long: legal frameworks are partly lacking [
5], and while many strategic plans exist, e.g., [
6,
7], strategies, infrastructures and coordination hubs are often perceived as weak and insufficient [
8,
9]. In England, for example, the existing national coastal change adaptation policies, specifically Coastal Change Management Areas, are hardly designated at a local level [
10]. Another example is New Zealand, where Boston and Lawrence [
11] consider current planning, regulatory and funding frameworks as ill-equipped.
Spatial planning provides the umbrella for climate change adaptation. In European Union (EU) member states, spatial planning is influenced by a variety of legislations and policies, including the directives on Strategic Environmental Assessment and Environmental Impact Assessment, the Birds and Habitats Directives, the Water Framework and the Floods Directive. Spatial planning for the coastal zone specifically was originally intended to be part of the Maritime Spatial Planning (MSP) Directive (2014/89/EU), combining Integrated Coastal Zone Management (ICZM) and MSP. However, in the process of adopting the directive, the coastal waters were excluded due to diverging political interests [
12]. Therefore, spatial planning for the coastal zone is not directly regulated by EU legislation but only influenced by the above-mentioned policies, which can hamper coherent planning across borders [
13]. However, one region in the EU—the Baltic Sea—can be regarded as a forerunner in policies development and implementation because of a long tradition in cross-country cooperation through the Baltic Marine Environment Protection Commission (HELCOM), a key institutional actor.
For many coastal regions, sets of climate change adaptation measures exist. For example, Baills et al. [
14] review 51 measures suitable for parts of the French coast. However, a lack of public support for coastal adaptation hampers implementation [
15] and, in case of implementation, assessment of the outcomes and impacts of the adaptation measures is lacking [
16]. Here, ecosystem services assessment approaches could be beneficial and could complement planning. In the Millennium Ecosystem Assessment [
17], ecosystem services are defined as benefits humans obtain from ecosystems. The absolute quantification of many ecosystem services of an area is difficult, hardly reliable and time-consuming. Alternative approaches compare different measures (e.g., coastal protection measures) after their implementation, in different locations or in different times with respect to relative changes in ecosystem service provision. Several examples show that this allows for addressing a larger set of ecosystem services in an efficient way by involving stakeholders and experts. Such ecosystem service assessments allow for the structure and guidance of discussions, increase social learning and exchange of ideas and, in the end, raise awareness and create a joint understanding of problems, risks and solutions, e.g., [
18,
19,
20,
21]. However, the approaches often focus on small-scale applications and/or single measures. An integration of ecosystems service assessments in planning and policy implementation is demanded often but is rare in practice. The question is: can ecosystem service assessments support and serve as an element in planning and speed up climate adaptation?
The objectives of this study are to (a) evaluate the potential of ecosystem service assessments in regional coastal climate change adaptation planning, based on two concrete but contrasting case studies, (b) critically assess the applicability of ecosystem service assessment approaches in future scenarios, (c) test alternative assessment methods and (d) critically reflect on the ability of planning approaches to deal with regional climate change at exposed coasts.
2. Study Site and Methods
2.1. Study Sites
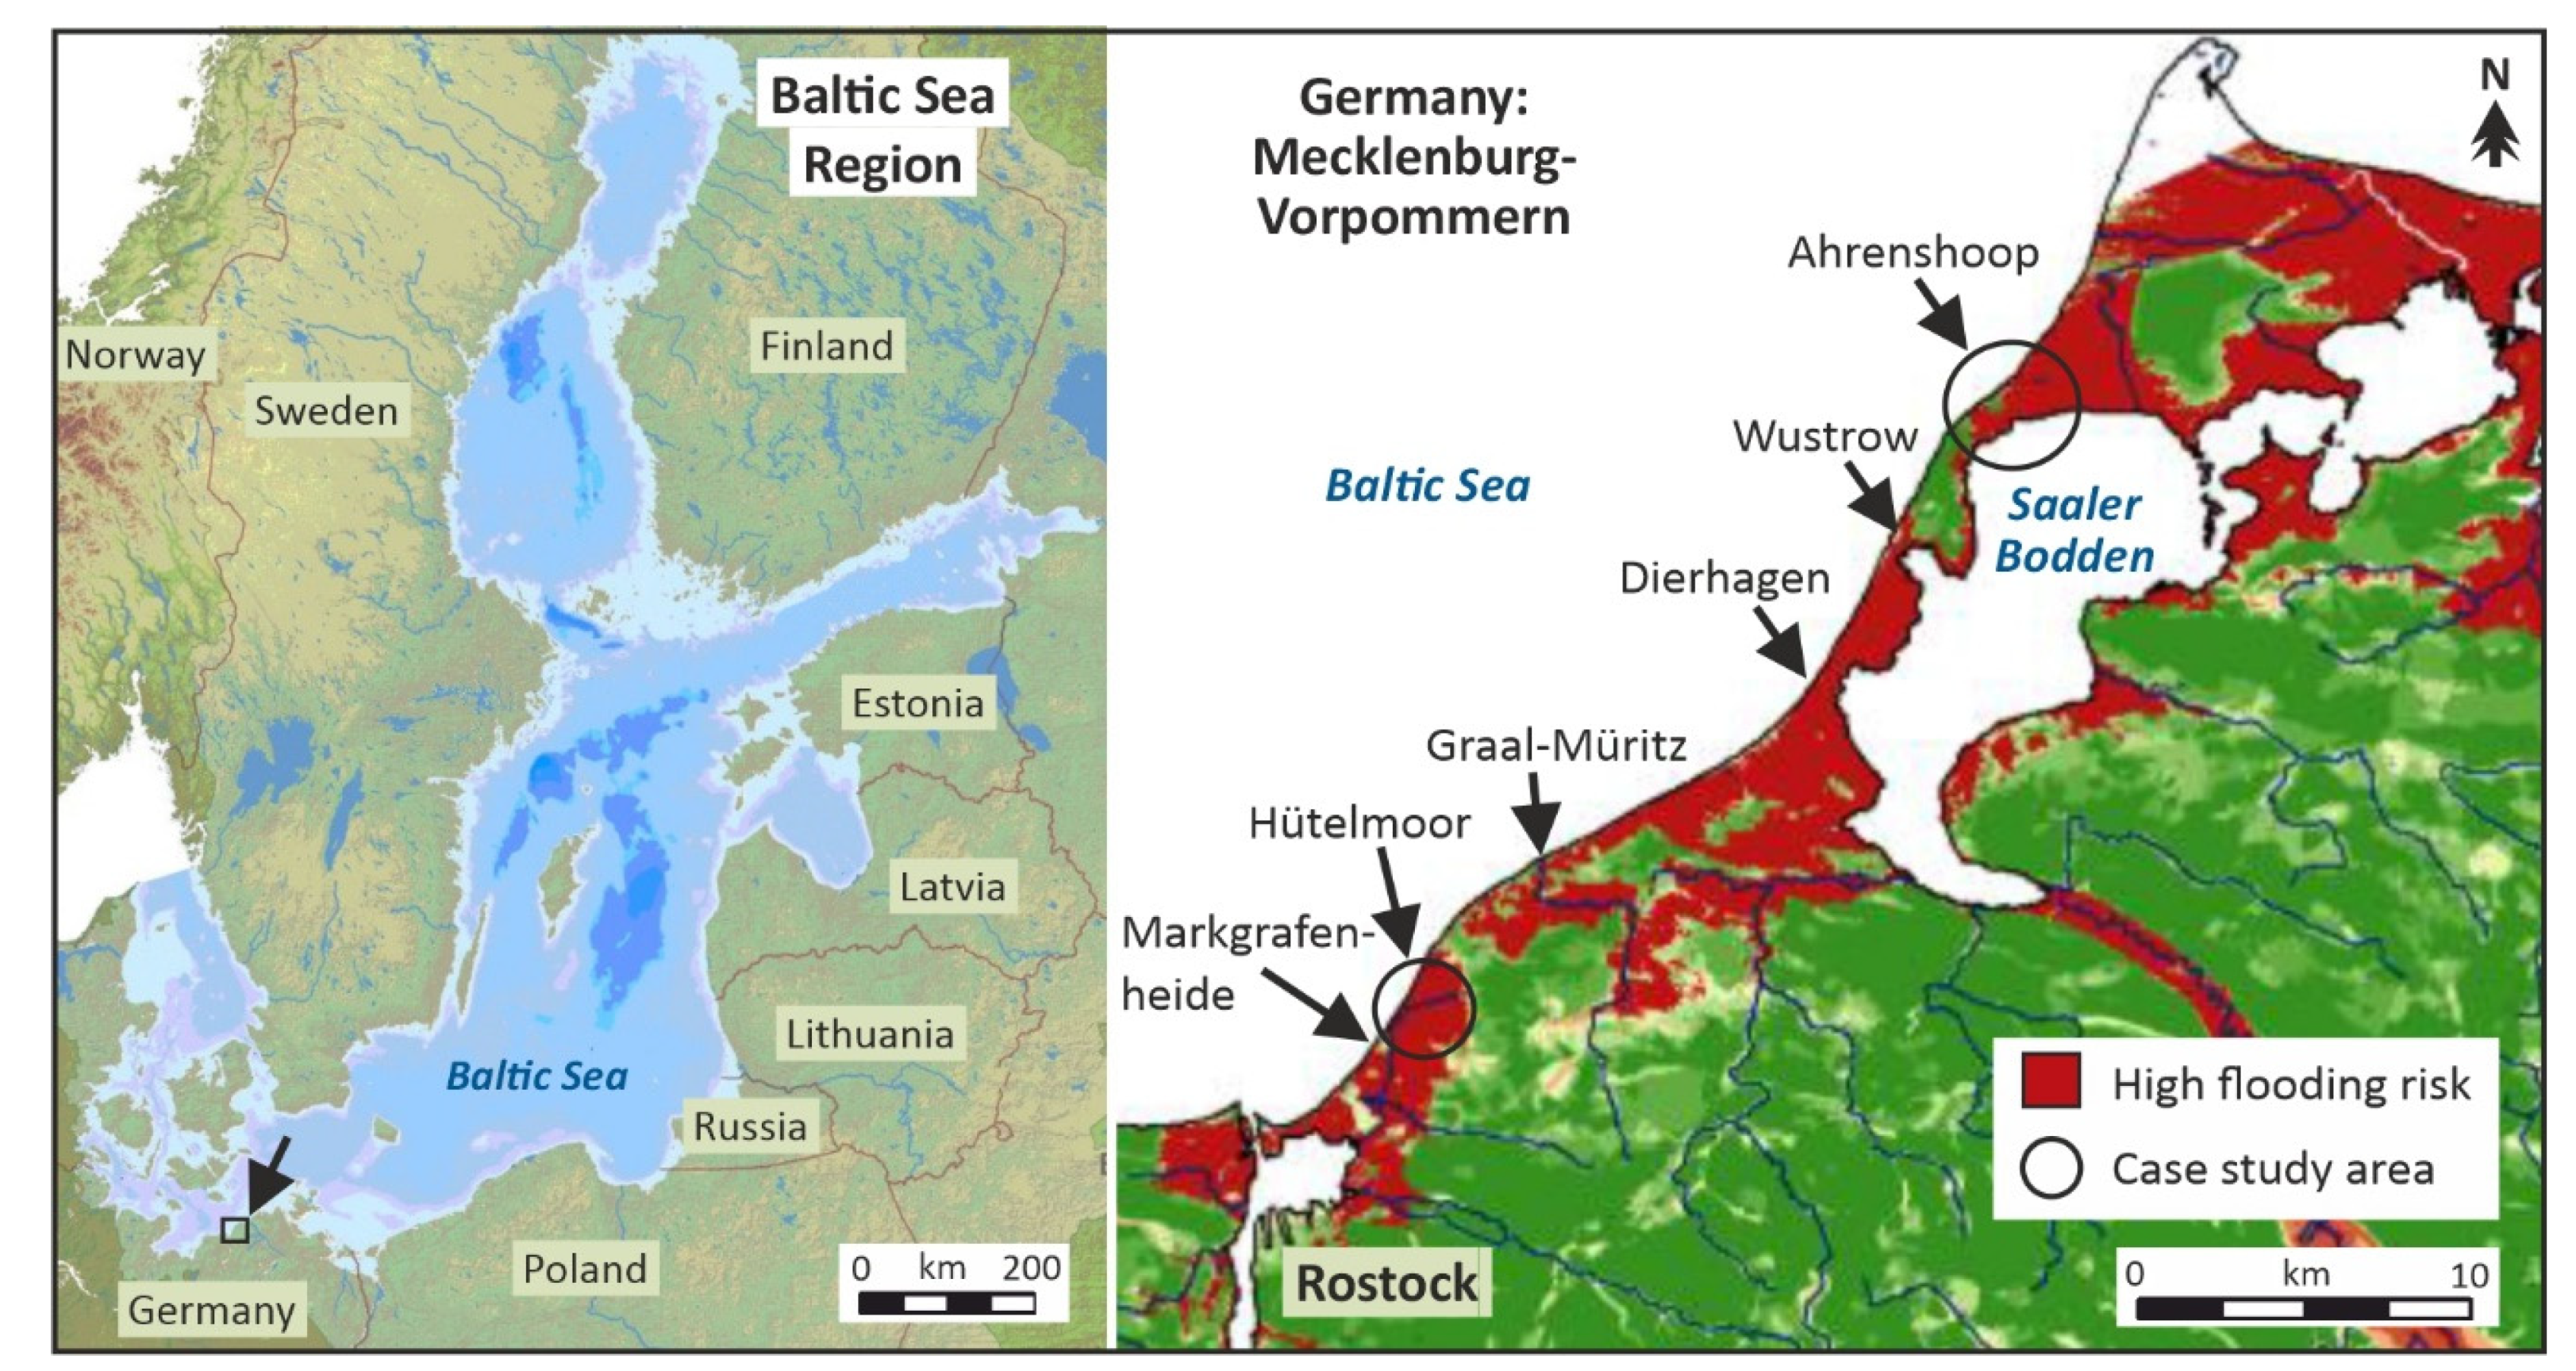
The German Baltic Sea coast is of glacial origin. The sandy sediments form long beaches and lowlands interrupted by cliffs. Most parts of the coast face strong coastal erosion and retreat. The coasts north-east of the city of Rostock are mainly only a few meters above sea level and have a very high flooding risk during storm surges (
Figure 1). The many shallow coastal lagoons, the so-called “Bodden”, cause an additional risk of flooding from the hinterland. Consequently, the entire area is very sensitive to ongoing sea-level rise. Two case study sites along the coast were selected, representing different situations: adaptation by coastal realignment and nature restoration in a rural area and hard protection measures in a touristic, built-up area.
The first case study is the Hütelmoor, a coastal wetland of about 540 ha. With 2.1 m per year (average over the last 100 years), the coastal retreat at the Hütelmoor is the highest observed at the German Baltic Sea coast [
23]. The Hütelmoor is subject to ecological restoration. At the coastline, a new coastal realignment concept was implemented. The coastline was not protected anymore and left to the natural coastal dynamics. The combined approach required coastal protection and environmental planning with links to regional spatial planning.
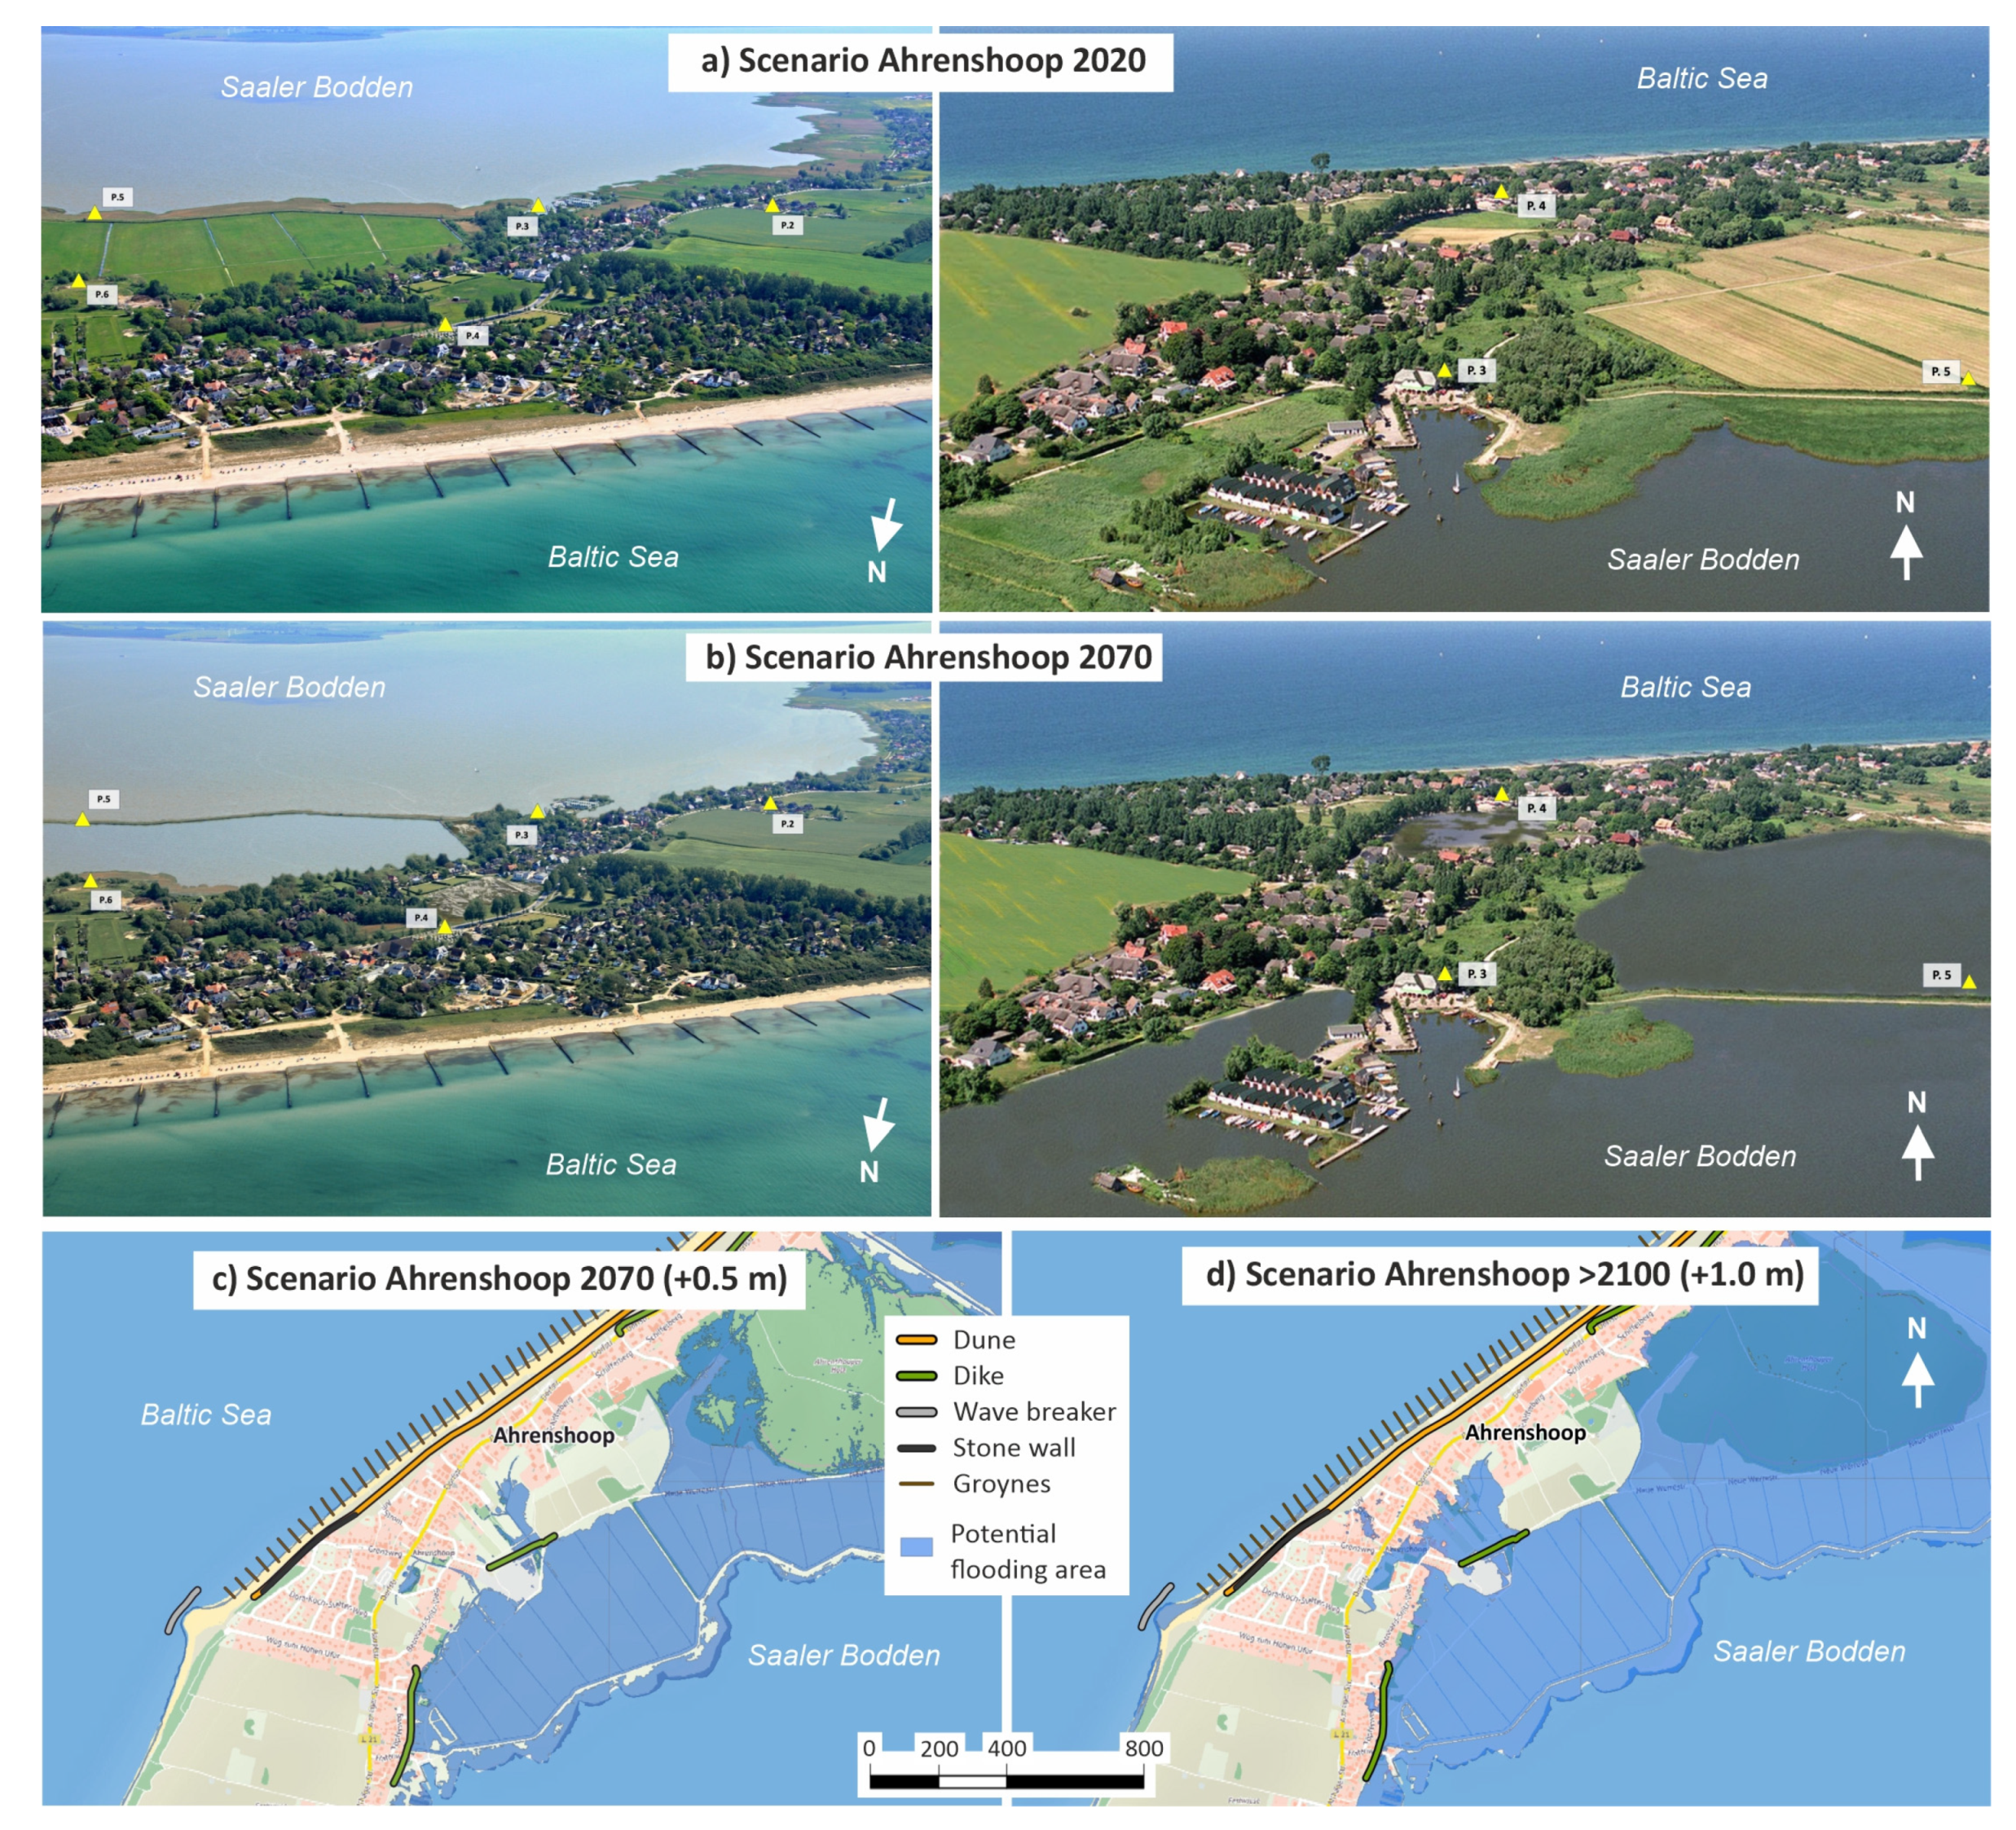
The second case study is the tourism resort Ahrenshoop on the Darss-Zingst peninsula (
Figure 1). In 2019, the town had only 653 inhabitants, but registered nearly 330,000 tourist overnight stays per year [
24]. Tourist activities are mostly related to landscape and nature experience such as hiking, bathing, cycling, horse riding, sailing, recreational fishing and wildlife observation. Ahrenshoop is located on a strip of land between the Baltic Sea and the Saaler Bodden. It is another coastal erosion hot spot with a coastal retreat between 0.5 and 1.7 m per year and is subject to intensive coastal protection measures (Tiepolt 2019, pers.com). The study site covers an area of 2.75 km
2. The beaches in front of the cliffs at the Baltic Sea coast are maintained by sand nourishment and hard protection. The inner coasts are protected by a dike.
The two case studies assess different aspects of planning and have different time horizons. For Hütelmoor, four scenarios represent the development of the area from the 1980s until a hypothetical situation in 2040. The focus is on environmental and coastal protection planning in a rural area and the consequences of a new, climate-change-adapted, coastal protection approach. Ahrenshoop has a longer perspective and compares the situation today with the hypothetical situation in 2070 in an urban area with intensive tourism. Here, the focus is more on regional spatial planning aspects and the ability to deal with climate change challenges. Criteria for the case study choice was that they reflected different aspects of planning and were located in areas with the highest risk of flooding. The term scenario refers to the description of a situation, independently of whether it describes a past, the present or a hypothetical future state.
2.2. Case Study Scenario-Coastal Realignment and Hütelmoor Restoration 1980–2040
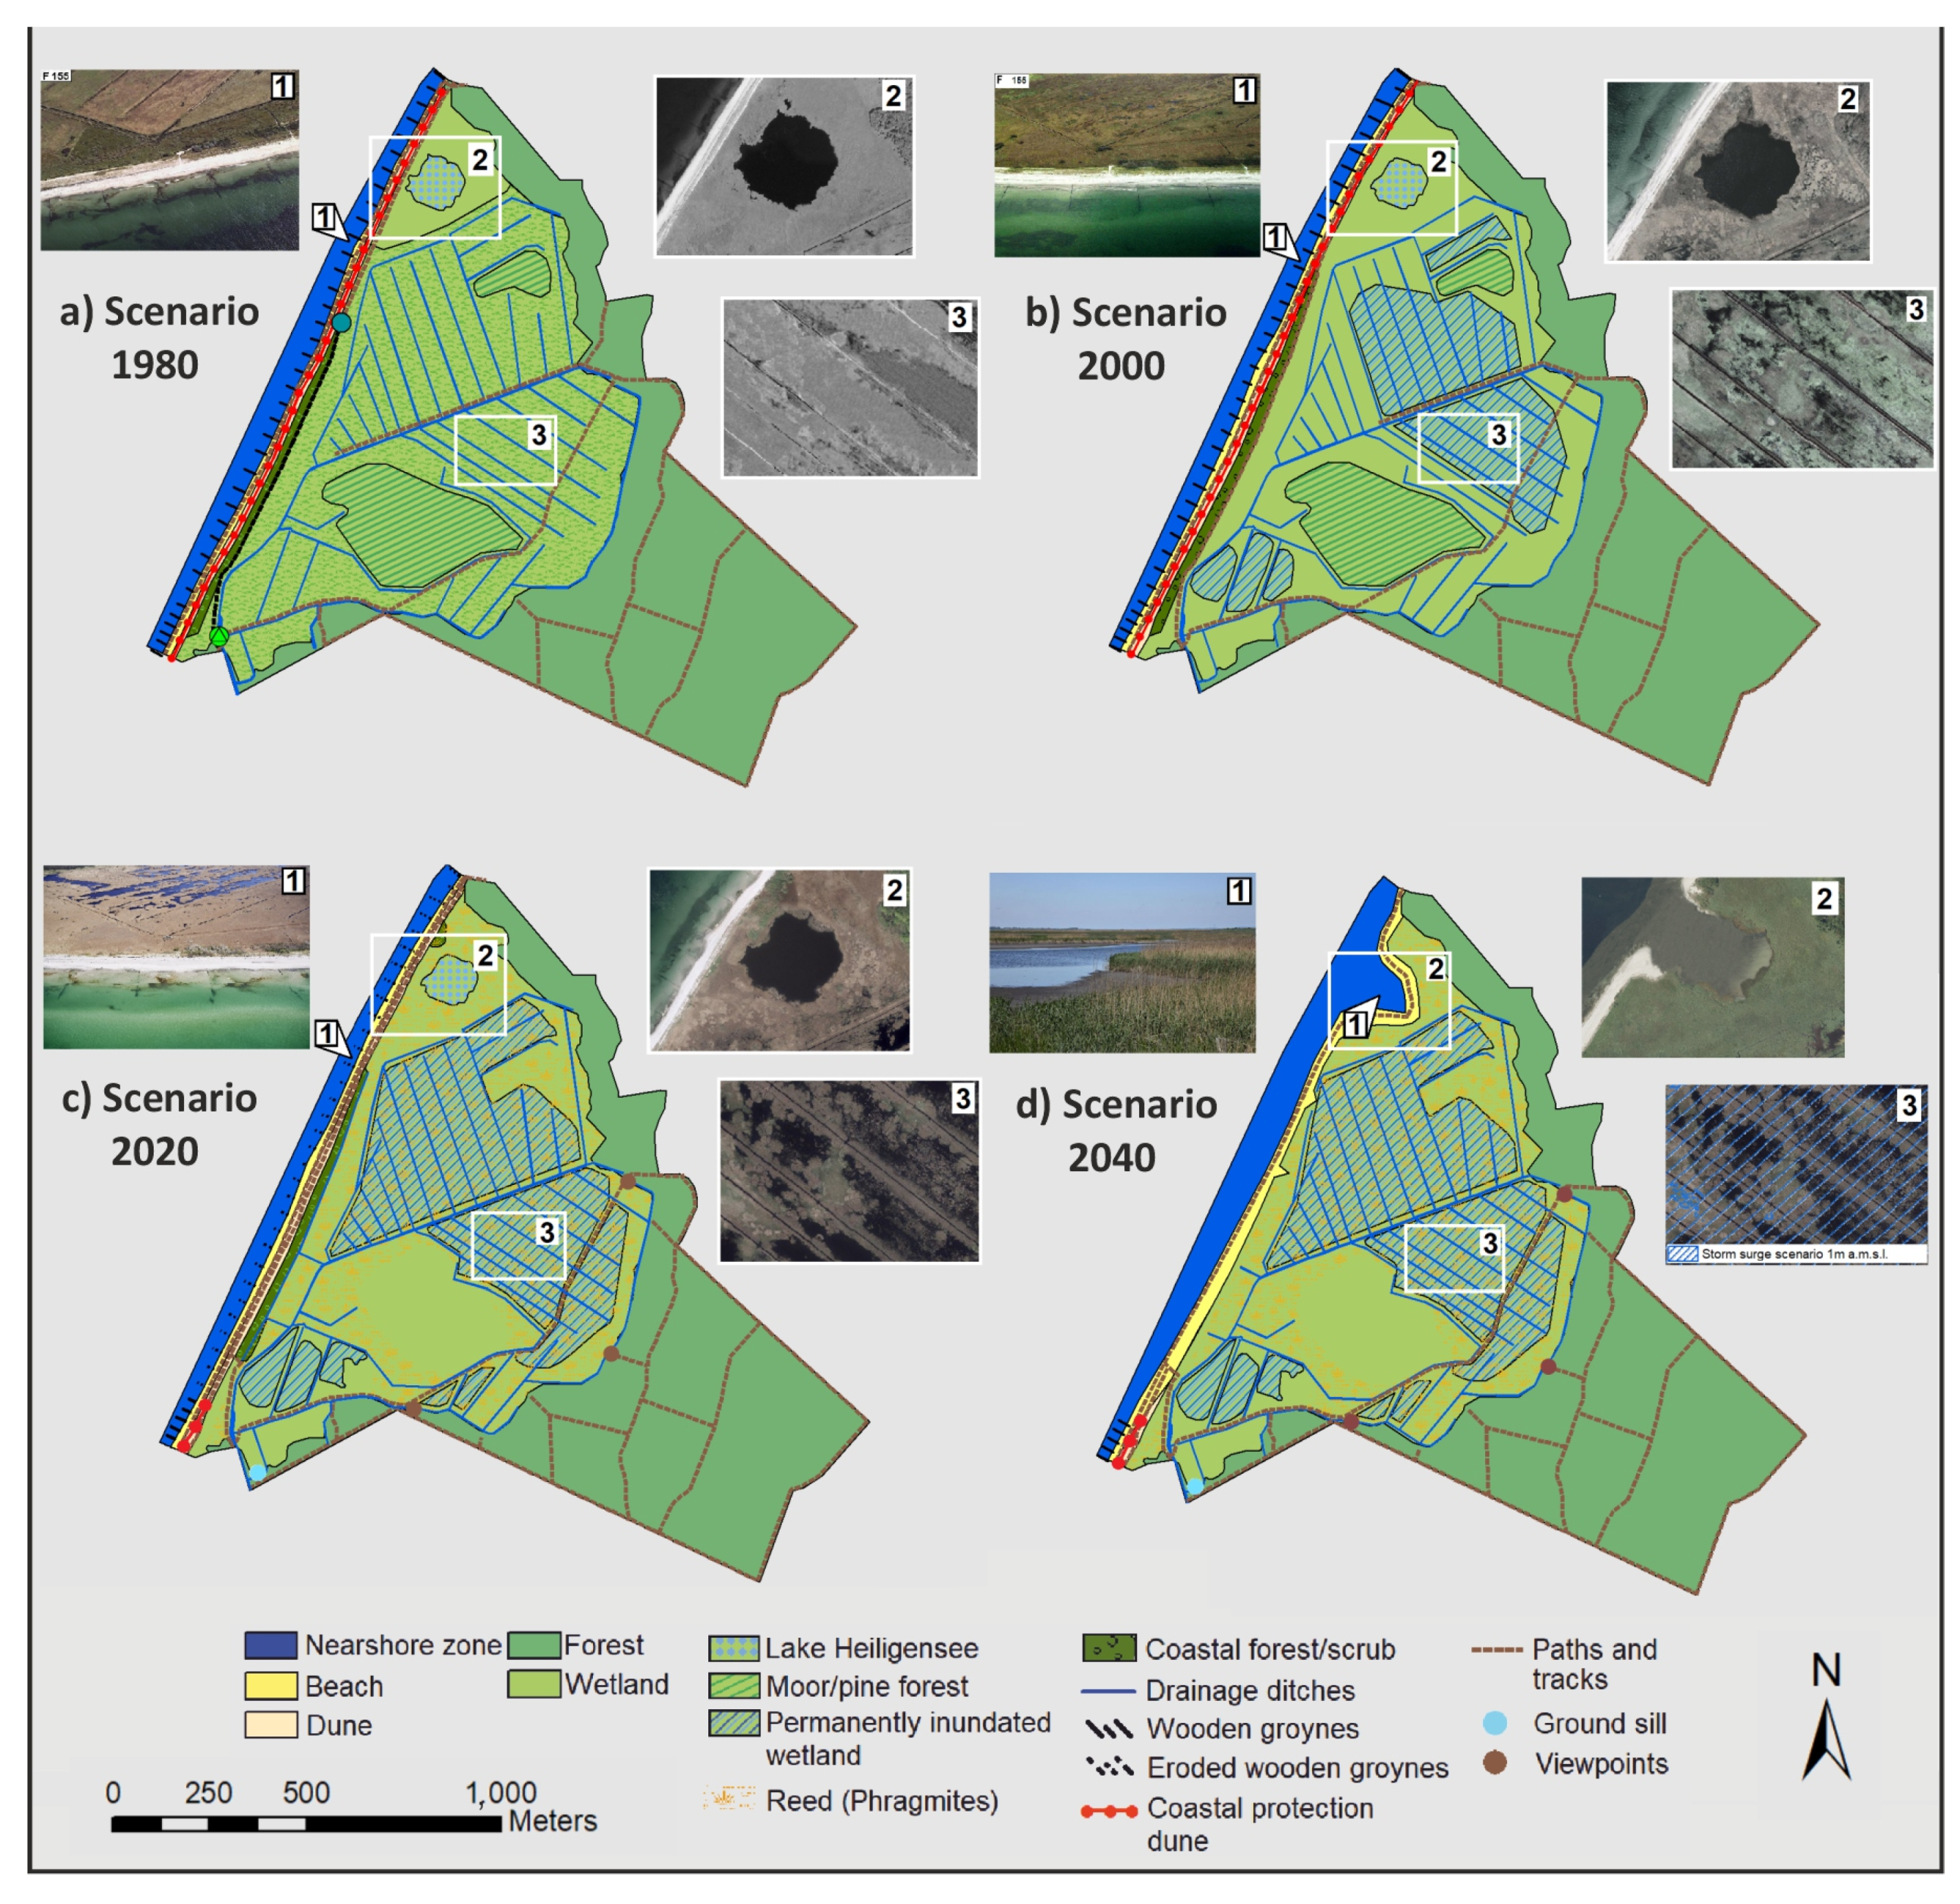
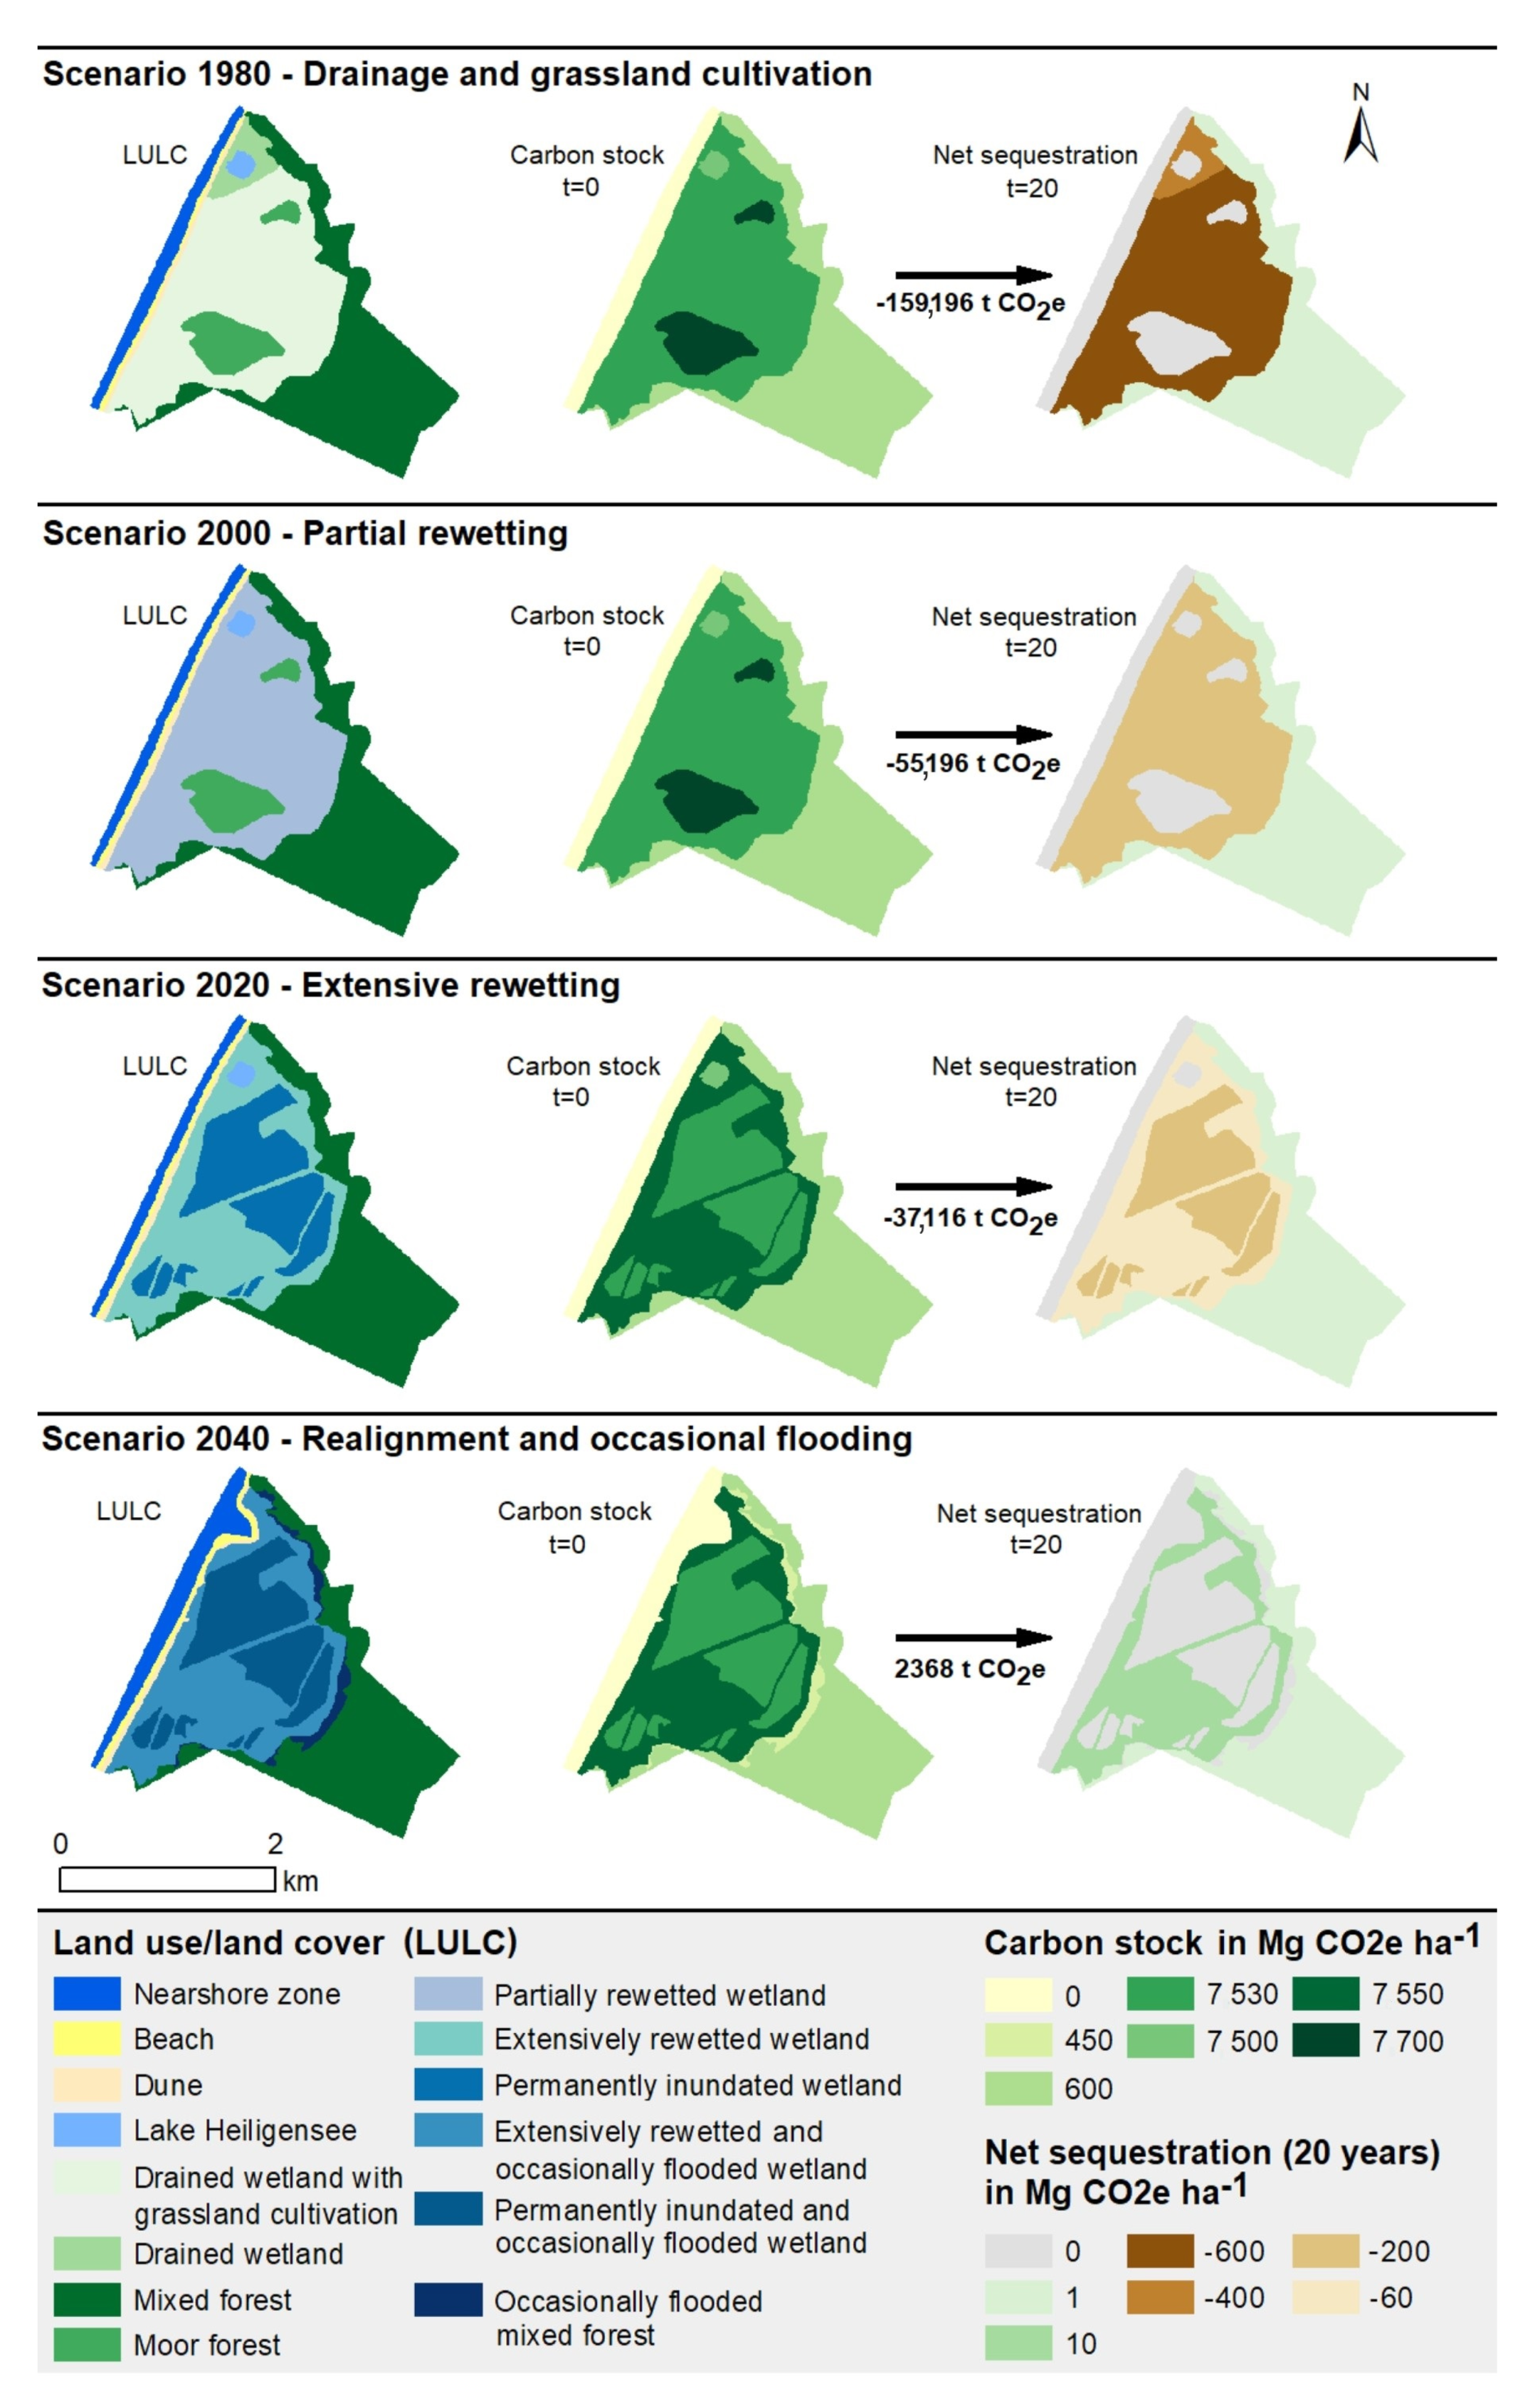
The coastline north-west of the seaside resort Markgrafenheide consists of sandy beaches and a narrow strip of dunes that separate the sea from the Hütelmoor, a coastal moor. The moor together with the coastal zone covers about 570 ha (
Figure 2). For centuries, the Hütelmoor was drained and used as pasture and for peat extraction. In 1957, it became a nature protection area. Despite that, agricultural use and the maintenance of the protective dunes went on until the early 1990s (scenario 1980) (
Figure 2a). After farming was abandoned, it became a recreational area for local inhabitants and tourists (scenario 2000) (
Figure 2b). As a response to ongoing sea level rise and heavy coastal erosion, the town Markgrafenheide was subject to comprehensive coastal protection measures, which were implemented until 2006. This enabled the restoration of the neighboring Hütelmoor. The groyne systems in front of the Hütelmoor were abandoned to allow for natural coastal dynamics and coastal re-alignment [
23].
The Hütelmoor was well drained until 2008, when the water level was elevated. The meadows were largely inundated in winter and partly even in summer. The area was transformed into a more natural state, with natural coastal lowland moor flora and fauna (scenario 2020). The increased water level stabilized the moor, preventing further peat decomposition and shrinking. Today, the high fresh water levels even enable a peat growth again and serve as hydrological protection for the forests against potential intrusion of saline water. The two complementing measures, the Hütelmoor restoration and the abandonment of coastal protection, enable a coastal dynamic. Ongoing coastal erosion is narrowing the beaches and the dune system.
During the next few decades, it is likely that dune breaches will occur during storms and cause temporary salt water intrusions to the Hütelmoor. This situation will transform the moor into a brackish system with a modified coastline (scenario 2040) (
Figure 2d). Details on the hydrological aspects are reported in Miegel et al. [
25]. Information on the technical implementation and a critical review of the public participation process can be found in the existing literature [
26,
27].
2.3. Case Study Scenario-Climate Change in Ahrenshoop 2020–2070
The scenario for Ahrenshoop is a hypothetical future scenario of the year 2070 (
Figure 3). The scenario visualizations are based on the following assumptions with a sea level rise of +0.5 m compared to 2020 based on [
28]. In this scenario, the inner coastal lowlands are inundated and the outer Baltic Sea coast shows narrower, but still protected beaches. It is assumed that sea level rise will cause saltwater intrusion into the groundwater. Until 2100, the temperatures are assumed to increase up to 3.7 °C compared to the reference period 1971–2000 [
29]. This leads to an increased number of summer days with more than 25 °C, and up to 4 °C increased sea surface temperatures [
30].
BACC [
30] also projects a decrease in summer and an increase in winter precipitation with consequences on the hydrological cycle. Higher evapotranspiration due to increased temperatures increases vegetation growth but reduces the availability of freshwater and decreases groundwater formation. Droughts, a shortage of drinking water, narrower beaches and inundated areas would be a problem for tourism. On the other hand, increased temperatures would extend the bathing and tourism season. These aspects were taken into account in the scenario as well.
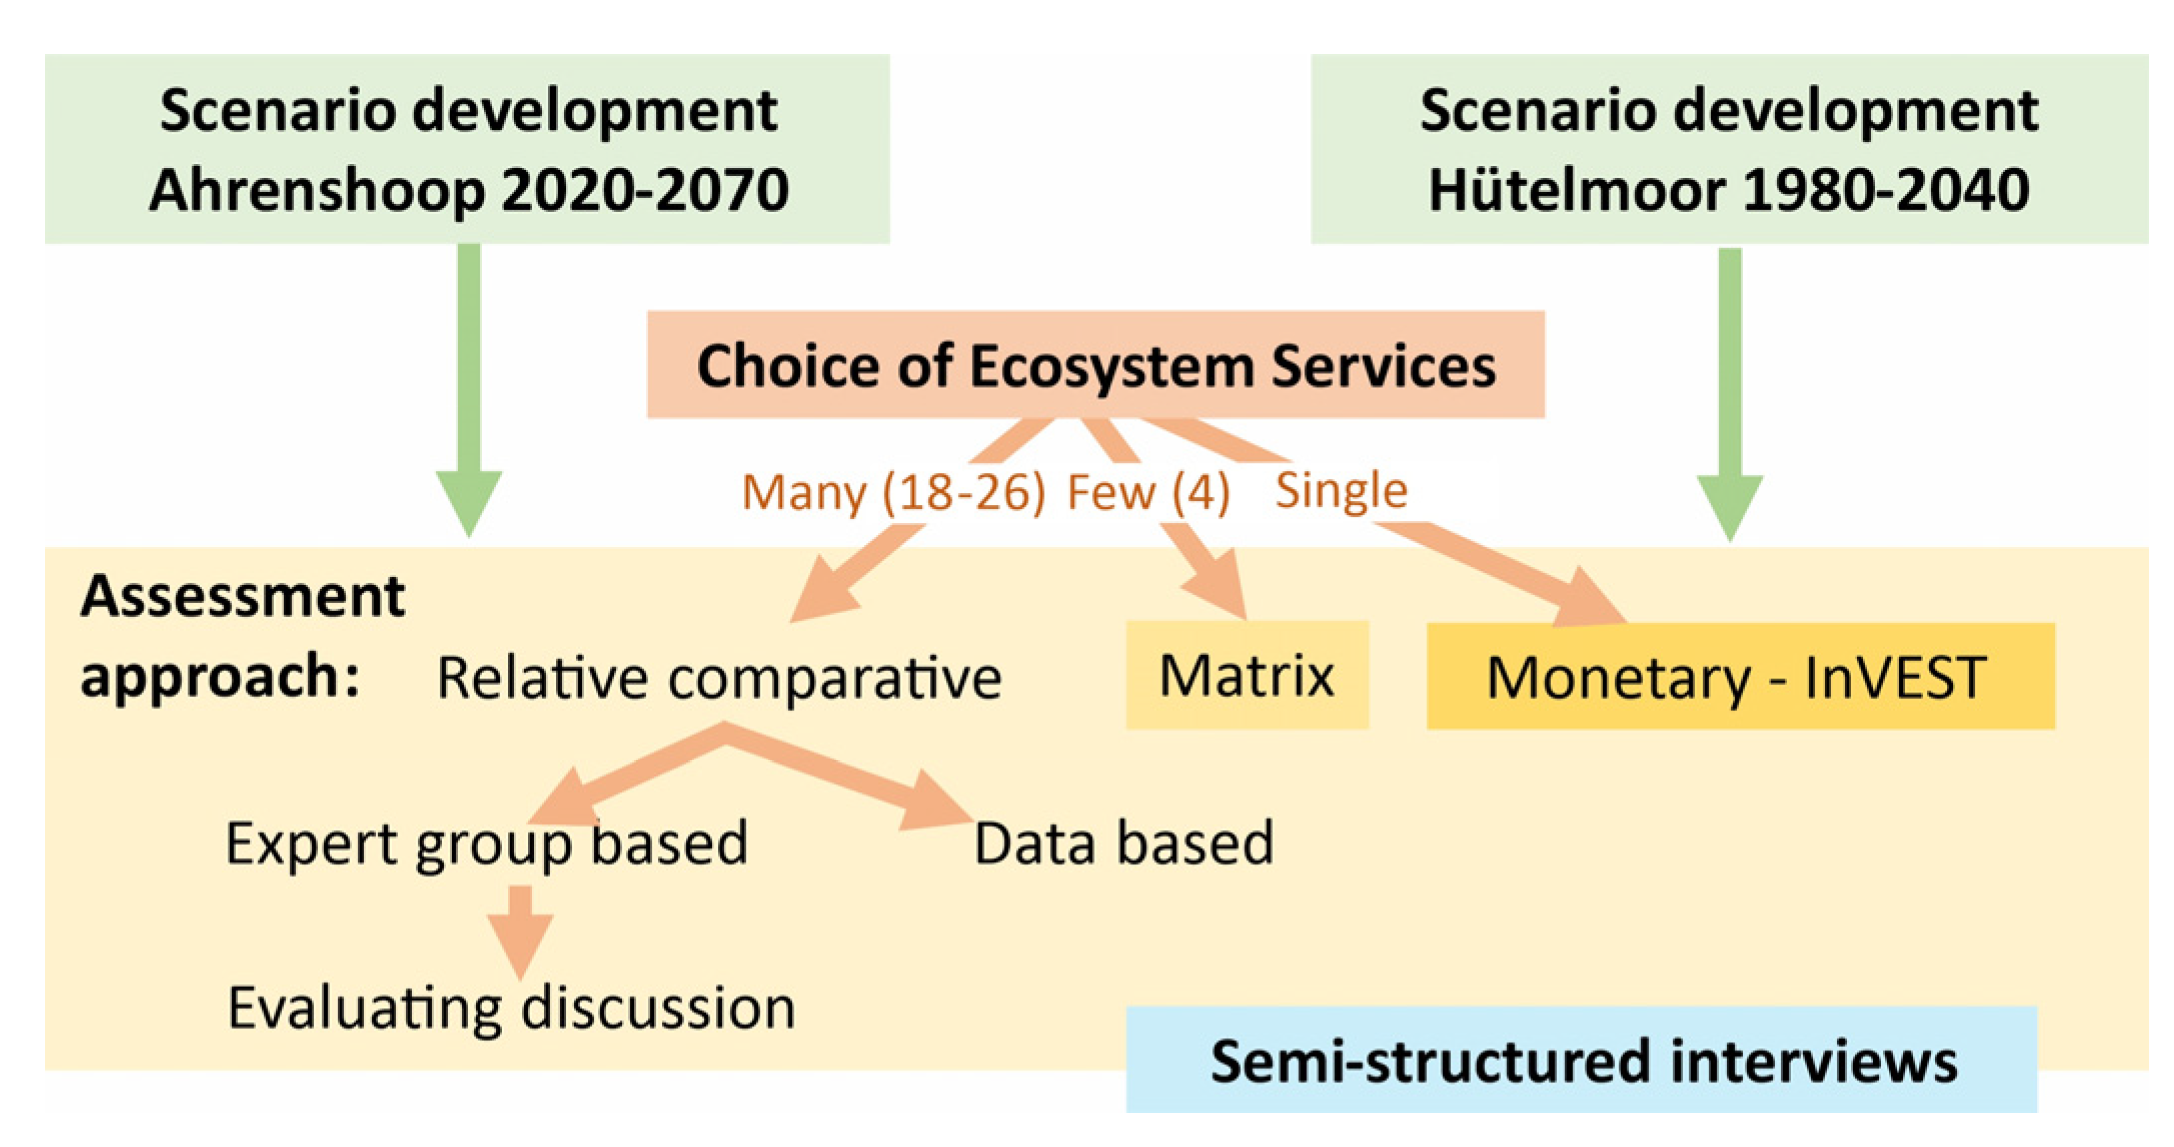
2.4. Choice of Ecosystem Services
Climate change can increase or decrease ecosystem service potential. This potential represents the maximum ecosystem service supply and is affected by many coastal and marine human activities. To what extent an ecosystem service is used by humans (the flow of the service) depends on cultural and socio-economic factors, can change in time and between regions and can hardly be predicted over decades. Therefore, our focus is on changes in ecosystem service potentials.
For each case study site, separate ecosystem service assessments were carried out. First step was the selection of suitable ecosystem services (
Figure 4) based on the hierarchical CICES 5.1 classification [
31]. The CICES 5.1 classification was used because of its transparent documentation, comprehensiveness, international acceptance and official usage by the European Commission. The classification subdivides “provisioning”, “regulation and maintenance”, and “cultural” ecosystem services. The ecosystem services selection was carried out by the authors. Selection criteria were relevance to the issue and fairly equal representation of the three main categories. Previous assessments indicated that 15–25 ecosystem services are a reasonable compromise between thematic resolution and time efficiency [
32]. This number allows an assessment by external experts in an acceptable timeframe of about 45 min including subsequent discussions. The chosen ecosystem services slightly differed between both assessments as a result of the different thematic focuses. The ecosystem services were compiled into tables that enabled assessments by externals remotely.
2.5. Process of the Ecosystem Service Assessment
We used two approaches of ecosystem service assessments: a quantitative data and literature-based, subsequently called data-based, approach, and a qualitative group-based approach. For the data-based assessment, one scientist compiled data, literature, regional policy and planning documents as well as monitoring data and carried out the assessment based on this knowledge. The data collection took one to two months. The group-based assessment was carried out by a group of people with different backgrounds and expertise. The assessments took place in different groups. The single group assessments were always kept separately and later combined into a joint assessment.
The Hütelmoor 1980–2040 assessment included altogether ten persons, six coastal scientists and four university students with focus on coastal environmental sciences. The choice of experts was largely opportunistic, depending on availability and readiness to carry out the assessment. For the Ahrenshoop 2020–2070 assessment, experts with a scientific and practical planning background were involved. Criteria for the expert selection were experience in ecosystem service assessments or ecosystem management, knowledge in local climate change effects and adaptation, expertise in coastal management, coastal protection or land use change, and/or knowledge in local and/or regional planning. Altogether, 22 experts complied with at least one criterion and were contacted via e-mail, 13 responded positively, and finally 9 experts participated in the assessment. The possibilities to select and involve experts were restricted because of the COVID-19 pandemic.
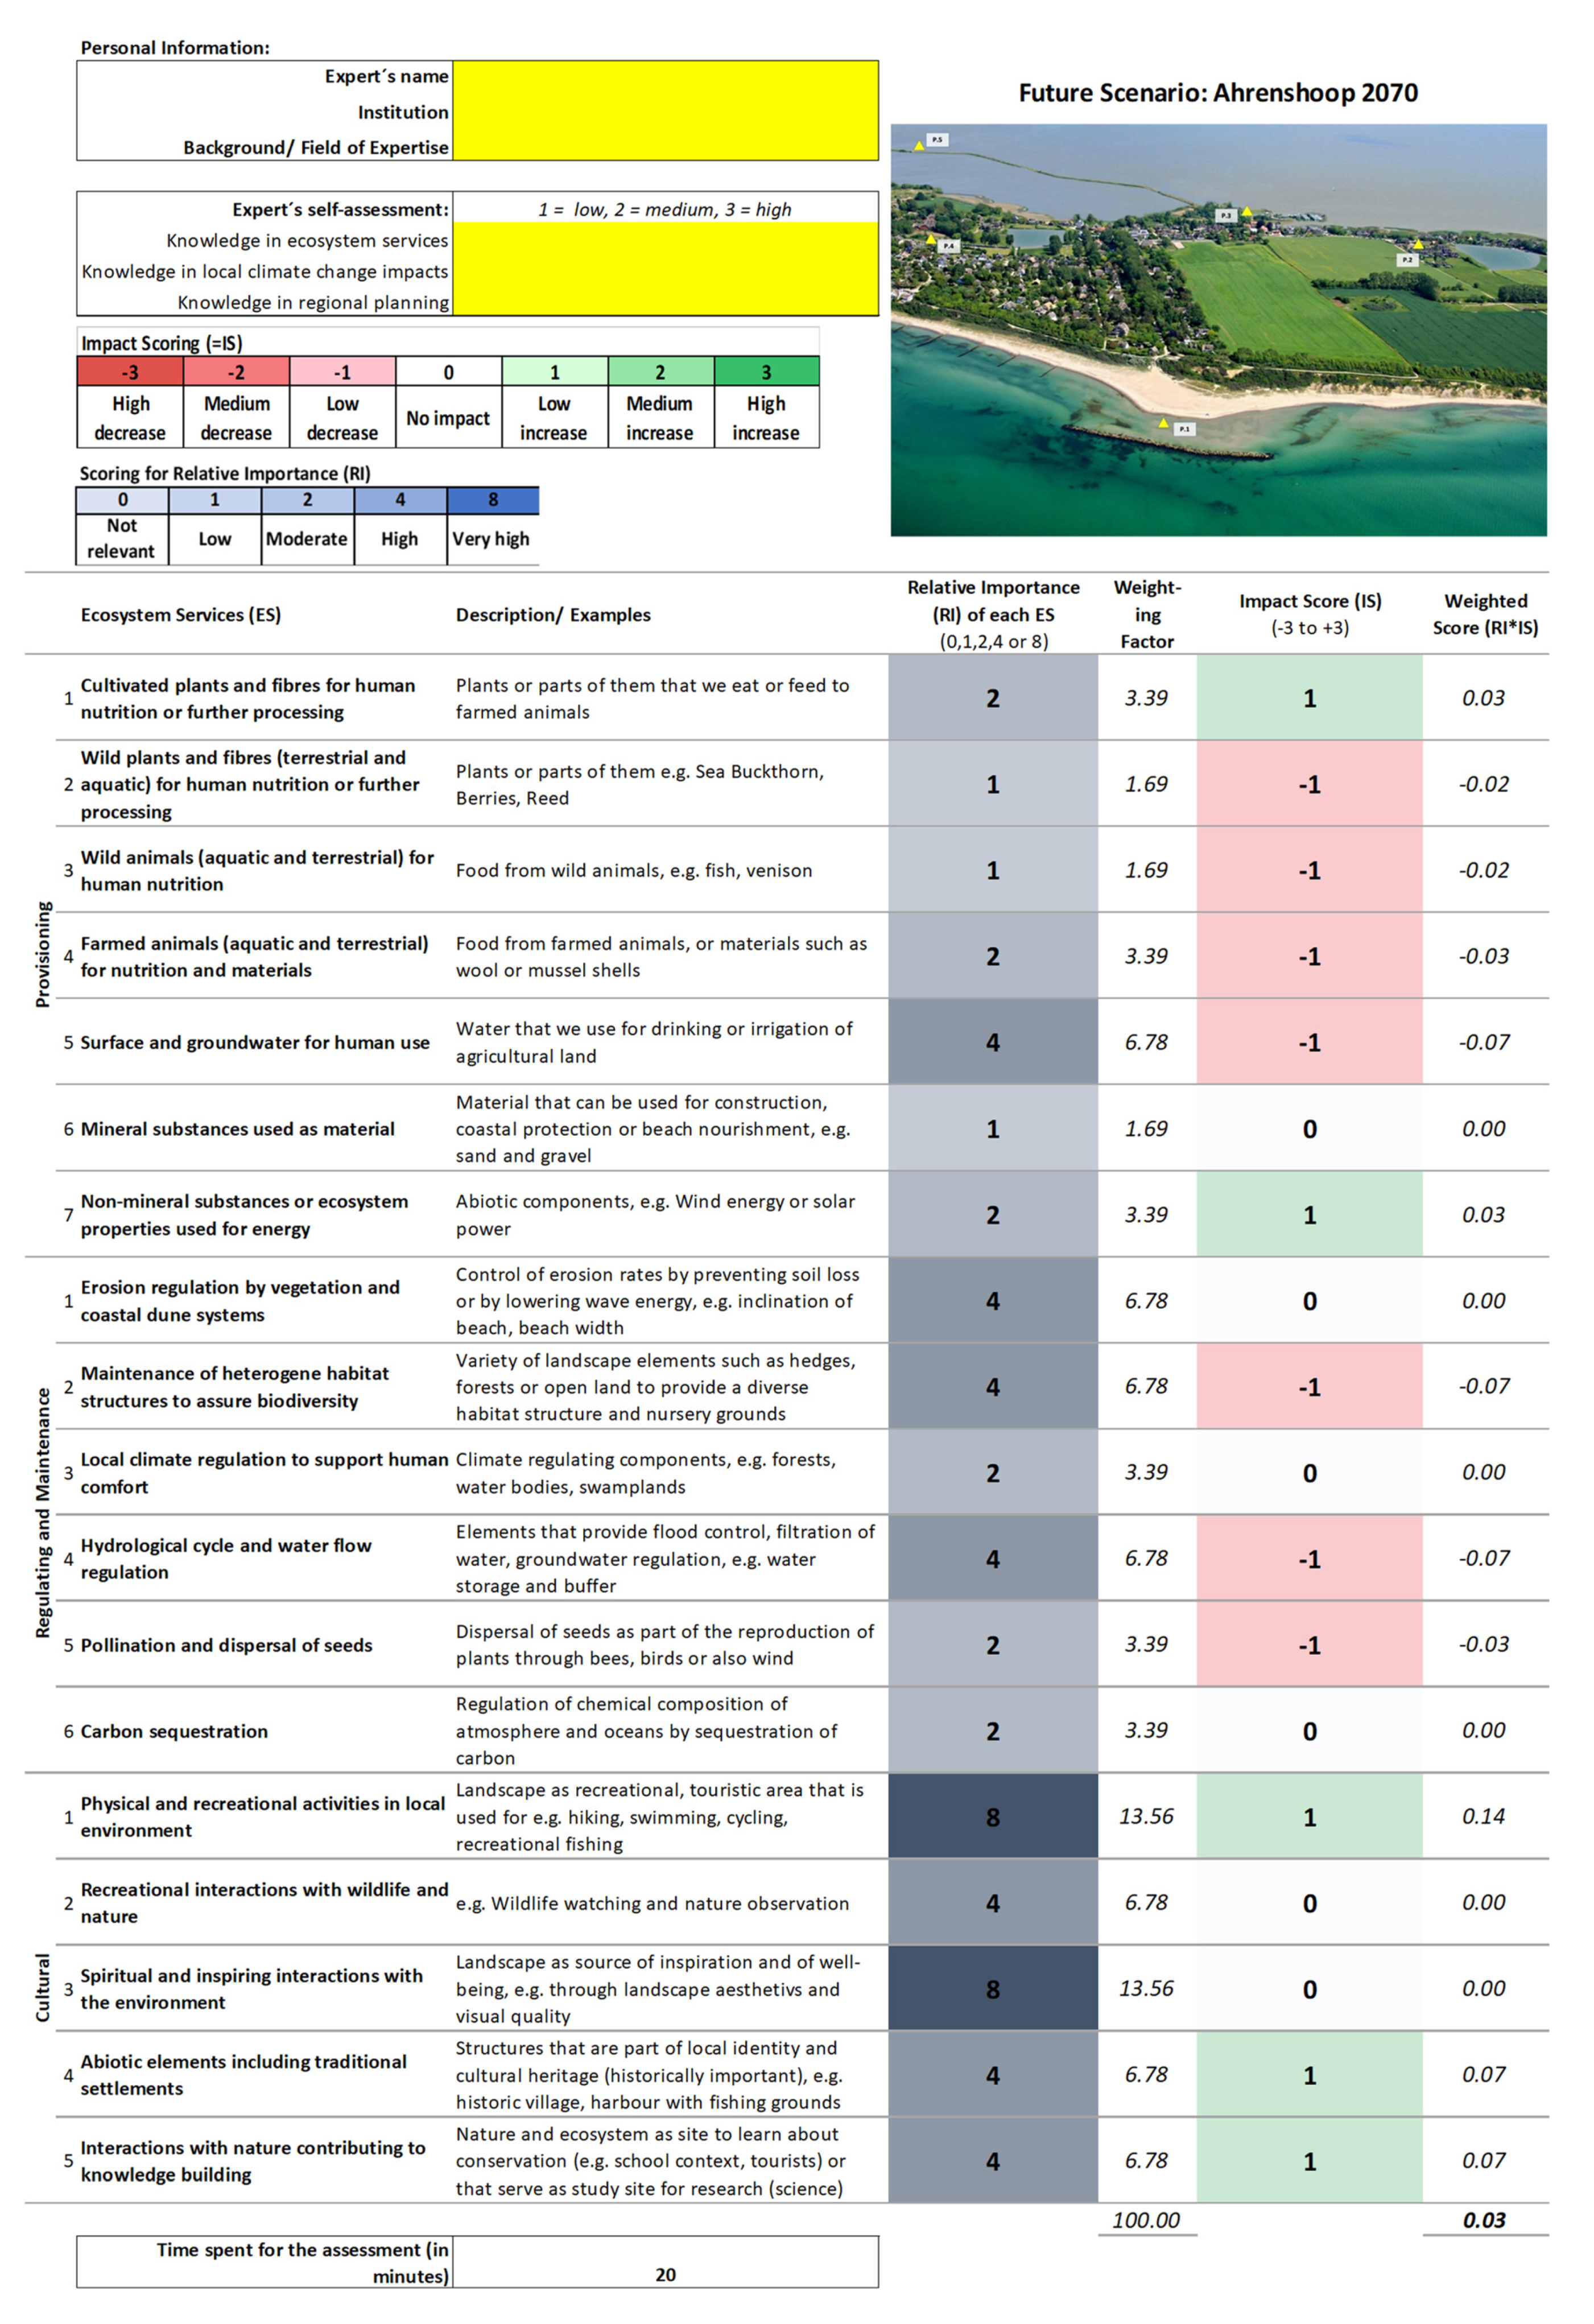
All involved experts received an ecosystem service assessment in the form of an EXCEL table, a guideline document that included a brief overview about the aims of the assessment, characteristics of the study site and visualizations of the scenarios. The experts were asked to fill in the assessment sheet and send it back via email.
The level of expertise was judged based on participants’ self-assessment carried out before the ecosystem service assessment process. Criteria for the self-assessment in the Hütelmoor case study were knowledge with respect to ecosystem services, the Hütelmoor, coastal realignment and wetland ecology. With respect to the Ahrenshoop case study, the criteria were knowledge in ecosystem services, local climate change impacts and spatial planning. The self-scoring scheme was 1 = low, 2 = medium and 3 = good knowledge.
The individual EXCEL assessment sheets listed all ecosystem services (with explanations) in rows and all scenarios in separate columns. In a first step, participants were asked to assess the relative importance (RI) of every ecosystem service, using the classes 0 (no relevance), 1, 2, 4 and 8 (very high relevance). In a second step, every scenario was compared to the baseline scenario, representing the present situation. This was done for every ecosystem service. On a relative scale ranging from −4 (very high decrease of a service) to +4 (very high increase) the participants provided their view on the extent of changes in ecosystem service provision between the baseline and the other scenarios.
At the end, the participants were asked to judge the complexity, comprehensibility and visualization of the entire approach (1 = low/bad, 2 = moderate/ok, 3 = high/good) and estimate the time needed for carrying out the assessment. An assessment sheet is provided in
Appendix A.
The ecosystem service assessment was followed by a discussion process. In the case of Hütelmoor 1980–2040, the results were screened. Five ecosystem services did show a high variability between the expert scores. To obtain better insight into the experts’ views and understand the reasons for the scores, the respective persons were contacted, and, after a brief review of the results, asked to explain the reasons behind their score.
In the case of Ahrenshoop 2020–2070, all experts were contacted after the assessment and took part in an interview. The semi-structured, guided interviews were usually limited to 15 min. The first part of the interview addressed expert questions on the assessment and possible misunderstandings, as well as their scores, especially the highest- and lowest-rated ecosystem services and those that had been marked as “No Impact”. The second part of the interview focused on a better understanding of the reasons and assumptions for the expert scores. Further, the experts were asked to what extent they find visualizations helpful in planning decision-making processes and to what extent differences in the potential of ecosystem services exist between Saaler Bodden and the Baltic Sea coast (
Figure 3) as well as between land and water areas. The interview audio recordings allowed a detailed analysis of results. Because of the COVID-19 pandemic, all communication with experts was online.
2.6. Complementary Ecosystem Service Assessment Methods
Our comparative ecosystem service approach only provides qualitative results. Therefore, two other methods were applied that potentially deliver more quantitative data. Our aim was to test whether the alternative approaches can provide complementary information. Burkhard et al. [
33] presented a matrix approach based on land cover data. For 31 ecosystem services and 44 land uses/land covers, they provided ecosystem potential scores ranging from 0 (no potential) to 5 (very high potential). The scores represented a hypothetical central European landscape before the harvest period. This approach was applied to the Hütelmoor scenarios for the four existing land uses/land cover types: sea and ocean, beaches, dunes and sand plains, and moors and heathlands. Using a geo-information system, the location and size of every land use/land cover type was calculated for each scenario: 1980, 2000, 2020 and 2040. Altogether, 31 ecosystem services were used that largely reflect the ecosystem services used in the comparative expert approach. For every ecosystem service, an area-weighted average score (representing the entire Hütelmoor, including the coastal zone) was calculated. These scores were averaged and multiplied with the total area of 570 ha to obtain an indicator for the total ecosystem service potential and changes between the scenarios.
Additionally, a quantitative ecosystem service approach was applied. InVEST, Integrated Valuation of Ecosystem Services and Tradeoffs [
34], is a system of models for mapping and assessing ecosystem services. It was developed to explore how changes in ecosystems cause changes in ecosystem service flows. These models are freely accessible and well documented. The InVEST models cover only selected ecosystem services and address specific topics. For our purpose, only the InVEST Carbon Storage and Sequestration model was applicable. We used it to estimate the amount of carbon stored in the Hütelmoor at different times. It takes into account four carbon pools (aboveground living biomass, belowground living biomass, soil and dead organic matter) based on land use maps. For methodological details see
https://naturalcapitalproject.stanford.edu/software/invest (accessed on 15 December 2022).
2.7. Climate Adaptation in Planning: Background and Interviews
The case studies were analyzed in the planning context in Germany. Germany represents one national example of how Baltic and European Union policy are implemented. The results were based on a comprehensive study of the exiting planning documents. Spatial planning in Germany has an integrative function, bringing together different sectorial plans, and is reflective of societal needs and preferences—a characteristic of political planning. At the federal level, the government is responsible for the national legislation of spatial planning, overall guiding principles and action strategies as well as the exclusive economic zone. The states, on the other hand, are responsible for terrestrial planning and organization of subordinate planning, including—where applicable—territorial waters.
In the coastal federal state of Mecklenburg-Western Pomerania (MV), where both case studies are located (
Figure 1), the state spatial development program sets the frame for the subordinate planning, i.e., for the regional spatial development programs in the planning regions. At the local level, the municipalities set up urban land-use plans. However, this is concurrent legislation, meaning that the latest plans have priority over older ones (e.g., a new regional plan can overrule an old national plan). Furthermore, local and regional plans can also define preconditions, which the higher levels have to take into account. Environmental planning in Germany has a similar structure to spatial planning, with one main national legislation and further specifications at the state, regional and municipal levels in landscape programs, master- and municipal landscape plans. The integration of spatial and environmental planning in MV is secondary, meaning that the landscape plans are developed separately and are only integrated into the spatial plans after consideration with other public interests [
35]. The responsibility for coastal protection planning in MV is split between water authorities for built up areas, such as the Ahrenshoop area, and water and soil associations in cases where coastal protection facilities are only required for the protection of agricultural areas [
23]. While coastal protection and environmental planning are in the competence of the same authority at the regional level in MV, spatial planning is in the responsibility of four regional planning associations.
In one of the planning regions, Vorpommern, a spatial development strategy for adaptation to climate change and climate protection was developed (MORO). Due to the complexity of climate change, the strategy was developed in an informal planning process with the participation of a large number of experts and stakeholders. The informal process was possibly also chosen to overcome constraints of the formal planning process, where the regional planning agency is merely a moderator for the municipalities and the agreements depend on the awareness of the problem. The awareness of climate change impacts is limited in this region, partly because there is a lack of recent negative experiences (e.g., the last disastrous storm surge was in 1872) and partly because climate change is perceived as beneficial by some (e.g., longer tourism season) or completely denied by others.
To complement the ecosystem service assessments, two semi-structured interviews were carried out with responsible spatial planners from the two relevant regions. The interviews took place in December 2022. The first part of the interviews focused on vertical and horizontal integration of the planning levels (spatial and sectorial planning) in theory and in praxis, which was intended to serve primarily as background information about the functioning of the planning system. In the second part, more details on climate adaptation planning and implementation of (spatial) plans and measures were acquired. The third part concentrated on the case studies and the fourth part on the integration of ecosystem services in spatial planning. The questions for each part were only loosely followed to allow for a relatively free evolution of the conversation. The interviews lasted between 1.5 and 2 h and were consentingly recorded. The recordings were not transcribed literally; as the aim was to gain information on the planning system and practice, only the essence of what was being said was transcribed. The transcripts were analyzed thematically and coded deductively.
3. Results
3.1. Hütelmoor and Its Coast 1980–2040: Comparative Expert Assessments
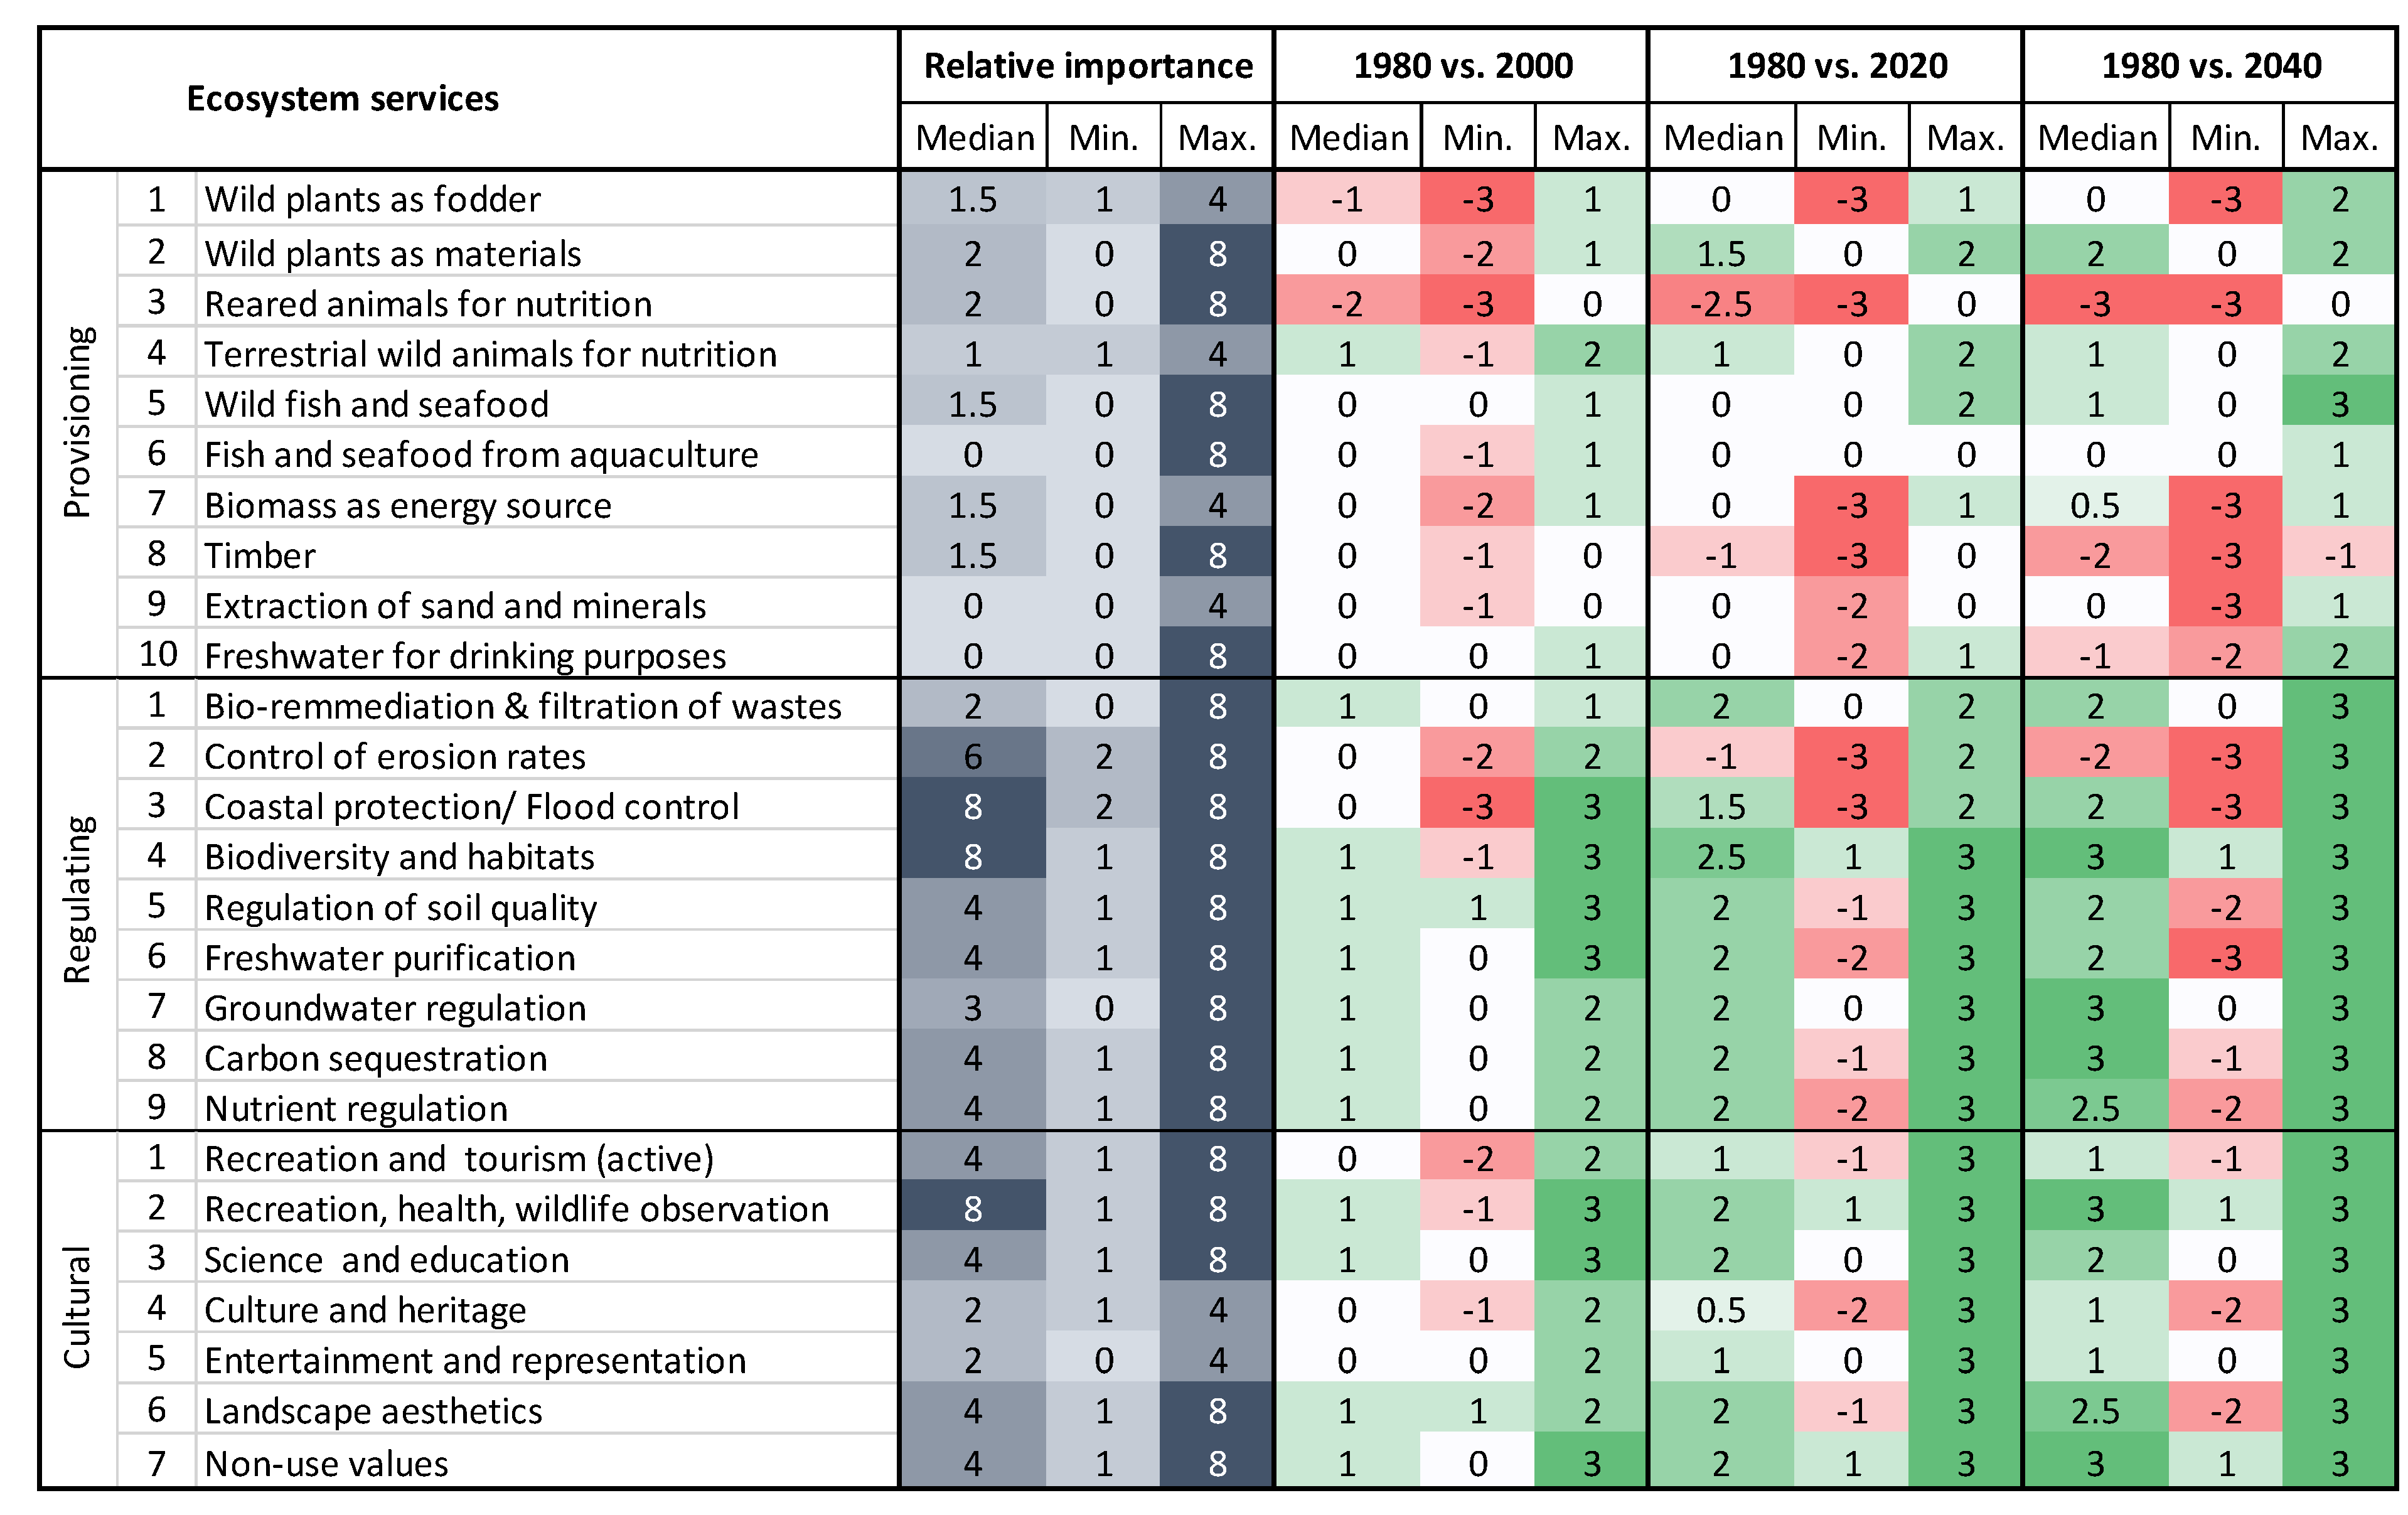
The Hütelmoor and its coast were assessed in four scenarios representing the situation in these years: 1980 (traditional coastal protection and pasture farming), 2000 (traditional coastal protection and partial rewetting), 2020 (narrow coast and extensive rewetting) and 2040 (future coastal realignment and occasional flooding by the sea) (
Figure 2). We used 1980 as the baseline scenario and the other years were compared to it (
Figure 5).
The median scores for the relative importance of every ecosystem service indicate that provisioning ecosystem services in general were perceived as less important compared to regulating and cultural ecosystem services. The importance among the single ecosystem services varies very much, depending on the relevance, for the topic of flooding and moor restoration. However, the minimum and maximum scores for the relevance vary strongly among the experts. Practically every ecosystem service shows this variability and was by some perceived as important/very important and by others as of low relevance.
Between 1980 and 2040, the median scores for nearly all ecosystem services show a steady increase or decrease. The exception is freshwater for drinking purposes, which only shows a decrease in the last scenario because of saltwater intrusion. Over the 60 years of development, the provisioning services show a diverse pattern with services increasing and others decreasing, resulting in a slight overall decrease. For the regulating services, a strong increase is assumed, with one exception: the control of erosion rates. The cultural services show strong increases in service provision. A comparison between 1980, representing an agricultural system, with the year 2040, the system in a natural state, shows that regulating as well as cultural services strongly benefit from renaturation. The strongest absolute changes in ecosystem service provision take place between 2000 and 2020 with the rewetting of the area. This is true for the regulating as well as for the cultural ecosystem services. While the increase in regulating ecosystem service provision meets the expectations, the assumed strong increase in cultural service is in contrast to the expectations of locals before the renaturation. Several locals expressed the opinion that the renaturation would be a threat to local tourism and considered it as not beneficial. These results suggest that an ES assessment may provide a more comprehensive view on consequences of measures and increase their acceptance.
The minimum and maximum scores for many single ecosystem services differ strongly. For the control of erosion rates, coastal protection and freshwater purification, the minimum scores were −3 and the maximum +3. For most other ecosystem services, a significant variability among experts’ scores is visible too. This reflects strong differences in the perception of the restoration consequences among the experts. To obtain better insight into the reasons, the experts were interviewed about the context for their scorings.
Some of the experts explained that their scores were strongly based on the historic and actual use of the Hütelmoor, i.e., the ecosystem service flow, while others scored the site’s potential to provide services. Another reason for the score variability resulted from misunderstandings and inaccuracies in the definition of the scenarios and/or the provided ecosystem service description/definition. According to the experts, the scenarios and their visualization left space for interpretations as well as different perceptions and priority settings. An example is control of erosion rates (Regulating 2 in
Figure 5). The experts based their scores on the functionality of coastal protection structures. This means that not the potential of the site to provide this service, but the state of the existing groyne system was scored. Some stakeholders assumed that scenarios 2020 and 2040 favored flooding events, but a higher vegetation and increased water retention in the moor would increase erosion control. This perception affected their scoring. Further, the score depends on spatial views. Increased sand erosion in front of the Hütelmoor can cause sand accumulation in neighboring coastal areas and, on a larger spatial scale, result in reduced coastal erosion and retreat. These examples show that a discussion after the scoring is important. It helps to gain a deeper understanding on different views and perceptions, can reduce misunderstandings and may enable a joint view. The possibility of allowing experts to revise their scores could reduce the score variability.
The time experts spent on the assessment was between 40 to 90 min with a median of 50 min. The experts’ self-assessments with respect to their knowledge in ecosystem services was 2.3 (averaged score), about the Hütelmoor and the locality 1.6, in coastal realignment 1.4 and only 1.1 in wetland ecology. A score of 2 out of 3 represents a “medium” knowledge. This means the group was well informed with respect to the ecosystem service concept, but ecological and coastal protection knowledge was limited.
The chosen scenarios reflect the development of the Hütelmoor area over time, ranging from a recurrently nourished coastal protection dune as the main protection for renaturation of the area and coastal realignment. The retrospective analysis of the planning documents shows that in the latest regional spatial development program of the Rostock region, the coastline of the Hütelmoor is designated as a reservation area for coastal protection, which prohibits developments (constructions, buildings). The entire area of the Hütelmoor is furthermore a priority area for nature protection and landscape management, which includes a partial agricultural use of the area where the reeds are cut. In the process of restoring the Hütelmoor area, only sectoral planning was involved (nature and coastal protection). While the Hütelmoor area is of a size that falls under regional spatial planning, the restoration process was not part of spatial planning endeavors. This shows that regional spatial planning provides a general framework for climate change adaptation, but measures are implemented via sectoral planning. The resulting changes in landscape and protection levels are taken up in the revisions of the spatial plans.
3.2. Ahrenshoop 2020–2070: Comparative Expert Assessments
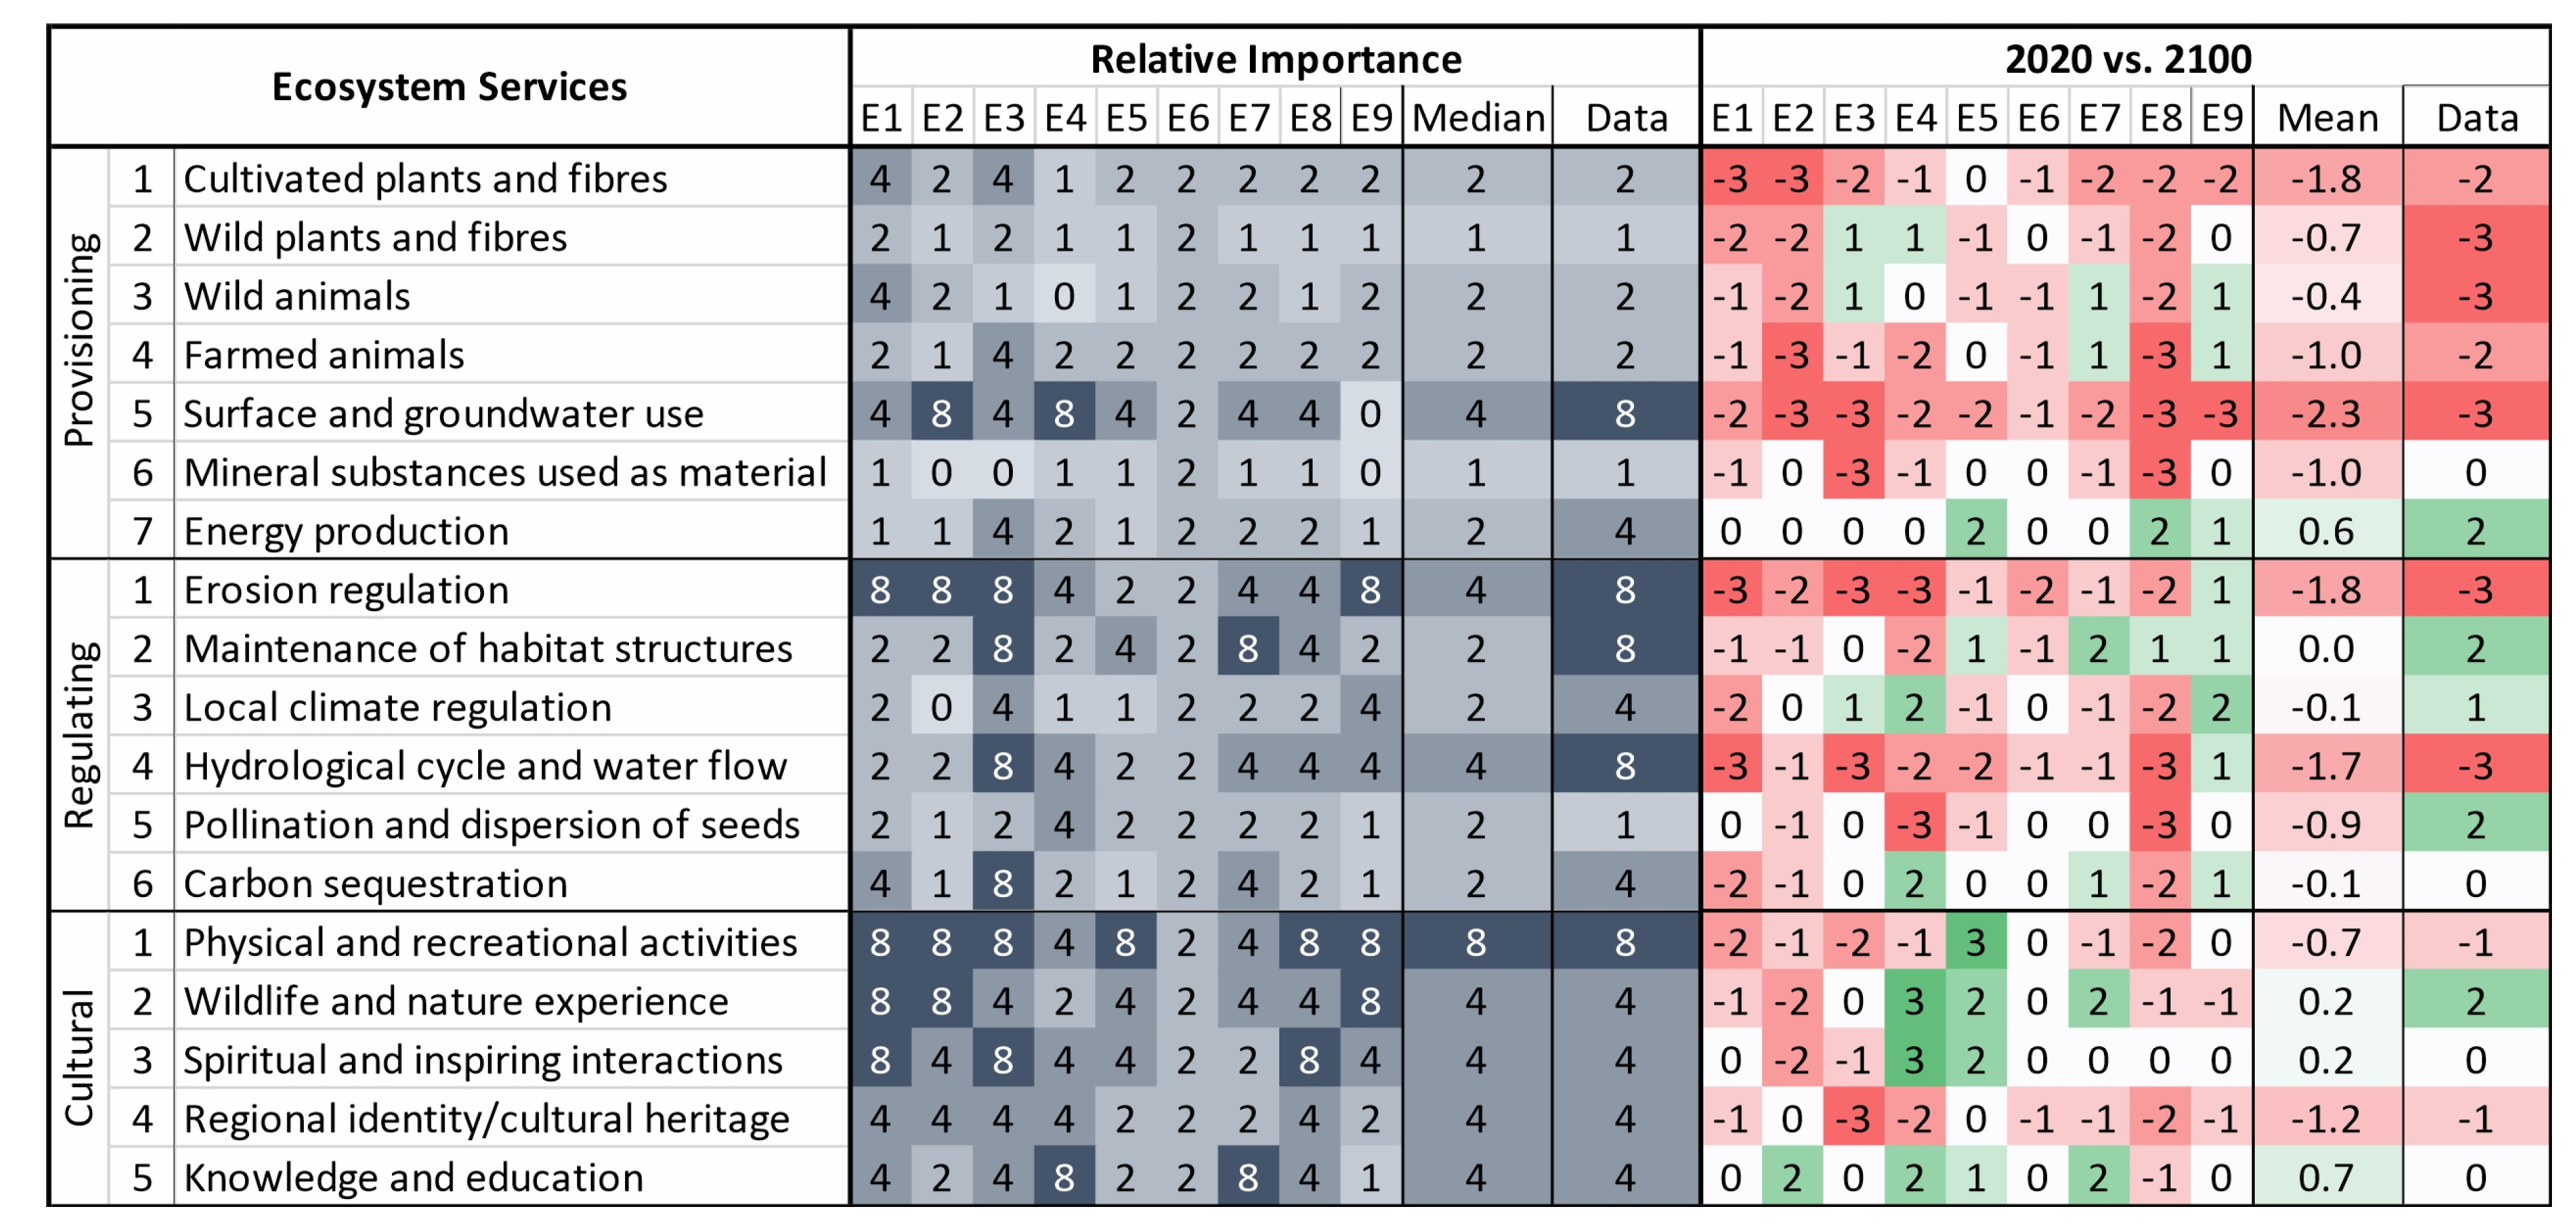
Figure 6 shows the scores for the relative importance of ecosystem services and changes in service potential between 2020 and 2070 in detail for all nine experts involved. Additionally, the scores of the data-based assessment are presented.
Similar to the Hütelmoor assessment, the scores for the relative importance show strong differences among the experts and, in some cases, between the expert group median and the data-based score. This is especially true for the regulating ecosystem services. The reasons for the relative importance scoring were not addressed during the expert interviews.
Similar to the relative importance, the scores for the ecosystem service changes between 2020 and 2070 show strong differences among the experts as well as between the expert group median and the data-based score (
Figure 6). This is a clear indication that the situation in 2070 is perceived very differently. Altogether, the scores are negative, meaning a general decline in the potential to provide ecosystem services. On average, it is assumed that climate change has negative consequences for the human use of the area. However, cultural ecosystem services are less affected by climate change consequences. It seems that the experts assumed that most recreational activities are not affected by climate change or that positive and negative consequences are balanced.
Two interrelated ecosystem services with high relevance and the highest negative changes are “surface and groundwater use” and ”hydrological cycle and water flow”. The availability of drinking water was seen as critical by several experts and the risk of saltwater intrusion was named by two experts. However, another expert did not see a high saltwater intrusion risk because of the low Baltic Sea salinity.
There is a question of whether the heterogeneity in scores between the experts results from the approach or from the scenarios and their visualization. In the survey, the expert majority considered the visualization approach as “useful” or “helpful” and found the scenario suitable for decision-making. Some experts found the complexity of the scenario challenging and suggested additional visualizing pictures showing the changes. Further, additional information, e.g., on land use and shifts in land use types were requested. However, some experts also stated that visualization could influence perception and scoring. In the 2070 scenario, the share of water surfaces is much higher. This means that terrestrial services were replaced by aquatic ecosystems services. This was regarded as a difficulty. For example, aquatic and terrestrial plants had to be balanced against each other with respect to ecosystem service potentials. The feedback session was perceived as important for a better understanding of the assumptions.
Ahrenshoop is of significance for the entire Fischland-Darß-Zingst region because a breach of the land neck in a storm flood event would have severe consequences for the villages at the Bodden coast [
23]. The coastal protection in Ahrenshoop, therefore, consists of a combination of measures, including a breakwater in the south, a groyne system and coastal protection dune along the entire coastline, several dikes on the Bodden side and a sea dike towards the north of Ahrenshoop. The coastal protection dune is eroded during flood events and therefore sand nourishments have been necessary every 5 years, approximately [
23]. In order to comply with the aims of the national park in the north of Ahrenshoop, which is also a priority area for nature protection in the regional spatial plan, the coastal protection scheme is undergoing changes and the recurring sand nourishments have been replaced with a reinforcement of the sea dike [
36]. These changes are an example of adapted coastal protection and comply with the objectives of the spatial development program [
37], which requires protection of settlements while ensuring a natural coastal dynamic where possible.
3.3. Hütelmoor 1980–2040: Complementary Assessments
Potentially, the matrix approach by Burkhard et al. [
33] is able to reflect changes in the ecosystem service provision that result from land use changes. The Hütelmoor scenarios (
Figure 2) host four land uses/land cover types: sea and ocean, beaches, dunes and sand plains, and moors and heathlands. The relative shares of the land uses/land cover types change over time in the scenarios, while the total area remains constant (570 ha) (
Figure 7). It is assumed that between 1980 and 2040, coastal retreat increases the area covered by sea and ocean from 11 ha to 39 ha, while erosion reduces the area covered by dunes and sand plains from 29 ha to 17 ha. Especially after 2000, we assume an increase in moors and heathlands (from 305 ha to 318 ha) and a reduction in mixed forest coverage (form 221 ha to 196 ha) resulting from higher water levels in the moor.
The averaged results per ecosystem service for the four scenarios Hütelmoor 1980–2040 only show minor changes between the scenarios. The effects of coastal retreat and moor restoration on ecosystem service potentials are hardly visible. The averaged ecosystem service potentials multiplied with the area indicate some changes, but these remain below 2%. We can conclude that the matrix approach does not reflect ecosystem changes sufficiently and does not provide additional insights. Since the quantitative changes between land uses/land cover types in the Ahrenshoop scenario are comparable to Hütelmoor, this approach was not applied to Ahrenshoop.
The InVEST models are meant to reflect how changes in ecosystems cause changes in ecosystem service flows [
34]. This meets the objectives of our study well and we explored whether the results are beneficial and can complement our comparative expert-based ecosystem service. InVEST Coastal Blue Carbon quantifies the value of carbon storage and sequestration services provided by coastal ecosystems. Other models, such as InVEST recreation, were tested but turned out to be not suitable for our study.
Figure 8 shows the benefits of the Hütelmoor restoration, from an agricultural area in 1980 to a wet and partially inundated system in 2040, for carbon sequestration (InVEST Coastal Blue Carbon). While in 1980, the Hütelmoor emitted 7990 tons of CO
2 equivalents per year to the atmosphere; the partial rewetting (scenario 2000) reduced the emissions to 2790 tons of carbon dioxide equivalents (CO
2e) per year. The largely finished rewetting (scenario 2020) further reduced the annual losses to 1896 tons CO
2e. Until 2040, assuming a slight salinity increase and a dominance of reeds (
Phragmatis australis), the area shifts towards a net sink for carbon, with a total annual sequestration of 118 t CO
2e.
3.4. Ecosystem Service Assessments in Planning
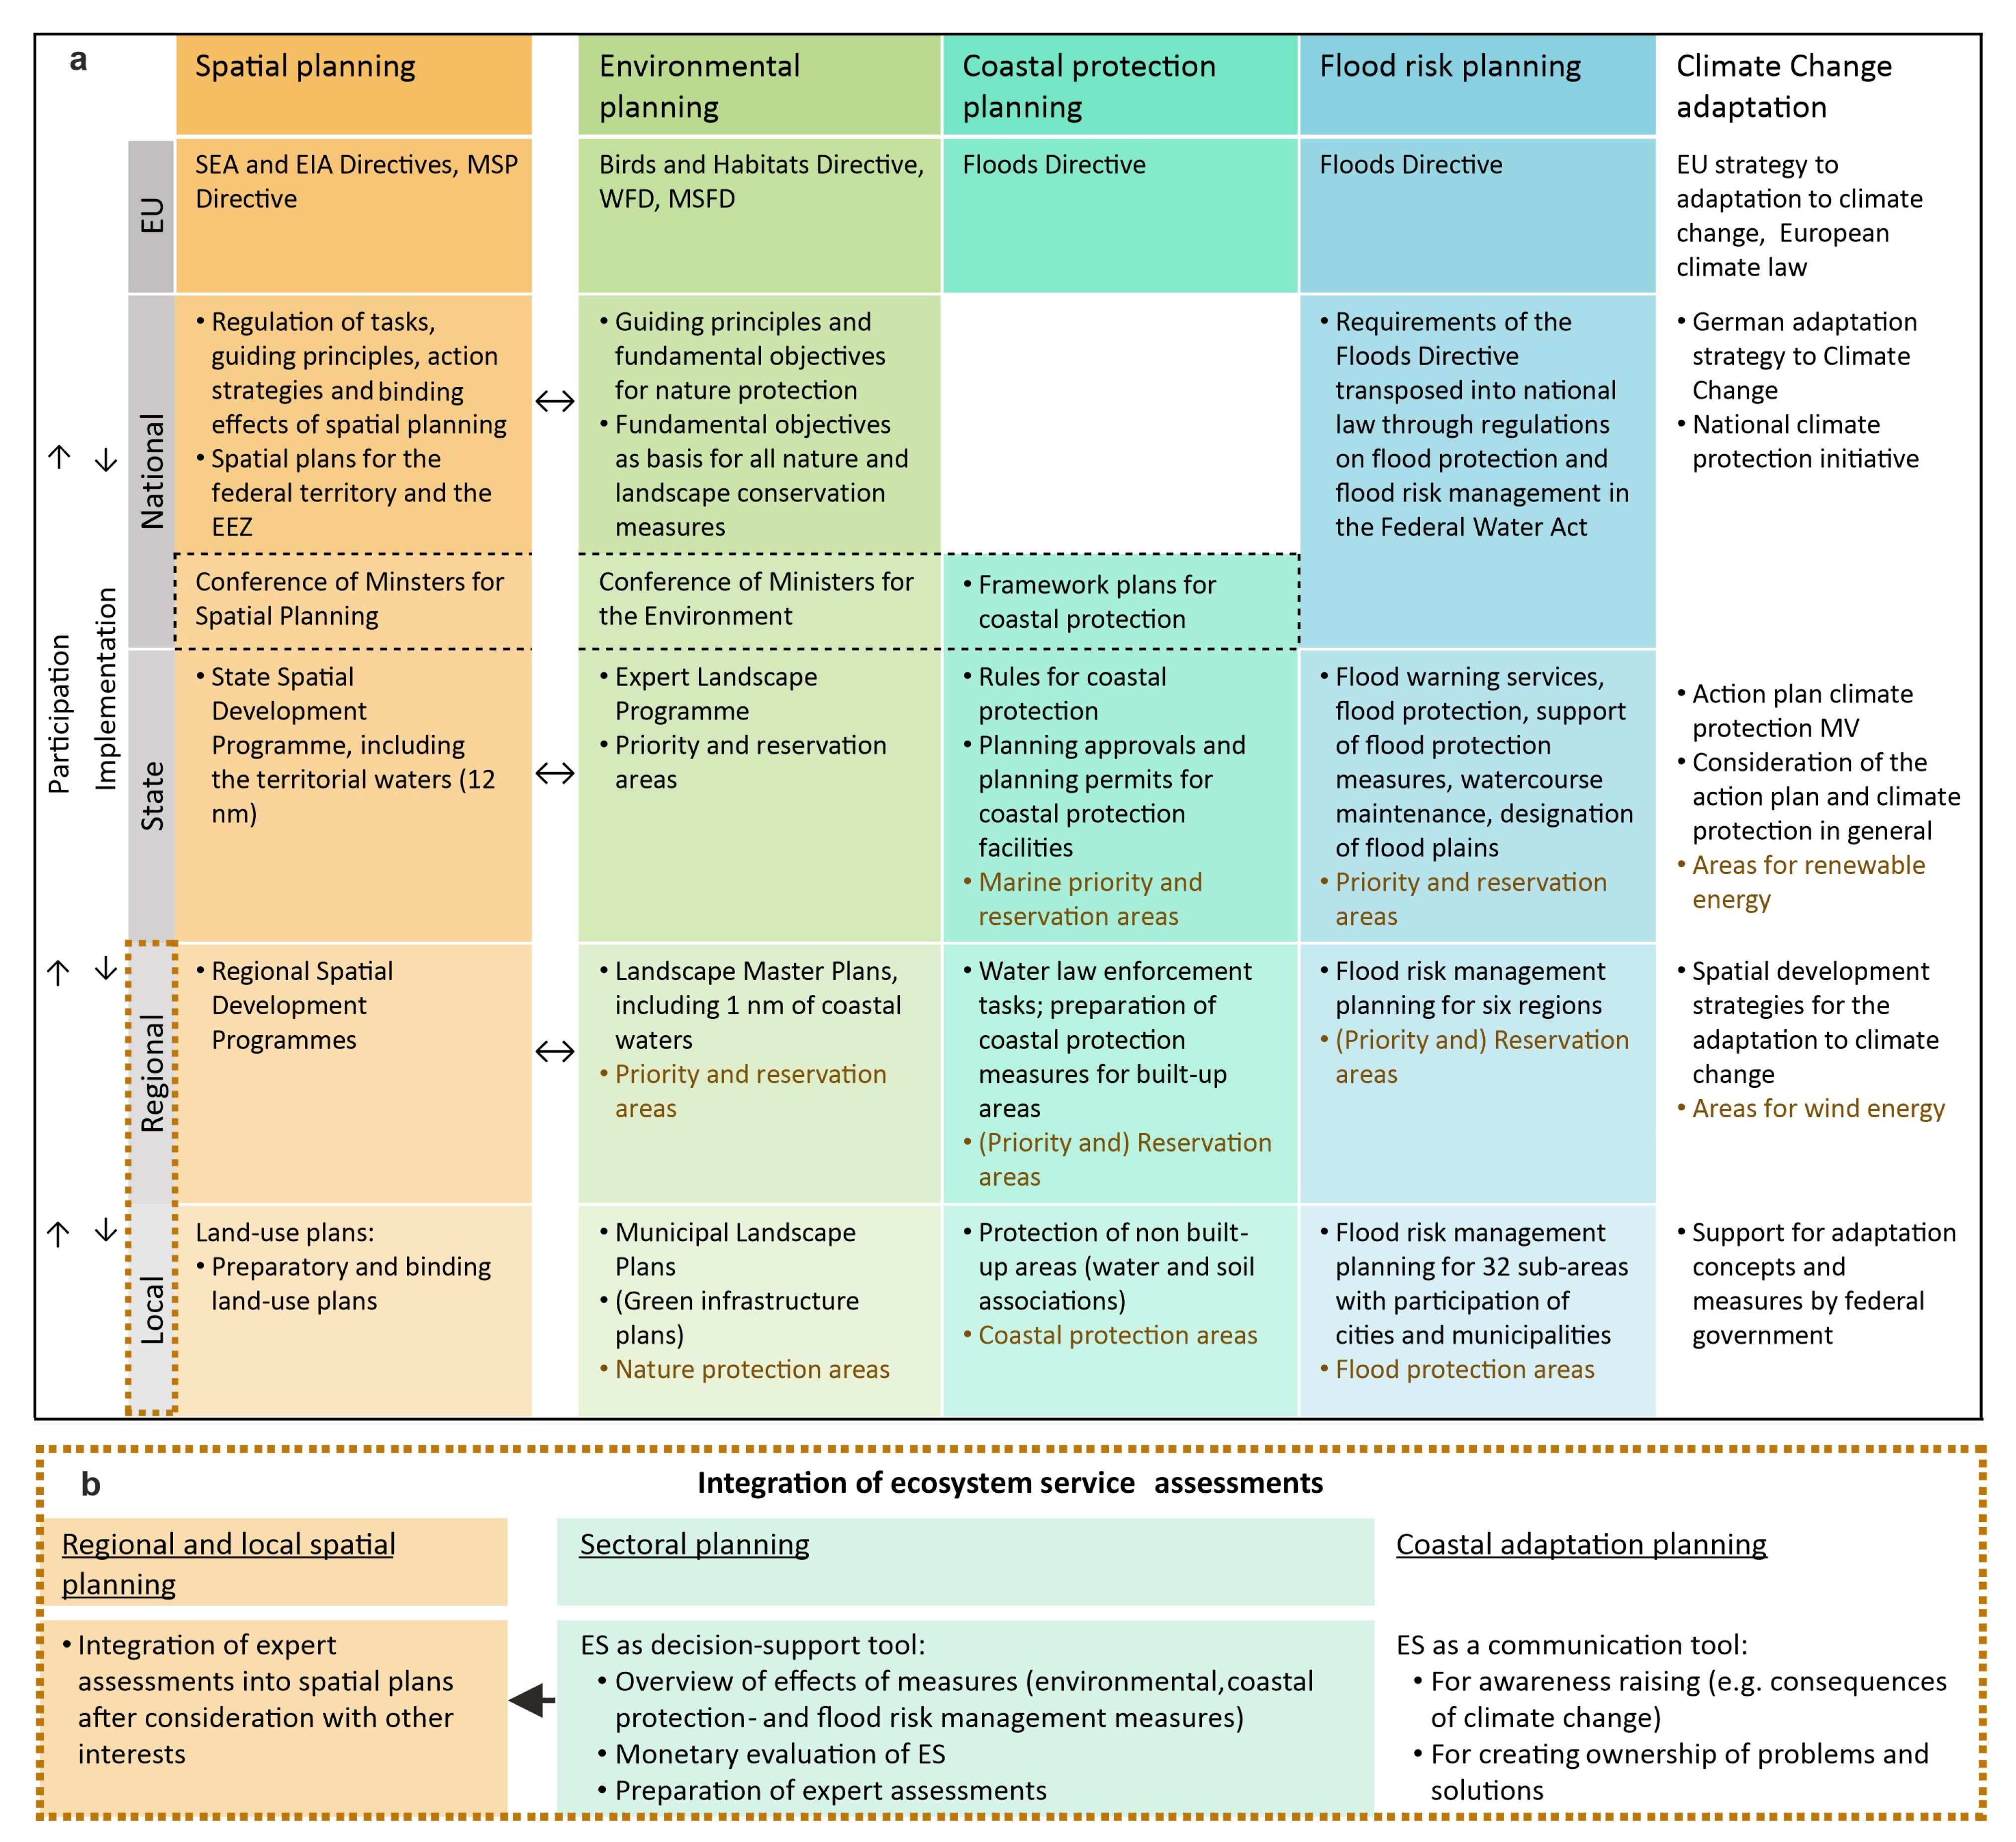
The relationships between different thematic planning and hierarchy levels in Germany is complex. A comprehensive understanding is required for assessing their relevance for climate change adaptation and the possible role of ecosystem service assessments. The simplified overview of the vertical and horizontal levels of planning (
Figure 9a) is based on the literature and was largely verified during the interviews with the spatial planners. A constraint is that planners see a clear difference between spatial planning, representing political and integrative planning, and sectorial planning, which functions as stand-alone planning, in particular coastal protection planning.
Both case studies fall under the local level (
Figure 9a). The Hütelmoor case was driven by nature and coastal protection authorities. Similarly, the current coastal adaptation in Ahrenshoop is driven by coastal protection and not spatial planning. However, the scenario used in the Ahrenshoop assessment does resemble flooding scenarios that were developed at the regional level in the scope of a climate change adaptation strategy. The current regional spatial development programs in Vorpommern and the Rostock Region are from the years 2010 and 2011, respectively. Even back then, the effects of climate-change-induced sea level rise were taken into account by designating reservation areas for coastal protection. In the planning region of Vorpommern, a follow-up on wind energy and the development of the above-mentioned adaptation strategy was additionally promoted. Both regional programs are expected to be updated starting in the beginning of 2023 and will include the results from the adaptation strategy (Vorpommern) and results from the work carried out in scope of the Floods Directive and may also include propositions with respect to the rewetting of areas, protection of moors and adapted constructions, according to the interviewees. There are thus clear efforts of integrating climate change adaptation planning and measures.
However, during the interviews, it became clear that there are several difficulties in the practice of planning and in the implementation of adaptation and mitigation measures. At the local level, the Hütelmoor case shows that strong opposition from (a minority of) the public can prolong the implementation of measures [
27]. At the regional level, the follow-up chapter on wind energy of the regional spatial development program had to undergo five rounds of public participation because of public opposition and legal constraints. At the state and national levels, a lack of political decisions in some cases or a lack of political enforcement is also regarded as a constraining factor. In cases where decisions are explicitly made for more wind energy (national level) or provisions with respect to flood risk assessments are made (EU level), this also provides a solid basis for lower levels of spatial planning to justify decisions and receive better data. This last point is important, as spatial planning agencies are dependent on the data and information they receive from the sectorial authorities. An additional problem is, however, that spatial and sectorial planning cope with a lack of human and capital resources. This lack of resources can result in an incomplete data base for spatial plans.
Regional spatial planning agencies, for example, need up-to-date landscape plans. However, the plans are outdated by over 20 years due to resource constraints and because the nature protection authority has its own additional means of protecting and managing nature areas. According to one of the interview partners, the assessments of ecosystem services or just information regarding them would need to be in form of an expert assessment delivered by the authorities responsible for nature protection planning. Such an expert assessment based on the best available knowledge could provide input to the follow-up of the regional spatial development program. The interviewee explicitly saw an advantage in monetary valuation of ecosystem services as it can easily be compared to other uses of an area. Spatial planning is about deciding which areas can be used for which purpose and monetary valuation can provide arguments to reserve an area for the provision of ecosystem services with benefits for society. The last point was regarded as important by the interviewee—that this concept can raise awareness of the services ecosystems provide and their societal benefits and thus can provide justification for, e.g., rewetting an area.
Figure 9b provides a summary of the role of ecosystem service assessments in spatial and sectoral planning.
4. Discussion
Ecosystem service assessment approaches that compare different ecosystems spatially or compare different ecosystem states in time within one area have several advantages: they are flexible with respect to the participants and can be carried out by single experts, expert groups or stakeholder groups, they require only limited knowledge about the background and technical aspects of ecosystem service assessments, and they can be carried out within a relatively short time of days to weeks [
19,
20,
21,
32]. However, they require a sound preparation, an experienced moderator and well-developed scenarios. Scenarios in this respect refer to a detailed description and visualization of what shall be compared. These ecosystem service assessments increase the awareness of the consequences of ecosystem changes from an anthropocentric perspective and provide insight into the complexity and interrelationships of ecosystem processes, structures and functions. However, they do not provide reliable crisp data that can be expressed in monetary values. They only reflect perceived qualitative changes largely based on opinions. Further, they are case-specific and hardly allow generalizations or a transfer to other regions or topics.
During our post-assessment discussions with the participants, several weaknesses were pointed out, namely that the given scores for ecosystem service changes are subjective and influenced by the scenario visualizations, the scenario presentations, the moderator and, of course, by the composition, background and knowledge of the involved participants. Theses weaknesses bear the risk of manipulation. This limits the value of these ecosystem service assessments for applications within spatial planning and climate change adaptation processes, because both require reliable data.
The assessment of future scenarios, compared to the present situation, is a special challenge because the visualizations of future states are based on projections and expected changes. The uncertainties increase the further the scenario is located in the future. Further, our visualizations represent only one possible future state. Possible future management measures that could modify the environment and cause a different state of the environment are not taken into account. The German proactive planning system adds uncertainty to future projections. For example, it can be expected that settlement areas with high touristic values, such as Ahrenshoop, will continue to be protected from flooding because of societal pressure. As a consequence, the situation in 2070 will, very likely, look differently than shown in our scenario 2070, which assumes flooding of the lowlands. As a consequence, our future scenarios may lead to wrong expectations and perceptions among participants. With respect to the Ahrenshoop scenario 2070, the hypothetical and awareness-rising character and the limited value for concrete spatial planning is obvious. With respect to Hütelmoor 2040, this is different, as the future scenario is only 20 years ahead.
Model projections for the morphometric development of the Hütelmoor and the coastline carried out around the year 2000 suggested a dune breach and partial moor flooding even before 2020 and a strong coastline retreat for the year 2040 [
38]. As of today, a lasting dune breach has not taken place and a strong coastline retreat until 2040 seems unlikely. Ecologically, the Hütelmoor itself did not, as expected in the beginning of the measure implementation, develop into a diverse habitat with a high number of species. Today, in reality, it is dominated by freshwater, large reed areas and a limited number of well-adapted species. The deviating biological development results in modified biogeochemical processes, gas emissions and peat development [
39]. Our 2020 scenario reflects the real situation today. However, had the future scenarios been developed 20 years ago, they would look different, with consequences for the ecosystem service assessments. This clearly points out the limitation of assessments addressing hypothetical future environmental states. Future state assessments might cause wrong expectations and, if wrong, could motivate false decisions.
Another lesson learnt from the Hütelmoor scenarios is that the comparison of 20-year time periods is problematic. In the Hütelmoor, policy changes (abandonment of agriculture) and the stepwise implementation of measures (increase in freshwater levels, coastal realignment) caused significant environmental changes. These changes are reflected in the ecosystem service assessments, but the changes in scores between consecutive time-slices are, with respect to many ecosystem services, very limited. We can conclude that for systems with a natural development, 20-year assessment time intervals are too short. The natural changes taking place in an area would hardly be strong and apparent enough that they could be represented with our ecosystem service assessment approach.
In general, our assessments represent changes in the potential ecosystem service provision. Whether these changed potentials are utilized depends on human behavior, traditions, fashions and other socio-economic factors. These aspects can hardly be predicted over decades and hardly be taken into account in future scenarios. However, the retrospective discussions with participants revealed that there is always a risk that the scorings of future ecosystem service changes are affected by the personal view of the experts with respect to the utilization of the potentials.
Another aspect that caused difficulties for the participants was that habitats and uses changed. For example, in the Ahrenshoop 2070 scenario, meadows are largely replaced by wetland and/or underwater habitats such as reed areas. A comparison of ecosystem service potentials between systematically different habitats adds uncertainty to the results.
Considering the limitations of our comparative qualitative ecosystem service assessments raises the question of alternative approaches. We additionally applied and tested the matrix approach, which focuses on spatial changes between habitats [
33]. This approach turned out to be too coarse. The scale indicating ecosystem services and the land-use units was too general. Further, this terrestrial approach insufficiently addresses coastal water habitats and their ecosystem service potentials. It insufficiently reflected the changes in the Hütelmoor. Recent approaches with better resolved habitats and a better consideration of coastal water habitats might provide better results [
40,
41].
The InVEST models for ecosystem service assessments [
34] provide spatially resolved quantitative information. InVEST Coastal Blue Carbon was the only suitable model applicable to our case studies. The model well reflects the consequences of moor restoration on carbon sequestration. However, it addresses only one ecosystem service, and only for the moor without the coastal zone. Further, the calculations strongly depend on assumptions, field study data and the available literature. InVEST is a suitable, but thematically narrow, complement to our approach.
Climate adaptation is a task for society as a whole and the decision of how to adapt, e.g., to sea level rise is a societal one. In the Hütelmoor, the decision—for coastal realignment—has already been taken. The Ahrenshoop case is different. It is a built-up area and coastal protection measures are in place. However, the projections for the future show that some parts of the municipal area will likely be flooded. So, a question that will need to be tackled is whether or not Ahrenshoop will be protected at all costs. At the moment, this is mainly a question in the responsibility of the coastal protection authority. The case studies also show that the implementation of measures is in the hands of sectorial planning. Spatial planning, on the other hand, sets a frame and requirements at a larger scale, which sectorial planning has to take into account. While there are problems and obstacles with respect to the implementation of spatial planning in Germany, they seem to be related to decisions not being taken or a lack of political enforcement and are not a problem of the system itself.
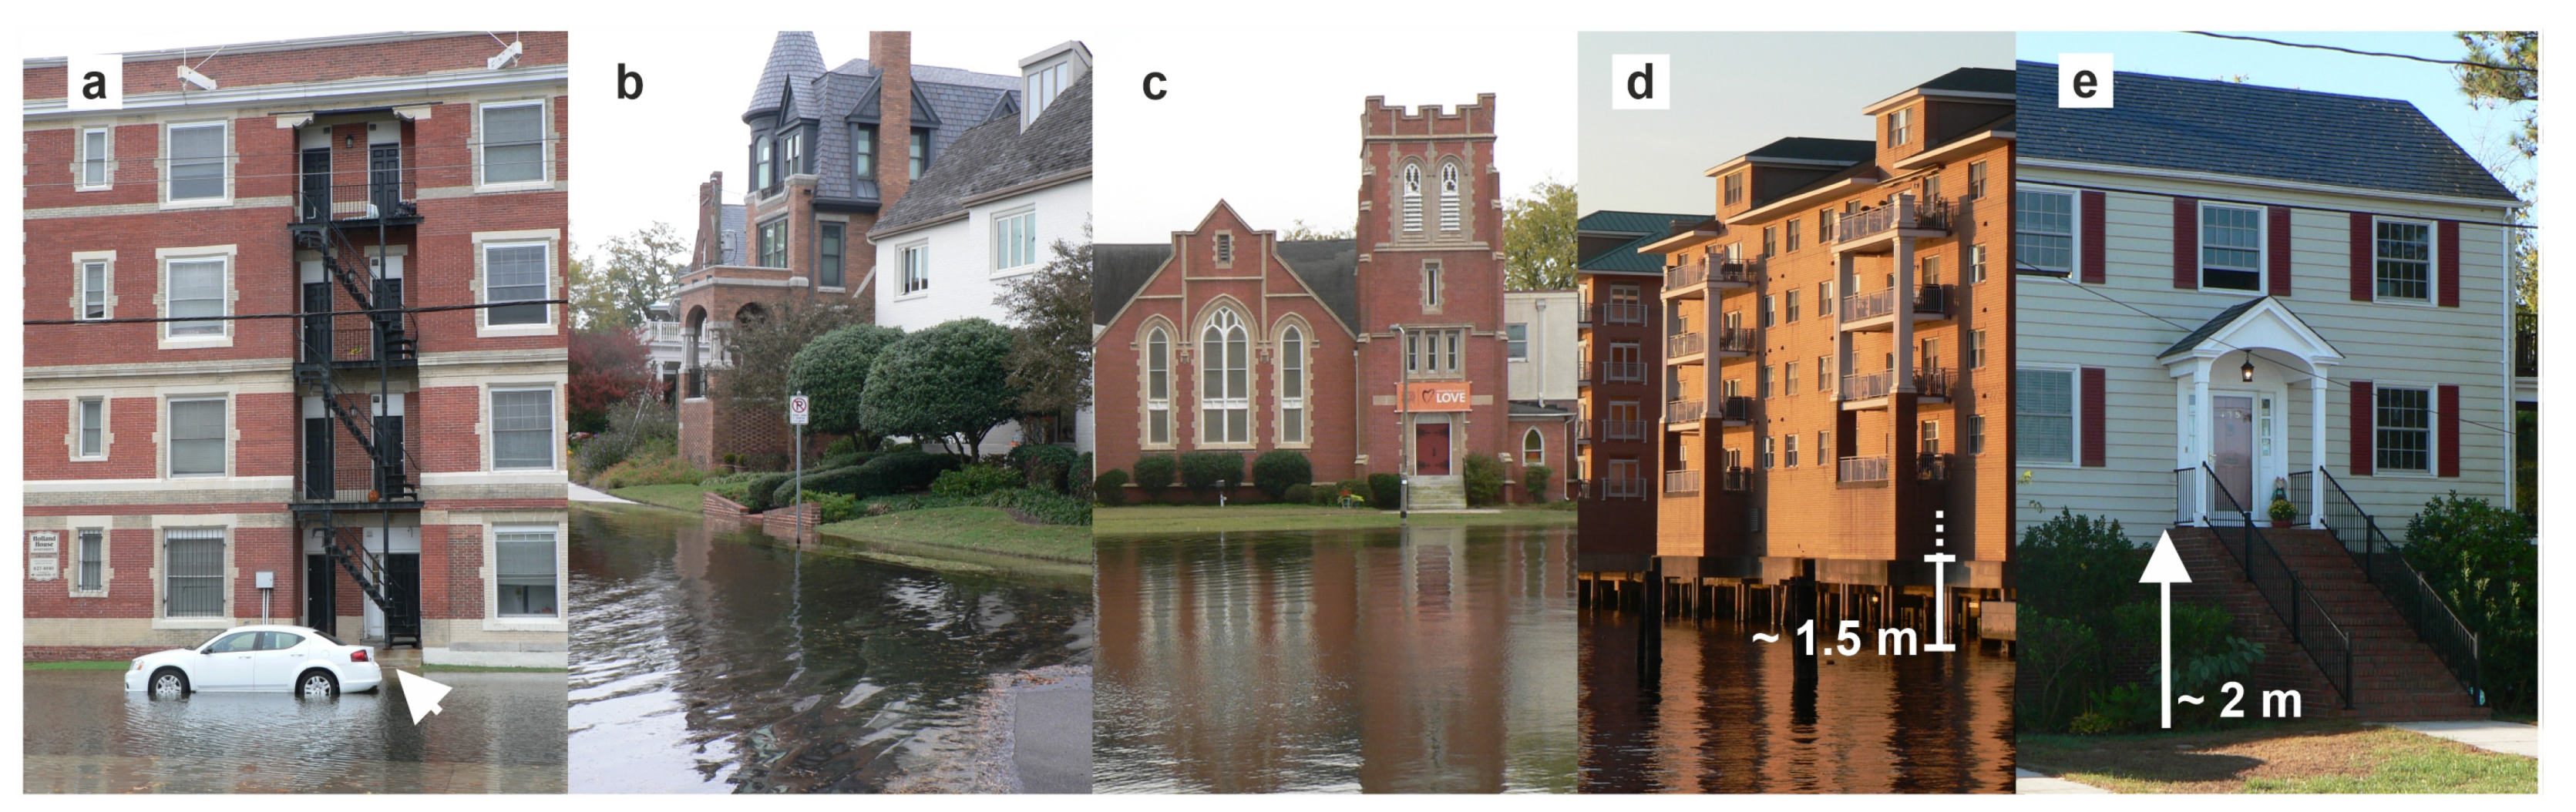
The European planning systems largely follow a precautionary, proactive principle. In comparison, for example, the planning approach in the United States of America is more reactive. The consequences are visualized in
Figure 10. In Norfolk, West Virginia, US, the highest astronomical tides of the year (King Tides) cause water levels of about 0.6 m above mean sea level. The consequence was an extensive temporary flooding of the city. Climate-change-induced sea level rise will steadily worsen the situation and increase the frequency of flooding. Despite that, a protection and adaptation approach for the entire city does not exist. Adaptation is largely an individual responsibility and results in different approaches, reaching from an acceptance of the flooding to technical solutions for one’s own property.
In contrast, the European planning system is strategic and exhaustively avoids problems for society via counteractive protection or adaptation measures. At the same time, the development of the strategic spatial programs is slow, which lies in the nature of political planning that takes into account objections from stakeholders and individuals. This slow process may be regarded as a disadvantage in the light of a rapidly changing climate and the need to adapt quickly. On the other hand, it does provide a platform to discuss and gauge the dis(advantages) of protection, adaptation or retreat from specific areas. At the same time, it provides an instrument to implement parliamentary decisions, e.g., the decision taken at the national level in Germany for designating a percentage of each state’s area to wind energy.
Spatial planning is thus reflective of and influenced by societal discourses and decisions, which can require time because of opposing positions. In order to decide which areas should be used for which purpose and taking into account the respective societal consequences or benefits, the ecosystem service concept can provide valuable information. It may be utilized by decision-makers to raise awareness of the societal benefits, e.g., of rewetting a moor and to justify their decisions. The question is whether a holistic approach, where all ecosystem services are assessed as performed in the Hütelmoor and in Ahrenshoop, is the way forward or if single services, in particular those important for an area, should be assessed in detail, including monetary valuation. In the case of the Hütelmoor for example, the process for deciding on and implementing the renaturation measures might have developed smoother if the benefits of carbon sequestration (benefits at a larger societal scale) and nature tourism (benefits at a local to regional scale) had been clearer and had been expressed in monetary terms.
Assessing ecosystem services at the scale of Ahrenshoop or the Hütelmoor, or even at a regional level and their integration into spatial plans in Germany, depends currently on individuals in spatial planning and nature protection authorities who see the need and benefits for such assessments and have the time and resources to carry them out. Another driver could be requirements from the EU level, which is a driving force for environmental planning and nature protection, e.g., the Natura 2000 network and the development of management plans for the areas would not have been possible to that extent without EU legislation. While ecosystem services are mentioned in several EU legislations [
42], there is, however, a lack of enforcement when it comes to implementing the concept.
5. Conclusions
Despite some shortcomings, the German hierarchical planning system seems suitable to deal with climate change and provide a framework for adaptation measures in coastal zones. The proactive planning approach ensures an early debate of potential risks. The regular updates of the regional plans (approx. every 10 years) furthermore enable an inclusion of new developments and knowledge. However, how climate change is consequently addressed depends on regional societal awareness and political will. In northern Germany, comprehensive climate change adaptation strategies are partly available or under development. The spatial planning approach and the federal state-wide coastal protection planning largely prevent a shift of climate change risks between municipalities and/or stakeholders. On a local level, environmental and coastal protection planning already ensures climate change adaptation. The coastal realignment in front of the Hütelmoor can serve as an example.
Regional spatial planning is based on the planning association, which consists of all municipal mayors. The planning association is guided and moderated by the planning agency. In regional and local spatial planning and especially in coastal adaptation, planning ecosystem service assessments can mainly serve as a communication tool with a focus on awareness raising (e.g., about consequences of climate change) or for creating an ownership of problems and solutions. However, applications are limited to informal, mainly discussion, processes.
In sectoral planning, comparative ecosystem service approaches can provide a comprehensive insight into consequences of alternative (adaptation) measures. A combination of broad comparative with thematically specific quantitative ecosystem approaches can be of advantage. However, for concrete decision making, ecosystem service approaches would need to provide reliable data and should express results preferably in monetary terms. This still cannot be covered by the existing ecosystem service approaches, which still suffer from methodological serious weaknesses and/or a narrow thematic focus.
Our examples show that, in principle, hypothetical future situations can be addressed with comparative ecosystem service approaches. However, hypothetical future scenarios further increase uncertainties and the results may be not reliable or even misleading.


