Abstract
This study analyzes the spatiotemporal variability of precipitation at the scale of the Moulouya watershed in eastern Morocco, which is very vulnerable to the increasing water shortage. For this purpose, we opted for wavelet transformation, a method based on the spectral analysis of data which allows for periodic components of a rainfall time series to change with time. The results obtained from this work show spectral power across five frequency ranges of variability: 1 to 2 years, 2 to 4 years, 4 to 8 years, 8 to 16 years, and 16 to 32 years. The duration of significant power at these frequencies is generally not homogeneous and varies from station to station. The most widespread frequency over the entire study area was found in the 4- to 8-year range. This mode of variability can last up to 27 consecutive years. In most of the basin, this mode of variability was observed around the period between 1990 and 2010. Oscillations at 8 to 16 years in frequency appear in only five series and over different time periods. The 16- to 32-year mode of variability appears in 15 stations and extends over the period from 1983 to 2008. At this level, signal strength is very weak compared to other higher-frequency modes of variability. On the other hand, the mode of variability at the 1- to 2-year frequency range appeared to be continuous in some stations and intermittent in others. This allowed us to regionalize our study basin into two homogeneous clusters that only differ in variability and rainfall regime.
1. Introduction
In a context characterized by global warming, over the last century, climate change has had an increasing impact on natural environments and human societies [1]. The disturbances of the statistical properties of climatic parameters due to this change of climate qualify as a major problem for the 21st century [2]. Indeed, the majority of the studies carried out show a generalized increase in the average annual air temperature, an increase in the frequency of extreme climatic and hydrological events, and disturbances in the spatiotemporal distribution of precipitation [3,4,5,6,7,8,9]. Therefore, the problem of climate change takes center stage in the concerns of both scientific researchers and political actors [9,10].
Rainfall is the most important component of climate for both people and ecosystems [11]. This importance increases in arid and semi-arid regions suffering from structural water scarcity and recurrent droughts. These environments are very vulnerable to high rainfall variability [12,13]. Moreover, monitoring the evolution of precipitation over time and space in arid environments is difficult [14,15]. The spatiotemporal variability of rainfall also depends on the local geographical conditions of each recording station.
In Morocco, the semi-arid to arid zones cover about 85% of the country and overlap with flat areas [16], crossed by the main rivers and containing fertile arable soils [17,18]. Because the country’s economy is largely based on agricultural income, a large area of these zones is intended for agriculture and influenced by rainfall [19]. Between 2008 and 2018, the weight of the agriculture in the GDP varied between 12% and 14% with an average of 12.8%. Thus, the contribution of the agricultural sector to economic growth increased significantly from 7.3% to nearly 17.3% during the same period [20,21].
Rainfall in Morocco is characterized by high spatiotemporal variability and prolonged dry spells, which have occurred mainly in recent decades [22,23,24]. However, the area’s annual rainfall does not trend in the same direction in all of the country’s watersheds. Filahi et al. [25] detected a trend towards an increase in extreme precipitation and rainfall intensity and a decrease in the number of rainy days in parallel. Abahous et al. [26] reported a general trend towards decreased precipitation in the Sous-Massa region with low statistical significance. The same result was shown by Kessabi et al. [27] in the Fez-Meknes region. Khomsi et al. [28] stated that precipitation showed different trends within each of the Bouregreg and Tansift watersheds, whereas an overall decrease in precipitation was shown by Bouchaou et al. [19].
Other authors conducted studies on the variability of rainfall at the scale of the Maghrib or North Africa. In this context, Nouaceur et al. [29] reported the beginning of a gradual return to wetter conditions since the early 2000s in Algeria and Tunisia and from 2008 for Morocco. In addition, Achite et al. [30] detected a slight positive trend in annual rainfall in the Oued Sly watershed in northern Algeria. On the other hand, Jemai et al. [31] found no trend in rainfall in the northern part of Tunisia.
The Moulouya watershed, which covers almost the entire eastern administrative region of the country, is a good example of an arid area heavily occupied by agricultural activities [32], as it is very vulnerable to the adverse effects of drought and characterized by high demand for water resources [33,34]. For this reason, we focused in this work on the impact of climate change on rainfall variability in this basin.
The choice of the most efficient method for the analysis of rainfall variability is difficult because there are several methods and approaches in the climate and hydrological literature [35]. Most of them do not simultaneously reveal their time–frequency content. On the other hand, in the process of studying the spatiotemporal variability of time series, it is common to perform a spectral analysis [36,37]. Approaches based on this type of analysis are suitable for the treatment of time series at the time–frequency scale [38].
Knowing that rainfall time series data are not stationary and show (quasi-) periodicities, albeit with changing periods and strengths, several methods should be used to study these series [39]. The most frequently applied of these methods is wavelet analysis (wavelet transform and wavelet spectrum), which gives a two-dimensional description of the time series (both for time and frequency) [34,40,41].
Recently, wavelet analysis was successfully applied in scientific work related to rainfall [42,43] because it provided a comprehensive representation of localized and transient phenomena occurring at different time scales [35,44,45]. Thus, particular features of the physical process, such as intermittent oscillation patterns and changes in periodicity, could be identified [46].
Wavelet frequency analysis is also used in many fields where time series data are a central subject of study, including fields ranging from climatology to hydrology, economics, astronomy, physiology, physics, geology, and others [46,47]. Reviews of the hydrological applications of wavelets exist [48].
Given this context, the first part of the study aimed to extract the temporal variability modes of precipitation in the Moulouya basin in northeast Morocco using wavelet analysis. The main objective of this step was to identify periodic or quasi-periodic patterns in the rainfall series and to evaluate how these oscillation modes varied in the study area. The wavelet spectra may reveal time-varying patterns in the main oscillation modes of the time series, which could provide evidence of intensification or attenuation of drought events in the study sites. In addition, the results extracted from the wavelet analysis could indicate (relatively) homogeneous regions subject to similar periodic patterns.
2. Materials and Methods
2.1. Study Area Description
The Moulouya basin (Figure 1) is located in the northeastern part of Morocco and covers an area of about 55,000 km2, according to the Moulouya River Basin Agency (ABHM). The main watercourse of the Moulouya is 600 km long. It takes its sources at the junction of the Middle Atlas massif and the High Atlas and flows northeastward into the Mediterranean at Ras El Ma [32,49]. Administratively, this basin overlaps, entirely or partially, on the territories of the provinces of Nador, Figuig, Jrada, Oujda-Angad, Berkane, Taourirt, Guercif, Taza, Boulemane, Midelt, and Khenifra, with a total population exceeding 2.5 million inhabitants.
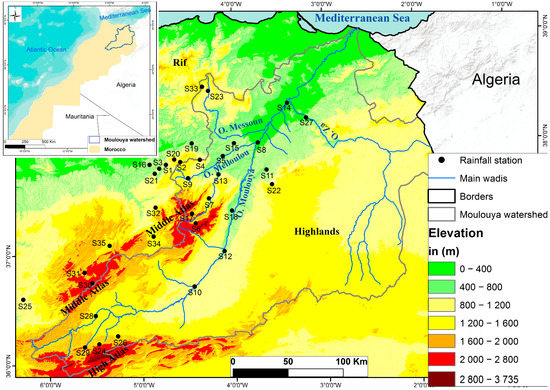
Figure 1.
Geographical location of the Moulouya watershed.
The water supply of the Moulouya plays an important role in the national agricultural economy [50]. Indeed, according to the Ministry of Agriculture, Maritime Fishing, Rural Development and Water and Forests, the contribution of the first seven provinces, which make up the eastern administrative region, is estimated to be 14% for citrus, 10% for olives, 9% for sugar beets, and 8% for red meat [33,51].
The large area and the diversity of the relief of the Moulouya watershed make the climate very variable from one region to another. The climate varies from a Mediterranean type in the lower Moulouya to a relatively cool continental climate in the Upper Moulouya and to arid with Saharan tendencies in the Guercif basin towards the highlands of the Middle Moulouya [32,49,52]. Annual rainfall is relatively low and irregular. Annual cumulative rainfall can vary from less than 100 mm to just over 600 mm [53]. Snowfall generally occurs above 1500 m altitude and persists only above 2000 m altitude on the mountain peaks of the Middle and High Atlas and sometimes on the high plateaus.
2.2. Observed Climate Data Sources and Station Selection
The data used in this study are monthly rainfall amounts. They were collected from the National Meteorological Services, the Moulouya River Basin Agency (ABHM), and the Water, Forestry and Desertification Control Department (EFLCD) at 35 stations located in or around the Moulouya basin (Figure 1 and Table 1). The choice of data sets is based on quality, reliability, geographical location, and the percentage of gaps in their chronicles. Thus, to properly detect rainfall variability over time, the duration of the data records is also of primary importance, and our series oscillated between 1970 and 2019.

Table 1.
Geographical locations of stations. Code of the coordinate system used is EPSG:26191.
Unfortunately, the majority of measurement stations in the basin are distributed along the Moulouya wadi or on its main tributaries. Indeed, the eastern side of the basin remains poorly covered in terms of stations recording climatic data. Furthermore, most of these recording stations are located at low altitudes, which can limit the results of our work.
As in many regions of the world, some of our series are not complete and have gaps that need to be filled. For this purpose, and in order to test the quality of the data, we opted for the Climatol tool (version 3.1.1) https://www.climatol.eu/, accessed on 15 December 2022, which is recommended by several climate researchers [54,55,56,57]. The stations from which data were collected are summarized in the table below.
2.3. Methodology—Continuous Wavelet Transformation
After homogenization, verification of data quality, and filling the data gaps, the Wavelet Power Spectrum (WPS) method was used to analyze the spatiotemporal variability of rainfall at the scale of the Moulouya watershed.
Spectral wavelet methods can be used to show the evolution of rainfall over different temporal scales [58,59]. Continuous wavelet analyses, which we chose in this study, allow temporal localization of the variability of a given signal. The choice of this type of wavelet transform is justified by its robustness for climatic time series due to the wide range of possible dominant frequencies. Moreover, it is an efficient method to analyze non-stationary signals. The signal is decomposed in both time and frequency, which allows the correct description of climatic fluctuations, periodic or not [60].
Grossman and Morlet [61] introduced the wavelet transform, which, unlike the Fourier transform, decomposes the signal into a sum of finite size functions localized in time for each frequency identified in the signal [62,63]. For this, a parent wavelet is dissociated into daughter wavelets to find the given frequency and then translated to analyze neighboring frequencies. Thus, these analyses were developed to overcome the disadvantages of classical Fourier analysis, which assumes that the periodic behavior is the same across all parts of the time series [44]. The daughter wavelets are the result of the decomposition of the reference wavelet (mother wavelet). Each wavelet has a finite length (a scale) and is strongly localized in time [37,64,65]. The wavelet can be characterized by its location in time (t) and frequency (ω or bandwidth). The parent wavelet ψ(t) includes two parameters for time–frequency exploration: a scale parameter a and a temporal localization parameter b (Equation (1)):
where a is the scale parameter that measures the degree of compression, and b is the translation parameter that determines the temporal location of the wavelet. If |a| < 1, then the wavelet in Equation (1) is the compressed version (smaller time-domain support) of the parent wavelet and corresponds primarily to higher frequencies. When |a| > 1, then has a larger time width than ψ(t) and corresponds to lower frequencies. The success of Morlet wavelets in signal processing and time–frequency analysis of the signal depends on matching the time widths to their frequencies. In other words, the product of a complex exponential wave and a Gaussian envelope gives the Morlet wavelet:
where is the wavelet value at dimensionless time η, and is the dimensionless frequency. In order to satisfy an admissibility condition for this study, = 6. This implies that the function must have zero mean and be localized in both time and frequency space to be “admissible” as a wavelet. This is the basic wavelet function, but it is also necessary to change the overall size of the wavelet and drag the entire wavelet in time. Thus, the “scaled wavelets” are defined as:
where s is the “dilation” parameter used to change the scale, and n is the translation parameter used to slide in time. The factor s−1/2 is a normalization to keep the total energy of the scaled wavelet constant. Given a time series X with values of xn at time index n, each value is separated in time by a constant time interval dt. The wavelet transform Wn(s) is simply the inner product of the wavelet function with the original time series:
where the asterisk ψ* represents the complex conjugate, and N is the number of points in the time series.
The applied work was carried out in the RStudio software and by using the open-source and freely downloadable WaveletComp package.
Finally, the power spectrum produced for a given time series is a combination of any cyclicity in the natural process involved and noise. The contour lines in Figure 2 and Figure 4 identify peaks of greater than 95% confidence for a red noise process with a lag-1 coefficient α of 0.18 following Monte Carlo analysis based on the univariate lag-1 autoregressive process. It must not be presumed that regions of the power spectrum out of these 95% confidence level areas are the product of noise only. Cyclic processes may also be present in these regions but influence the power spectrum to a lesser extent that is not clearly distinguishable from noise. The coefficient α is series-specific and is estimated for each series.
The WPS shown in these figures is represented in terms of color scales from dark red (high power) to dark blue (low power). The portion shown in the figures with blurred colors indicates the cone of influence (COI), in which the calculated wavelet power is unreliable due to edge effects.
The average wavelet power (AWP) calculated for each station is also presented in Figure 3 and Figure 5. The red dashed curves in these figures represent the 95% significance level for AWP [66].
3. Results
The results obtained from the transformation of the precipitation series into wavelets are presented in Figure 2 and Figure 4. These figures show the WPS for each station.
We considered five frequency ranges of significant variability at the 95% threshold that were observed in our time series from 1970 to 2019: periods of 1–2 years, 2–4 years, 4–8 years, 8–16 years, and 16–32 years. Generally, the durations of significant periodicity within these frequencies varies from one station to another, with high variability known in the Mediterranean region and especially in its southern part. The most widespread frequency over the entire study area was that of 4–8 years. This mode of variability can last up to 27 consecutive years, as in the case of the Elmers station (S34) (Table 2). In the rest of the basin, this mode of variability is observed around the period of 1990 and 2010 (Table 2). Significant oscillations between 8 and 16 years in frequency appear as spots in only five series with different durations. The same is true for the 16–32 years mode of variability, which appears in 15 stations and spans the period from 1983 to 2008. At this level, signal strength becomes very weak compared to the other higher-frequency modes of variability.
Table 2.
The time variation of the rainfall variability modes extracted from the continuous wavelet analysis in the Moulouya basin.
The most important result in this study is that of a very strong signal, dark red in the color scale, which is observed as a band of 1–2 years in frequency. This signal is continuous or almost continuous from 1970 to 2014 in one group of stations and discontinuous or intermittent in the others. This shows that, from the point of view of rainfall variability, there are two clusters of data in our study area. That is, the series we have does not have the same pattern of variation with time.
The first cluster consists of 13 stations (Figure 2 and Figure 6) whose 1- to 2-year band is significant and continuous at least from 1970 to 2014. Thus, the average signal strength is very high, sometimes reaching a value of seven (Figure 3). The second cluster consists of 22 recording stations. The average wavelet power as a function of frequency is more or less low and generally oscillates between 0 and 3.5 (Figure 5). The significant signal of the 1–2 years band in this cluster is not continuous and appears as several spots of heterogeneous durations (Figure 4).

Figure 2.
Graphs of the results of the wavelet transformations for the first group of data.
Figure 2.
Graphs of the results of the wavelet transformations for the first group of data.


Figure 3.
Average wavelet power for the first group of data.
Figure 3.
Average wavelet power for the first group of data.


Figure 4.
Graphs of the results of the wavelet transformations for the second group of data.
Figure 4.
Graphs of the results of the wavelet transformations for the second group of data.


Figure 5.
Average wavelet power for the second group of data.
Figure 5.
Average wavelet power for the second group of data.


Schematically, the two clusters are separated by the Middle Atlas Mountains. The first group of stations is located in the western part of these mountains (Figure 6). It therefore receives atmospheric disturbances coming from the north or from the wadi of the country. These disturbances are responsible for most of the winter precipitation that Morocco records. The second group is located on the eastern part of the Middle Atlas summits (Figure 6). It covers the arid zone of the Moulouya and is thereby sheltered from the atmospheric disturbances mentioned previously.
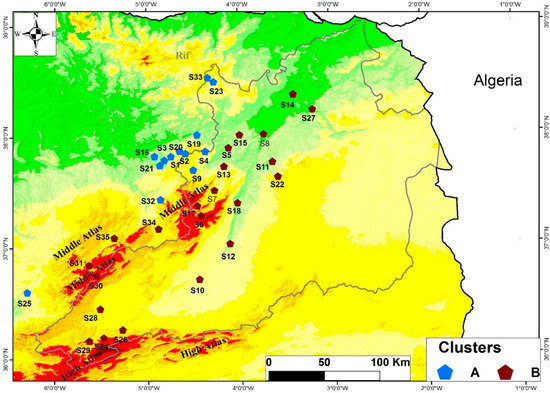
Figure 6.
Clusters of stations.
This found spatial heterogeneity made us ask about patterns in the seasonal rainfall regime and its regularity/irregularity with time. Our results show that the two regions have two different rainfall regimes. The first is spring-dominated and characterizes the stations located to the east and the south of the Middle Atlas mountain ranges (Figure 7). This range acts as an obstacle to the humid atmospheric disturbances coming from the north and west of Morocco. The monthly rainfall maximums are generally recorded in April or in March.
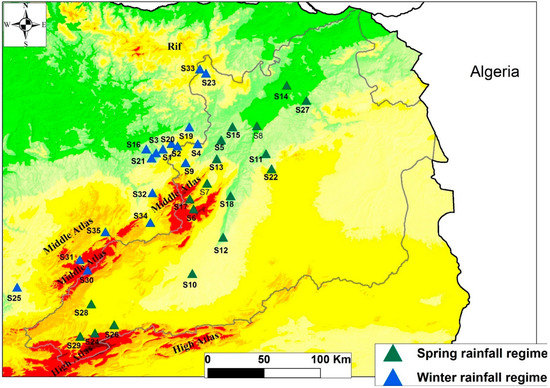
Figure 7.
Seasonal rainfall regime for each station.
The second block of data shows a winter regime and characterizes the stations of the western and northern part of the Middle Atlas (Figure 7). These stations are located in front of the wet winter disturbances. Their monthly peak in precipitation generally occurs in February.
4. Discussion
Our study was based on monthly rainfall data recorded at 35 available stations and ranging from 1970 to 2019. These stations are concentrated in the western part of the basin and along the main rivers. In contrast, the eastern part contains more empty and uninhabited land whose main economic activity is pastoralism [67], which makes the installation of measuring stations in this region less important.
The variability of rainfall in our watershed as an arid environment, in the context of global climate change, is of primary importance [68]. Indeed, this importance comes from several points. The first relates to the strong correlation between the rate of rainfall and agricultural yield in the study area and the fact that the Moulouya watershed suffers from chronic water stress and strong water resource demand [22,23,50,52]. The second point is justified by the objective of flood risk management, as the floods of the Moulouya wadi and its tributaries threaten several cities, including Guercif and Taourirt [53]. The third point relates to the silting of dams by the strong erosive activity in the basin, including water erosion transported during the period of floods. Therefore, rain is a driving force of water erosion [69,70].
The choice of the most efficient method to study this variability poses a challenge [28,71]. The wavelet transform method used in this work was found internationally to be an effective one, as shown by the work of [34,35,42,72].
In the study of rainfall variability based on this last method, we distinguished five frequency bands of rainfall oscillation with periods of 1 to 2 years, 2 to 4 years, 4 to 8 years, 8 to 16 years, and 16 to 32 years. The duration of the oscillations with significant power at these frequencies varies from one station to another depending on its geographical location, altitude, and exposure. These results are close to those obtained by Zamran et al. [34].
In general, the results of our study show a very remarkable spatiotemporal irregularity regarding precipitation. This characterizes the Mediterranean climate and, more particularly, that of the southern part, as shown in the work of [8,73,74]. On the other hand, only the first band, the 1- to 2-year period, provides a clear grouping between the stations within the study basin. Indeed, the WPS figures allow us to distinguish two groups of stations, i.e., two blocks of data.
In addition to the study of rainfall variability, spectral analysis, or wavelet transformation, has also shown its power and robustness in the regionalization of statistical series by clusters [75], which groups stations with the same form of rainfall variability and similar rainfall patterns [76]. This technique allowed us to find two different climate zones. The first has a winter rainfall regime and is located west and northwest of the Middle Atlas mountain range. This geographical situation makes the region exposed to disturbances from the north and west. A second, located in the heart of the Moulouya watershed in arid territory, has a spring regime and is located east or southeast of the peaks of the Middle Atlas. Our results regarding regionalization are consistent with those of Kessabi et al. [27], who worked on the homogenization of rainfall data in the Fez-Meknes region, and of Addou et al. [11], who conducted a study on monthly rainfall trends in the northern Middle Atlas. Both studies used Climatol for gap filling and to homogenize the monthly station precipitation data. In addition, these last two works also show that there is a trend towards an increase in annual rainfall in the part of Moulouya located in the shelter of the Middle Atlas. This increase was explained by a significant increase in autumn rainfall, a result also mentioned by Hanchane [77], despite the small number of stations used in his work compared to the size of the study area. A similar result was reported by Nouaceur et al. [78]. This author explained this increase as an increase in the number of days of extreme rainfall events that usually occur in summer and autumn. On the other hand, the stations located in the northern and western regions of the Middle Atlas show non-significant decreasing or increasing trends. This is explained by a decrease in winter rainfall [27].
5. Conclusions
This study aimed to analyze the spatiotemporal variability of rainfall at the scale of the Moulouya watershed. This territory is very vulnerable to the increasing water shortage. For this purpose, we have opted for a method based on the spectral analysis of rainfall data, the wavelet transformation method.
The results obtained show five modes of variability: 1 to 2 years, 2 to 4 years, 4 to 8 years, 8 to 16 years, and 16 to 32 years. The duration of these frequencies is not generally homogeneous and varies from one time series to another. In contrast, the 1- to 2-year band of variability is continuous at some stations and discontinuous at others. This allowed us to regionalize our study basin into two homogeneous clusters. Therefore, these regions differ from each other in variability and rainfall regime. This addresses the power of the method used not only for the analysis of spatiotemporal variability of rainfall, but also for the homogenization and regionalization of the data.
In addition, the upstream part of the Moulouya watershed is characterized by high altitudes and rugged terrain. This part records, consequently, the highest values of rain and snow precipitation. These water inputs are exploited downstream where the land is flat and where agriculture is more developed. This subdivides the basin into two parts: the upstream part that provides water, which is very poor in infrastructure and investment, and the downstream part, which controls most of the wealth as well as state and private investments. From this point of view, at the level of the Moulouya watershed, the question of justice and solidarity between upstream and downstream came up a lot in recent years.
On the other hand, our study opens research perspectives toward the impacts of current climate change on water resources in Moroccan arid environments and toward forms of adaptation. In addition, the study of the population’s perception of climate change and environmental injustice is very important in order to choose the best intervention policies to reduce spatial imbalances.
Author Contributions
Conceptualization, R.A.; methodology, R.A.; software, R.A. and R.K.; formal analysis, R.A.; validation, R.A. and N.Y.K.; investigation, R.A. and R.K; data curation, R.A. and I.E.A.; writing—original draft preparation, R.A. and N.Y.K.; writing—review and editing, R.A., N.Y.K. and M.H.; visualization, R.A. and M.S.; supervision, N.Y.K., K.O. and M.H. All authors have read and agreed to the published version of the manuscript.
Funding
This research received no external funding.
Institutional Review Board Statement
Not applicable.
Informed Consent Statement
Not applicable.
Data Availability Statement
The data presented in this study are available on request from the corresponding authors.
Conflicts of Interest
The authors declare no conflict of interest.
References
- Wang, S.; Zhang, X.; Liu, Z.; Wang, D. Trend analysis of precipitation in the Jinsha river basin in China. J. Hydrometeorol. 2013, 14, 290–303. [Google Scholar] [CrossRef]
- Safavi, H.R.; Sajjadi, S.M.; Raghibi, V. Assessment of climate change impacts on climate variables using probabilistic ensemble modeling and trend analysis. Theor. Appl. Climatol. 2017, 130, 635–653. [Google Scholar] [CrossRef]
- Pišoft, P.; Kalvová, J.; Brázdil, R. Cycles and trends in the Czech temperature series using wavelet transforms. Int. J. Climatol. 2004, 24, 1661–1670. [Google Scholar] [CrossRef]
- Feidas, H.; Makrogiannis, T.; Bora-Senta, E. Trend analysis of air temperature time series in Greece and their relationship with circulation using surface and satellite data: 1955–2001. Theor. Appl. Climatol. 2004, 79, 185–208. [Google Scholar] [CrossRef]
- Saboohi, R.; Soltani, S.; Khodagholi, M. Trend analysis of temperature parameters in Iran. Theor. Appl. Climatol. 2012, 109, 529–547. [Google Scholar] [CrossRef]
- Ahmad, I.; Zhang, F.; Tayyab, M.; Anjum, M.N.; Zaman, M.; Liu, J.; Farid, H.U.; Saddique, Q. Spatiotemporal analysis of precipitation variability in annual, seasonal and extreme values over upper Indus River basin. Atmos. Res. 2018, 213, 346–360. [Google Scholar] [CrossRef]
- Abahous, H.; Ronchail, J.; Sifeddine, A.; Kenny, L.; Bouchaou, L. Trend and change point analyses of annual precipitation in the Souss-Massa Region in Morocco during 1932–2010. Theor. Appl. Climatol. 2018, 134, 1153–1163. [Google Scholar] [CrossRef]
- Kessabi, R.; Hanchane, M.; Krakauer, N.Y.; Aboubi, I.; El Kassioui, J.; El Khazzan, B. Annual, Seasonal, and Monthly Rainfall Trend Analysis through Non-Parametric Tests in the Sebou River Basin (SRB), Northern Morocco. Climate 2022, 10, 170. [Google Scholar] [CrossRef]
- Ouhamdouch, S.; Bahir, M.; Ouazar, D.; Carreira, P.M.; Zouari, K. Evaluation of climate change impact on groundwater from semi-arid environment (Essaouira Basin, Morocco) using integrated approaches. Environ. Earth Sci. 2019, 78, 449. [Google Scholar] [CrossRef]
- Bouras, E.; Jarlan, L.; Khabba, D.; Er-Raki, S.; Dezetter, A.; Sghir, F.; Tramblay, Y. Assessing the impact of global climate changes on irrigated wheat yields and water requirements in a semi-arid environment of Morocco. Sci. Rep. 2019, 9, 19142. [Google Scholar] [CrossRef]
- Addou, R.; Hanchane, M.; Obda, K.; Krakauer, N.Y.; El Khazzan, B.; Kessabi, R.; Achiban, H. Monthly Precipitation over Northern Middle Atlas, Eastern Morocco: Homogenization and Trends. Appl. Sci. 2022, 12, 23. [Google Scholar] [CrossRef]
- Tabari, H.; Hosseinzadeh Talaee, P. Analysis of trends in temperature data in arid and semi-arid regions of Iran. Glob. Planet. Change 2011, 79, 1–10. [Google Scholar] [CrossRef]
- Ouarda, T.B.M.J.; Charron, C.; Niranjan Kumar, K.; Marpu, P.R.; Ghedira, H.; Molini, A.; Khayal, I. Evolution of the rainfall regime in the united arab emirates. J. Hydrol. 2014, 514, 258–270. [Google Scholar] [CrossRef]
- Laignel, B.; Nouaceur, Z.; Abida, H.; Ellouze, M. Vers un retour des pluies dans le nord-est tunisien? In Proceedings of the XXVIIe Colloque de l’Association Internationale de Climatologie, Dijon, France, 2–5 July 2014; pp. 727–732. [Google Scholar]
- Hutchinson, M.F. Interpolation of rainfall data with thin plate smoothing splines—Part I: Two-dimensional smoothing of data with short range correlation. J. Geogr. Inf. Decis. Anal. 1998, 2, 139–151. [Google Scholar]
- Ed-Dahmouni, H.; Eddelani, O.; El-Broumi, S. Gestion des ressources en eau au Maroc: D’une simple lutte contre la dégradation à l’étude faisabilité des Paiements pour les Services Environnementaux (PSE)/Management of Water Resources in Morocco: From a Simple Fight against Degradation to the Feasibility Study of Payments for Environmental Services (PES). Rev. Int. Sci. Gest. 2019, 2, 675–698. [Google Scholar]
- Meddi, M.; Eslamian, S. Uncertainties in Rainfall and Water Resources in Maghreb Countries Under Climate Change. In African Handbook of Climate Change Adaptation; Oguge, N., Ayal, D., Adeleke, L., da Silva, I., Eds.; Springer: Cham, Switzerland, 2021. [Google Scholar]
- Addou, R. Hydrologie de l’Oued Melloulou et Changements Actuels: Perturbation des Régimes Climatiques et Pression Anthropique. Ph.D. Thesis, Sais Faculty of Letters and Human Sciences, Sidi Mohamed Ben Abdellah University, Fez, Morocco, 2021; pp. 1–307. [Google Scholar]
- Bouchaou, L.; Tagma, T.; Boutaleb, S.; Hssaisoune, M.; El Morjani, Z.E.A. Climate change and its impacts on groundwater resources in Morocco: The case of the Souss-Massa basin. In Climate Change Effects on Groundwater Resources: A Global Synthesis of Findings and Recommendations; CRC Press: London, UK, 2011; pp. 129–144. [Google Scholar]
- Akesbi, N. L’Agriculture marocaine, entre les contraintes de la dépendance alimentaire et les exigences de la régulation sociale. Maghreb-Machrek 2013, 215, 31–56. [Google Scholar] [CrossRef]
- Toumi, L. La Nouvelle Stratégie Agricole au Maroc (Plan Vert): Les Clés de la Réussite; Haut Commisariat au Plan: Casablanca, Morocco, 2008; pp. 1–17. [Google Scholar]
- Ouatiki, H.; Boudhar, A.; Ouhinou, A.; Arioua, A.; Hssaisoune, M.; Bouamri, H.; Benabdelouahab, T. Trend analysis of rainfall and drought over the Oum Er-Rbia River Basin in Morocco during 1970–2010. Arab. J. Geosci. 2019, 12, 128. [Google Scholar] [CrossRef]
- Driouech, F.; Mahé, G.; Déqué, M.; Dieulin, C.; Heirech, T.; Milano, M.; Benabdelfadel, A.; Rouché, N. Evaluation d’impacts potentiels de changements climatiques sur l’hydrologie du bassin versant de la Moulouya au Maroc. In Proceedings of the World FRIEND Conference: Global Change: Facing Risks and Threats to Water Resources, Fez, Morocco, 25–29 October 2010; pp. 561–567. [Google Scholar]
- Tramblay, Y.; El Adlouni, S.; Servat, E. Trends and variability in extreme precipitation indices over maghreb countries. Nat. Hazards Earth Syst. Sci. 2013, 13, 3235–3248. [Google Scholar] [CrossRef]
- Filahi, S.; Tanarhte, M.; Mouhir, L.; El Morhit, M.; Tramblay, Y. Trends in indices of daily temperature and precipitations extremes in Morocco. Theor. Appl. Climatol. 2016, 124, 959–972. [Google Scholar] [CrossRef]
- Abahous, H.; Guijarro, J.A.; Sifeddine, A.; Chehbouni, A.; Ouazar, D.; Bouchaou, L. Monthly precipitations over semi-arid basins in Northern Africa: Homogenization and trends. Int. J. Climatol. 2020, 40, 6095–6105. [Google Scholar] [CrossRef]
- Kessabi, R.; Hanchane, M.; Guijarro, J.A.; Krakauer, N.Y.; Addou, R.; Sadiki, A.; Belmahi, M. Homogenization and Trends Analysis of Monthly Precipitation Series in the Fez-Meknes Region, Morocco. Climate 2022, 10, 64. [Google Scholar] [CrossRef]
- Khomsi, K.; Mahe, G.; Tramblay, Y.; Sinan, M.; Snoussi, M. Regional impacts of global change: Seasonal trends in extreme rainfall, run-off and temperature in two contrasting regions of Morocco. Nat. Hazards Earth Syst. Sci. 2016, 16, 1079–1090. [Google Scholar] [CrossRef]
- Nouaceur, Z.; Murărescu, O. Rainfall Variability and Trend Analysis of Annual Rainfall in North Africa. Int. J Atmos. Sci. 2016, 2016, 7230450. [Google Scholar] [CrossRef]
- Achite, M.; Caloiero, T. Analysis of temporal and spatial rainfall variability over the Wadi Sly basin, Algeria. Arab. J. Geosci. 2021, 14, 1867. [Google Scholar] [CrossRef]
- Jemai, H.; Ellouze, M.; Abida, H.; Laignel, B. Spatial and temporal variability of rainfall: Case of Bizerte-Ichkeul Basin (Northern Tunisia). Arab. J. Geosci. 2018, 11, 117. [Google Scholar] [CrossRef]
- Zamrane, Z. Recherche D’indices de Variabilité Climatique Dans des Séries Hydroclmatiques au Maroc: Identification, Positionnement Temporel, Tendances et Liens Avec les Fluctuations Climatiques: Cas Des Grands Bassins de la Moulouya, du Sebou et du Tensift. Ph.D. Thesis, Montpellier University, Montpellier, France, 2016; p. 197. [Google Scholar]
- François, A.; Gauché, E.; Génin, A. L’adaptation des territoires aux changements climatiques dans l’Oriental marocain: La vulnérabilité entre action et perceptions. VertigO Rev. Électronique Sci. Environ. 2016, 16. [Google Scholar] [CrossRef]
- Zamrane, Z.; Mahé, G.; Laftouhi, N.E. Wavelet analysis of rainfall and runoff multidecadal time series on large river basins in western north africa. Water 2021, 13, 3243. [Google Scholar] [CrossRef]
- Santos, C.A.G.; de Morais, B.S. Identification of precipitation zones within São Francisco River basin (Brazil) by global wavelet power spectra. Hydrol. Sci. J. 2013, 58, 789–796. [Google Scholar] [CrossRef]
- Santos, M.S.; Costa, V.A.F.; Fernandes, W.D.S.; de Paes, R.P. Time-space characterization of droughts in the São Francisco river catchment using the Standard Precipitation Index and continuous wavelet transform. Rev. Bras. Recur. Hidricos 2019, 24, 1–12. [Google Scholar] [CrossRef]
- Labat, D. Recent advances in wavelet analyses: Part 1. A review of concepts. J. Hydrol. 2005, 314, 275–288. [Google Scholar] [CrossRef]
- Labat, D.; Ronchail, J.; Guyot, J.L. Recent advances in wavelet analyses—Part 2: Amazon, Parana, Orinoco and Congo discharges time scale variability. J. Hydrol. 2005, 314, 289–311. [Google Scholar] [CrossRef]
- El-Khantoury, I.; Obda, K.; Achiban, H. Wavelet Analysis: A Links Between the North Atlantic Oscillation andWinter Drought in the MediterraneanWatersheds of the Western Rif (North Morocco). Eur. Sci. J. 2020, 16, 99. [Google Scholar] [CrossRef]
- Costa, A. de S.; dos Santos, N.A.; Braga, C.C. Rainfall diagnosis in different time scales in Maranhão using the wavelet transform. J. Hyperspectral Remote Sens. 2016, 6, 295–304. [Google Scholar] [CrossRef]
- Sonechkin, D.M.; Datsenko, N.M. Wavelet Analysis of Nonstationary and Chaotic Time Series with an Application to the Climate Change Problem. Pure Appl. Geophys. 2000, 157, 653–677. [Google Scholar] [CrossRef]
- Joshi, N.; Gupta, D.; Suryavanshi, S.; Adamowski, J.; Madramootoo, C.A. Analysis of trends and dominant periodicities in drought variables in India: A wavelet transform based approach. Atmos. Res. 2016, 182, 200–220. [Google Scholar] [CrossRef]
- Sang, Y.F.; Wang, D.; Wu, J.C.; Zhu, Q.P.; Wang, L. Entropy-based wavelet de-noising method for time series analysis. Entropy 2009, 11, 1123–1147. [Google Scholar] [CrossRef]
- Partal, T. Wavelet analysis and multi-scale characteristics of the runoff and precipitation series of the Aegean region (Turkey). Int. J. Climatol. 2012, 120, 108–120. [Google Scholar] [CrossRef]
- Baidu, M.; Amekudzi, L.K.; Aryee, J.N.A.; Annor, T. Assessment of long-term spatio-temporal rainfall variability over Ghana using wavelet analysis. Climate 2017, 5, 30. [Google Scholar] [CrossRef]
- Rodríguez-Murillo, J.C.; Filella, M. Significance and causality in continuous wavelet and wavelet coherence spectra applied to hydrological time series. Hydrology 2020, 7, 82. [Google Scholar] [CrossRef]
- Sang, Y. A review on the applications of wavelet transform in hydrology time series analysis. Atmos. Res. 2013, 122, 8–15. [Google Scholar] [CrossRef]
- Nourani, V.; Andalib, G.; Dąbrowska, D. Conjunction of wavelet transform and SOM-mutual information data pre- processing approach for AI-based multi-station nitrate modeling of watersheds. J. Hydrol. 2017, 548, 170–183. [Google Scholar] [CrossRef]
- Riad, S. Typologie et Analyse Hydrologique des Eaux Superficielles à Partir de Quelques Bassins Versants Représentatifs du Maroc. Ph.D. Thesis, Ibn Zohr University, Agadir, Morocco, Polytechnic University of Lille, Lille, France, 2003; pp. 1–154. [Google Scholar]
- Amiri, M.; Salem, A.; Ghzal, M. Spatial-Temporal Water Balance Components Estimation Using Integrated GIS-Based Wetspass-M Model in Moulouya Basin, Morocco. ISPRS Int. J. Geo-Inf. 2022, 11, 139. [Google Scholar] [CrossRef]
- Royaume du Maroc Haut Commissariat au Plan Direction Régionale d’Oujda. L’otientale: Chiffres clés 2013; Royaume du Maroc Haut Commissariat au Plan, Direction Régionale d’Oujda: Oujda, Marocco, 2014; pp. 1–29.
- Tekken, V.; Protection, C. Climate-Driven or Human-Induced: Indicating Severe Water Scarcity in the Moulouya River Basin (Morocco). Water 2012, 4, 959–982. [Google Scholar] [CrossRef]
- Diani, K.; Tabyaoui, H.; Kacimi, I.; El Hammichi, F.; Nakhcha, C. Stream Network Modelling from Aster GDEM Using ArcHydro GIS: Application to the Upper Moulouya River Basin (Eastern, Morocco). J. Geosci. Environ. Prot. 2017, 5, 1–13. [Google Scholar] [CrossRef]
- Guijarro, J.A.; López, J.A.; Aguilar, E.; Domonkos, P.; Victor, K.C.V.; Sigró, J.; Brunet, M. Comparison of homogenization packages applied to monthly series of temperature and precipitation: The MULTITEST project. In Proceedings of the 9th Seminar for Homogenization and Quality Control in Climatological Databases, Budapest, Hungary, 3–7 April 2017; pp. 46–62. [Google Scholar]
- Guijarro, J.A. Recommended Homogenization Techniques Based on Benchmarking Results; Indices: Tarragona, Spain, 2020; pp. 1–9. [Google Scholar]
- Mahmood, R.; Jia, S. Quality control and homogenization of daily meteorological data in the trans-boundary region of the Jhelum River basin. J. Geogr. Sci. 2016, 26, 1661–1674. [Google Scholar] [CrossRef]
- Yimer, S.M.; Kumar, N.; Bouanani, A.; Tischbein, B.; Borgemeister, C. Homogenization of daily time series climatological data in the Eastern Nile basin, Ethiopia. Theor. Appl. Climatol. 2021, 143, 737–760. [Google Scholar] [CrossRef]
- Adarsh, S.; Janga Reddy, M. Trend analysis of rainfall in four meteorological subdivisions of southern India using nonparametric methods and discrete wavelet transforms. Int. J. Climatol. 2015, 35, 1107–1124. [Google Scholar] [CrossRef]
- Pandey, B.K.; Tiwari, H.; Khare, D. Trend analysis using discrete wavelet transform (DWT) for long-term precipitation (1851–2006) over India. Hydrol. Sci. J. 2017, 62, 2187–2208. [Google Scholar] [CrossRef]
- Zhao, T.; Wu, L.; Li, D.; Ding, Y. Multifractal Analysis of Hydrologic Data Using Wavelet Methods and Fluctuation Analysis. Discret. Dyn. Nat. Soc. 2017, 2017, 3148257. [Google Scholar] [CrossRef]
- Grossmann, A.; Morlet, J. Decomposition of Hardy Functions into Square Integrable Wavelets of Constant Shape. SIAM J. Math. Anal. 1984, 15, 723–736. [Google Scholar] [CrossRef]
- Khedimallah, A.; Meddi, M.; Mahé, G. Characterization of the interannual variability of precipitation and runoff in the Cheliff and Medjerda basins (Algeria). J. Earth Syst. Sci. 2020, 129, 134. [Google Scholar] [CrossRef]
- Kantelhardt, J.W.; Rybski, D.S.; Zschiegner, A.; Braun, P.; Koscielny-Bunde, E.; Livina, V.; Havlin, S.; Bunde, A. Multifractality of river runoff and precipitation: Comparison of fluctuation analysis and wavelet methods. Phys. Stat. Mech. Its Appl. 2003, 330, 240–245. [Google Scholar] [CrossRef]
- Torrence, C.; Compo, G.P. A Practical Guide to Wavelet Analysis; Program in Atmospheric and Oceanic Sciences, University of Colorado: Boulder, CO, USA, 1998. [Google Scholar]
- Labat, D. Cross wavelet analyses of annual continental freshwater discharge and selected climate indices. J. Hydrol. 2010, 385, 269–278. [Google Scholar] [CrossRef]
- Tiwari, A.K.; Cunado, J.; Gupta, R.; Wohar, M.E. Are stock returns an inflation hedge for the UK? Evidence from a wavelet analysis using over three centuries of data. Stud. Nonlinear Dyn. Econom. 2019, 23, 20170049. [Google Scholar] [CrossRef]
- Bekri, M.H.; El Hmaidi, A.; El Faleh, E.M.; Essahlaoui, A.; El Ouali, A.; Jaddi, H.; Ousmana, H. Caractérisation des épisodes de sècheresse dans le bassin versant de l’Oued d’Ansegmir (Haute Moulouya, Maroc). J. Int. Sci. Tech. Eau Environ. 2019, IV, 85–93. [Google Scholar]
- Hachem, A.; Mili, E.M.; Benbella, B.; El Ouardi, H.; Mehdaoui, R. Characterization of Climatic Drought Sequences in the Upper Moulouya Watershed, Morocco. Ecol. Eng. Environ. Technol. 2023, 24, 162–179. [Google Scholar] [CrossRef]
- Ait Haddou, M.; Kabbachi, B.; Aydda, A.; Gougni, H.; Bouchriti, Y. Spatial and temporal rainfall variability and erosivity: Case of the Issen watershed, SW-Morocco. E3S Web Conf. 2020, 183, 02003. [Google Scholar] [CrossRef]
- Sbai, A.; Mouadili, O.; Hlal, M.; Benrbia, K.; Mazari, F.Z.; Bouabdallah, M.; Saidi, A. Water Erosion in the Moulouya Watershed and its Impact on Dams’ Siltation (Eastern Morocco). Proc. Int. Assoc. Hydrol. Sci. 2021, 384, 127–131. [Google Scholar] [CrossRef]
- Driouech, F. Distribution des Précipitations Hivernales Sur le Maroc Dans le Cadre d’un Changement Climatique: Descente D’échelle et Incertitudes. Ph.D. Thesis, The University of Toulouse, Toulouse, France, 2010; pp. 1–164. [Google Scholar]
- Correa, C.S.; Guedes, R.L.; da Rocha, A.M.M.; Corrêa, K.A.B. Multidecadal cycles of the climatic index atlantic meridional mode: Sunspots that affect north and northeast of Brazil. J. Aerosp. Technol. Manag. 2020, 12, e0420. [Google Scholar] [CrossRef]
- Abdelali, S.; Mohammed, H.; Fougrach, H.; Saloui, A. Retour des pluies au maroc méridional. In Proceedings of the XXVIIe Colloque de l’Association Internationale de Climatologie, Dijon, France, 2–5 July 2014; pp. 596–600. [Google Scholar]
- Kessabi, R.; Hanchane, M.; Caloiero, T.; Pellicone, G.; Addou, R.; Krakauer, N.Y. Analyzing Spatial Trends of Precipitation Using Gridded Data in the Fez-Meknes Region, Morocco. Hydrology 2023, 10, 37. [Google Scholar] [CrossRef]
- Talagala, T.; Lokupitiya, R. Wavelet analysis of dengue transmission pattern in Sri Lanka. Int. J. Mosq. Res. 2015, 2, 13–18. [Google Scholar]
- Mateescu, M.; Haidu, I. La méthode des ondelettes comme outil de test d’homogénéité le cas des précipitations à Cluj, Roumanie. In Proceedings of the XXème Colloque de l’Association Internationale de Climatologie: Climat, Tourisme, Environnement, Carthage, Tunisia, 3–8 September 2007; pp. 369–374. [Google Scholar]
- Hanchane, M. Méthodologie de régionalisation spatio- temporelle pour une analyse des précipitations (1961–1992): Application au Maroc atlantique. In Proceedings of the Actes du Deuxième Colloque International “Eau & Climat: Regards croisés Nord/Sud”, Fez, Morocco, 27–28 November 2013. [Google Scholar]
- Nouaceur, Z.; Laignel, B.; Turki, I. Changements climatiques au Maghreb: Vers des conditions plus humides et plus chaudes sur le littoral algérien? Physio-Géo 2013, 7, 307–323. [Google Scholar] [CrossRef]


Disclaimer/Publisher’s Note: The statements, opinions and data contained in all publications are solely those of the individual author(s) and contributor(s) and not of MDPI and/or the editor(s). MDPI and/or the editor(s) disclaim responsibility for any injury to people or property resulting from any ideas, methods, instructions or products referred to in the content. |
© 2023 by the authors. Licensee MDPI, Basel, Switzerland. This article is an open access article distributed under the terms and conditions of the Creative Commons Attribution (CC BY) license (https://creativecommons.org/licenses/by/4.0/).