Article

An Attention-Based Method for Remaining Useful Life Prediction of Rotating Machinery

School of Electromechanical Engineering, Guangdong University of Technology, Guangzhou 510006, China
*
Authors to whom correspondence should be addressed.
Appl. Sci. 2023, 13(4), 2622; https://doi.org/10.3390/app13042622
Submission received: 1 February 2023 / Revised: 16 February 2023 / Accepted: 16 February 2023 / Published: 17 February 2023

Abstract

:
Data imbalance and large data probability distribution discrepancies are major factors that reduce the accuracy of remaining useful life (RUL) prediction of high-reliability rotating machinery. In feature extraction, most deep transfer learning models consider the overall features but rarely attend to the local target features that are useful for RUL prediction; insufficient attention paid to local features reduces the accuracy and reliability of prediction. By considering the contribution of input data to the modeling output, a deep learning model that incorporates the attention mechanism in feature selection and extraction is proposed in our work; an unsupervised clustering method for classification of rotating machinery performance state evolution is put forward, and a similarity function is used to calculate the expected attention of input data to build an input data extraction attention module; the module is then fused with a gated recurrent unit (GRU), a variant of a recurrent neural network, to construct an attention-GRU model that combines prediction calculation and weight calculation for RUL prediction. Tests on public datasets show that the attention-GRU model outperforms traditional GRU and LSTM in RUL prediction, achieves less prediction error, and improves the performance and stability of the model.

1. Introduction

Rotating machinery accounts for the core of high-end precision electronic manufacturing equipment. To cut the maintenance cost and fault rate of rotating machinery, it is necessary to monitor the working condition of rotating parts in real time and forecast their remaining useful life (RUL) so that faults can be precluded or parts can be swapped in a timely manner after faults occur, thereby avoiding damage and equipment loss [1]. The rotating parts of precision electronic manufacturing equipment are high-reliability (Hi-Rel) parts. Changes occur in the data when rotating machinery transitions from a “healthy state” to a “degradation-begun state”. The “degradation-begun state” takes a long time, whereas there are several evolution stages in the “degradation-intensified state”, each lasting a short length of time. As a result, most experimental RUL data for rotating machinery are from samples in the healthy state, and data from samples in degradation states are rare. Therefore, RUL prediction of rotating parts in high-end precision electronic manufacturing equipment is associated with challenges such as data imbalance and large differences in data probability distribution, which reduce the performance and prediction accuracy of traditional deep learning models or even make these models invalid [2].
To address the problem of data imbalance in deep learning modeling, in 2018, Jia et al. [3] proposed a framework called deep normalized convolutional neural network (DNCNN) in which normalized layers based on rectified linear units (ReLUs) and weight normalization are used for effective model training and weighted Softmax loss is used to adaptively handle the imbalanced classification problem. Zhang et al. [4] proposed a deep learning method for rotating machinery fault diagnosis in which a generative adversarial network (GAN) is used to learn noise distribution and map relations between real machine vibration data in the time domain; then, explicit expressions are used to create an expanded dataset of real false samples to solve the problem of data imbalance. Ainapure et al. [5] proposed a domain adaptation technique with a maximum mean discrepancy metric to learn generalized diagnostic features so that the health identification model learned from the training machines can be effectively applied to new machines. Chen et al. [6] put forward a domain adversarial transfer network (DATN), which employs task-specific feature learning networks and domain adversarial training techniques to address large distribution discrepancies across domains.
Li [7] put forward a deep convolution domain adversarial transfer learning (DCDATL) model for fault diagnosis of rolling bearings; specifically, joint distribution of labeled samples in the auxiliary domain and unlabeled samples in the target domain is creatively used for domain adversarial training, which enhances the adaptability of samples in the auxiliary domain to the target domain and improves the transfer performance of the method. As there are few labeled fault data in real-world production, Jie et al. [8] put forward a deep-learning-based subdomain adaptation method for gear fault diagnosis that extracts transferrable features from fault data and exploits multikernel local maximum differences to measure the distribution discrepancy of transferrable features in relevant subdomains. Zhang et al. [9] put forward an attention-aware face recognition method based on a deep convolutional neural network (CNN) and reinforcement learning, which achieved satisfactory recognition performance on face verification databases. Cai et al. [10] put forth a novel quadratic polynomial-guided fuzzy C-means and dual-attention (QPFC-DA) mechanism composite network model architecture to solve the problem of limited segmentation performance as a result of high complexity and noise in medical images. Ning et al. [11] put forward a joint weak saliency and attention-aware (JWSAA) method for person reidentification. Their method uses a weak significance mechanism to remove background information from the image and focuses on persons in the image; the features of different parts of the person are adaptively extracted through an attention perception module. Wu et al. [12] put forward a deep convolutional migration network based on spatial pyramid pooling (SPP-CNNTL) that uses transfer learning (TL) with a maximum mean deviation (MMD) measurement function in RUL prediction and solves the difference in data distribution under different failure types. Li et al. [13] put forward a two-stage TR-CNN method based on transfer learning for the prediction of the RUL of bearings; the model is trained in the form of domain invariance by minimizing the probability distribution distance. This method solves the model prediction problem caused by the distribution difference between two datasets and improves the migration ability of the model. Miao et al. [14] put forward a sparse domain adaptation network (SDAN) to solve the problem of data distribution difference caused by different operation conditions. This method combines domain adversarial learning and sparse domain alignment in sparse domain adaptation, which guides SDAN to learn domain-invariant features and improves the RUL prediction performance of bearings under different working conditions. Lu et al. [15] put forward a new generative adversarial network (GAN) based on the prognostic method for RUL prediction and integrated the training process of bearing health predictors into the GAN architecture. GAN generates synthetic degradation data based on available time series degradation data; then, the model acquires knowledge from both training data and synthetic data, thereby solving the problem of data imbalance and enhancing the prediction performance of the model. Cai et al. [16] put forward a novel Bole convolution (BC) neural network with a tandem three-direction attention (TDA) mechanism (BTA-Net) for the classification of small samples and unbalanced data, which eliminates redundant information and achieves feature mining.
Research on data-driven machinery RUL prediction has made considerable headway in recent years. In particular, deep transfer learning methods have been extensively applied to machinery health prediction, which uses knowledge learned from labeled data in the source domain to identify health information represented by unlabeled data in the target domain. Successful application of these methods relies on the assumption that cross-domain label spaces are the same. Smart models focus on the global features of data when extracting deep features but neglect or pay little attention to the useful local target features, which compromises the accuracy and reliability of the models in learning features.
To address the problem that existing models overlook useful local target features and cannot extract features in a selective manner, we consider the contribution of input data to the modeling output and propose an attention-based RUL prediction method for rotating machinery. Specifically, the performance evolution of rotating machinery is classified into different states, and an attention mechanism is introduced to assign varied weights to the GRU inputs so that the model can extract more important information for RUL prediction and achieve accurate extraction of both global and local features of the target object, thereby achieving higher accuracy and stability in prediction.

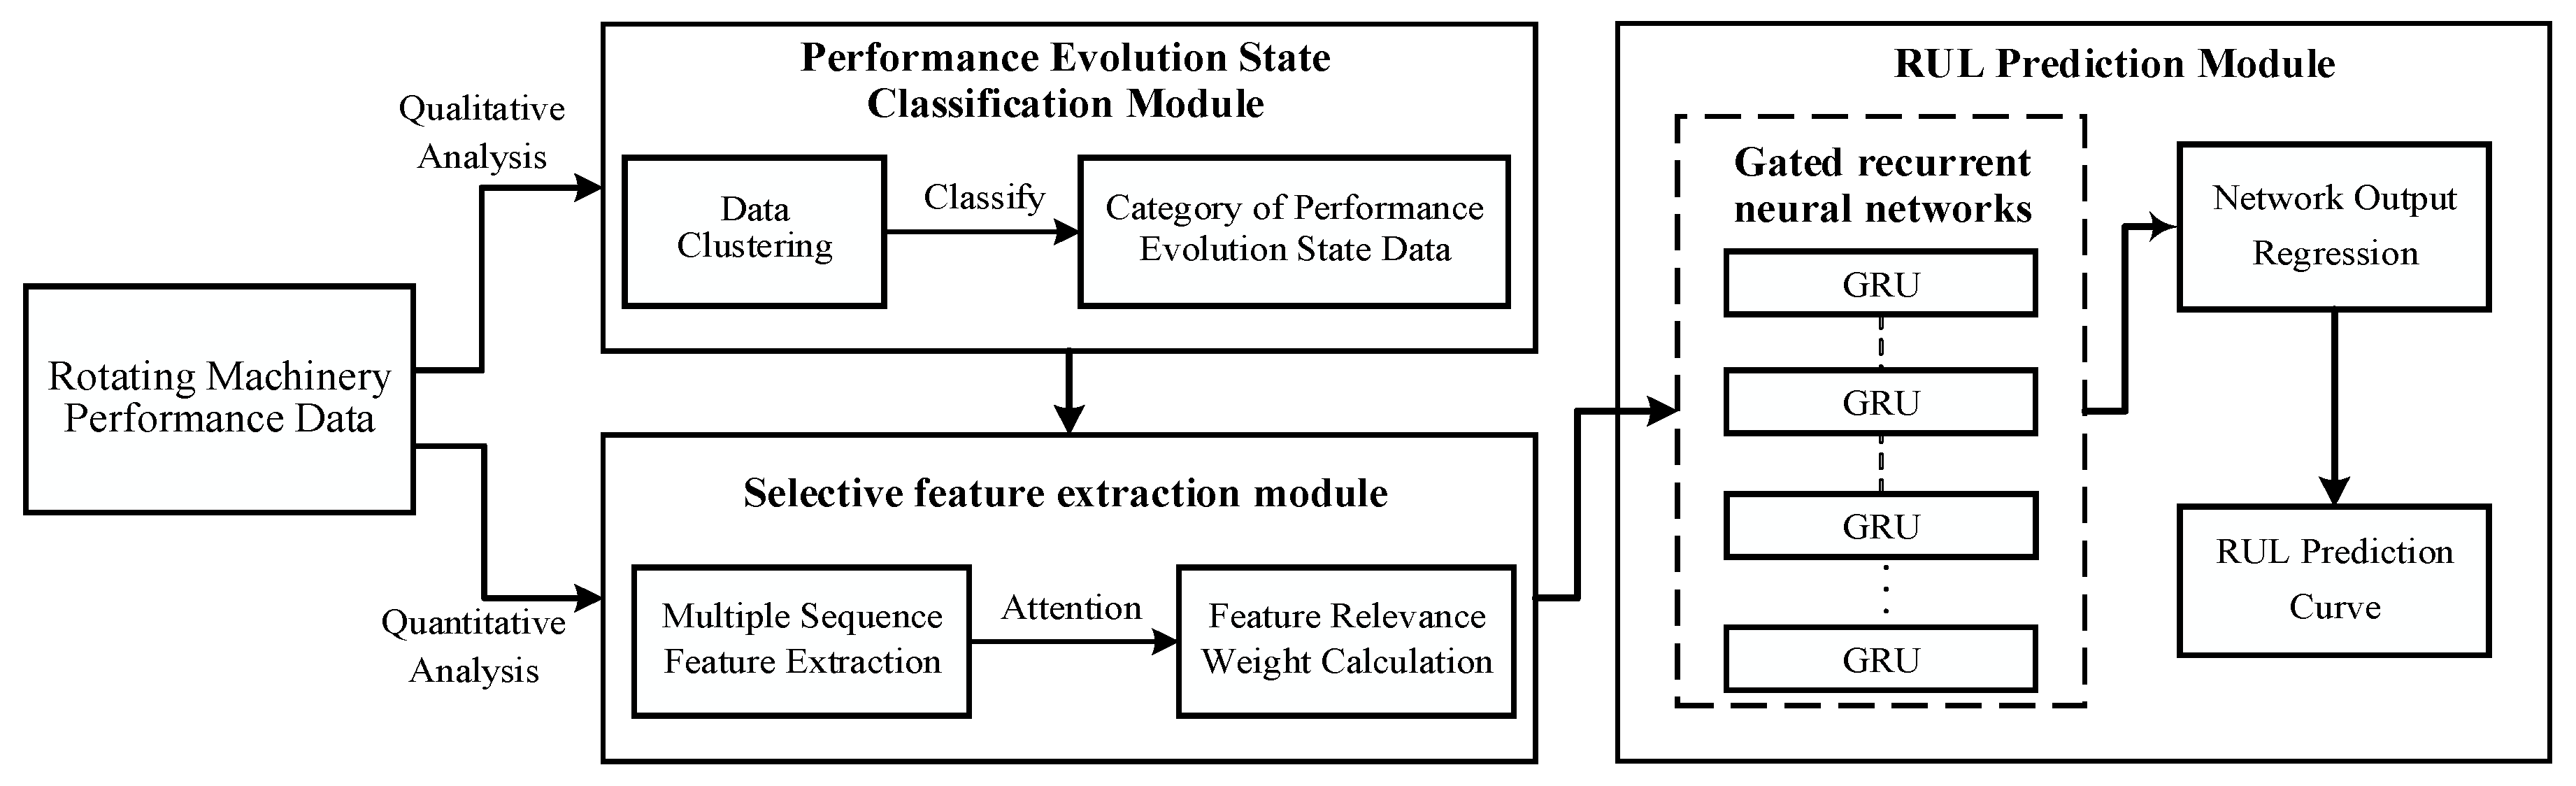
2. Attention-Based RUL Prediction of Rotating Machinery

The attention mechanism was proposed by a team from Google in 2017 [17], inspired by the observation that humans tend to selectively focus on some salient regions in complex scenes instead of paying attention to all regions indiscriminately. Attention-based RUL prediction for rotating machinery involves two processes: qualitative analysis and quantitative analysis. The model consists of a performance evolution state classification module, a selective feature extraction module, and an RUL prediction module, as shown in Figure 1. The purpose of qualitative analysis is to classify the performance evolution states through clustering; quantitative analysis reconstructs the network channel weights assigned by the attention mechanism based on the classification result.

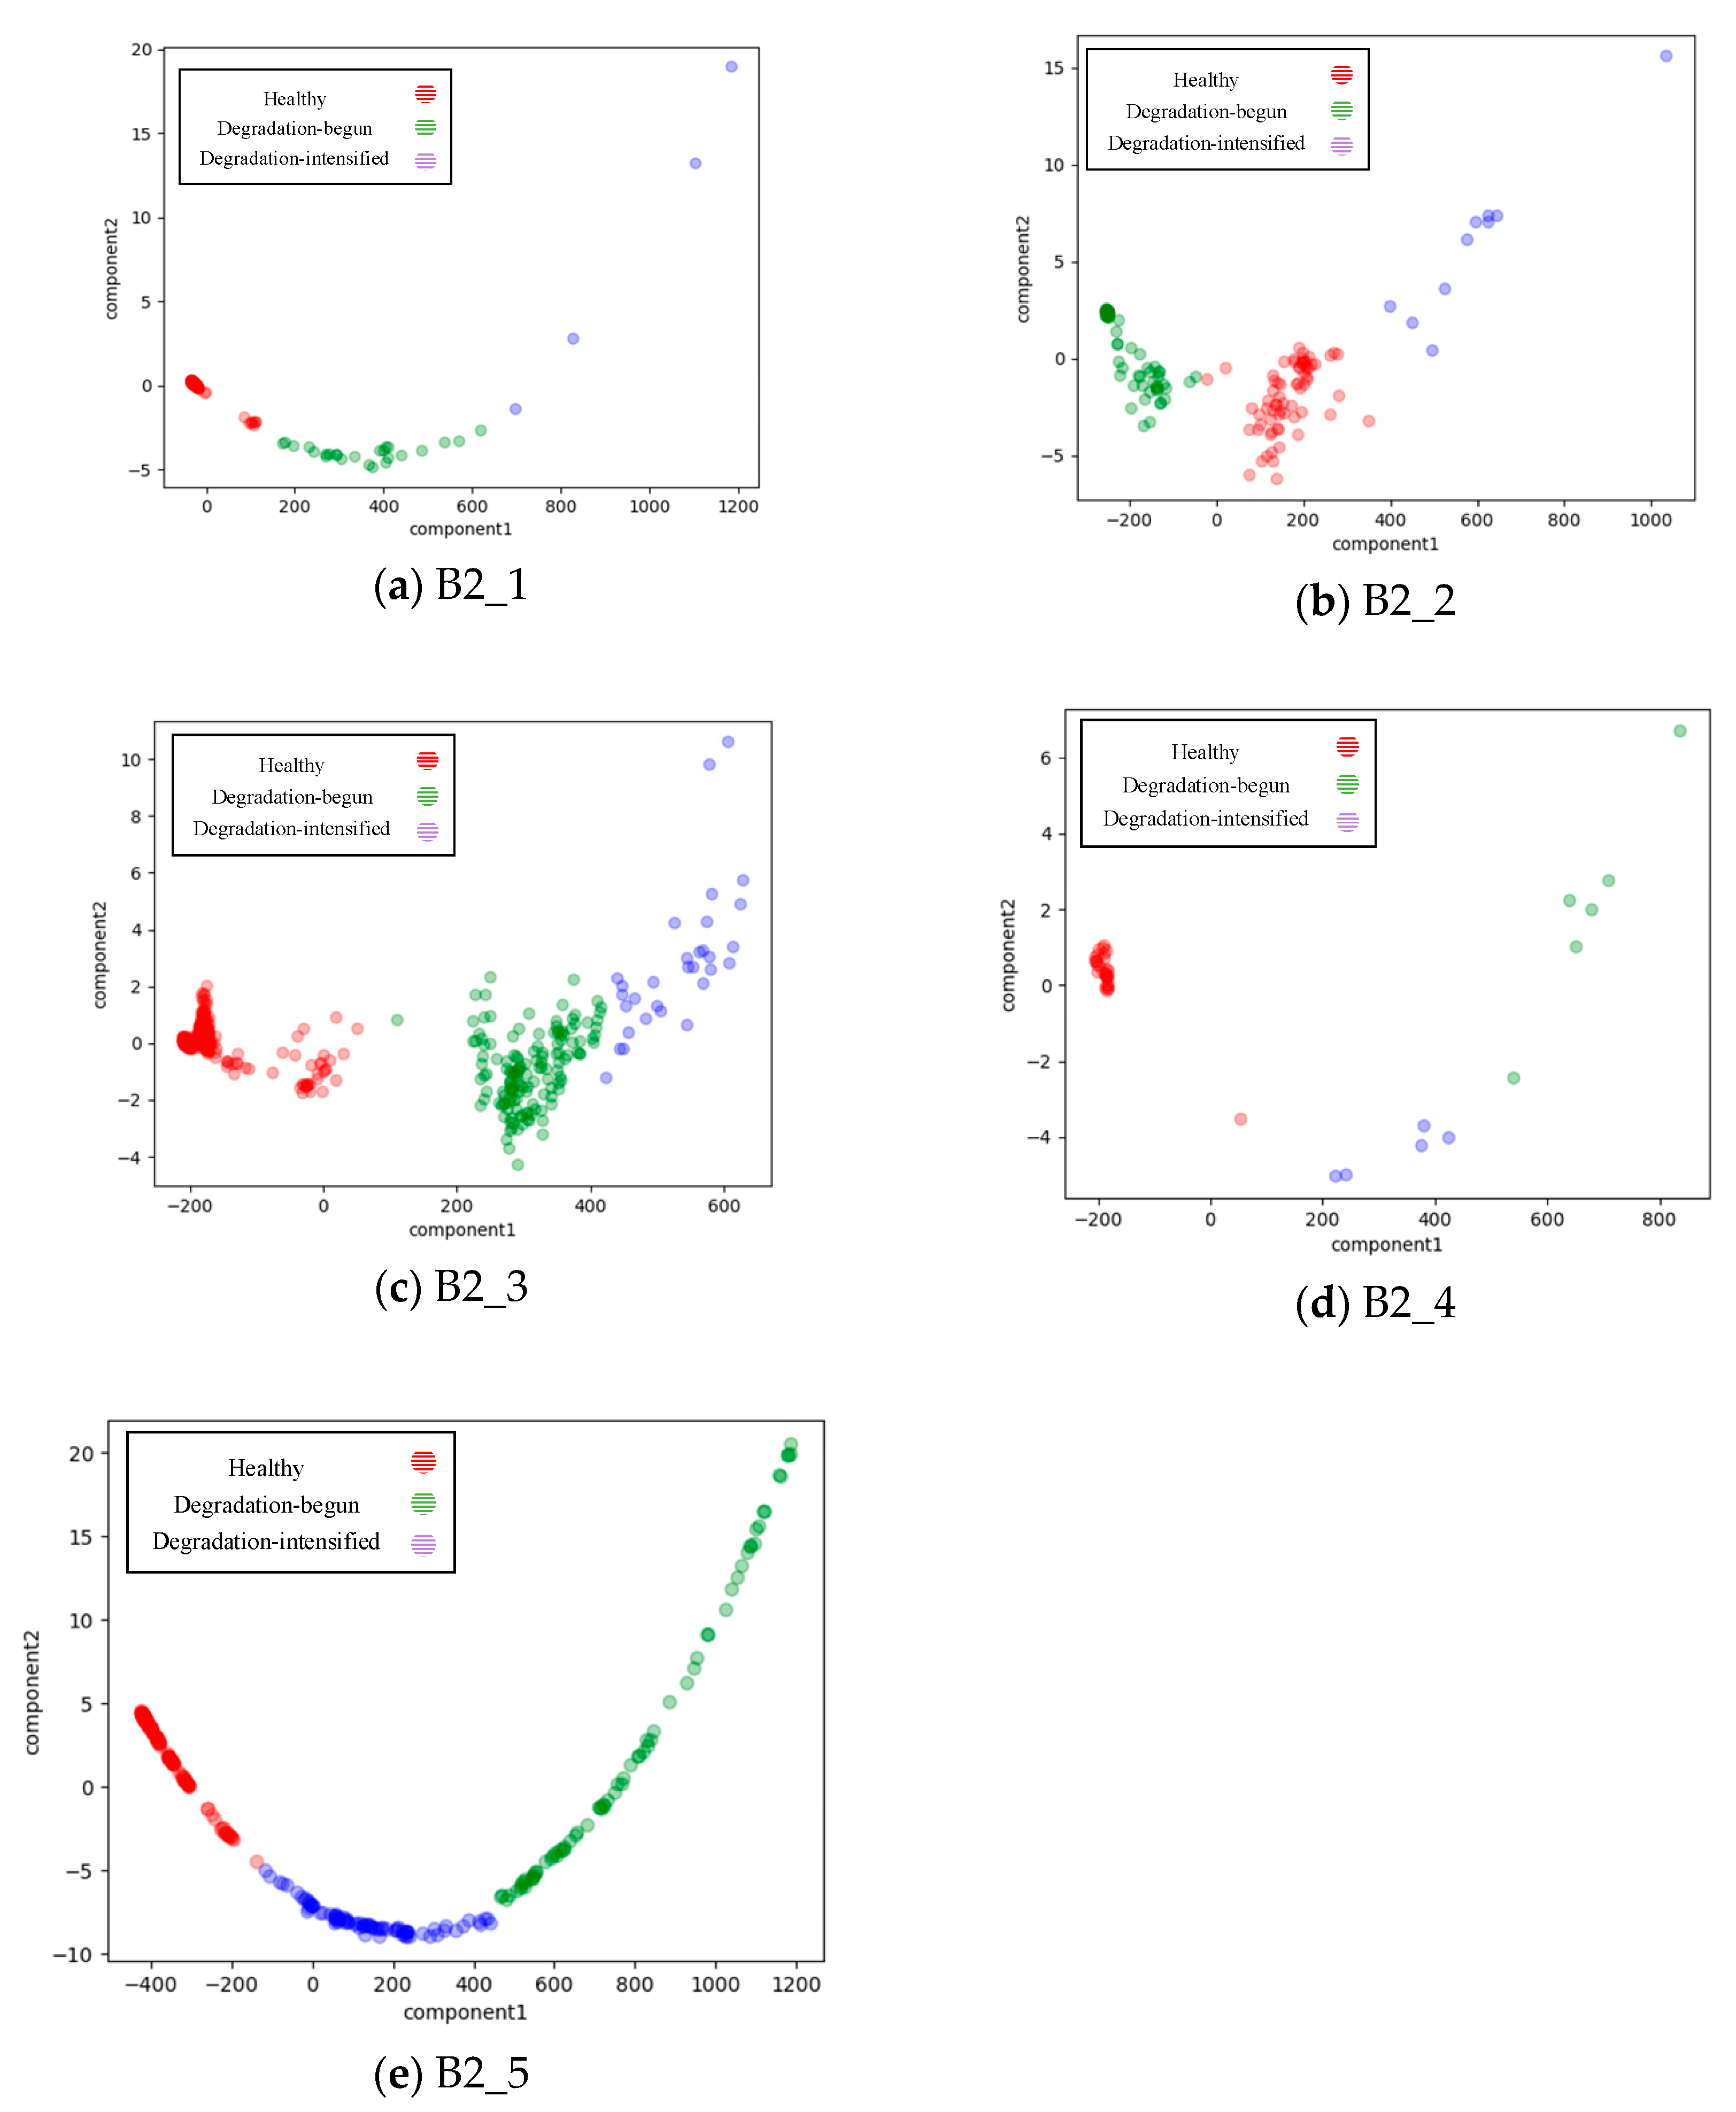
2.1. Performance Evolution State Data Classification Based on Data Clustering

The whole life cycle of rotating parts involves several performance stages: a healthy stage, degradation stage, fault stage, and failure stage [18,19]. As previously analyzed, the performance state data of Hi-Rel rotating machinery show few changes in the time domain during the transition from the “healthy state” to the “degradation-begun state”; the “degradation-begun state” lasts for a long time, whereas the “degradation-intensified state” has multiple stages of abrupt evolution (Figure 2). The “healthy state” refers to the state of trouble-free operation of the rotating component, the “degradation-begun state” refers to the operating state at the beginning of early failure, and the “degradation-intensified state” refers to the operating state after the failure progresses. The regions of time-domain representation data corresponding to the performance states of rotating machinery show fuzzy boundaries and overlaps (Figure 3). To improve the accuracy of attention assigned to corresponding data regions in the subsequent selective feature extraction module, it is imperative to precisely divide the data regions. A case study of bearings, which are typical parts in rotating machinery can be conducted as follows: based on data clustering and the fact that data samples in the same performance state share high similarity in the performance evolution process, the performance evolution state data region division method is specified [20].
The performance states of the machinery are divided into n progressive stages, including the healthy stage, degradation-begun stage, degradation-intensified stage, and fault stage. Each stage corresponds to a class of time-domain representation data. According to the experience of an expert panel, the clustering center of the performance representation dataset corresponding to the healthy stage is marked as C k , and the clustering center of other stages is C k + n 1 . Then, the set of several clustering centers of the initial performance representation datasets corresponding to the performance state stages is expressed as Equation (1):
C ( 0 ) = { C k ( 0 ) , C k + 1 ( 0 ) . C k + n 1 ( 0 ) }
Then, with t as the number of iterations and x i as a random sample point in the performance representation dataset, we obtain the Euclidean distance from the sample point ( x i ) to the clustering center after t clustering iterations, as shown in Equation (2):
d ( x i , C k + n 1 ( t ) ) = ( x i 1 C k + n 1 ( t ) ) 2 + ( x i 2 C k + n 1 ( t ) ) 2 + + ( x i N C k + n 1 ( t ) ) 2 , k = 1 , 2 , 3 ; n = 1 , 2 , 3 ; k < n .
The Euclidean distance from the sample point ( x i ) to the clustering center is calculated by Equation (2). As the data samples in the same performance state share high similarity, the sample points are classified into the data category of the clustering center to which the Euclidean distance is shortest to generate a cluster ( M ( t ) ).
Then, the clustering center is updated, and the mean value of all samples in each category is considered the clustering center. We assume that the sum of samples in the n -th cluster is Z n , and x n i is the i -th sample in this cluster; then, the clustering center point is calculated by Equation (3):
C n ( t + 1 ) = 1 Z n i = 1 Z n x n i
Then, the distance from each sample point in the performance representation dataset to the clustering center is recalculated to classify the samples into the closest clustering center, and the calculation terminates when the location of all clustering centers meets the following condition: | C n ( t + 1 ) C n ( t ) | σ c ( σ c is a constant). Finally, similar samples are classified by region, and the category of data classified by region accurately corresponds to a performance state, which strengthens the correspondence relationship between the performance representation data and the performance state, making it easier to assign weights to the input data in the subsequent RUL prediction module and improve the accuracy of attention to data regions in feature extraction.

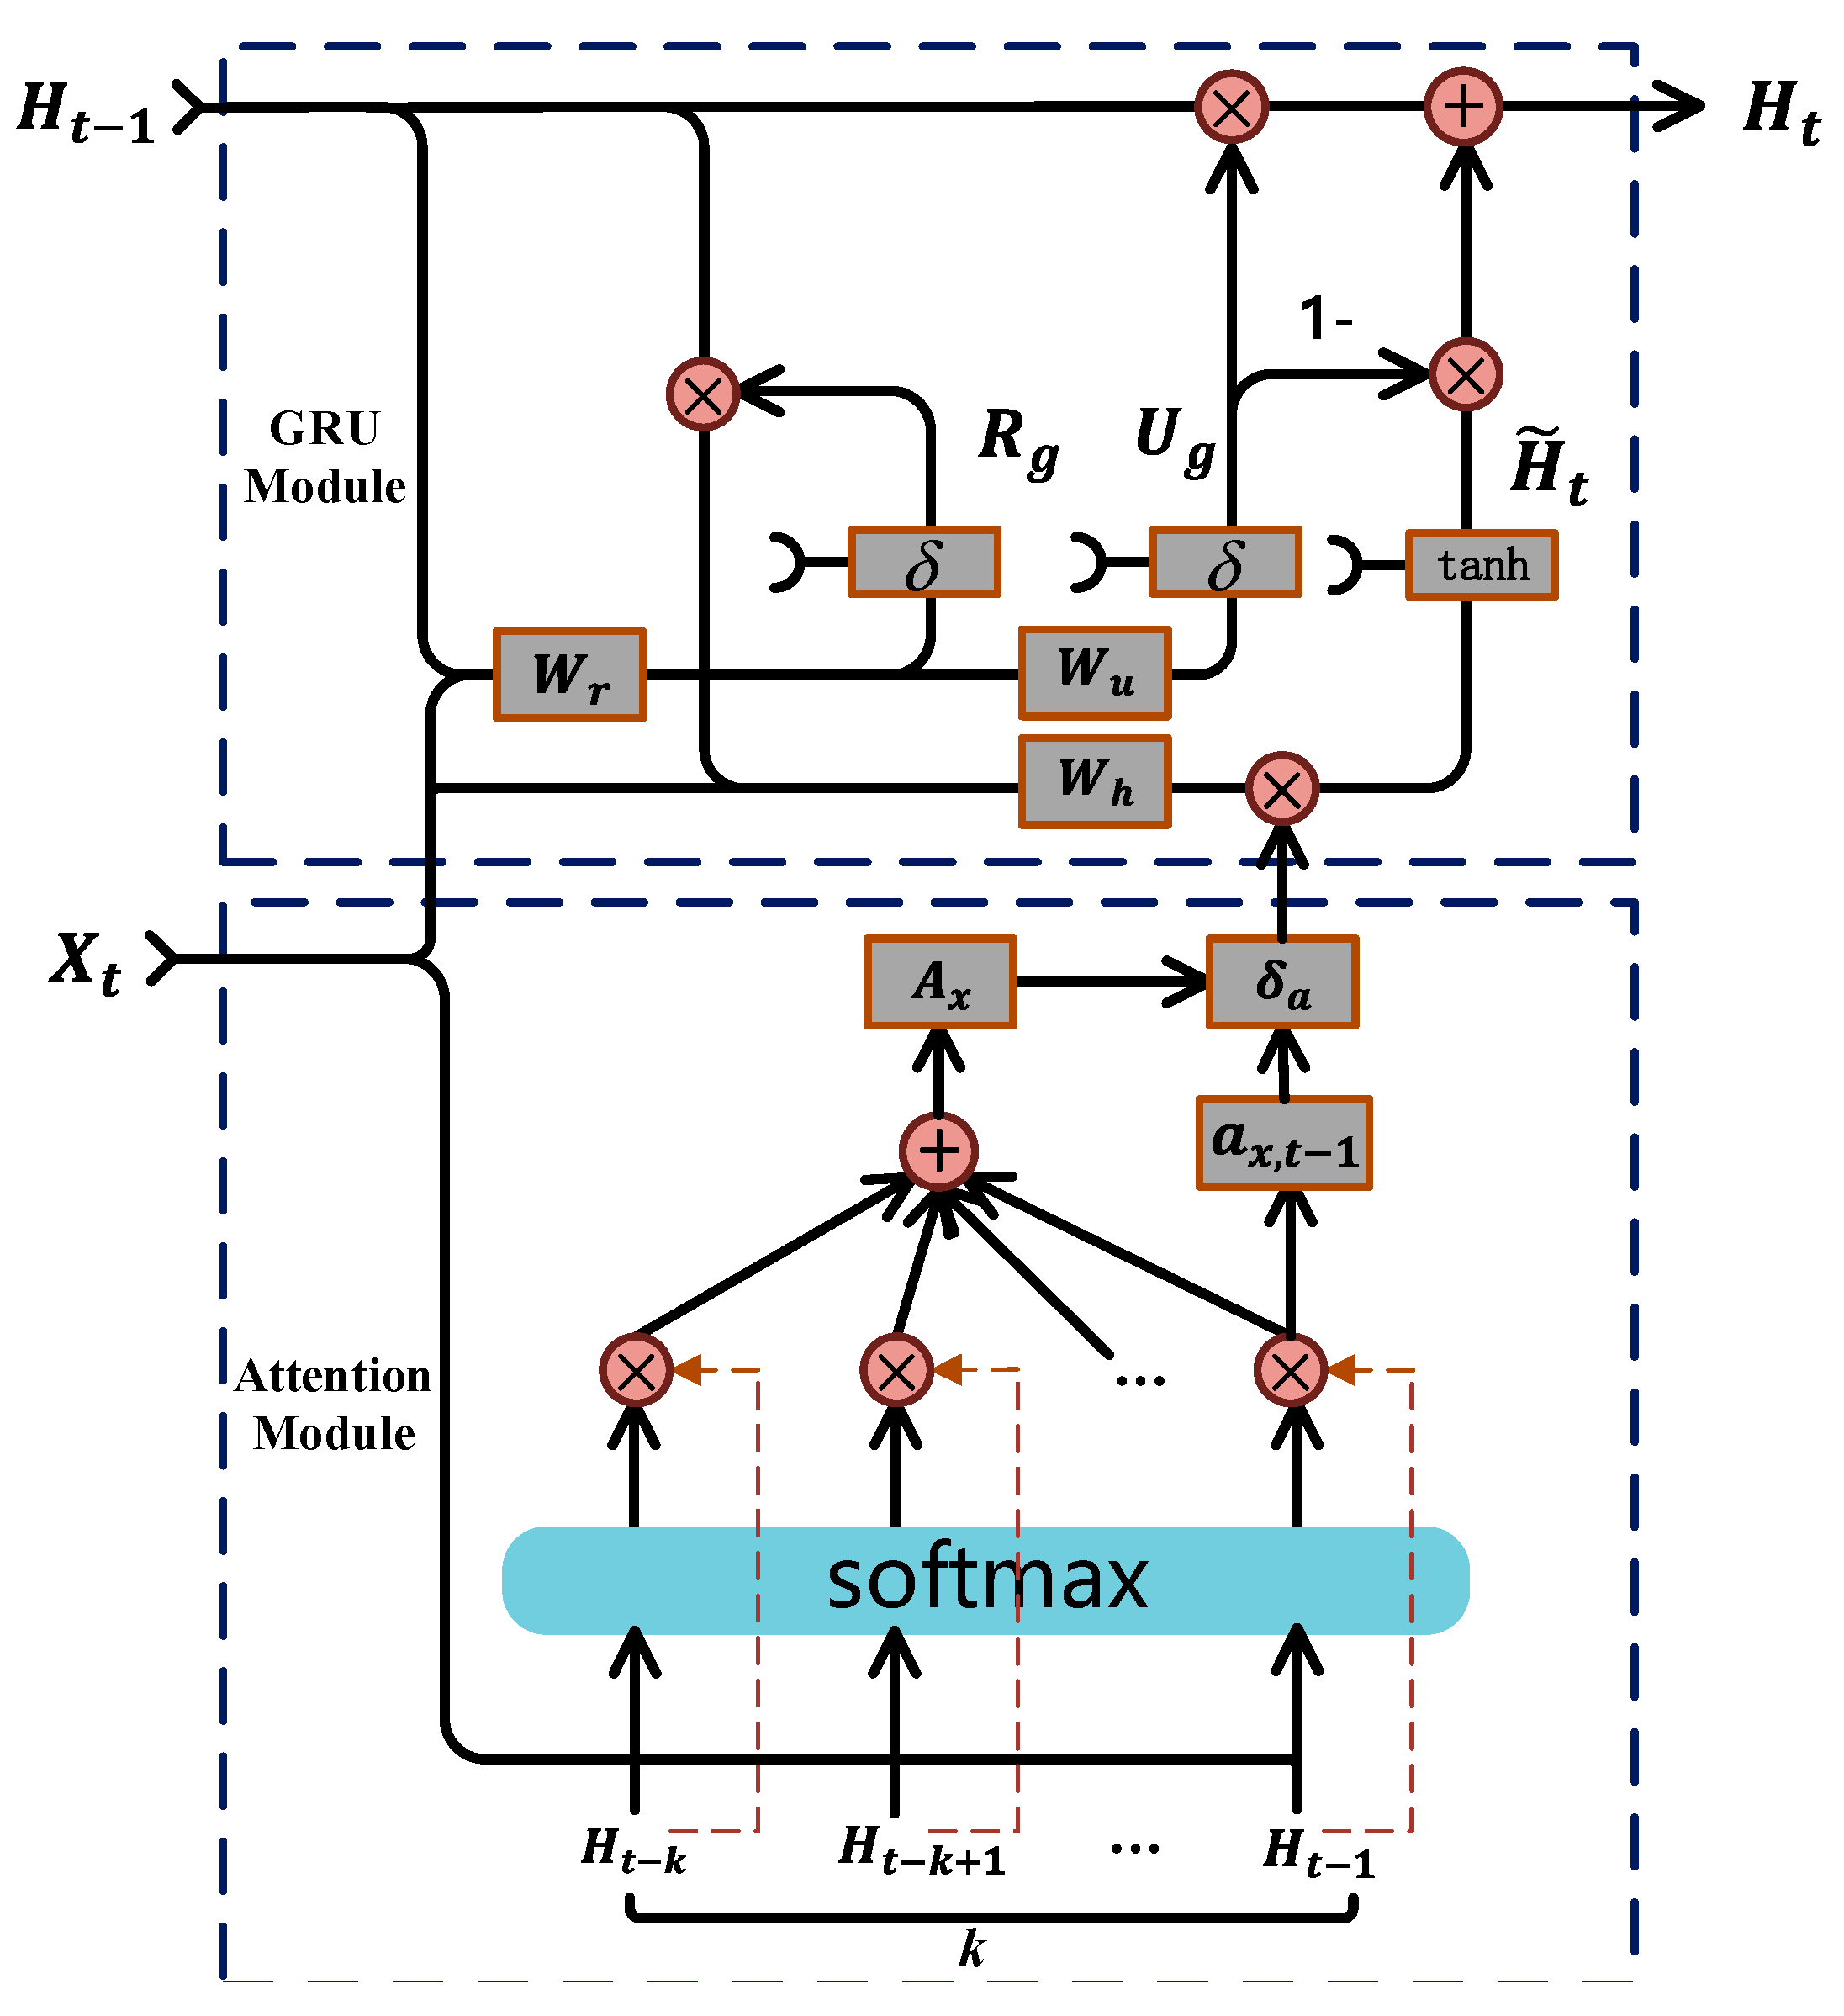
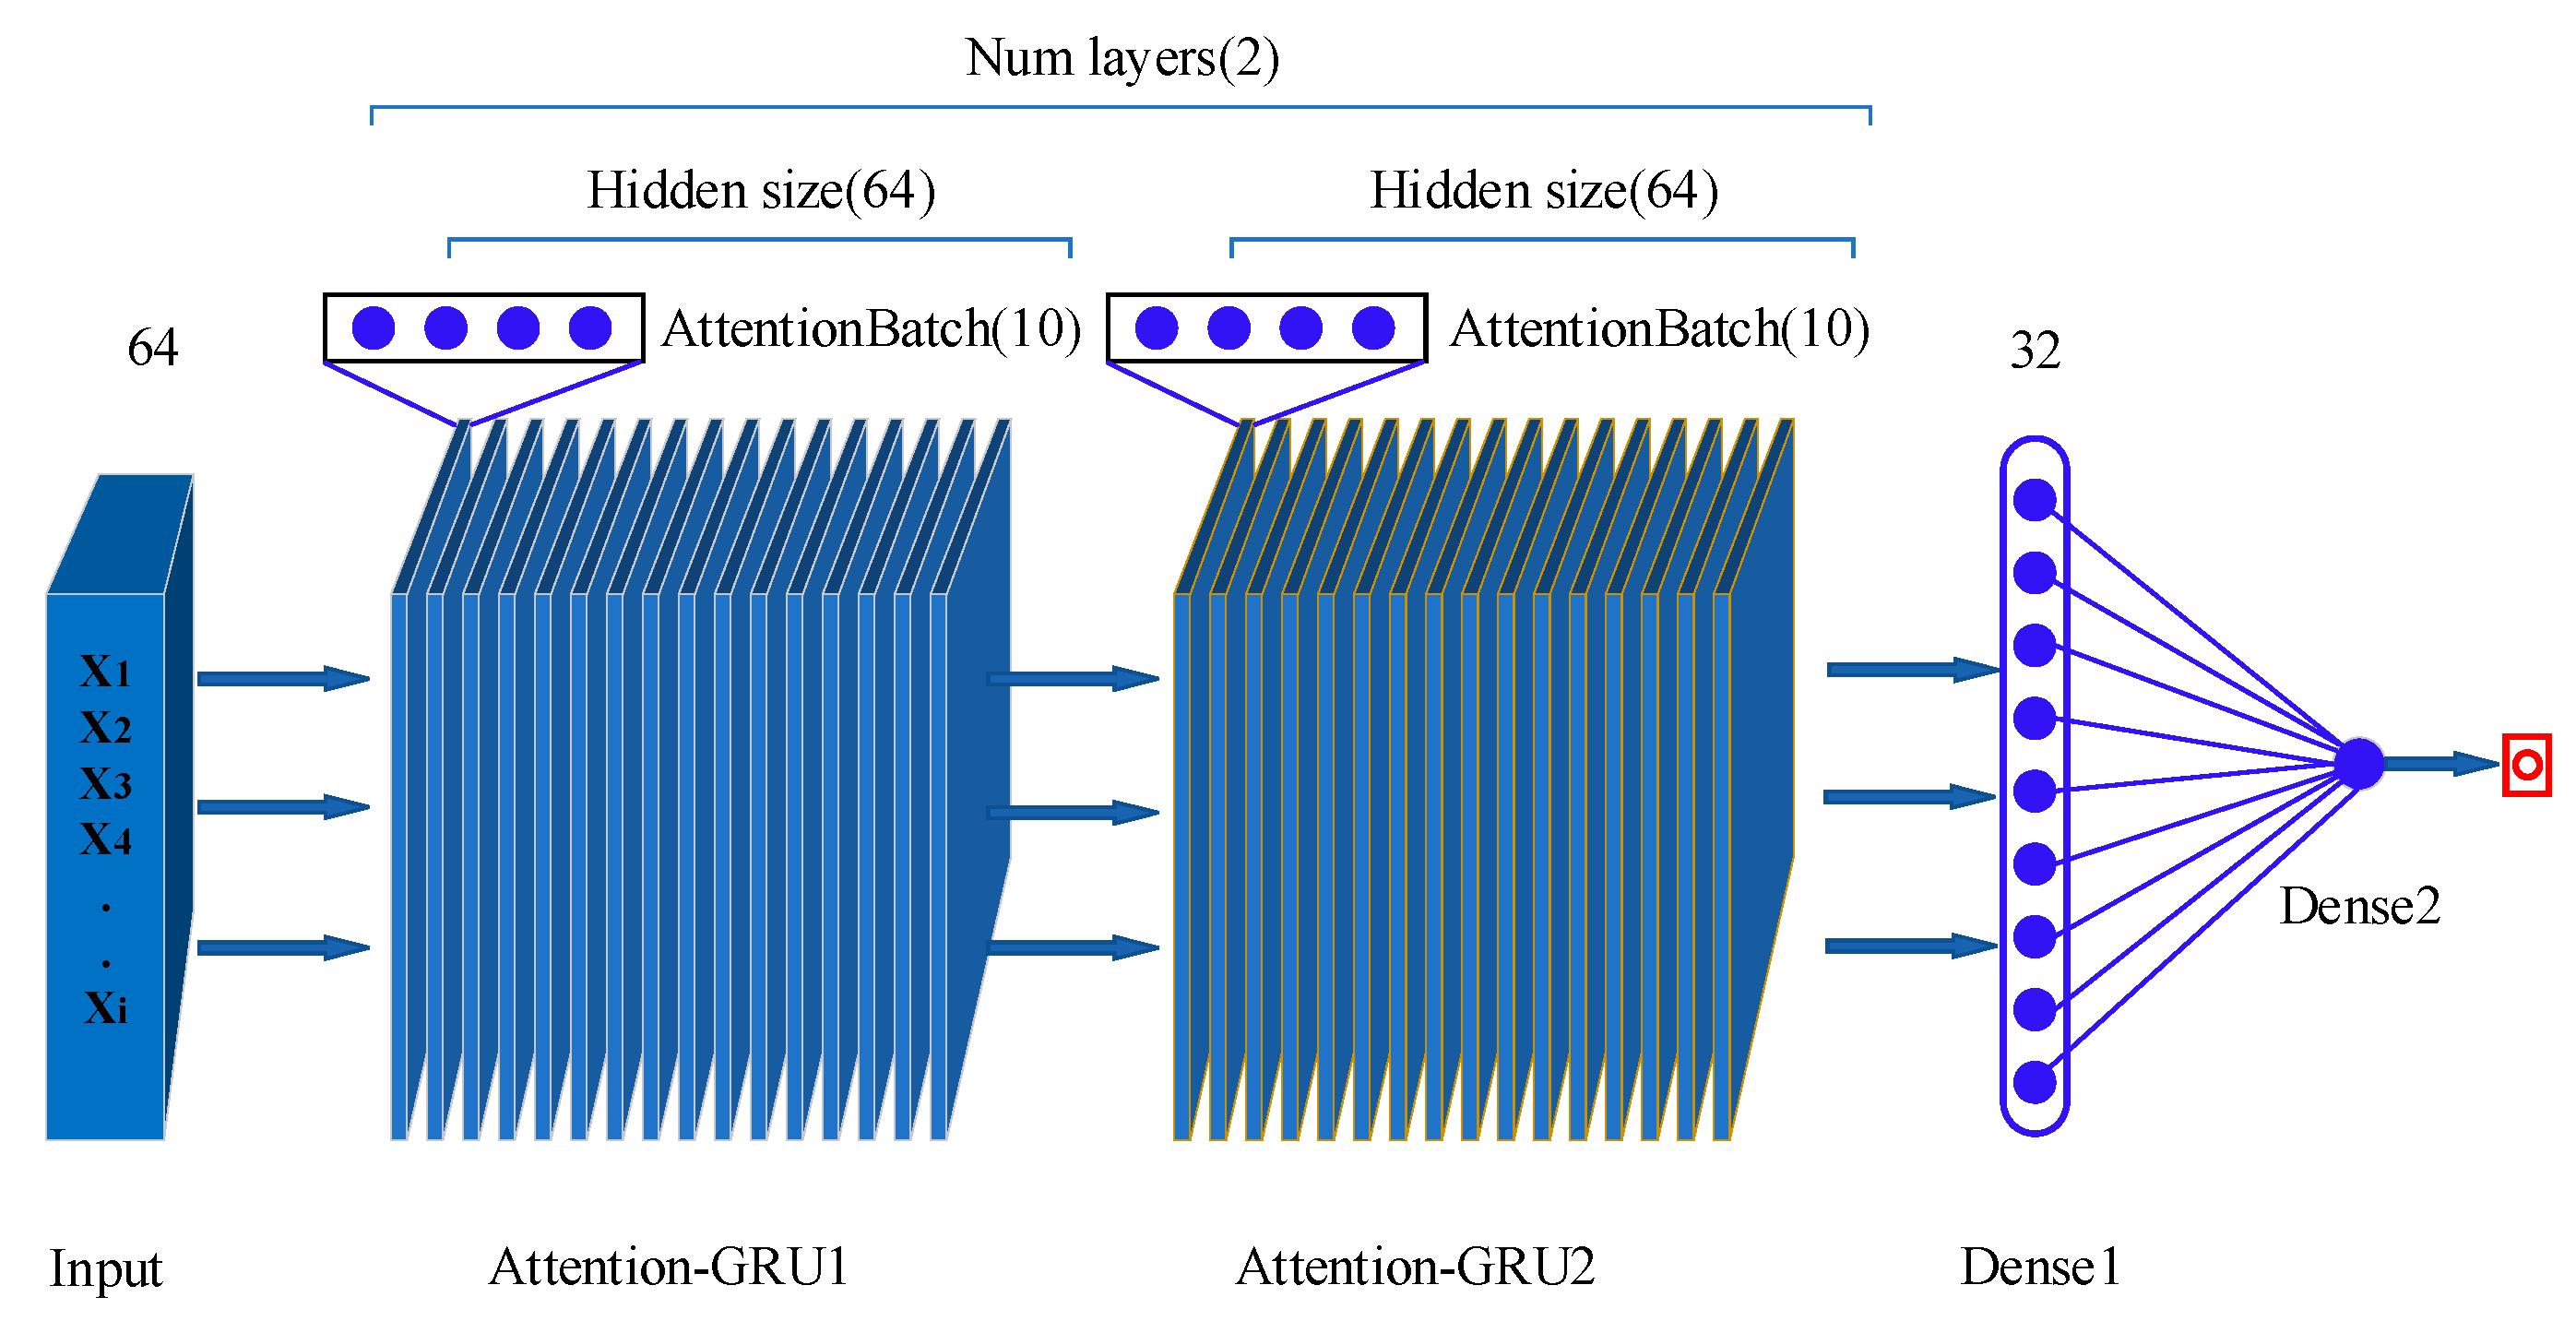
2.2. Attention-Based GRU for RUL Prediction

A gated recurrent unit (GRU) is a variant of an RNN. Conventional RNNs suffer from the problems of exponential explosion of weights and vanishing gradients and cannot capture long-term relations in the time sequence. However, GRU provides a solution to these problems by introducing gates. Moreover, compared with LSTM, GRU has fewer parameters and is therefore easier to train [21]. One weakness of GRU is that it cannot calculate similarity weights between input vectors and network hidden states. If the attention mechanism is introduced to GRU, the model is can discriminate features, assign different weights to them, and extract additional important information. In this way, the model can produce more accurate results without increasing the computing overhead or memory load of the model.

2.2.1. Working Principle of the Attention Mechanism in RNN

When introduced to an RNN, the attention mechanism calculates the similarity weight between the input vectors and network hidden states. Figure 4 shows how the attention mechanism works in an RNN; the state is assumed to be comprised of a series of two tuples ( K e y , V a l u e ) .
When the current input sequence is Q u e r y , the i -th state is expressed as H i = ( K e y i , V a l u e i ) . There are L hidden states calculated by the RNN; by calculating the similarity or relevance between the input, Q u e r y , and hidden state, K e y , we can obtain the weight coefficient of Q u e r y corresponding to K e y , namely the relevance weight of the hidden state to Q u e r y . Then, the weighted sum between the relevance weight and V a l u e is calculated to obtain the similarity value between Q u e r y and the L hidden states. Operations of the similarity value and Q u e r y are performed to adjust the model outputs. The dot product is used as the similarity calculation function, and the expected attention value in the attention mechanism is obtained by Equation (4), where S i m i l a r i t y ( · ) is the similarity calculation function:
A t t e n t i o n ( Q u e r y ) = i = 1 L   S i m i l a r i t y (   Q u e r y   , K e y i ) * V a l u e i

2.2.2. Attention-GRU Model for RUL Prediction

The RUL prediction attention-GRU model consists of two modules: a GRU module and an attention module. The GRU module learns and analyzes the sequence trends and intrinsic relationships of data; it can independently determine whether to retain or discard a feature and is mainly used for predictive calculations. The attention module is used for similarity weights (Figure 5). The attention mechanism gives a larger weight to the part of attention than to the less relevant parts to obtain more effective information. Therefore, adding an attention layer to the GRU model can increase the contribution of important features to the prediction.
(1) As shown in Figure 5, in contrast to traditional RNNs, the GRU module has only a reset gate ( R g ) and an update gate ( U g ); X t is the current input feature; the final output state of the module is the weighted sum of the previous state ( H t 1 ) and the candidate state ( H t ˜ ). The reset gate R g processes the previous state ( H t 1 ); it receives the current input feature and the previous state and performs a linear calculation. Then, the sigmoid function is employed for normalization. The value range of the reset gate is between 0 and 1; a larger value indicates a higher proportion of the previous state in the candidate state. The value of the reset gate determines the importance degree of the previous state and the current input feature in the candidate state ( H t ˜ ).
Let σ be the sigmoid function; tan h be the hyperbolic tangent function; W r , W u , and W h be the network weights, where W r is the network weight of the reset gate, W u is the weight of the update gate, and W h is the network weight of candidate output ( H t ˜ ); W x r and W h r be the weight parameters of W r ; W x u and W h u be the weight parameters of W u ; and W x h and W h h be the weight parameters of W h h , as shown in Equation (5):
W r = W x r + W h r W u = W x u + W h u W h = W x h + W h h
Let b r and b h be the bias; then, the reset gate and the candidate state can be calculated by Equations (6) and (7), respectively:
R g = σ ( X t W x r + H t 1 W h r + b r )
H t ˜ = tan h ( X t W x h + ( R g T H t 1 ) W h h + b h )
The update gate ( U g ) assigns weights to the input features and the previous state to update the output state ( H t ). The calculation of the update gate resembles that of the reset gate. The update gate also determines the candidate output ( H t ˜ ) and the impact of the previous output on the final output ( H t ). The calculation of the update gate and the final estimation state ( H t ) is shown in Equations (8) and (9), respectively:
U g = σ ( X t W x u + H t 1 W h u + b h )
H t = U g T H t 1 + ( 1 U g ) T H t ˜
(2) In the attention module, the current input feature ( X t ) is considered the inquiry vector ( Q u e r y ), the k groups of previous states ( H = { H t k , H t k + 1 , , H t 1 } ) are considered the value vector ( V a l u e ), and V a l u e per se is considered the key vector ( K e y ) for the similarity calculation. The attention calculation involves three parts: first, the dot product of Q u e r y   ( X t ) and K e y   ( H ) is calculated to obtain the weight coefficient; then, Softmax is employed to normalize the weight coefficients; finally, the adjusted weight coefficients are used to perform weighted summation of V a l u e ( H ) .
The specific calculations are as follows: a x , i represents the normalized weight coefficient, and A x represents the weighted sum ( A x is an important indicator of the relevance between the input feature ( X t ) and the k groups of previous states). A larger A x indicates a higher similarity between X t and the k sets of previous states, whereas a smaller A x indicates the opposite. S a i is the similarity weight between the i -th hidden state ( H i ) and the input ( X t ). S a i , a x , i , and A x can be calculated by Equations (10)–(12), respectively:
S a i = X t T · H i , i = [ t k , t k + 1 , , t 1 ]
a x , i = s o f t m a x ( S a i )
A x = i = t k t 1 a x , i H i
To improve the stability of prediction and reduce the impact of abnormal previous data, the calculation method for the candidate state ( H t ˜ ) in the GRU is improved. The correlation coefficient between the current input feature ( X t ) and the next state ( H t 1 ) is marked as a x , t 1 , and the attention factor ( δ a ) is introduced to Equation (7) to obtain the improved calculation equation for the candidate state ( H t ˜ ), as shown in Equation (13):
H t ˜ = tan h ( X t W x h + δ a ( R g T H t 1 ) W h h + b h )
Where the attention factor ( δ a ) can be calculated by Equation (14):
δ a = { 1 , a x , t 1 A x 1 a x , t 1 A x , 0 a x , t 1 A x < 1
As Equation (14) shows, when a x , t 1 A x , the current input feature shares high similarity with the previous state, and the change trend is normal and requires no adjustment; when a x , t 1 < A x , the current input has more similarity to the state of a prior period of time than to the previous state, which means that the previous state may be an anomaly, and it is necessary to reduce its weight in the calculation of candidate states.

3. Model Verification and Comparison

The bearings are an important part of the rotating unit in equipment. Damage to the bearings often triggers performance degradation and faults of the whole system, so we can capture the overall working condition of the equipment by analyzing the performance of the bearings. The widespread adoption of bearings in industrial production provides rich data in this regard. In the present work, experiments are performed on bearings in equipment with multiple rotating parts for the manufacture of precision electronic devices.

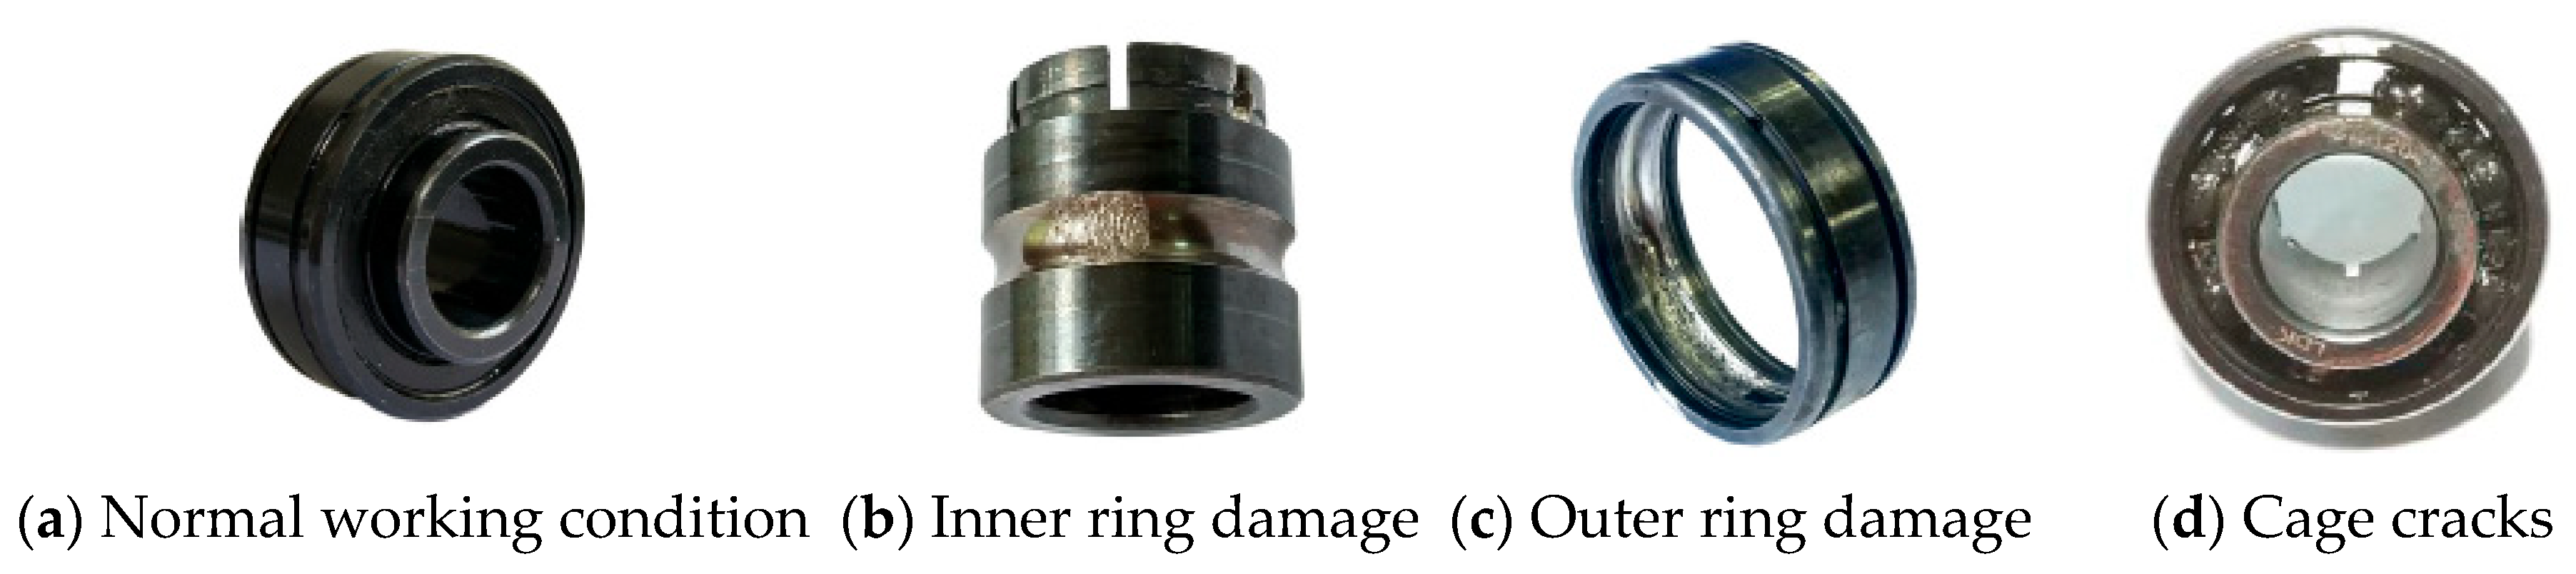
3.1. Experiment Preparation

The most widely used datasets include the CWRU dataset, the Paderborn dataset, the IMS dataset [22] the FEMTO-ST dataset [23], and the XJTU-SY dataset [24]. Table 1 shows the specifics of these datasets.
Because the XJTU-SY dataset not only contains the characteristic information of life prediction but also 4 types of fault life data, it contains a total of 15 sets of test data. The RUL prediction method for rotating parts proposed in our work involves three modules: feature extraction, performance state classification, and RUL prediction. Given the requirements for model construction and the specifics of the datasets, the XJTU-SY dataset is more suitable for training and validating models than other datasets.
The bearings used in our experiments are LDK UER204 rolling bearings with an internal radius of 29.30 mm, an external radius of 39.80 mm, and 8 balls with a diameter of 7.92 mm. The vibration signals of the bearings are sampled by a vertical PCB352C33 acceleration transducer and a DT9837 dynamic signal sampler; sampling is performed at a frequency of 25.6 kHz with a sampling interval of 1 min, and each round of sampling lasts 1.28 s. For the sake of safety, the relative thresholding method is employed to identify the failure threshold of the bearing. Specifically, when the vibration amplitude exceeds 10 × A h , the bearing is considered to fail, and the experiment is terminated immediately ( A h is the maximum amplitude of the bearing under normal working conditions). The dataset comprises four types of data—normal working conditions, inner ring damage, outer ring damage, and bearing cage cracks (Figure 6)—and there are 15 sets of testing data, the requirements of our proposed model for calculation better than other datasets.

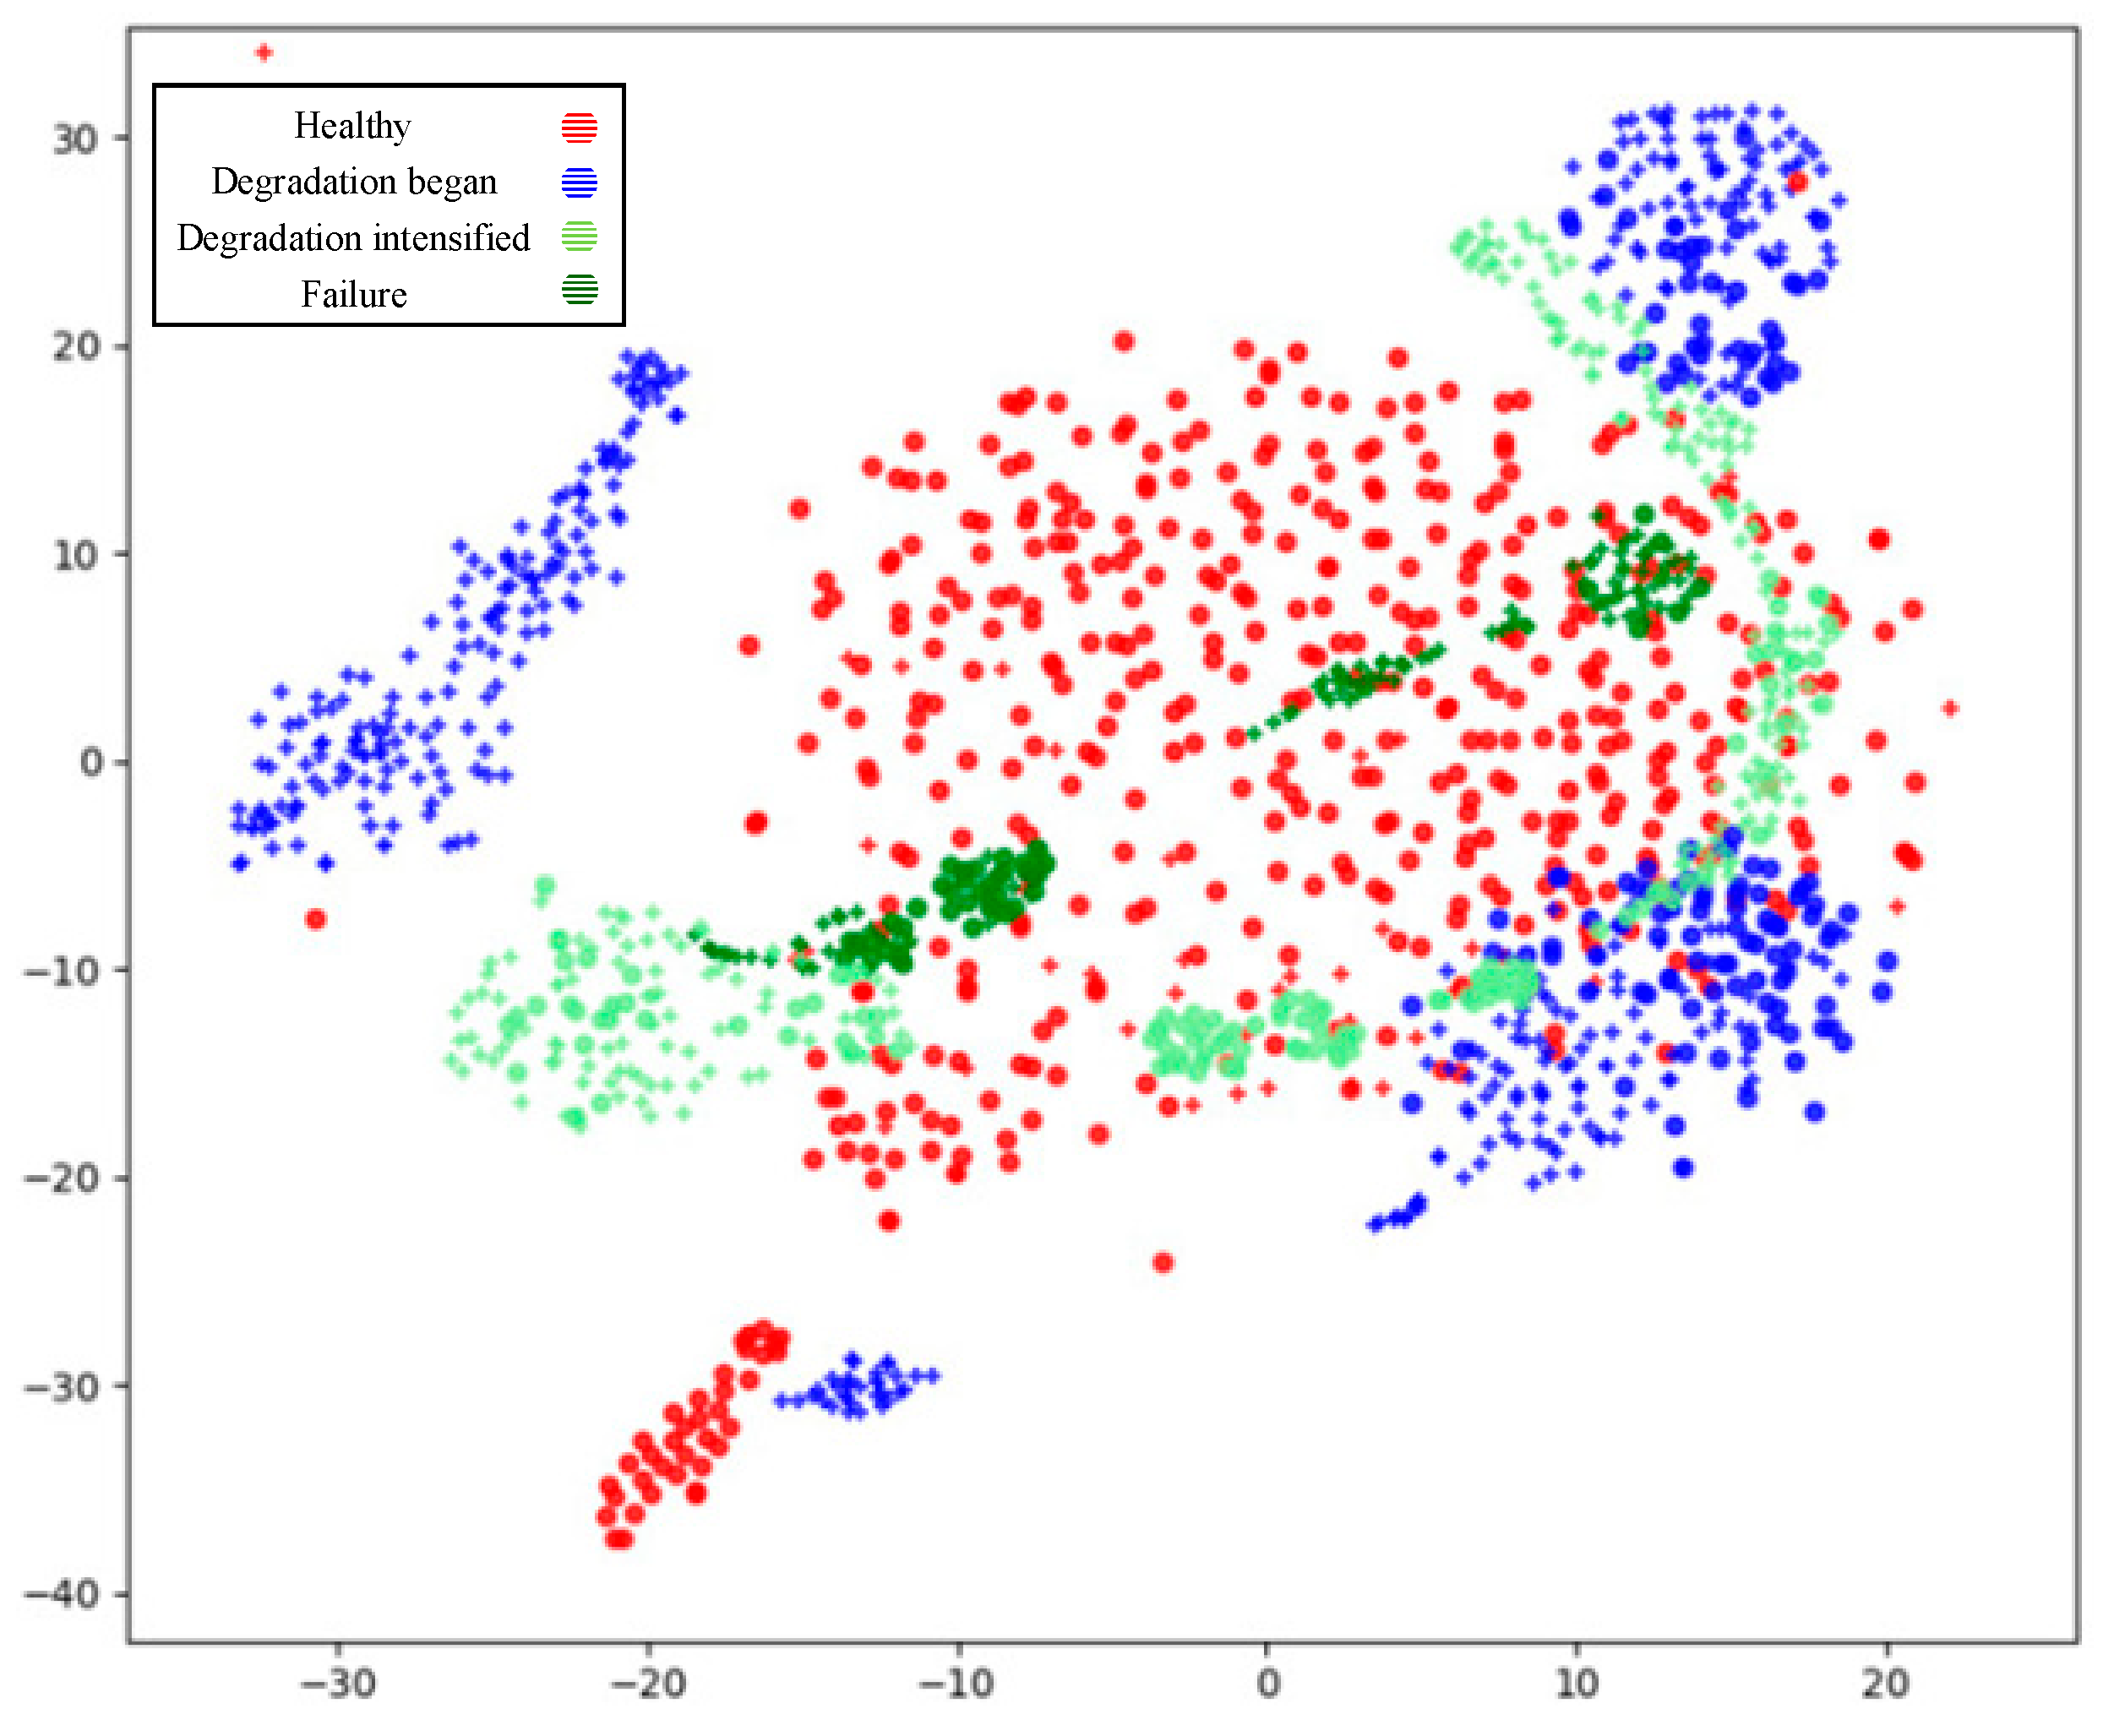
3.2. Experiment for Performance Evolution State Data Region Division

3.2.1. Dataset Configuration

The XJTU-SY dataset consists of three machinery working conditions, as shown in Table 2. To ensure consistency, data for the same working condition are used for research. Working condition 2 consists of five groups of whole-life-cycle data of bearings, including three types of independent faults: inner ring damage, outer ring damage, and bearing cage damage (Table 3). Data on independent faults facilitate comparison of physical features of machinery, so data on the bearings under working condition 2 are used for model verification. Figure 7 shows the time-domain curve of the bearing performance under working condition 2. Figure 7 shows how the performance state of the bearings gradually evolves from the healthy stage to the degradation-begun stage, then to degradation-intensified stage and, finally, the failure stage.

3.2.2. Experimental Result

In the clustered performance state classification process, the data are cut into multiple segments by a fixed-size window function; then, Fourier transform is performed separately so that each input sample has a dimension of 64. There are four types of data in the XJTU-SY dataset under working condition 2: healthy state, outer ring damage, inner ring damage, and cage cracks. As the degradation-begun stage and the degradation-intensified stage occur when the bearing evolves from the healthy state to a fault state, the number of clustering categories is set to 3, and the maximum number of iterations is set to 300 for the experiment. Figure 8 shows the clustering result of useful life data of five bearings under working condition 2. As the figure shows, the clustering method proposed herein achieves the classification of similar samples in the datasets from B2_1 to B2_5.
To identify the correspondence relation between the cluster and the bearing performance states (healthy state, degradation-begun state, and degradation-intensified state), we find from Figure 7 that the healthy state lasts the longest in the whole life cycle of the bearing; therefore, the sample data at this stage take up the largest proportion among all samples, so the largest cluster amid the three clusters in Figure 8 is labeled as the “healthy state”. Moreover, changes in the bearing performance state are progressive, and the damage worsens step by step. Therefore, when calculating the distance between the “healthy state” cluster and the other two clusters, the cluster closest to the “healthy state” cluster is labeled as the “degradation-begun state”, whereas the cluster that is farthest is labeled as the “degradation-intensified state”. All categories of data in Figure 8 post data region classification correspond accurately to the performance state stages of the bearings so that the attention-GRU model can assign different weights to the input data and the accuracy of attention to the data region in feature extraction can be increased.

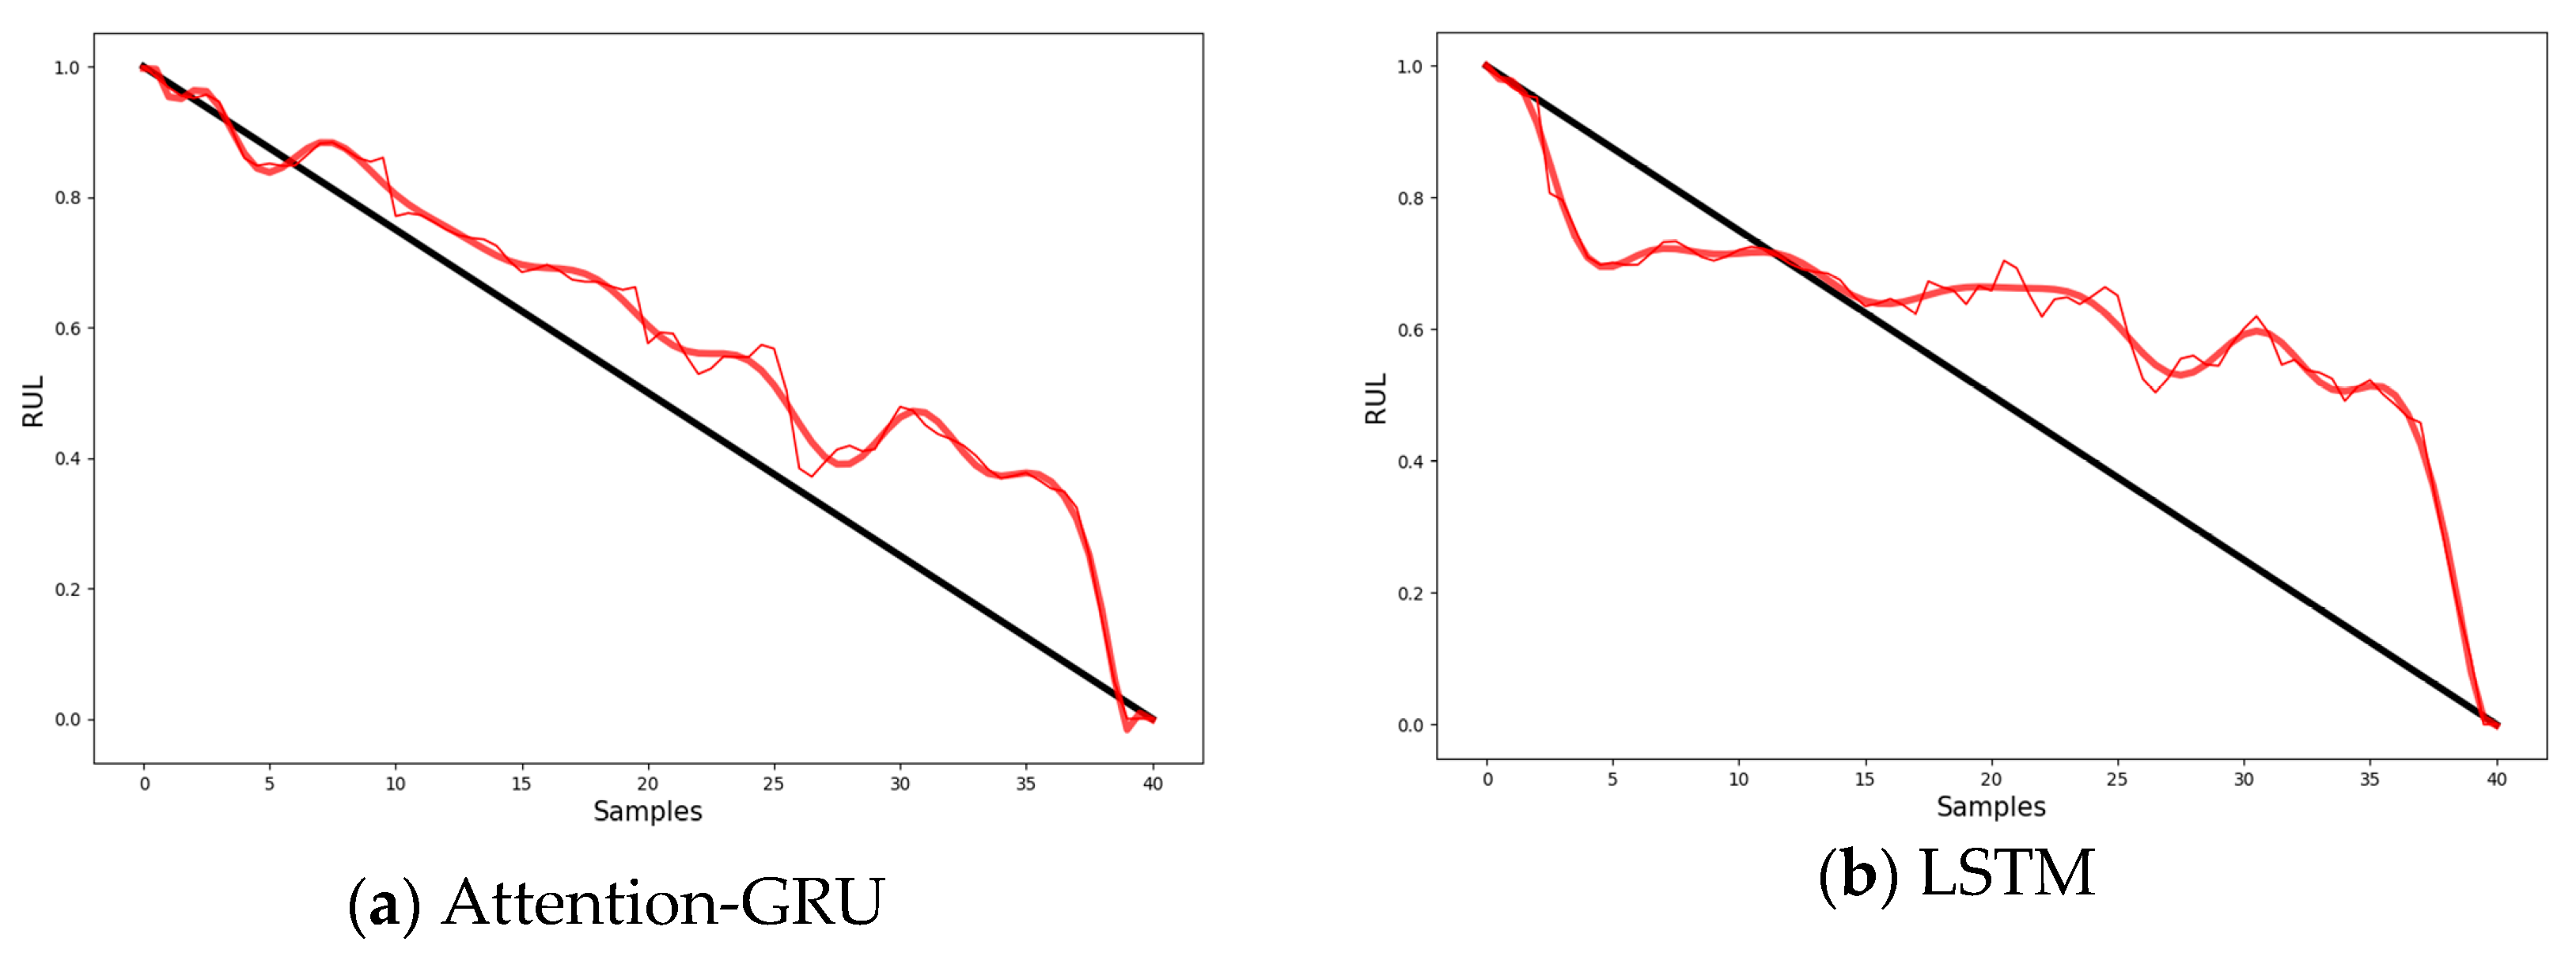
3.3. Prediction Experiments Using the Attention-GRU Model

3.3.1. Model Parameter Configuration

The original RUL estimation method of the XJTU-SY dataset calculates the time from the point when the bearing starts rotating to when the vibration amplitude reaches the level of failure. To verify our proposed model, we redefine the useful life range of the bearing. As RUL prediction is not performed on “healthy-state” samples, the weight assigned to these samples is 0 in feature extraction, and the point of the “degradation-begun state” is taken as the starting point of RUL prediction. The RUL, marked as R , is represented by a percentage, and the RUL of the i -th sample in the j -th dataset R ( x j i ) can be calculated by Equation (15):
R ( x j i ) = { N o n e , i < T s t i S j T s t S j × 100 % , T s t i S j
Figure 9 shows the structure of the attention-GRU model for bearing RUL prediction experiments. The model consists of two attention-GRU layers and two dense layers (Dense1 and Dense2), and each attention-GRU layer consists of 64 nodes; the first dense layer has 32 nodes, and the second dense layer has 1 node. The network model receives input vectors with a length of 64 and outputs one prediction result. The optimizer used for training is the Adam optimizer; 32 groups of samples are set as one training batch, and each training involves 30 epochs, as shown in Table 4.

3.3.2. Analysis of Experimental Results

For comparison, the attention-GRU model proposed here and a GRU model without the attention mechanism are trained separately. To this end, 80% of the XJTU-SY dataset under working condition 2 is used for model training, and the remaining 20% is used for testing; the mean squared error (MSE) is used as the loss function, the learning rate is set to 0.001, and the number of training epochs is set to 30. Figure 10 shows the RUL prediction results achieved by the two models in comparison with the actual RUL.
The blue curve in Figure 10 indicates the prediction result achieved by our attention-GRU model, and the red curve shows the result from the attention-free GRU model. As the figure shows, the GRU model with an attention module achieves better prediction performance than the attention-free model, with its curve better-fitted to the actual RUL curve and showing a smaller prediction error. Using RMSE as the evaluation index, the prediction error of the two models on the dataset was calculated separately (Table 5).
Comparative experiments are also performed between the LSTM model proposed in [25] and our model; Table 6 compares their prediction error, and Figure 11 shows a comparison of the two models on the B2_1 dataset.
According to Figure 10 and Figure 11 and Table 5 and Table 6, the attention-GRU model achieves a smaller prediction error and more stable prediction performance than other models compared in this study.
As revealed in the experiments, in the training process of the attention-free GRU model, the weight assigned to healthy sample data, which present little fluctuation and little relevance to RUL, is not diminished, demonstrating the model’s convergence and reducing the model’s prediction accuracy. On the contrary, the model with an attention module (our model) adjusts the weight assigned to data as per the performance state corresponding to the data, which improves prediction accuracy and reduces errors (as shown in Figure 10 and Table 5). Meanwhile, the LSTM and the attention-free GRU models show larger fluctuations in the curves than our model because the gating mechanism works only on the current input and one previous state, and if the previous state or the current input is an anomaly, the subsequent predicted state will follow this anomalous trend, and the stability of prediction is poor.

4. Conclusions

In remaining useful life prediction of rotating machinery, prediction performance and reliability are often undermined by imbalanced data of machinery performance states and differences in probability distribution. To address these problems, an attention-based rotating machinery RUL prediction method is proposed herein.
First, an unsupervised data clustering method for classification of rotating machinery performance state evolution stages is put forth. According to the rotating machinery performance states, the performance evolution is classified into three stages: a “healthy stage”, “degradation start stage”, and “intensified degradation stage”. To solve the problem of fuzzy boundaries and overlaps of representation data regions, the distance between the data clusters and the “healthy state” cluster is calculated to establish a correspondence relation between the data cluster and the bearing performance state in order to classify similar samples in the bearing life dataset. Experiments show that each classified category of data accurately corresponds to the bearing performance state and can provide a basis for similarity weight calculation of the input data to the attention-GRU model.
An expected attention calculation method for input data based on the similarity function is proposed, and an attention module for input data extraction is established, which is fused with a gated recurrent unit (GRU) to build an attention-GRU model for RUL prediction of rotating machinery. Comparisons with other baseline models show that the attention-GRU model achieves higher prediction accuracy and stability than other models. Our attention-GRU model strengthens attention to the local target features, solves the problem of imbalanced data that may negatively affect the prediction performance, and provides a solution to rotating machinery RUL prediction despite insufficient sample data.
The RUL prediction models for rotating machinery discussed in this paper are mainly constructed based on large sets of sample data. However, in real-world scenarios, RUL prediction of equipment, especially under complex and unfavorable working conditions, is principally a modeling problem, with few available samples. Therefore, future work will focus on the RUL prediction of rotating machinery with limited availability of sample data. Given the complexity of such problems, the attention-GRU RUL prediction model proposed in this paper will face challenges in terms of accuracy and efficiency. For this reason, models focusing on feature mining, such as a dual-channel attention mechanism, will be the research focus for feature extraction in RUL prediction when sample data are insufficient.

Author Contributions

Conceptualization, Y.D. and C.G.; methodology, C.G.; software, Z.Z.; validation, L.Z., Z.Z. and S.L.; formal analysis, C.G.; investigation, S.L.; resources, Y.D.; data curation, X.L.; writing—original draft preparation, C.G.; writing—review and editing, Y.D. and C.G.; visualization, L.Z.; supervision, Y.D. and X.L.; project administration, Y.D.; funding acquisition, Y.D. All authors have read and agreed to the published version of the manuscript.

Funding

This research was funded by the National Natural Science Foundation of China (Grant No. 52175457), Guangdong Basic and Applied Basic Research Foundation (Grant No. 2022B1515120053) and the Key-Area Research and Development Program of Guangdong Province (Grant No. 2019B010154001).

Institutional Review Board Statement

Not applicable.

Informed Consent Statement

Not applicable.

Data Availability Statement

The data used to support the findings of this study are included within the article.

Conflicts of Interest

The authors declare no conflict of interest. The funders had no role in the design of the study; in the collection, analyses, or interpretation of data; in the writing of the manuscript; or in the decision to publish the results.

References

  1. Biebl, F.; Glawar, R.; Jalali, A.; Ansari, F.; Haslhofer, B.; de Boer, P.; Sihn, W. A Conceptual Model to Enable Prescriptive Maintenance for Etching Equipment in Semiconductor Manufacturing. Procedia CIRP 2020, 88, 64–69. [Google Scholar] [CrossRef]
  2. da Costa, P.R.D.O.; Akçay, A.; Zhang, Y.; Kaymak, U. Remaining useful lifetime prediction via deep domain adaptation. Reliab. Eng. Syst. Saf. 2020, 195, 106682. [Google Scholar] [CrossRef] [Green Version]
  3. Jia, F.; Lei, Y.; Lu, N.; Xing, S. Deep normalized convolutional neural network for imbalanced fault classification of machinery and its understanding via visualization. Mech. Syst. Signal Process. 2018, 110, 349–367. [Google Scholar] [CrossRef]
  4. Zhang, W.; Li, X.; Jia, X.D.; Ma, H.; Luo, Z.; Li, X. Machinery fault diagnosis with imbalanced data using deep generative adversarial networks. Measurement 2020, 152, 107377. [Google Scholar] [CrossRef]
  5. Ainapure, A.; Lia, X.; Singh, J.; Yang, Q.; Lee, J. Deep Learning-Based Cross-Machine Health Identification Method for Vacuum Pumps with Domain Adaptation. Procedia Manuf. 2020, 48, 1088–1093. [Google Scholar] [CrossRef]
  6. Chen, Z.; He, G.; Li, J.; Liao, Y.; Gryllias, K.; Li, W. Domain Adversarial Transfer Network for Cross-domain Fault Diagnosis of Rotary Machinery. IEEE Trans. Instrum. Meas. 2020, 11, 8702–8712. [Google Scholar] [CrossRef]
  7. Li, F.; Tang, T.; Tang, B.; He, Q. Deep Convolution Domain-adversarial Transfer Learning for Fault Diagnosis of Rolling Bearings. Measurement 2021, 169, 108339. [Google Scholar] [CrossRef]
  8. Jie, Z.; Wang, X.; Gong, Y. Gear fault diagnosis based on deep learning and subdomain adaptation. China Mech. Eng. 2021, 32, 8. [Google Scholar]
  9. Zhang, L.; Sun, L.; Yu, L.; Dong, X.; Chen, J.; Cai, W.; Wang, C.; Ning, X. ARFace: Attention-aware and regularization for face recognition with reinforcement learning. IEEE Trans. Biom. Behav. Identity Sci. 2021, 4, 30–42. [Google Scholar] [CrossRef]
  10. Cai, W.; Zhai, B.; Liu, Y.; Liu, R.; Ning, X. Quadratic polynomial guided fuzzy C-means and dual attention mechanism for medical image segmentation. Displays 2021, 70, 102106. [Google Scholar] [CrossRef]
  11. Ning, X.; Gong, K.; Li, W.; Zhang, L. JWSAA: Joint weak saliency and attention aware for person re-identification. Neurocomputing 2021, 453, 801–811. [Google Scholar] [CrossRef]
  12. Wu, C.; Sun, H.; Lin, S.; Gao, S. Remaining useful life prediction of bearings with different failure types based on multi-feature and deep convolution transfer learning. Eksploat. I Niezawodn. 2021, 23, 684–694. [Google Scholar] [CrossRef]
  13. Li, X.; Zhang, K.; Li, W.; Feng, Y.; Liu, R. A Two-Stage Transfer Regression Convolutional Neural Network for Bearing Remaining Useful Life Prediction. Machines 2022, 10, 369. [Google Scholar] [CrossRef]
  14. Miao, M.; Yu, J.; Zhao, Z. A sparse domain adaption network for remaining useful life prediction of rolling bearings under different working conditions. Reliab. Eng. Syst. Saf. 2022, 219, 108259. [Google Scholar] [CrossRef]
  15. Lu, H.; Barzegar, V.; Nemani, V.P.; Hu, C.; Laflamme, S.; Zimmerman, A.T. Joint training of a predictor network and a generative adversarial network for time series forecasting: A case study of bearing prognostics. Expert Syst. Appl. 2022, 203, 117415. [Google Scholar] [CrossRef]
  16. Cai, W.; Ning, X.; Zhou, G.; Bai, X.; Jiang, Y.; Li, W.; Qian, P. A Novel Hyperspectral Image Classification Model Using Bole Convolution with Three-Directions Attention Mechanism: Small sample and Unbalanced Learning. IEEE Trans. Geosci. Remote Sens. 2022, 61, 1–17. [Google Scholar] [CrossRef]
  17. Vaswani, A.; Shazeer, N.; Parmar, N.; Uszkoreit, J.; Jones, L.; Gomez, A.N.; Kaiser, Ł.; Polosukhin, I. Attention Is All You Need. In Proceedings of the 31st Conference on Neural Information Processing Systems (NIPS 2017), Long Beach, CA, USA, 4–9 December 2017. [Google Scholar]
  18. Alian, H.; Konforty, S.; Ben-Simon, U.; Klein, R.; Tur, M.; Bortman, J. Bearing fault detection and fault size estimation using fiber-optic sensors. Mech. Syst. Signal Process. 2019, 120, 392–407. [Google Scholar] [CrossRef]
  19. Al-Tameemi, H.A.; Long, H. Finite element simulation of subsurface initiated damage from non-metallic inclusions in gearbox bearings. Int. J. Fatigue 2020, 131, 105347. [Google Scholar] [CrossRef]
  20. LI, H.; Zou, Y.; Zeng, D.; Liu, Y.; Zhao, S.; Song, X. A new method of bearing life prediction based on feature clustering and evaluation. J. Vib. Shock. 2022, 41, 141–150. [Google Scholar]
  21. Lin, T.; Wang, H.; Guo, X.; Wang, P.; Song, L. A novel prediction network for remaining useful life of rotating machinery. Int. J. Adv. Manuf. Technol. 2022, 11, 1–10. [Google Scholar] [CrossRef]
  22. Mao, W.; Feng, W.; Liu, Y.; Zhang, D.; Liang, X. A new deep auto-encoder method with fusing discriminant information for bearing fault diagnosis. Mech. Syst. Signal Process. 2021, 150, 107233. [Google Scholar] [CrossRef]
  23. Nectoux, P.; Gouriveau, R.; Medjaher, K.; Ramasso, E.; Chebel-Morello, B.P.; Zerhouni, N.; Varnier, C. PRONOSTIA: An experimental platform for bearings accelerated degradation tests. In Proceedings of the IEEE International Conference on Prognostics and Health Management, Denver, CO, USA, 18 June 2012. [Google Scholar]
  24. Lei, Y.; Wang, B. XJTU-SY Bearing Datasets. J. Mech. Eng. 2019, 55, 1. [Google Scholar]
  25. Guo, C.; Deng, Y.; Zhang, C.; Deng, C. Remaining Useful Life Prediction of Bearing Based on Autoencoder-LSTM. In Proceedings of the International Conference on Mechanical Engineering, Measurement Control, and Instrumentation (MEMCI 2021), Guangzhou, China, 18 July 2021. [Google Scholar]
Figure 1. Architecture of an RUL prediction model for rotating parts.
Applsci 13 02622 g001
Figure 2. Changes in time-domain data of the machinery in different performance states.
Applsci 13 02622 g002
Figure 3. Overlaps of data regions (different colors represents time-domain representation data of different performance states).
Applsci 13 02622 g003
Figure 4. Principle of the attention mechanism.
Applsci 13 02622 g004
Figure 5. Structure of the attention−GRU model.
Applsci 13 02622 g005
Figure 6. Images of typical bearing failure types.
Applsci 13 02622 g006
Figure 7. Time-domain data curves of bearing performance under working condition 2.
Applsci 13 02622 g007
Figure 8. Clustering result of bearing useful life data under working condition 2.
Applsci 13 02622 g008
Figure 9. Attention-GRU model for RUL prediction experiments.
Applsci 13 02622 g009
Figure 10. Comparison of RUL prediction results of bearings under working condition 2.
Applsci 13 02622 g010
Figure 11. Comparison of prediction results of Attention-GRU and LSTM.
Applsci 13 02622 g011
Table 1. Overview of public datasets on bearings.
DatasetRUL InformationFault TypesTest Sets
CWRUNull1560
PaderbornAvailable232
IMSAvailable33
FEMTO-STAvailableUnlabeled14
XJTU-SYAvailable415
Table 2. Working conditions for accelerated life tests of bearings.
No. of working conditions123
Rotational speed (r/min)210022502400
Radial force/KN121110
Table 3. XJTU-SY datasets of bearings under working condition 2.
Working ConditionDatasetSum of SamplesL10Actual Useful LifePosition of Faults
2B2_1491 8 h11 minInner ring
B2_2161 2 h41 minOuter ring
B2_35336.789~11.726 h8 h53 minBearing cage
B2_442 42 minOuter ring
B2_5339 5 h39 minOuter ring
Table 4. Parameter configuration of the attention-GRU model.
ParameterOptimizerAttention-GRUDenseBatch SizeEpoch
Input SizeHidden SizeNum LayersAttention BatchDense1Dense2
Parameter/classAdam64642103213230
Table 5. RUL prediction error of attention-GRU and GRU.
Bearing GroupB2_1B2_2B2_3B2_4B2_5
Attention-GRU0.0920.1670.3160.1740.253
GRU0.1560.3050.5240.2790.348
Table 6. RUL prediction error of LSTM and our model.
Bearing GroupAttention-GRULSTM
B2_10.0920.286
B2_20.1670.227
B2_30.3160.374
B2_40.1740.216
B2_50.2530.342
Disclaimer/Publisher’s Note: The statements, opinions and data contained in all publications are solely those of the individual author(s) and contributor(s) and not of MDPI and/or the editor(s). MDPI and/or the editor(s) disclaim responsibility for any injury to people or property resulting from any ideas, methods, instructions or products referred to in the content.

