Featured Application
This study focuses on Emotion Recognition System an important application of Artificial Intelligence, Affective Computing, and Human-Computer Interaction.
Abstract
Emotion recognition systems (ERS) are an emerging technology with immense potential, exemplifying the innovative utilization of artificial intelligence (AI) within the context of the fourth industrial revolution (IR 4.0). Given that personalization is a key feature of the fifth industrial revolution (IR 5.0), ERS has the potential to serve as an enabler for IR 5.0. Furthermore, the COVID-19 pandemic has increased the relevance of this technology as work processes were adapted for social distancing and the use of face masks. Even in the post-pandemic era, many individuals continue to wear face masks. Therefore, ERS offers a technological solution to address communication challenges in a masked world. The existing body of knowledge on ERS primarily focuses on exploring modalities or modes for emotion recognition, system development, and the creation of applications utilizing emotion recognition functions. However, to enhance the development of impactful ERS, it is essential for researchers and innovators to understand the factors that influence its usage and adoption among the intended users. Therefore, this study presents a framework that combines technology adoption theories to identify the determinants of ERS adoption among Malaysian youth. Data for this study were collected through a survey involving 386 respondents. The findings revealed attitudes, subjective norms, perceived behavioral control, and awareness as significant determinants of ERS adoption. Additionally, the study found that technology aptitude plays a moderating role. These insights can inform the formulation of effective policies and programs to encourage and facilitate the development of innovative ERS solutions.
1. Introduction
Artificial intelligence (AI) has evolved from being an interesting theoretical concept to tangibility, with recent applications of AI making significant impacts across businesses, industries, and societies [1]. Inspired by human intelligence, AI aims to learn, reason, and make decisions like humans, reducing the need for human intervention [2]. AI has established trustworthiness, enabling AI systems in the aspect of beneficence, non-maleficence, autonomy, justice, and explicability [2,3,4]. AI systems are designed to operate with varying levels as well as defined objectives, predictions, and recommendations influenced by real or virtual environments. Furthermore, AI offers benefits for businesses and industries, such as the automation of repetitive and time-consuming tasks, which allows humans to focus on higher-value work [4]. For example, massive data, which used to be a challenge to analyze, are now easily processed by AI; complex problems can be tackled using AI in a more efficient manner by integration with thousands of computers and other resources [2,3,4].
Moving ahead to the present, we find ourselves in the era of the fourth industrial revolution (IR 4.0), characterized by digitalization and the integration of AI and computers in collaboration with societies [5]. IR 4.0 primarily emphasizes the manufacturing industry, enabling smart manufacturing through technologies such as AI [6]. The constant nature of technological change is propelling us towards the fifth industrial revolution (IR 5.0). What distinguishes IR 5.0 from IR 4.0 is the specialization of machines and computers, endowed with the capability to comprehend human actions [7,8]. Aspects of human–computer interaction (HCI) will become more significant as we move into IR 5.0. ERS is well positioned to be a key enabling technology for this, as it can enhance AI with abilities to understand human emotions and behavioral responses. To facilitate HCI, the computer system must have the ability to communicate with humans in some form [8]. Since the used cases of IR 5.0 are still in their formative years, manufacturers must actively consider strategies to incorporate humans and machines and maximize the opportunities that can be exploited in IR 5.0. Hence, the introduction of ERS may enhance robots and machines in understanding human emotions with the proposition of collaborative robots.
ERS is an emerging technology in the field of AI that allows machines to recognize human emotions by learning from various data modalities. It has gained significance due to technological advancements and potential applications. Initially introduced as part of affective computing (AC) by [9] to predict and understand human behavior, AC has further evolved to achieve recent advancements in recognizing emotions. Over the past decade, researchers have developed several ERS systems, which are now commonly embedded in various AI applications [10]. ERS offers a wide range of potential innovative solutions based on modalities introduced by previous researchers [11]. It has attracted significant interest from researchers, as evidenced by the increasing trend in studies related to ERS over the past decade, as shown in Figure 1. This underscores the importance of the research area. For the development of complex systems such as human-interacting robots, a sub-system capable of understanding and expressing human emotions has been proposed [6]. Previous studies indicate that ERS holds promise as a significant technology, offering advantages to individuals, societies, organizations, businesses, and industries across various platforms or applications. Examples include ERS in healthcare [12], driving assistance [13], and enhancing teaching and learning technologies in the education sector [14].

Figure 1.
ERS trend (https://link.lens.org/MjQS1wQaWkj), accessed on 10 June 2023.
However, over the last decade of ERS development, the research focus has mainly been in the area of developing and establishing the applications and modalities of ERS from the perspective of engineers and scientists. There is a limited number of studies in the field of social science that consider the level of readiness of potential users to adopt ERS. This influenced the research interest for this study on users’ adoption readiness towards ERS.
Locally, the Malaysian government is driving the IR 4.0 agenda. This can be seen with the introduction of the National IR 4.0 policy 2021, the National AI Roadmap 2021–2025, and the allocation of a budget for IR 4.0 initiatives in the Twelfth Malaysia Plan (12 MP) 2021–2025. One of the key factors that can ensure the success of the agenda is to ensure that young people are ready to adopt IR 4.0 technologies, which include ERS, a key technology for both IR 4.0 and IR 5.0. There is a wide range of potential innovative solutions that we can produce with ERS, but innovators need to have a better understanding of the factors affecting users’ adoption of ERS. This study aims to explore the adoption and readiness of users towards ERS. By investigating their sentiments towards ERS and the factors influencing users’ adoption readiness for ERS, this research seeks to provide insights into whether individuals are prepared to integrate ERS into their lives. Drawing from established technology adoption theories, this study pinpoints key factors that will determine whether users are ready to embrace ERS as a valuable component of technological advancement.
Specifically, this study was designed to identify and understand the determinants of ERS adoption in the context of Malaysian youth. According to the new Malaysian youth policy, the age range for this group is between 18 and 30 years old3. Referred to as digital natives [15], the youth cohorts that were born in the 1980s and later are characterized as possessing sophisticated knowledge and skills regarding technology compared to the older generations. Young people are a key technology adopter group in society as they are characteristically more technology savvy. As suggested by previous studies, technology and youth can be seen as complementary to each other because young people are key influencers of technology trajectories based on their usage [15,16]. Thus, there is a need to identify and understand the determinants of ERS adoption in the context of youth in general and Malaysian youth specifically. The insights will enable ERS practitioners to develop more impactful ERS to benefit societies, businesses, industries, and the country. Policymakers would be able to propose enhancements towards relevant policies and launch new initiatives that accelerate the adoption of ERS specifically and AI technologies in general. Moreover, the findings of this study will offer valuable insights into the determinants of ERS adoption readiness that can help in preparing society for emerging technologies such as ERS.
2. Literature Review
ERS is an advanced AI application that utilizes affective computing to understand and respond to human cues [17] and has become increasingly significant in the related field of study since it was introduced by [9]. ERS enhances AI in human–computer interaction and represents an additional advancement in technological progress [18]. AI, as the basis for intelligent machines or computers that enhance productivity in different settings [19], forms the foundation for incorporating emotion recognition as a subset of AI technology. Over the last decade, researchers and innovators have explored ERS modalities that consist of physiological, physical, and data mining from text or documents. These modalities have been suggested as part of the innovation for AI to enable tasks such as learning and understanding human emotions [20].
Physiological modalities are commonly found within the healthcare industry, such as electroencephalography (EEG), electrocardiography (ECG), and photoplethysmography (PPG). EEG serves as an analytical tool utilized in neuroscience, neural engineering, and biomedical engineering to measure human brain signals by observing the electromagnetic activity of specific components [21,22]. EEG is the preferred modality for accurate data in automated emotion recognition, as it aligns with AI systems that employ convolutional neural networks and deep machine learning [23,24]. It has been tested in detecting human emotions and is considered a cost-effective, portable, and simple method of identifying emotions [25]. ECG is one of the most well-known modalities and is commonly used in emotion recognition and affective computing research. Previous studies have utilized ECG to detect stress and emphasize the importance of monitoring emotional stress levels to prevent negative outcomes [12]. Machine-based ERS utilizing ECG provides an alternative to physical modalities. PPG, along with the galvanic skin response (GSR), is considered a practical and suitable modality for real-life applications [26].
For physical modalities, the modalities involved are facial recognition, speech recognition, body movement, etc. Facial recognition and speech recognition are considered well-known physical modalities for ERS researchers and have been extensively utilized in previous works [27,28]. Facial recognition, in particular, has been identified among ERS practitioners due to its wide range of real-world applications, including security supervision, online learning, and gaming experiences [28]. Speech recognition, as a modality of ERS, is capable of identifying human feelings and “makes conventional speech emotion recognition (SER) more suitable for real-life applications” [29] (p. 1). According to [30], one of the earlier instances of the detection of human emotion was through speech recognition: based on someone’s voice, the computer can specify the emotive cue and determine the emotion of the person. Combining the modalities also leads to better results in enabling ERS. For example, a study by [31] suggested that a combination of modalities such as EEG and facial recognition compensates for their defects as single information sources [31].
Text data mining refers to machine learning techniques that involve learning-based algorithms and feature extraction to describe the main characteristics of textual data [32]. In a recent study by [33], text word mining using emotion-label lexicons, such as a small set of seed words, was employed. For example, the text “Hurray!” can be labeled as indicating happy emotions, while “Argh!” may represent anger and frustration. Nevertheless, certain words may possess overlapping potential emotions; for instance, the word “Aww”, can convey both pleasant sentiments and expressions of pity and sympathy [33,34]. Various applications leveraging data and text mining for the automatic recognition of sentiments or emotions can be observed, particularly in eliciting opinions related to marketing or promotional content from sources like blog posts, social media, articles, surveys, etc. [35]. This can be applied to the web, such as chats on social networks, by analyzing their sentiments and emotions. Moreover, deep-learning-enabled emojis such as smilies, symbols, and characters based on text can be used to further classify emotions [36].
2.1. ERS Applications
ERS holds the potential to be applied in and bring benefits to various sectors due to its adaptability as an embedded technological function within a system. In other words, it can be one of the functionalities used to process the inputs of AI-enabled smart machines and computers to affect higher levels of HCI. ERS has been identified as having the potential to benefit the education sector as it can enable better engagement between instructors and learners [14,37]. Emotions exert a noteworthy influence on academic performance, with positive emotions being particularly instrumental in enhancing student interest and focus and increasing the likelihood of academic success [37]. Instructors have derived benefits from using a webcam equipped with facial recognition technology within a computer to identify students’ moods [14]. Another example of an ERS application is its integration into the implementation of a smart car [13]. A driver’s performance can be influenced by their emotions, particularly given their impact on the driver’s focus. Therefore, ERS has significance for applications to ensure driving safety. Specifically, [13] used a driving simulation with a built-in ECG modality in the steering wheels to detect human blood pressure in indicating emotional states of stress and fatigue.
Similarly, the use of facial expressions for ERS towards video surveillance was proposed in [38]. It has been highlighted that video surveillance systems nowadays are operated via human capabilities to interpret behavior through video surveillance, which leads to delays in responding to emergencies [38]. The experiments concluded that the implementation of facial recognition as part of ERS towards video surveillance system can improve the reliability of abnormal behavior detection via facial expressions depending on different emotions and environmental conditions. Furthermore, facial expressions can be used in identifying pain, which will benefit the healthcare industry [39]. Assessing a patient’s pain levels over time is deemed to be important, specifically regarding the effectiveness of medical treatments. Therefore, the usage of facial expression recognition can be widely anticipated in the healthcare industry.
Physiological modalities have gained increased attention towards the successful implementation of ERS since physiological factors are more useful in understanding human emotions through neural activity [40]. Among physiological modalities, most of the methods have been assessed through healthcare facilities; therefore, the implementation of ERS through physiological modalities is more likely to be beneficial for the healthcare industry. Moreover, ERS applications in the healthcare industry can serve as a supportive aid for people with conditions like Down’s syndrome and autism and among the elderly [41]. Multi-modal approaches combining facial expressions for automated emotion recognition and computer advisors guiding appropriate reactions to specific situations have been explored [41,42]. Additionally, a communication aid using speech recognition was proposed to identify the tone and voice of special needs patients with conditions like autism or Down’s syndrome [42]. However, given the accessibility of technologies, some components may be implemented in technological devices; thus, they can enhance global outreach to users.
During the pandemic caused by COVID-19, some potential innovative solutions were introduced to enable technologies to be adopted in daily life, supported by virtual videoconferencing, which made breakthroughs and enabled working environments such as work from home, online classes, virtual event gatherings, and more [43]. Ref. [43] suggested that facial emotion recognition may provide a significant effect in reducing videoconferencing fatigue by analyzing participants in videoconferencing through Zoom; they tracked users using a facial recognition modality to recognize six emotions. Furthermore, in the marketing sector, ERS has significant applications in increasing brand awareness through image, video, and text mining [44]. For instance, text mining implemented in web browsers can analyze feedback and comments from potential users, revealing their sentiments and emotions towards a certain product [36,44]; other studies have gathered a small group of individuals in a room, introducing a product and recording their reactions to evaluate their emotions [45].
With such potential of ERS and its innovative applications, there is a need to understand whether individuals are ready for the technology. Considering that ERS will be available in various industries and implemented for daily use, investigating the importance of ERS is crucial; this can help ERS scientists, engineers, practitioners, and technology developers to understand the factors influencing users in adopting ERS. Furthermore, to identify the factors, previous studies have suggested technology adoption theories and concepts that identify the user’s behavior, intention, adoption, and readiness for such technologies.
2.2. Theoretical Framework
The development of ERS modalities and applications has been discovered to be promising and beneficial, and the trend (see Figure 1) shows that the field of study related to ERS will be further expanded, especially in the direction of IR 5.0. As discussed in Section 1, this paper will identify the factors impacting the readiness of users in adopting ERS; therefore, the technology adoption theories based on the behavior and intentions of a user in using a technology will be identified in forming the research framework for this study. Previous studies have put forth several theories to elucidate consumers’ acceptance of new technologies and their intention to use them. Among these widely used theories are the Technology Acceptance Model (TAM) [46], the Theory of Planned Behavior (TPB) [47], the Theory of Diffusion of Innovations (DOI) [48], and the Unified Theory of Acceptance and Use of Technology (UTAUT) [49]. These theories offer valuable insights into understanding technology acceptance, intentions and behaviors of individuals.
The primary objective of this study is to gain insights into the readiness of users to adopt ERS; thus, the theoretical framework adopted in this study incorporates the TPB proposed by [47]. By incorporating TPB, the study aims to provide a comprehensive understanding of the factors influencing the acceptance of ERS technology. TPB examines the behavioral intentions of individuals, considering their attitudes, subjective norms, and perceived behavioral control [47]. Initially, the Theory of Reasoned Action (TRA), introduced by Fishbein and Ajzen in 1975, served as the basis for TPB. TPB extends TRA by incorporating perceived behavioral control as a new determinant. An individual’s attitude towards a behavior, whether a positive or negative attitude, plays a crucial role in determining their readiness in adopting ERS [47]. Subjective norms refer to the influence of surrounding individuals, such as family or peers, who may approve or disapprove of the behavior [48]. Perceived behavioral control relates to an individual’s perception of the ease or difficulty in performing the behavior [47]. Since its inception, TPB has been widely employed to assess social behavior and its impact on an individual’s intended behavior, particularly in the context of technology adoption. TPB has proven valuable in understanding how behavior and intention contribute to the adoption of various technologies [50,51,52,53].
In addition to TPB, this study also draws upon the Diffusion of Innovation (DOI) theory introduced by [48]. Given the importance of human-centered design, the DOI theory explains the process of how innovations are communicated and adopted within a social system or society [48,54]. Specifically, this study incorporates the DOI technology adopter categories, which include innovators, early adopters, early majority, late majority, and laggards, to understand the characteristics of the Malaysian youth in the social system. Both innovators and early adopters play a leadership role in introducing technology to the wider social system [55,56], while the early majority represent the group that adopts the technology after it has become more significant and widely available, waiting for the innovators and early adopters to possess and validate its usefulness [54,55,56]. These three levels of DOI represent the interest in and understanding of the technology within the social system. The late majority refers to individuals who adopt the technology only when it becomes necessary [56,57], while laggards are the last group to adopt the technology because technological innovations may not significantly impact their daily lives [56,57]. These two levels of DOI represent low interest and a reduced understanding of technology. However, in this particular study, the DOI adopter categories are classified according to technology aptitude (TA), which refers to an individual’s ability to use a technology as intended by the engineers or technology developers, as shown in Table 1.

Table 1.
Technology aptitude.
Furthermore, earlier, this paper highlighted the importance of policies and programs implemented by the Malaysian government and their commitment in ensuring the adoption of technological advancements. Therefore, one of the factors that incorporates the information related with the infrastructure, policies, and structural environment is facilitating conditions from UTAUT by [49]. Facilitating conditions emphasize the importance of infrastructure support, which will enhance the readiness for adoption [58,59,60]. Hence, it is important as it is one of the factors determining whether the structural environment of ERS in this country is supported, and encouragement is needed to accelerate the adoption of ERS. Lastly, familiarity and awareness are possible factors in readiness, highlighted in many previous studies [61,62]. A thorough search was performed to support the findings on awareness and the fact that it is one of the key factors that determine technology adoption. Some studies provide insights into the awareness of and familiarity with the technology; therefore, awareness has been added as part of the theoretical framework for this study.
3. Methodology
This study employs descriptive research to gather information based on the characteristics of the study [63]. It subscribes to the research philosophies of epistemological objectivism, aiming to uncover truth within the observable and measurable real world [63]. This approach ultimately seeks to elucidate reality. In terms of the research paradigm, the study aligns with positivism, which emphasizes the generalization of observable social realities and employs existing theories to formulate hypotheses [63]. As a result of these chosen research paradigms and philosophies, the methodology employed in this study represents quantitative research. This approach involves data collection and analysis through statistical methods to assess theories. The primary data collection technique employed is the distribution of questionnaires to participants [63].
3.1. Hypothesis Development
This study focuses on investigating the behavioral intentions of users regarding their readiness to adopt ERS. Specifically, it seeks to identify and understand the factors that shape this behavioral intention, making the behavioral intention (BI) for ERS adoption readiness the dependent variable in this study.
Furthermore, the study aims to assess whether the existing infrastructure, policies, and programs are adequate to facilitate ERS adoption. In this context, “facilitating conditions” (FC) from UTAUT [49] is introduced as the first set of independent variables. It is important to recognize that ERS practitioners and engineers must innovate in alignment with the infrastructure supporting ERS utilization. Prior research has indicated the significance of FC when there are sufficient infrastructure and policies encouraging technology adoption [60,64,65,66,67]. It is crucial to note that FC directly impacts the intentions of individuals to either embrace or reject the technology.
The second determinant, attitude (AT), is derived from TPB [47]. The concept of attitude has been a fundamental factor in the adoption of various technologies, as it plays a pivotal role in gauging an individual’s readiness to engage in a specific behavior [68,69,70], such as the adoption of ERS. This is because an individual’s attitude is a key internal factor that influences their willingness to embrace new technologies [52,53,68,69,70]. Thus, it is imperative to assess the attitudes of Malaysian youth towards ERS.
The third determinant, subjective norms (SN), the second antecedent from TPB [47], is another component proposed in this study, representing the perceived social pressure that influences an individual’s decision to engage in a particular behavior [69,70,71]. It suggests that exposure to ERS can help in demonstrating its utility and foster its adoption among one’s social circle.
The fourth determinant, perceived behavioral control (PBC), the final antecedent from TPB [47], pertains to an individual’s assessment of their own ability to carry out the behavior. As discussed earlier, a person’s capability and proficiency in using technology significantly impact their likelihood of adopting it [68,69,70]. In the context of this study, the goal is to ascertain whether Malaysian youth possess the necessary skills and abilities to effectively use ERS technology.
The final determinant identified is awareness (AW). Awareness has been recognized as a significant factor influencing users’ behavior in the adoption of technology, as suggested by prior studies [72,73,74,75]. It plays a crucial role in shaping users’ willingness to engage with technology.
Additionally, this study proposes the possible moderating effects, of technology aptitude (TA), derived from the adopter categories from DOI [48]. Specifically, it is suggested that there might be moderating effects of TA towards the relationships between FC, AT, SN, PBC, and AW regarding BI.
3.2. Research Framework
This paper expands upon our preliminary study [76], refining the research framework and objectives. Figure 2 presents the finalized research framework with 10 hypotheses.
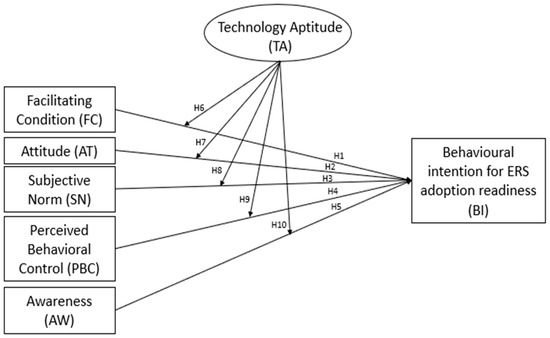
Figure 2.
Research Framework.
H1:
FC significantly affect the BI of ERS adoption readiness.
H2:
AT significantly affects the BI of ERS adoption readiness.
H3:
SN significantly affects the BI of ERS adoption readiness.
H4:
PBC significantly affects the BI of ERS adoption readiness.
H5:
AW significantly affects the BI of ERS adoption readiness.
H6:
TA moderates the effects of FC towards BI for ERS adoption readiness.
H7:
TA moderates the effects of AT towards BI for ERS adoption readiness.
H8:
TA moderates the effects of SN towards BI for ERS adoption readiness.
H9:
TA moderates the effects of PBC towards BI for ERS adoption readiness.
H10:
TA moderates the effects of AW towards BI for ERS adoption readiness.
3.3. Research Design
A research design is crucial in structuring and organizing all the components of a research study effectively [77]. Figure 3 illustrates the overall research design adopted for this study.
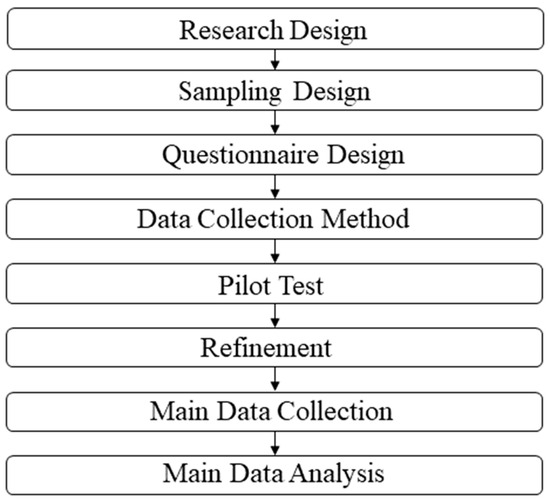
Figure 3.
Research design.
The sampling design revolves around the sampling technique and target population, which, in this case, is the Malaysian youth. The decision to focus on the youth demographic is based on their reputation for being technology-savvy compared to other age groups [15,16]. Young people are among the most active and influential participants in the technology sector in general, as they are the ones who are most likely to adopt new and innovative technologies that can shape the future. Therefore, understanding the factors that motivate and facilitate their adoption of a particular technology can help researchers, policymakers, educators, and technology providers to design and implement more effective and user-friendly solutions that can meet the needs and preferences of young people. Moreover, driving adoption by young people may have a positive impact on the adoption of new technologies, innovations, or behaviors among other groups in society. Motivated by this understanding, this study aims to provide insights into the behavioral intention regarding the use and exploration of ERS by Malaysian youth.
The survey data collected for this study are based on individual responses. The sampling method used is a non-probability technique, namely purposive sampling [63]. This technique selects participants who have specific characteristics that are relevant to the research topic. In this case, the criteria are being Malaysian and belonging to the youth age group as defined by the Malaysian Youth Policy. The sample size was determined by using GPower 3.1 [78], a statistical software program that calculates the minimum number of participants needed for a study. According to GPower 3.1, this study required a minimum sample size of 123 participants.
The questionnaire design comprises two key components: questionnaire development and the scale of measurement. In this study, the questionnaire development draws from a combination of adaptations from previous research and original approaches for certain sections like demographic profiling, technology aptitude (TA), and awareness (AW). The sections on facilitating conditions (FC), attitudes (AT), subjective norms (SN), perceived behavioral control (PBC), and behavioral intention (BI) are adapted from prior studies (see Table 2).
Table 2.
Questionnaire development.
The survey was disseminated at educational institutions and universities, given their high concentration of the youth demographic. Additionally, the survey was also sent to youth societies registered under the Ministry of Youth and Sports (MYS) in Malaysia, as well as the Institute of Youth and Research (IYRES) Malaysia. The survey utilized a 7-Likert scale, ranging from “strongly disagree” to “strongly agree”.
The pilot test involved 50 university students within the specified sampling criteria. This test aimed to analyze and validate the items and scales using Cronbach’s Alpha. The results, as shown in Table 3, fell within the acceptable threshold values of 0.70 [86], indicating a high level of internal consistency among the items. This suggests that the survey instrument is reliable and suitable for the main study. It is worth noting that values exceeding 0.50 are also considered acceptable, particularly in exploratory research or when dealing with scales or constructs [87,88].
Table 3.
Pilot test.
The refinement stage included a focus group with approximately 15 youth participants to further assess the survey items’ clarity and relevance. The focus group confirmed that the items were appropriate for the intended study.
For the main data analysis, structural equation modeling (SEM) is employed. SEM is typically suited for larger sample sizes, often necessitating a minimum of approximately 200 participants [89,90]. There are two primary SEM methods to choose from: covariance-based SEM (CB-SEM) and variance-based partial least squares SEM (PLS-SEM) [91]. CB-SEM is grounded in the common factor model, focusing on shared variance among variables. In contrast, PLS-SEM incorporates common, specific, and error variance from independent variables to enhance the prediction of variance in dependent variables [91]. PLS-SEM aligns with this study’s purpose, given the presence of multiple variables within the same construct to observe the phenomenon. Furthermore, as recommended by [91], PLS-SEM is recommended in studies related to social science and technology forecasting. Specifically, the study used the Smart PLS 4.0 software for the PLS-SEM analysis [92]. According to [90,91], more than 10,000 researchers have cited the use of SmartPLS, which indicates the reliability and trustworthiness of the software in performing PLS-SEM. Moreover, SmartPLS 4.0 provides results similar to previous versions, with an enhancement in usability, such as importing the data, creating the models, and managing and analyzing in a more direct manner [92].
4. Findings
This section reports the findings of the main data analysis. This section is divided into subsections, including the demographic profile and PLS path model, to present all the findings retrieved from the Smart PLS 4.0 software for PLS-SEM in this study [92].
4.1. Demographics of Respondents
A total of 392 questionnaires were administered to Malaysian youth, including universities, colleges, institutions, and youth societies. Table 4 shows the total demographic profile of the respondents. However, to meet the criteria of this study, two important criteria, which were the nationality and age range (Malaysian and youth), were considered initially. Based on the 392 questionnaires collected, 6 of them did not meet the criteria (non-Malaysian and non-youth). Thus, the final total number of observed respondents for this study was 386.
Table 4.
Demographic profile of respondents.
As shown in Table 4, the first section of the survey concerned gender, which showed that 52.1% of the respondents in this study were male (201 respondents) and 47.9% of respondents in this study were female (185 respondents). Next, the survey focused on the age category. The majority of the respondents were within the age category of 20–25 years old, with 76.9% (297 respondents), while those less than 19 years old represented 12.7% (49 respondents), and the last category was 26–30 years old, with 10.4% (40 respondents). From the total of 386 respondents, it was necessary to examine the state of the demographics. Based on Table 4, the majority of the respondents were from Johor, with 32.1% (124 respondents), followed by Selangor, with 13.0% (50 respondents), and Malacca, with 12.7% (49 respondents), as the top three states with the highest numbers of respondents.
The next section examined the technological devices available currently and asked whether the participants used more than one smart device to evaluate the motivations to adopt a certain technology and justify that youth are more likely to use a technology when the technology is available. This section also allowed the respondents to specify more than one answer; therefore, the total number of each answer was based on a value of 386. As expected, the majority of the participants owned smartphones (348 respondents), followed by laptops (333 respondents) and tablets (130 respondents).
In the next section of the survey was a general question on the basic knowledge of ERS. Based on Table 4, the majority, namely 143 respondents (37%), were in the stage of fundamental awareness or basic knowledge of ERS, understanding the basic techniques and concepts of ERS in general, and 85 respondents (22%) were in the intermediate stage, in which respondents were identified to be able to perform tasks with ERS, although, in the intermediate stage, they may require less guidance from an expert and may be able to use the technology independently. This was followed by those with no awareness, with 61 respondents (15.8%) who had no knowledge or understanding of the concept of ERS. Meanwhile, 54 respondents (14.1%) were novices, indicating that the respondent had a level of experience or exposure to ERS but did not fully understand it and required an expert for guidance. The next two stages were advanced, with 29 respondents (7.5%), and experts, with 14 respondents (3.6%).
The next section was the moderator for this study, which was technology aptitude. Regarding the DOI adopter categories, a higher number of respondents were in the early majority, with 29% (112 respondents), and late majority, with 26.1% (101 respondents). The early majority indicates that the respondents will adopt a technology when the technology is widely adopted by others first, and the decision to use the technology is based on the utility and practical benefits of the technology. The second highest category was the late majority, in which respondents were more cautious before committing to a new technology and preferred someone to encourage them to adopt a new technology so that they could refer to someone when they had questions or problems in using the technology. The late majority group belonged to the low TA category in this study.
The number of respondents classified as innovators was the third highest, with 22.8% (88 respondents), which indicates that these groups will adopt the technology simply because it is new and they tend to be more ready to take risks in using a technology regardless of the stability of the performance of the technology. The next category was the early adopters, with 16.1% (62 respondents), which represents the group that creates trends and opinions allowing the technology to be widely used. The last group from the DOI adopter categories was laggards, which represented 6% (23 respondents) of the total respondents. One of the main characteristics of laggards is that they will adopt a technology only if they are forced to use it and it is necessary and important in their daily lives or for job opportunities.
Furthermore, this study examined the relationship between age and technology aptitude to gain better insights into the demographic. From Table 5, the age category of <19 years comprised 69.4% (34 respondents) who showed high technology aptitude and 30.6% (15 respondents) who had low technology aptitude. For the 20–25 years category, the majority were of high technology aptitude, with 65% (193 respondents), and 35% were of low technology aptitude. The last category was 26–30 years, in which the majority, 72.5% (29 respondents), had high technology aptitude and 27.5% (11 respondents) had low technology aptitude. Thus, it can be concluded that the majority of the age category, a total of 202 respondents, had high technology aptitude. Therefore, the youth age range can be considered to represent innovators, early adopters, and the early majority. This aligns with [93,94], in which that youth were considered technology-savvy due to their opinions on and usage of technology being slightly higher, as the total number of youth respondents found was found to exhibit high TA.
Table 5.
Relationship between age and technology aptitude.
4.2. Descriptive Analysis
A total of 53 items were measured from the variables in this study, namely FC (9 items), AT (9 items), SN (10 items), PBC (14 items), AW (6 items), and BI (5 items). The data were analyzed for their central tendency (mean), dispersion (standard deviation), and normality of variables (skewness and kurtosis). Table 6 shows the results of the mean, standard deviation, kurtosis, and skewness. This study used a 7-point scale from “1 = strongly disagree” to “7 = strongly agree”. AT recorded the highest mean value of 5.319, followed by PBC (5.106), SN (4.888), FC (4.828), BI (4.814), and AW (4.569). Next, the standard deviation ranged from 1.215 to 1.426. The highest mean score for AT and PBC shows that most people agree that an individual’s ability and support based on infrastructure influence their adoption readiness. The BI (4.814) mean score is within the median based on the 7-point scale, therefore indicating a good level of agreement regarding BI and ERS adoption readiness. Next, the kurtosis and skewness were assessed to identify the normal distribution of the data. Skewness and kurtosis beyond the range of ±3 to ±10 may be beyond the limit for tolerable normality and cause a problem in the next stage [95]. The suggested degree of normality is 0 to 3 [96]. The results of the statistics of individual items and variables did not fall between ±3 and ±10 and were within the range of 0 to 3. Thus, the data were normally distributed and suitable for further analysis.
Table 6.
Descriptive analysis.
4.3. Smart PLS
Figure 4 is the construct retrieved from Smart PLS 4.0. The two stages of Smart PLS 4.0 data analysis, reflective measurement model analysis (Stage 1) and structural measurement model analysis (Stage 2), will be analyzed.
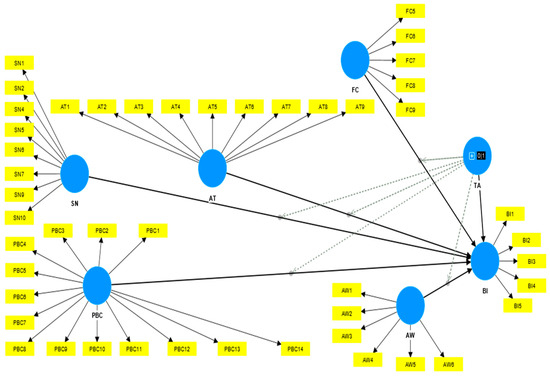
Figure 4.
Initial framework on Smart PLS 4.0.
4.4. Reflective Measurement Model
Before proceeding to the PLS-SEM’s structural model assessment (stage 2), certain quality criteria must be met in Stage 1. This involves evaluating the reliability, convergent validity, and discriminant validity. Reliability pertains to the extent to which a measurement is stable and free from random error [97]. In the context of PLS-SEM, composite reliability (CR) is the preferred metric [98]. To establish reliability, the CR should be at least 0.70 [97]. Convergent validity measures the degree to which one attribute is associated with others within the same dependent variables [99]. To ascertain convergent validity, we calculated the average variance extracted (AVE) to assess item factor loadings and their significance [97,98,99]. The AVE of the measurement model should exceed 0.50, indicating that the variables explain at least 50% of the variance in the outer models [98]. Factor loadings determine an item’s contribution to its constructs, and they should be at least 0.708 [99,100].
Table 7 indicates that all item loadings exceed the minimum threshold of 0.708 for their respective constructs. Additionally, they contribute to an AVE value that surpasses the minimum threshold of 0.50 for FC, AT, SN, PBC, AW, and BI. Moreover, the minimum CR value of 0.70 is met, signifying that the measurement models satisfy the reliability and convergent validity requirements.
Table 7.
Reflective measurement model.
The next step involves assessing the discriminant validity of the model, which can be done using one of three methods [98]. The first method is the Fornell and Larcker Criterion, which examines the extent to which indicators load more strongly on their respective constructs than on other constructs [101]. Table 8 illustrates that all constructs in the model exhibit satisfactory discriminant validity. This implies that the constructs are distinct from one another with every value in its own construct is higher than other construct, demonstrating that the model displays satisfactory discriminant validity. It indicates that the study’s constructs are not highly correlated with each other.
Table 8.
Discriminant validity (Fornell and Larcker Criterion).
In the second method, even if the Fornell and Larcker Criterion is met, there is a need to assess the discriminant validity through cross-loadings of every item in the construct [98,100]. Table 9 shows the cross-loadings between constructs. In this analysis, it is important to observe that each item should have high loadings on its construct but low loadings on other constructs. The results in Table 9 further support the conclusion that the constructs in the study demonstrate discriminant validity due to the value of each item is higher on its own construct than other construct, indicating that they are distinct from each other and can be reliably measured as separate constructs.
Table 9.
Cross-loadings.
The final step in assessing discriminant validity is to apply heterotrait–monotrait (HTMT) techniques [100]. Based on the results of the HTMT technique in Table 10, it is evident that all the HTMT values meet the criteria of HTMT.90 and HTMT.85. This indicates that the HTMT ratios of the correlations between constructs satisfy the threshold criteria [102]. Consequently, the requirement for discriminant validity is fulfilled. Furthermore, the HTMT inference results demonstrate that the confidence intervals (CI) do not include a value of one for any of the constructs (see Table 10) [102,103]. The assessment of discriminant validity adds credibility to the study’s measurement model, ensuring that the constructs are appropriately defined and accurately represent the intended concept.
Table 10.
HTMT criterion.
4.5. Structural Measurement Model
In the second stage of PLS-SEM, the focus is on evaluating the structural measurement model to assess the path model involving the study’s variables. Ensuring the absence of latent collinearity in the structural model is crucial [100]. While the discriminant validity criteria are met, the presence of latent collinearity can sometimes obscure the findings and lead to incorrect interpretations, especially when two variables with a hypothesized causal relationship measure the same construct [104]. Table 11 provides the results of the lateral collinearity test, presenting the inner variance inflation factor (VIF) values for the independent variables. These VIF values, which need to be examined for lateral multicollinearity, are all either below the threshold of 5 [104] or fall within the range of 5 to 10 [104]. These results indicate that there is no concern regarding lateral multicollinearity in the study. The findings in Table 11 lead to the conclusion that latent collinearity issues are not present in the structural model. This confirms the reliability of the results and supports the validity of the causal relationships between the variables in the model.
Table 11.
Collinearity assessment.
Next, it is necessary to measure the path coefficients of the structural model proposed earlier. The path coefficients are versions of linear regression weights that can be used in examining the possible causal linkages between statistical variables in the SEM approach. The significance of the proposed hypotheses was tested using t-statistics generated through bootstrapping in Smart PLS 4.0. Table 12 displays the assessment of the path coefficients, with five hypotheses found to have t-values greater than 1.28, and the p-value for this study was 0.10. Specifically, the predictors AT (0.006), SN (0.018), PBC (0.002), and AW (0.046) were found to significantly affect the BI readiness of ERS, while one moderator hypothesis was supported, which was TA × FC (0.088), regarding the BI readiness of ERS, due to the t-value > 1.28 and the p-value < 0.10. Furthermore, as suggested by [105], the p-value indicates whether there is an effect that exists, but the p-value will not reveal the size of the effect; therefore, an assessment of the effect size is recommended, as in [98,99]. The effect size is measured using f2, with values of 0.02, 0.15, and 0.35 representing small, medium, and large effects, respectively [106]. From Table 12, it can be observed that all constructs have relatively small effect sizes.
Table 12.
Hypothesis testing.
The f2 contributes to the coefficient of determination or R2. R2 is the proportion of the variation in the dependent variables that is predictable from the independent variables [106]. The R2 values are assessed as follows: 0.25 (weak), 0.50 (moderate), and 0.75 (substantial) [106]. Furthermore, the predictive relevance or Q2 is assessed to measure whether a model has predictive relevance accuracy, specifically when the f2 is relatively small [100]. The minimum value of Q2 is 0, while the closer the Q2 value to the R2, the more predictive the constructs’ relevancy [100]. Table 13 shows the value of R2 (0.632), which is a moderate value and indicates that the model explains 63.2% of the variance, and the Q2 is 0.557, which is above the minimum value and closer to the original coefficient R2 [100].
Table 13.
R2 and Q2.
4.6. Moderators
Using Smart PLS 4.0, assessment of the moderator is achieved directly from the calculation of the PLS algorithm, and the report indicates the total effects of moderators on the independent variables to the dependent variables. One of the proposed moderator hypotheses is supported in this study, which is H6 (Table 12). Based on the slope analysis, Figure 5 shows that TA × FC has an interaction and intersects at 0.136 at BI. In Figure 4, it is shown that there is an interaction between low TA and high TA. High TA has a positive slope, while low TA has a negative slope. Therefore, it indicates that when the FC is higher, people with high TA show increased their BI towards adopting ERS, while people with low TA show decreased their BI towards adopting ERS.
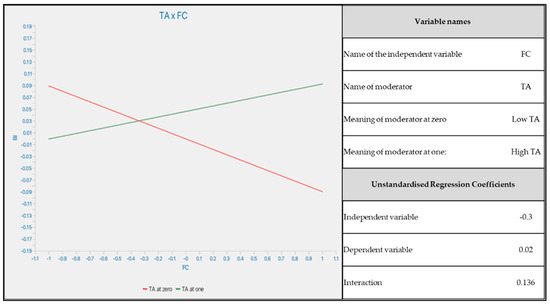
Figure 5.
Slope analysis (TA × FC).
4.7. Goodness of Fit (GoF)
In this study, the goodness-of-fit (GoF) measures are examined in terms of the standardized root mean square residual (SRMR) on the saturated model and estimated model. The saturated model evaluates the correlations between all constructs and is utilized to assess the model fit during the measurement model stage [100]. On the other hand, the estimated model considers the model structure and represents a more restricted fit during the structural model stage [100]. SRMR is calculated by transforming both the sample covariance matrix and the predicted covariance matrix into correlation values [107]. Table 14 displays the SRMR GoF results for this study. According to [107], a value less than 0.08 indicates a good fit. In this study, both the SRMR values for the saturated and estimated models are below 0.08, indicating a good fit. This suggests that the observed variables, including the dependent variables, used in this study support the model and are consistent with previous studies employing the same predictors and variables. Overall, based on the SRMR GoF results, the model demonstrates a good fit, indicating that the observed data align well with the proposed model and are in line with previous studies that have utilized similar predictors and variables.
Table 14.
SRMR model fit.
5. Discussions
In the previous section, the study’s findings were discussed. Table 12 revealed that five hypotheses were supported in this study, with four of them stemming from direct relationships and one being a supported moderation hypothesis.
The first research objective of this study was to gauge the sentiments of Malaysian youth towards ERS. These sentiments serve as an indicator of whether Malaysian youth hold a positive or negative attitude towards ERS, a technological advancement. A positive attitude would suggest that ERS implementation might be relatively straightforward for ERS engineers and scientists, whereas a negative attitude indicates that it would require more cautious consideration. Analyzing the mean scores presented in Table 6, it is apparent that the mean score for AT is 5.319, indicating that the majority of respondents hold a positive attitude towards ERS and agree that ERS can be a beneficial technological advancement. This should serve as encouragement for innovators and relevant technology actors to engage further in R&D to produce more ERS or solutions utilizing emotion AI.
Next, the research aimed to identify the determinants of ERS adoption. Five variables were put forth as possible determinants of ERS adoption readiness. As reported in Table 12, four variables were confirmed as significant determinants of BI. The four variables were AT, SN, PBC, and AW. AT, SN, and PBC were the original constructs of TPB. Thus, the findings are consistent with numerous prior studies [50,51,52,53].
H1 was not supported (see Table 12), suggesting that FC does not significantly affect BI. This is not consistent with identified earlier studies [60,64,65,66,67]. However, it is important to note that most of the earlier studies did not investigate ERS adoption specifically. For example, refs. [66,67,68] highlighted that infrastructural resources and specific policies may play a role in influencing user behavior and intention to use technology. The findings regarding H1 suggest that there might be a lack of adequate structural support within the country to encourage users to adopt ERS. Alternatively, it could also indicate that there is a lack of clear and effective initiatives tailored to promoting or facilitating the implementation of ERS in the country. Thus, ERS practitioners should lobby for more targeted policies and initiatives for ERS diffusion from the government.
H2 was supported (see Table 12), suggesting that AT significantly affects BI. The finding is consistent with previous studies [52,53,69,70] that have suggested that AT can be one of the important factors in ensuring the accelerated adoption of a specific technology [47] based on compatibility and adaptability in using the technology [108]. In other words, AT is an antecedent affecting a user’s behavioral intention to adopt ERS. Since it was also confirmed earlier that Malaysian youths show a positive sentiment towards ERS, it can be expected that they have a good behavioral intention to adopt ERS. Organizations intending to launch an ERS solution should supplement its deployment with a prelaunch marketing campaign to create positive AT in the target market.
H3 was supported (see Table 12), suggesting that SN significantly affects BI. SN was defined as the level of approval by important others [53,54,82], and the decision to use or adopt a technology can be influenced by the social circle of the individual or user—for example, family members, peers within organizations or institutions, and friends that have been exposed to or experienced the behavior of interest, i.e., using such technology. SN was used to investigate whether peer approval, management perception, and social pressure from friends or families influenced adoption readiness for ERS. This finding is similar to previous studies [69,70,71]. Since the hypothesis is supported in this study, it highlights the importance of shaping positive perceptions towards ERS across society, as this would ensure that the various important others among young people have a positive attitude towards ERS and thus influence positively the young people’s beliefs about using ERS. This is consistent with observations made by [52,71,109] on the widespread technological advancements and diffusion of AR and VR technologies. [109] highlight that knowledge and information about AR and VR have been widely promoted, leading to good social norms generally. Therefore, it can be deduced that ERS practitioners should encourage the widespread sharing of information and knowledge on their ERS to affect good SN, which would in turn lead to good levels of behavioral intention to adopt ERS among the youth.
Next, H4 was supported (see Table 12), suggesting that PBC significantly affects BI. PBC was defined as an individual’s ability to implement adoption by themselves [68,69,70]. The individual’s ability will be influenced by the complexity of the technology, financial ability, and trialability depending on the user’s knowledge and capacity to adopt the technology [69,70]. This aligns with previous studies that show significant results for PBC as a determinant of technology adoption [52,68]. Therefore, if young individuals believe that they possess the skills and autonomy to make decisions regarding the use or adoption of ERS, the probability of them forming the intention to readily adopt ERS would be greater. Furthermore, prior research has indicated that even when a technology is intricate, individuals are more inclined to adopt it if they have the confidence and competence to master it [68]. ERS can be considered as an example of a rather complex technology, given the various modalities and advancements in AI that might be applied to create particular ERS. However, if the knowledge and information relating to ERS are presented in an accessible manner, it would be possible to create positive perceptions towards the feasibility of mastering the technology; this will then generate positive PBC and ultimately good intention for adoption. In other words, with enough support, resources, and encouragement, one can enhance the individual’s ability to use the technology and accelerate the adoption rate.
The final direct relationship tested, H5, was supported (see Table 12), suggesting that AW significantly affects BI. This is aligned with prior studies investigating AW as one of the key factors affecting intention [61,62,72,73,74,75]. Since the results confirm the determinacy of AW towards BI, it is advisable for ERS practitioners to further emphasize the development of new ERS applications and incorporate plans to share information about their innovations. This approach can help to promote higher levels of adoption readiness among users. According to Table 6, the mean score for AW is 4.569. This suggests that the sample’s AW is not particularly high; thus, more information on ERS needs to be disseminated in order to increase the AW level.
In this study, one moderation hypothesis, H6: TA × FC -> BI (as shown in Table 12), was found to be supported. Figure 5 illustrates a slope analysis, which reveals a relationship between the high TA group and low TA group with respect to FC and its impact on BI. High levels of TA are associated with a positive inclination towards adopting ERS, provided that there is sufficient infrastructure in place. On the other hand, individuals with low TA are less likely to embrace ERS, even in the presence of robust infrastructure and policies. This aligns with the earlier definition of TA and its categorization within the Diffusion of Innovation (DOI) framework [110]. The late majority and laggards are often resistant to new technologies due to various factors, such as perceiving a minimal impact on their lives or a preference for traditional methods [110]. In the context of this study, the findings suggest that individuals with low TA do not see ERS as having a significant impact on their daily lives, making them less inclined to adopt the technology. However, if initiatives focusing on FC, like targeted training programs and infrastructure support for ERS, are implemented, the low TA group might transition towards the high TA category, as depicted in Figure 5. Consequently, the low TA group could potentially embrace the technology and use it in line with the intended purposes envisioned by ERS creators.
6. Conclusions
Arguably, this study has generated valuable insights. To emphasize these, the final section will address the implications for various stakeholders, including policymakers, technology developers, and society.
6.1. Technology Developers
For technology developers, such as engineers, scientists, and researchers, the findings and discussions in this study offer valuable insights into the factors that can boost the adoption rate among potential users, helping them to design more user-friendly and accessible technologies.
Over the last decade, researchers have been actively interested in developing ERS for AI, which has led to an increasing trend in ERS. Since the early 2000s, the development of AC by [9] has shown the potential of cognitive computing, which has led to the development of automated emotion recognition within AI. The potential of this technology has garnered interest and attention from researchers and engineers, who have developed more such systems and identified the potential applications as well as compatibility with numerous technological advancements. However, based on the research gaps noted earlier, and based on the systematic literature review that has been conducted, there is a limited number of studies related to ERS user readiness. Therefore, insight into the user’s perspective on whether ERS will be beneficial and impactful to them is needed. Specifically, this study narrowed down the focus further by studying Malaysian youth. It is evident that the attitudes of Malaysian youth will not pose a challenge for engineers and practitioners, as Malaysian youth have expressed positive sentiments towards ERS and its AI applications in their daily lives. The developers should exploit this by engaging young people in the design and development phases to obtain good insights and ensure an excellent problem–solution fit in the solutions created. Furthermore, given their positive sentiments, developers should engage young people as a group that can advocate for and influence the acceptance of ERS amongst other groups in society. Providing early access to new ERS solutions to young people could create a wave of positive testimonials that would then encourage others to adopt any new solutions.
6.2. Policymakers
For policymakers, especially the Malaysian government, the results and discussions presented in this study align with the government’s efforts to enhance policies and support technological advancement within the country. These insights can guide the development and refinement of policies aimed at fostering technological progress.
Technological advancements have become a major factor determining the socioeconomic growth of a nation and its citizens. Locally, in Malaysia, the importance of leveraging IR 4.0’s technological advancements has been highlighted by the Malaysian government to ensure that Malaysian citizens keep up with technological advancements. This was highlighted in the National IR 4.0 Policy introduced on 5 July 2021. In addition, the Ministry of Science, Technology, and Innovations (MoSTI) introduced the Malaysia National AI Roadmap 2021–2025, which encourages the adoption of AI technologies and proposes a series of adoption strategies for Malaysian citizens. Thus, based on the findings of this study, it is recommended that these policies and the initiatives formulated for their implementation be further enhanced with specifications addressing the potential and deployment of ERS.
There is the potential for stakeholders to be concerned about the ethical, privacy, and security implications arising from the implementation of ERS [111]. Thus, there should be a policy framework that provides clearer guidelines to allow practitioners and society to benefit from the technology whilst mitigating any potential risks.
Since H1 was not supported, the policy specificity regarding ERS is not yet readily available. Nevertheless, this should be viewed as an opportunity. It suggests that the provision of targeted programs and training initiatives may potentially boost adoption [112]. Hence, there are some initiatives specifically related to ERS that can be considered to promote its adoption and integration among Malaysian youth. Users may come to believe that with comprehensive training and program offerings, along with inclusive policies for ERS, their perspectives on ERS can be positively influenced, thereby fostering greater acceptance and readiness for adoption. Furthermore, through such interventions, it would be possible to boost awareness amongst the community, promote positive attitudes towards ERS, and minimize any potential resistance due to either ethical, safety, or privacy concerns.
6.3. Society
The advent of the technological breakthrough that is artificial intelligence has catalyzed a transformative shift in global society. A growing number of individuals have embraced these technological advancements. Moreover, the global emergence of Society 5.0, originally introduced by the Japanese government, underscores the convergence of cyberspace and physical space. This paradigm emphasizes achieving a harmonious equilibrium between economic progress and addressing societal challenges [113]. The concept of Society 5.0, as delineated in previous studies [113], seeks to reconfigure the dynamic between technology and society, as well as the technology-mediated relationships between individuals and society at large. Consequently, the people-centric direction advocated for by Society 5.0 has gained global traction and is perceived as a prospective trajectory for societies worldwide. This approach transcends barriers of gender, age, and ethnic background, positioning itself as a universal aspiration for societies across the globe.
Since ERS has strong potential to enhance human–computer interaction [114], it also can be seen as a major enabler for Society 5.0. In this context, ERS can be seen as having a pivotal role among the technologies facilitating enhanced interaction between AI and humans. ERS’s ability to recognize human emotions positions it as a significant component of this technological landscape. Consequently, this study has contributed valuable insights by gauging young people’s readiness to embrace ERS as part of this transformative journey.
Towards society as a whole, the insights from this study are instrumental in preparing individuals for the potential technological advancements that will become an integral part of daily life. Understanding these factors and trends is crucial in ensuring that individuals can readily embrace and benefit from evolving technologies. Leveraging this relationship would ensure that Malaysian youth remain attuned to technological advancements and do not fall behind, aligning with the overarching vision of Malaysia 5.0. Moreover, it is essential to recognize that today’s youth are poised to be the builders of the envisioned Malaysia 5.0 in the future. It is important to raise awareness among Malaysian youth regarding recent technological advancements such as ERS, as it can contribute to the development and realization of smart societies, as exemplified by Malaysia 5.0. The establishment of IR 4.0 technology hubs in Malaysia can engage and prepare young people for their pivotal role in shaping the direction of technology usage. A hub focusing on emotion AI or ERS technologies would help to promote the development and diffusion of the technologies and help to affect a harmonious Society 5.0.
6.4. Future Research
Next, building on this study, future research should explore additional antecedents for ERS adoption readiness, specifically focusing on cultural differences and personal experiences that could impact users’ willingness to adopt a certain technology. Moreover, research on negative factors or barriers to ERS adoption would lead to deeper insights that would benefit ERS stakeholders. Another important area for future study on ERS is related to the ethical concerns of the technology itself. The ethical implications of ERS may vary based on cultural differences and personal experiences, especially in sensitive areas such as privacy invasion or the potential misuse of emotional data. Lastly, future studies may explore users’ perceptions of the security measures for ERS, as well as their concerns about the storage and handling of emotion-related data. Specifically, it is necessary to gauge whether strong security and privacy protections enhance adoption. By addressing these areas in future research, a more comprehensive understanding of the factors influencing ERS adoption and its ethical, security, and privacy dimensions can be achieved. This knowledge will be valuable for both researchers and policymakers in shaping the future of ERS technology.
This study was subject to the constraints of a cross-sectional design, highlighting the need for more extensive research using a longitudinal study approach. Long-term observations are essential in identifying transitions in individuals’ perceptions towards technology adoption over time. Moreover, this study’s scope was primarily focused on Malaysian youth, as indicated by the characteristics of the purposive sampling approach. Future researchers can expand the scope of the study by including industries and businesses willing to integrate ERS. Exploring their perspectives could be instrumental in shaping technology adoption within industries and making them more resilient to technological advancements. Additionally, the study’s scope could be broadened by conducting future research across various age groups, considering them as potential individual users of ERS. Different age groups may have varying perceptions regarding the importance of adopting and using technologies. Therefore, future research should encompass a wider age range and explore the various potential applications of ERS, leading to diverse insights that can aid ERS practitioners in creating technology that is more widely adopted throughout society.
Author Contributions
Conceptualization, M.N.M.Y., K.A.A., T.G.S. and N.A.A.A.; methodology, K.A.A. and M.N.M.Y.; software, M.N.M.Y.; validation, K.A.A. and N.A.A.A.; formal analysis, M.N.M.Y.; investigation, M.N.M.Y.; resources, K.A.A. and M.N.M.Y.; data curation, M.N.M.Y.; writing—original draft preparation, M.N.M.Y.; writing—review and editing, K.A.A. and N.A.A.A.; visualization, M.N.M.Y.; supervision, K.A.A. and T.G.S.; project administration, N.A.A.A.; funding acquisition, N.A.A.A. All authors have read and agreed to the published version of the manuscript.
Funding
This research was funded by Telekom Malaysia Research and Development Sdn. Bhd., (Grant Code: MMUE/190010). The APC was funded by Multimedia University.
Institutional Review Board Statement
The study was conducted and approved by the Institutional Review Board (or Ethics Committee) of Multimedia University (EA0742022, 23 December 2022).
Informed Consent Statement
Informed consent was obtained from all subjects involved in this study.
Data Availability Statement
Data supporting the literature review results, Figure 1 (https://link.lens.org/MjQS1wQaWkj) accessed on 10 June 2023, and others are included in the additional notes. Furthermore, the data presented in this study are available on request from the corresponding author. The data are not publicly available as the consent provided by subjects did not include publicly archived datasets.
Acknowledgments
The authors express their appreciation to the students, academics, and youth societies who assisted in the data collection process and consented to be involved in the study, and additionally to the reviewers for their constructive feedback.
Conflicts of Interest
The authors declare no conflict of interest.
References
- Choung, H.; David, P.; Ross, A. Trust in AI and Its Role in the Acceptance of AI Technologies. Int. J. Hum. -Comput. Interact. 2022, 39, 1727–1739. [Google Scholar] [CrossRef]
- Thiebes, S.; Lins, S.; Sunyaev, A. Trustworthy artificial intelligence. Electron. Mark. 2021, 31, 447–464. [Google Scholar] [CrossRef]
- Krafft, P.M.; Young, M.; Katell, M.; Huang, K.; Bugingo, G. Defining AI in policy versus practice. In Proceedings of the AIES 2020—AAAI/ACM Conference on AI, Ethics, and Society, New York, NY, USA, 7–9 February 2020; pp. 72–78. [Google Scholar] [CrossRef]
- Nishant, R.; Kennedy, M.; Corbett, J. Artificial intelligence for sustainability: Challenges, opportunities, and a research agenda. Int. J. Inf. Manag. 2020, 53, 102104. [Google Scholar] [CrossRef]
- Ghobakhloo, M. Industry 4.0, digitization, and opportunities for sustainability. J. Clean. Prod. 2020, 252, 119869. [Google Scholar] [CrossRef]
- Yoshitomi, Y. Human–computer communication using recognition and synthesis of facial expression. J. Robot. Netw. Artif. Life 2021, 8, 10–13. [Google Scholar] [CrossRef]
- Sumi, K. Affective Human Computer Interaction. In Proceedings of the International Conference on Artificial Life and Robotics, Okinawa, Japan, 29–31 January 2016; Volume 21, pp. 244–248. [Google Scholar] [CrossRef]
- George, A.S.; George, A.S.H. Industrial Revolution 5.0: The Transformation of the Modern Manufacturing Process to Enable Man and Machine to Work Hand in Hand. J. Seybold Rep. 2020, 15, 214–234. [Google Scholar] [CrossRef]
- Picard, R.W. Affective Computing for HCI. In Proceedings of the 8th HCI International on Human-Computer Interaction: Ergonomics and User Interfaces, Munich, Germany, 22–26 August 1999; pp. 829–833. Available online: http://dl.acm.org/citation.cfm?id=647943.742338 (accessed on 12 January 2022).
- Kodhai, E.; Pooveswari, A.; Sharmila, P.; Ramiya, N. Literature Review on Emotion Recognition System. In Proceedings of the 2020 International Conference on System, Computation, Automation and Networking, ICSCAN, Pondicherry, India, 3–4 July 2020; pp. 18–21. [Google Scholar] [CrossRef]
- Hippe, Z.S.; Kulikowski, J.L.; Mroczek, T.; Wtorek, J. Human-Computer Systems Interaction: Backgrounds and Applications 3; Advances in Intelligent Systems and Computing; Springer: Cham, Switzerland, 2014; Volume 300, pp. 51–62. [Google Scholar] [CrossRef]
- Hasnul, M.A.; Aziz, N.A.A.; Alelyani, S.; Mohana, M.; Aziz, A.A. Electrocardiogram-Based Emotion Recognition Systems and Their Applications in Healthcare—A Review. Sensors 2021, 21, 5015. [Google Scholar] [CrossRef]
- Wang, X.; Guo, Y.; Ban, J.; Xu, Q.; Bai, C.; Liu, S. Driver emotion recognition of multiple-ECG feature fusion based on BP network and D-S evidence. IET Intell. Transp. Syst. 2020, 14, 815–824. [Google Scholar] [CrossRef]
- Putra, W.B.; Arifin, F. Real-Time Emotion Recognition System to Monitor Student’s Mood in a Classroom. J. Phys. Conf. Ser. 2019, 1413, 012021. [Google Scholar] [CrossRef]
- Bennett, S.; Maton, K.; Kervin, L. The ‘digital natives’ debate: A critical review of the evidence. Br. J. Educ. Technol. 2008, 39, 775–786. [Google Scholar] [CrossRef]
- Becker, K.; Fleming, J.; Keijsers, W. E-learning: Ageing workforce versus technology-savvy generation. Educ. Train. 2012, 54, 385–400. [Google Scholar] [CrossRef]
- Landowska, A. Uncertainty in emotion recognition. J. Inf. Commun. Ethics Soc. 2019, 17, 273–291. [Google Scholar] [CrossRef]
- Kratzwald, B.; Ilić, S.; Kraus, M.; Feuerriegel, S.; Prendinger, H. Deep learning for affective computing: Text-based emotion recognition in decision support. Decis. Support Syst. 2018, 115, 24–35. [Google Scholar] [CrossRef]
- Peres, R.S.; Jia, X.; Lee, J.; Sun, K.; Colombo, A.W.; Barata, J. Industrial Artificial Intelligence in Industry 4.0—Systematic Review, Challenges and Outlook. IEEE Access 2020, 8, 220121–220139. [Google Scholar] [CrossRef]
- Gloor, P.A.; Colladon, A.F.; Altuntas, E.; Cetinkaya, C.; Kaiser, M.F.; Ripperger, L.; Schaefer, T. Your Face Mirrors Your Deepest Beliefs—Predicting Personality and Morals through Facial Emotion Recognition. Future Internet 2022, 14, 5. [Google Scholar] [CrossRef]
- Alhalaseh, R.; Alasasfeh, S. Machine-Learning-Based Emotion Recognition System Using EEG Signals. Computers 2020, 9, 95. [Google Scholar] [CrossRef]
- Craik, A.; He, Y.; Contreras-Vidal, J.L. Deep learning for electroencephalogram (EEG) classification tasks: A review. J. Neural Eng. 2019, 16, 031001. [Google Scholar] [CrossRef]
- Fang, W.-C.; Wang, K.-Y.; Fahier, N.; Ho, Y.-L.; Huang, Y.-D. Development and Validation of an EEG-Based Real-Time Emotion Recognition System Using Edge AI Computing Platform with Convolutional Neural Network System-on-Chip Design. IEEE J. Emerg. Sel. Top. Circuits Syst. 2019, 9, 645–657. [Google Scholar] [CrossRef]
- Tong, Z.; Chen, X.; He, Z.; Tong, K.; Fang, Z.; Wang, X. Emotion Recognition Based on Photoplethysmogram and Electroencephalogram. In Proceedings of the 2018 IEEE 42nd Annual Computer Software and Applications Conference (COMPSAC), Tokyo, Japan, 23–27 July 2018; Volume 2, pp. 402–407. [Google Scholar] [CrossRef]
- Suhaimi, N.S.; Mountstephens, J.; Teo, J. EEG-Based Emotion Recognition: A State-of-the-Art Review of Current Trends and Opportunities. Comput. Intell. Neurosci. 2020, 2020, 8875426. [Google Scholar] [CrossRef]
- Udovičić, G.; Ðerek, J.; Russo, M.; Sikora, M. Wearable Emotion Recognition system based on GSR and PPG signals. In Proceedings of the MMHealth 2017—2nd International Workshop on Multimedia for Personal Health and Health Care, Co-Located with MM, Mountain View, CA, USA, 23 October 2017; pp. 53–59. [Google Scholar] [CrossRef]
- Rathour, N.; Khanam, Z.; Gehlot, A.; Singh, R.; Rashid, M.; AlGhamdi, A.S.; Alshamrani, S.S. Real-Time Facial Emotion Recognition Framework for Employees of Organizations Using Raspberry-Pi. Appl. Sci. 2021, 11, 10540. [Google Scholar] [CrossRef]
- Kundu, T.; Saravanan, C. Advancements and recent trends in emotion recognition using facial image analysis and machine learning models. In Proceedings of the International Conference on Electrical, Electronics, Communication Computer Technologies and Optimization Techniques, ICEECCOT, Mysuru, India, 15–16 December 2017; pp. 1–6. [Google Scholar] [CrossRef]
- Shinde, A.S.; Patil, V.V. Speech Emotion Recognition System: A Review. In Proceedings of the 4th International Conference on Advances in Science and Technology (ICAST, 2021), Mumbai, India, 7 May 2021. [Google Scholar] [CrossRef]
- El Ayadi, M.; Kamel, M.S.; Karray, F. Survey on speech emotion recognition: Features, classification schemes, and databases. Pattern Recognit. 2011, 44, 572–587. [Google Scholar] [CrossRef]
- Huang, Y.; Yang, J.; Liu, S.; Pan, J. Combining facial expressions and electroencephalography to enhance emotion recognition. Future Internet 2019, 11, 105. [Google Scholar] [CrossRef]
- Zucco, C.; Calabrese, B.; Agapito, G.; Guzzi, P.H.; Cannataro, M. Sentiment analysis for mining texts and social networks data: Methods and tools. WIREs Data Min. Knowl. Discov. 2020, 10, e1333. [Google Scholar] [CrossRef]
- Murthy, A.R.; Anil Kumar, K.M. A Review of Different Approaches for Detecting Emotion from Text. IOP Conf. Ser. Mater. Sci. Eng. 2021, 1110, 012009. [Google Scholar] [CrossRef]
- GeethaRamani, R.; Kumar, M.N.; Balasubramanian, L. Identification of emotions in text articles through data pre-processing and data mining techniques. In Proceedings of the 2016 International Conference on Advanced Communication Control and Computing Technologies, ICACCCT, Ramanathapuram, India, 25–27 May 2016; Volume 978, pp. 611–615. [Google Scholar] [CrossRef]
- Ortega, M.G.S.; Rodríguez, L.-F.; Gutierrez-Garcia, J.O. Towards emotion recognition from contextual information using machine learning. J. Ambient. Intell. Humaniz. Comput. 2019, 11, 3187–3207. [Google Scholar] [CrossRef]
- Atif, M.; Franzoni, V. Tell Me More: Automating Emojis Classification for Better Accessibility and Emotional Context Recognition. Future Internet 2022, 14, 142. [Google Scholar] [CrossRef]
- Bouhlal, M.; Aarika, K.; Abdelouahid, R.A.; Elfilali, S.; Benlahmar, E. Emotions recognition as innovative tool for improving students’ performance and learning approaches. Procedia Comput. Sci. 2020, 175, 597–602. [Google Scholar] [CrossRef]
- Kalyta, O.; Barmak, O.; Radiuk, P.; Krak, I. Facial Emotion Recognition for Photo and Video Surveillance Based on Machine Learning and Visual Analytics. Appl. Sci. 2023, 13, 9890. [Google Scholar] [CrossRef]
- Alghamdi, T.; Alaghband, G. SAFEPA: An Expandable Multi-Pose Facial Expressions Pain Assessment Method. Appl. Sci. 2023, 13, 7206. [Google Scholar] [CrossRef]
- Duville, M.M.; Pérez, Y.; Hugues-Gudiño, R.; Naal-Ruiz, N.E.; Alonso-Valerdi, L.M.; Ibarra-Zarate, D.I. Systematic Review: Emotion Recognition Based on Electrophysiological Patterns for Emotion Regulation Detection. Appl. Sci. 2023, 13, 6896. [Google Scholar] [CrossRef]
- Vinola, C.; Vimaladevi, K. A survey on human emotion recognition approaches, databases and applications. Electron. Lett. Comput. Vis. Image Anal. 2015, 14, 24–44. [Google Scholar] [CrossRef]
- Haridas, A.V.; Marimuthu, R.; Chakraborty, B. Emotion Recognition System for Specially Needed People with Optimized Deep Learning Algorithm. In Proceedings of the 2020 Fourth International Conference on Inventive Systems and Control (ICISC), Coimbatore, India, 8–10 January 2020. [Google Scholar] [CrossRef]
- Rößler, J.; Sun, J.; Gloor, P. Reducing Videoconferencing Fatigue through Facial Emotion Recognition. Future Internet 2021, 13, 126. [Google Scholar] [CrossRef]
- Santamaria-Granados, L.; Mendoza-Moreno, J.F.; Ramirez-Gonzalez, G. Tourist Recommender Systems Based on Emotion Recognition—A Scientometric Review. Future Internet 2021, 13, 2. [Google Scholar] [CrossRef]
- Arrais, J.P.; Laranjeira, A.; Oliveira, G.; Ribeiro, B. Deep learning in digital marketing: Brand detection and emotion recognition. Int. J. Mach. Intell. Sens. Signal Process. 2017, 2, 32. [Google Scholar] [CrossRef]
- Davis, F.D. A Technology Acceptance Model for Empirically Testing New End-User Information Systems. Ph.D. Thesis, Massachusetts Institute of Technology, Cambridge, MA, USA, 1986. Available online: https://www.researchgate.net/publication/35465050_A_Technology_Acceptance_Model_for_Empirically_Testing_New_End-User_Information_Systems (accessed on 27 October 2023).
- Ajzen, I. The theory of planned behaviour: Reactions and reflections. Psychol. Health 2011, 26, 1113–1127. [Google Scholar] [CrossRef]
- Rogers, E.M. Diffusion of Innovations; Free Press of Glencoe: New York, NY, USA, 1962. [Google Scholar]
- Venkatesh, V.; Morris, M.G.; Davis, G.B.; Davis, F.D. User Acceptance of Information Technology: Toward a Unified View. MIS Q. 2003, 27, 425–478. [Google Scholar] [CrossRef]
- Taherdoost, H. A review of technology acceptance and adoption models and theories. Procedia Manuf. 2018, 22, 960–967. [Google Scholar] [CrossRef]
- Lai, P.C. The Literature Review of Technology Adoption Models and Theories for the Novelty Technology. J. Inf. Syst. Technol. Manag. 2017, 14, 21–38. [Google Scholar] [CrossRef]
- Ramadan, Z.B.; Farah, M.F.; Mrad, M. An adapted TPB approach to consumers’ acceptance of service-delivery drones. Technol. Anal. Strat. Manag. 2016, 29, 817–828. [Google Scholar] [CrossRef]
- Knabe, A. Applying Ajzen’s Theory of Planned Behavior to a Study of Online Course Adoption in Public Relations Education. Soc. Psychol. Commons 2012, 186, 1–237. Available online: https://epublications.marquette.edu/cgi/viewcontent.cgi?article=1186&context=dissertations_mu (accessed on 17 March 2022).
- Sahin, I.; Rogers, F. Detailed Review of Rogers’ Diffusion of Innovations Theory and Educational Technology-Related Studies Based on Rogers’ Theory. Turk. Online J. Educ. Technol. 2006, 5, 14–23. [Google Scholar]
- Sartipi, F. Diffusion of Innovation Theory in the Realm of Environmental Construction. J. Constr. Mater. 2020, 1, 1–7. [Google Scholar] [CrossRef]
- Bhattacharyya, K.; Smith, N.T. Antecedents to the Success of Block Chain Technology Adoption in Manufacturing Supply Chains; ACM International Conference Proceeding Series; Association for Computing Machinery: New York, NY, USA, 2018; pp. 64–67. [Google Scholar] [CrossRef]
- Rogers, E.M.; Medina, U.E.; Rivera, M.A.; Wiley, C.J. Complex adaptive systems and the diffusion of innovations. Lead.-Edge Res. Public Sect. Innov. Struct. Dyn. Values Outcomes 2018, 10, 313–349. [Google Scholar]
- Al-Saedi, K.; Al-Emran, M.; Ramayah, T.; Abusham, E. Developing a general extended UTAUT model for M-payment adoption. Technol. Soc. 2020, 62, 101293. [Google Scholar] [CrossRef]
- Jadil, Y.; Rana, N.P.; Dwivedi, Y.K. A meta-analysis of the UTAUT model in the mobile banking literature: The moderating role of sample size and culture. J. Bus. Res. 2021, 132, 354–372. [Google Scholar] [CrossRef]
- Shang, L.W.; Siang, T.G.; Zakaria, M.H.B.; Emran, M.H. Mobile augmented reality applications for heritage preservation in UNESCO world heritage sites through adopting the UTAUT model. AIP Conf. Proc. 2017, 1830, 030003. [Google Scholar] [CrossRef]
- Aziz, N.A.A.; Aziz, N.H.A.; Ismail, S.N.M.S.; Khan, C.M.T.; Hasnul, M.A.; Rahman, A.; Rahman, T.A.; Aziz, K.A. Awareness and Readiness of Malaysian University Students for Emotion Recognition System. Int. J. Integr. Eng. 2021, 13, 299–309. [Google Scholar] [CrossRef]
- Mantello, P.; Ho, M.-T.; Nguyen, M.-H.; Vuong, Q.-H. Machines that feel: Behavioral determinants of attitude towards affect recognition technology—Upgrading technology acceptance theory with the mindsponge model. Humanit. Soc. Sci. Commun. 2023, 10, 430. [Google Scholar] [CrossRef]
- Saunders, M.; Lewis, P.; Thornhill, A. Research Methods for Business Students; Pearson Education Limited: London, UK, 2019; Volume 195. [Google Scholar]
- Venkatesh, V.; Thong, J.Y.L.; Xu, X. Unified Theory of Acceptance and Use of Technology: A Synthesis and the Road Ahead. J. Assoc. Inf. Syst. 2016, 17, 328–376. [Google Scholar] [CrossRef]
- Alkawsi, G.A.; Ali, N.; Baashar, Y. An Empirical Study of the Acceptance of IoT-Based Smart Meter in Malaysia: The Effect of Electricity-Saving Knowledge and Environmental Awareness. IEEE Access 2020, 8, 42794–42804. [Google Scholar] [CrossRef]
- Ambarwati, R.; Harja, Y.D.; Thamrin, S. The Role of Facilitating Conditions and User Habits: A Case of Indonesian Online Learning Platform. J. Asian Financ. Econ. Bus. 2020, 7, 481–489. [Google Scholar] [CrossRef]
- Giandi, O.; Irawan, I.; Ambarwati, R. Determinants of Behavior Intention and Use Behavior among Bukalapak’s Consumers. IPTEK J. Technol. Sci. 2020, 31, 158. [Google Scholar] [CrossRef]
- Alavion, S.J.; Allahyari, M.S.; Al-Rimawi, A.S.; Surujlal, J. Adoption of Agricultural E-Marketing: Application of the Theory of Planned Behavior. J. Int. Food Agribus. Mark. 2017, 29, 1–15. [Google Scholar] [CrossRef]
- Dezdar, S. Green information technology adoption: Influencing factors and extension of theory of planned behavior. Soc. Responsib. J. 2017, 13, 292–306. [Google Scholar] [CrossRef]
- Kamble, S.; Gunasekaran, A.; Arha, H. Understanding the Blockchain technology adoption in supply chains-Indian context. Int. J. Prod. Res. 2019, 57, 2009–2033. [Google Scholar] [CrossRef]
- Shang, L.; Heckelei, T.; Gerullis, M.K.; Börner, J.; Rasch, S. Adoption and diffusion of digital farming technologies—Integrating farm-level evidence and system interaction. Agric. Syst. 2021, 190, 103074. [Google Scholar] [CrossRef]
- Choi, K.; Lee, H.; Kim, Y. A Study on the performance evaluation of user awareness technology based Smart Lighting Control System for energy saving. Int. J. Smart Home 2014, 8, 1–10. [Google Scholar] [CrossRef]
- Akinnuwesi, B.A.; Uzoka, F.M.E.; Okwundu, O.S.; Fashoto, G. Exploring biometric technology adoption in a developing country context using the modified UTAUT. Int. J. Bus. Inf. Syst. 2016, 23, 482. [Google Scholar] [CrossRef]
- Ali, S.; Yan, Q.; Irfan, M.; Chen, Z. Evaluating Barriers on Biogas Technology Adoption in China: The Moderating Role of Awareness and Technology Understanding. Front. Environ. Sci. 2022, 10, 887084. [Google Scholar] [CrossRef]
- Oke, A.E.; Arowoiya, V.A. Critical barriers to augmented reality technology adoption in developing countries: A case study of Nigeria. J. Eng. Des. Technol. 2021, 20, 1320–1333. [Google Scholar] [CrossRef]
- Yamin, M.N.M.; Aziz, K.A.; Siang, T.G.; Aziz, N.A.A. Emotion Recognition System: A Proposed Framework. In Proceedings of the International Conference on Technology and Innovation Management (ICTIM 2022), Cyberjaya, Malaysia, 25–27 July 2022; Atlantis Press International BV: Amsterdam, The Netherlands, 2022; Volume 2. [Google Scholar] [CrossRef]
- Rahi, S. Research Design and Methods: A Systematic Review of Research Paradigms, Sampling Issues and Instruments Development. Int. J. Econ. Manag. Sci. 2017, 6, 403. [Google Scholar] [CrossRef]
- Faul, F.; Erdfelder, E.; Buchner, A.; Lang, A.-G. Statistical power analyses using G*Power 3.1: Tests for correlation and regression analyses. Behav. Res. Methods 2009, 41, 1149–1160. [Google Scholar] [CrossRef]
- Thompson, R.L.; Higgins, C.A.; Howell, J.M. Personal computing: Toward a conceptual model of utilization. MIS Q. 1991, 15, 125. [Google Scholar] [CrossRef]
- Batara, E.; Nurmandi, A.; Warsito, T.; Pribadi, U. Are government employees adopting local e-government transformation? The need for having the right attitude, facilitating conditions and performance expectations. Transform. Gov. People Process Policy 2017, 11, 612–638. [Google Scholar] [CrossRef]
- Vairetti, C.; González-Ramírez, R.G.; Maldonado, S.; Álvarez, C.; Voβ, S. Facilitating conditions for successful adoption of inter-organizational information systems in seaports. Transp. Res. Part A Policy Pract. 2019, 130, 333–350. [Google Scholar] [CrossRef]
- Teo, T. Examining the influence of subjective norm and facilitating conditions on the intention to use technology among pre-service teachers: A structural equation modeling of an extended technology acceptance model. Asia Pac. Educ. Rev. 2010, 11, 253–262. [Google Scholar] [CrossRef]
- Ajzen, I. TPB Questionnaire Construction Constructing a Theory of Planned Behaviour Questionnaire; University of Massachusetts Amherst: Amherst, MA, USA, 2019; pp. 1–7. Available online: http://people.umass.edu/~aizen/pdf/tpb.measurement.pdf (accessed on 24 December 2022).
- Yadav, R.; Pathak, G.S. Determinants of Consumers’ Green Purchase Behavior in a Developing Nation: Applying and Extending the Theory of Planned Behavior. Ecol. Econ. 2017, 134, 114–122. [Google Scholar] [CrossRef]
- Flowers, E.P.; Freeman, P.; Gladwell, V.F. The development of three questionnaires to assess beliefs about green exercise. Int. J. Environ. Res. Public Health 2017, 14, 1172. [Google Scholar] [CrossRef]
- Cortina, J.M. What Is Coefficient Alpha? An Examination of Theory and Applications. J. Appl. Psychol. 1993, 78, 98–104. [Google Scholar] [CrossRef]
- Streiner, D.L. Starting at the beginning: An introduction to coefficient alpha and internal consistency. J. Pers. Assess. 2003, 80, 99–103. [Google Scholar] [CrossRef]
- Morera, O.F.; Stokes, S.M. Coefficient α as a Measure of Test Score Reliability: Review of 3 Popular Misconceptions. Am. J. Public Health 2016, 106, 458–461. [Google Scholar] [CrossRef]
- Dash, G.; Paul, J. CB-SEM vs PLS-SEM methods for research in social sciences and technology forecasting. Technol. Forecast. Soc. Chang. 2021, 173, 121092. [Google Scholar] [CrossRef]
- Memon, M.A.; Ting, H.; Cheah, J.-H.; Thurasamy, R.; Chuah, F.; Huei Cham, T. Sample Size for Survey Research: Review and Recommendations. J. Appl. Struct. Equ. Model. 2020, 4, 2590–4221. [Google Scholar] [CrossRef]
- Hair, J.F., Jr.; Matthews, L.M.; Matthews, R.L.; Sarstedt, M. PLS-SEM or CB-SEM: Updated guidelines on which method to use. Int. J. Multivar. Data Anal. 2017, 1, 107. [Google Scholar] [CrossRef]
- Ringle, C.M.; Wende, S.; Becker, J.M. SmartPLS 4. Oststeinbek: SmartPLS. 2022. Available online: https://www.smartpls.com (accessed on 5 March 2023).
- Yaakop, A.Y.; Shi, Y.P.; Foster, B.; Saputra, J. Investigating e-wallet adoption of COVID-19 intra-period among Malaysian youths’: Integrated task-technology fit and technology acceptance model framework. Int. J. Data Netw. Sci. 2021, 5, 295–302. [Google Scholar] [CrossRef]
- Akturan, U.; Tezcan, N. Mobile banking adoption of the youth market: Perceptions and intentions. Mark. Intell. Plan. 2012, 30, 444–459. [Google Scholar] [CrossRef]
- Kline, R.B. Principles and Practice of Structural Equation Modeling; Guilford Press: New York, NY, USA, 1998. [Google Scholar]
- Orcan, F. Parametric or Non-parametric: Skewness to Test Normality for Mean Comparison. Int. J. Assess. Tools Educ. 2020, 7, 255–265. [Google Scholar] [CrossRef]
- Saif Almehairbi, K.M.S.; Jano, Z.; Mosali, N.A. Structural Relationship of Technology Adoption and Performance Factors in UAE Manufacturing Industry. Int. J. Sustain. Constr. Eng. Technol. 2022, 13, 320–337. [Google Scholar] [CrossRef]
- Sarstedt, M.; Ringle, C.M.; Hair, J.F. Partial Least Squares Structural Equation Modeling; Springer International Publishing: Cham, Switzerland, 2017. [Google Scholar] [CrossRef]
- Hair, J.F., Jr.; Hult, G.T.M.; Ringle, C.M.; Sarstedt, M.; Danks, N.P.; Ray, S. Evaluation of Reflective Measurement Models; Springer: Cham, Switzerland, 2021. [Google Scholar] [CrossRef]
- Ramayah, T.; Hwa, C.; Chuah, F.; Ting, H.; Memon, M. Partial Least Squares Structural Equation Modeling (PLS-SEM) Using SmartPLS 3.0: An Updated and Practical Guide to Statistical Analysis; Pearson: Kuala Lumpur, Malaysia, 2018. [Google Scholar]
- Fornell, C.D.; Larcker, D.F. Evaluating Structural Equation models with Unobservable Variables and Measurement Error. J. Mark. Res. 1981, 18, 39–50. [Google Scholar] [CrossRef]
- Henseler, J.; Ringle, C.M.; Sarstedt, M. A new criterion for assessing discriminant validity in variance-based structural equation modeling. J. Acad. Mark. Sci. 2015, 43, 115–135. [Google Scholar] [CrossRef]
- Ab Hamid, M.; Sami, W.; Mohmad Sidek, M.H. Discriminant Validity Assessment: Use of Fornell & Larcker criterion versus HTMT Criterion. J. Phys. Conf. Ser. 2017, 890, 012163. [Google Scholar] [CrossRef]
- Kock, N.; Lynn, G.S. Lateral Collinearity and Misleading Results in Variance-Based SEM: An Illustration and Recommendations. J. Assoc. Inf. Syst. 2012, 13, 546–580. [Google Scholar] [CrossRef]
- Sullivan, G.M.; Feinn, R. Using Effect Size-or Why the P Value Is Not Enough. J. Grad. Med. Educ. 2012, 4, 279–282. [Google Scholar] [CrossRef]
- Cohen, J. Statistical Power Analysis for the Behavioral Sciences, 2nd ed.; Erlbaum: Hillsdale, NJ, USA, 1988. [Google Scholar]
- Hu, L.T.; Bentler, P.M. Cutoff criteria for fit indexes in covariance structure analysis: Conventional criteria versus new alternatives. Struct. Equ. Model. Multidiscip. J. 1999, 6, 1–55. [Google Scholar] [CrossRef]
- Sohn, K.; Kwon, O. Technology acceptance theories and factors influencing artificial Intelligence-based intelligent products. Telemat. Inform. 2020, 47, 101324. [Google Scholar] [CrossRef]
- Xiong, J.; Hsiang, E.-L.; He, Z.; Zhan, T.; Wu, S.-T. Augmented reality and virtual reality displays: Emerging technologies and future perspectives. Light Sci. Appl. 2021, 10, 216. [Google Scholar] [CrossRef] [PubMed]
- Woodcock, A. Late adopters and laggards: Should we care? Int. J. Des. Manag. Prof. Pract. 2014, 7, 53–61. Available online: http://ijgmpp.cgpublisher.com/product/pub.239/prod.46 (accessed on 10 October 2023). [CrossRef]
- Deshpande, A.; Sharp, H. Responsible AI Systems: Who are the Stakeholders? In Proceedings of the AIES ’22: 2022 AAAI/ACM Conference on AI, Ethics, and Society, Oxford, UK, 19–21 May 2021; pp. 227–236. [Google Scholar] [CrossRef]
- Pellegrini, M.; Vivanet, G. Evidence-Based Policies in Education: Initiatives and Challenges in Europe. ECNU Rev. Educ. 2021, 4, 25–45. [Google Scholar] [CrossRef]
- Deguchi, A.; Hirai, C.; Matsuoka, H.; Nakano, T.; Oshima, K.; Tai, M.; Tani, S. What Is Society 5.0? In Society 5.0; Springer: Singapore, 2020. [Google Scholar] [CrossRef]
- Spezialetti, M.; Placidi, G.; Rossi, S. Emotion Recognition for Human-Robot Interaction: Recent Advances and Future Perspectives. Front. Robot. AI 2020, 7, 532279. [Google Scholar] [CrossRef]
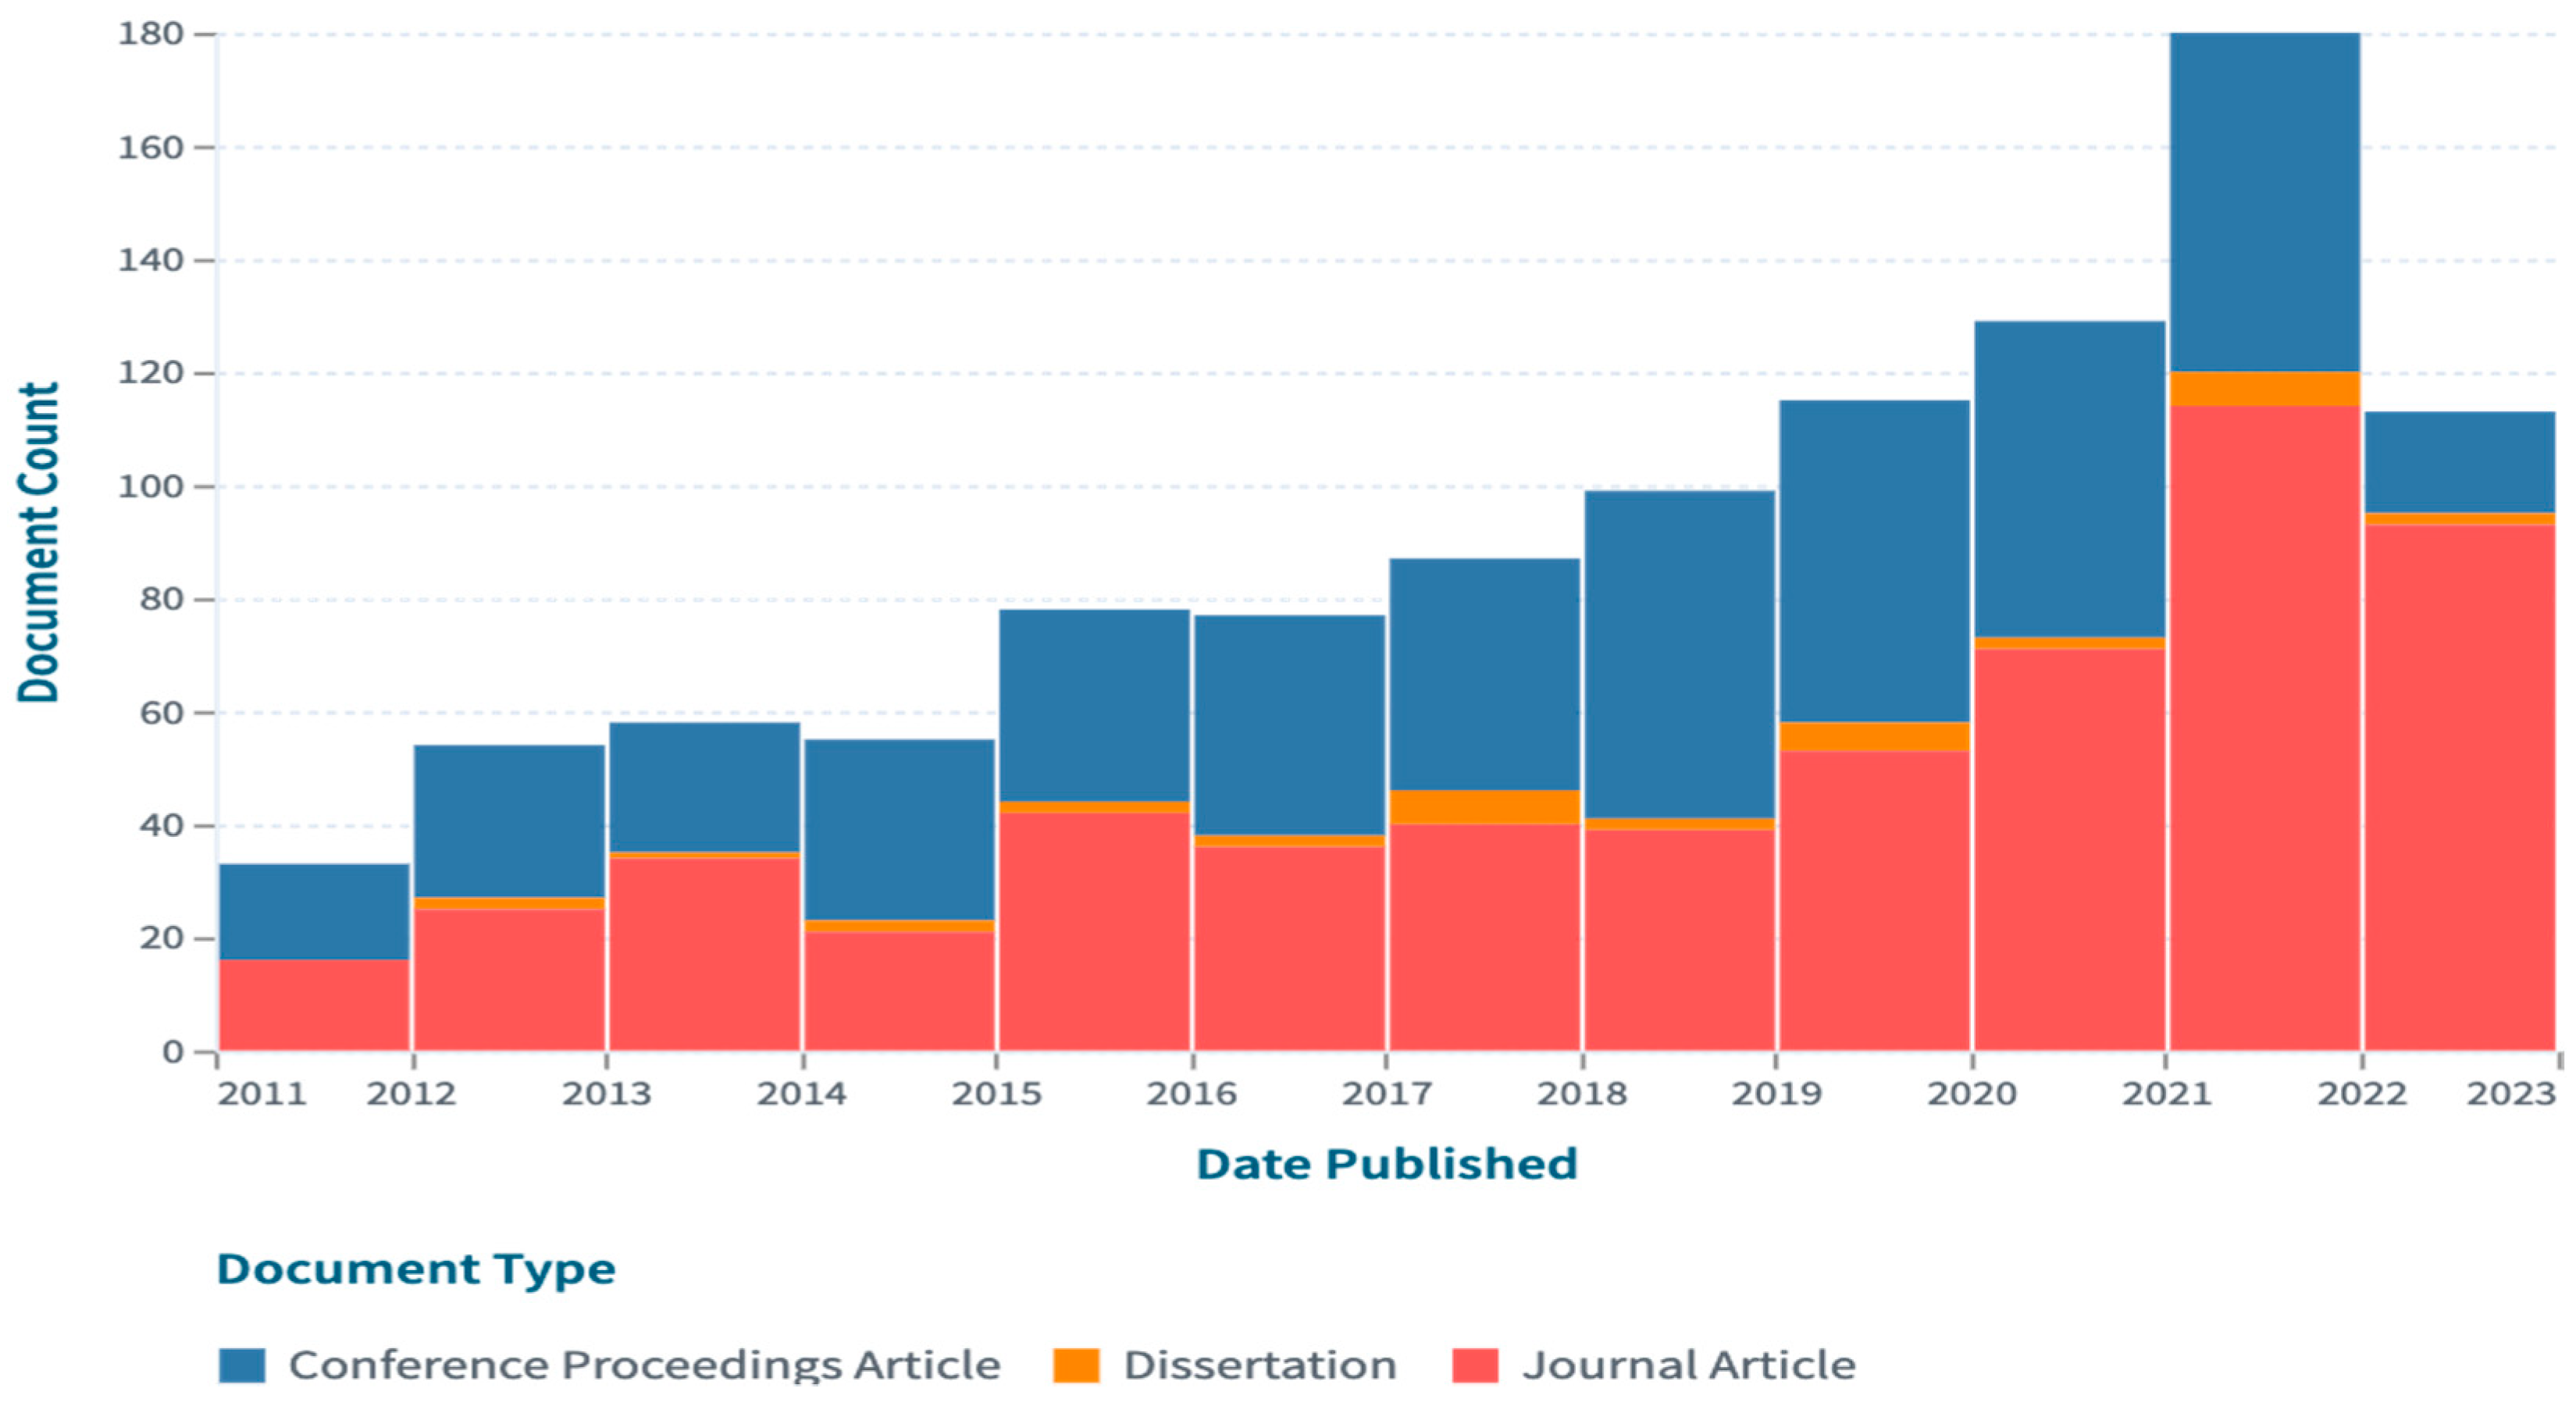
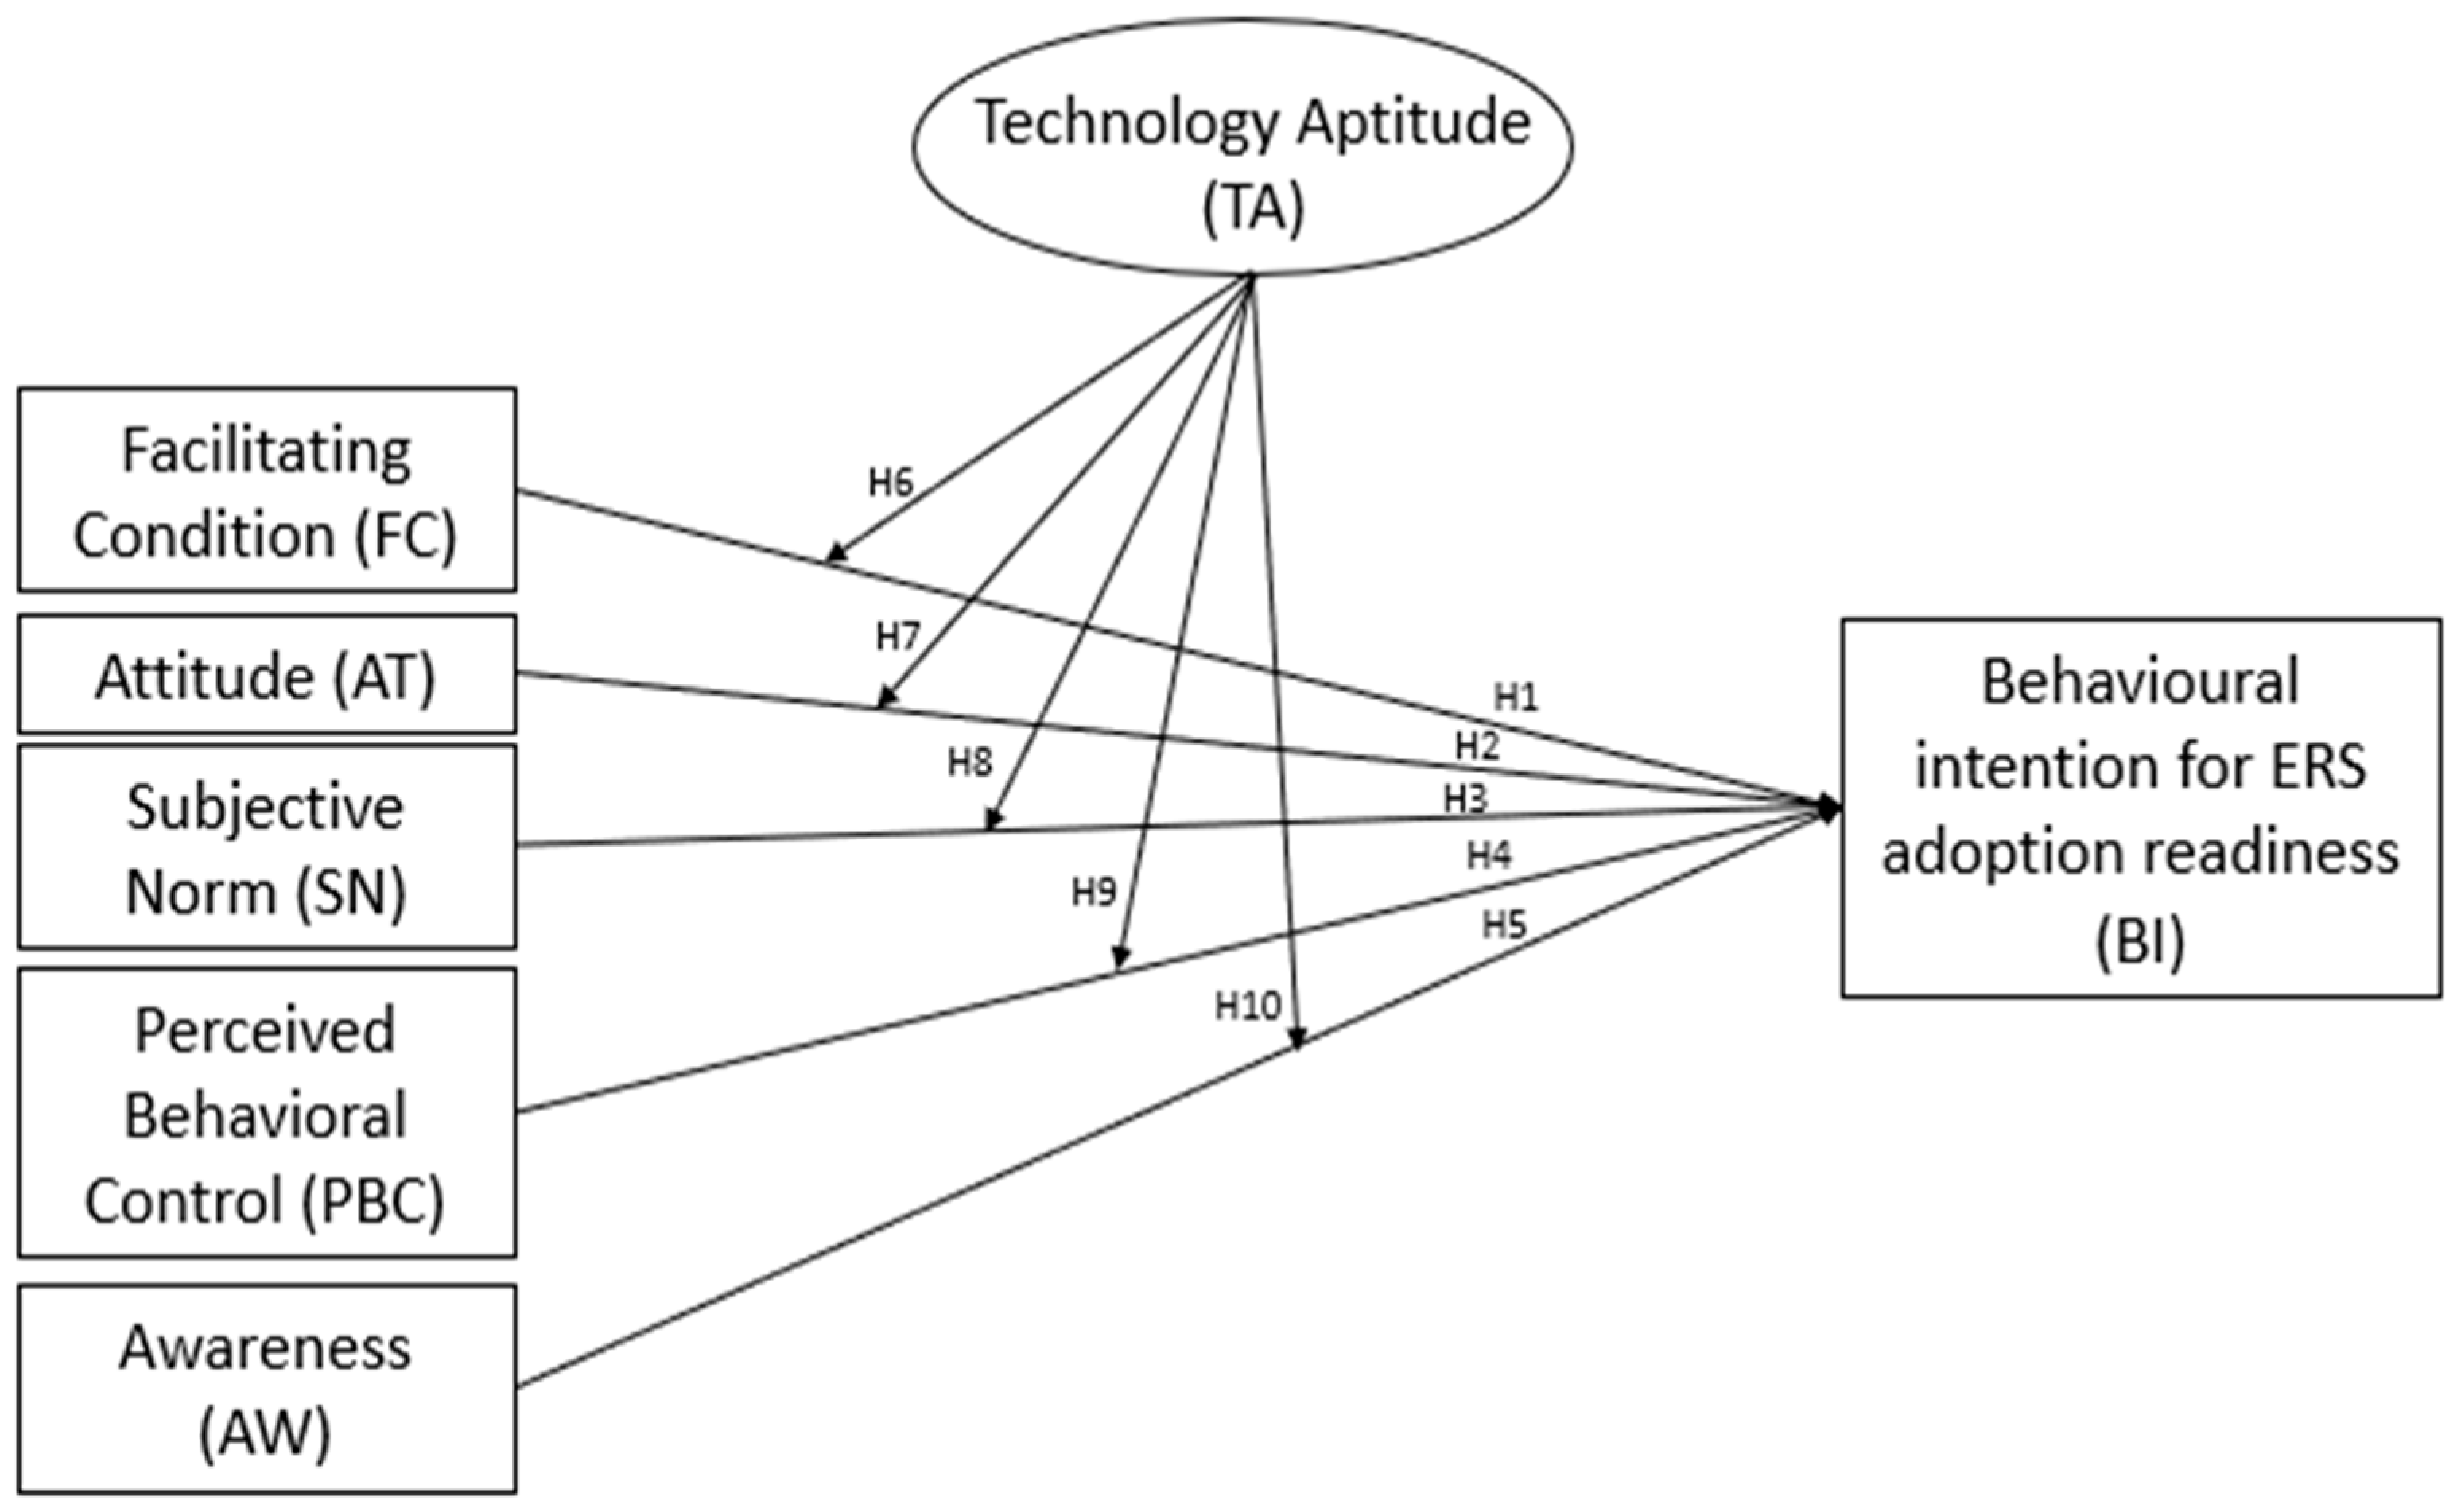
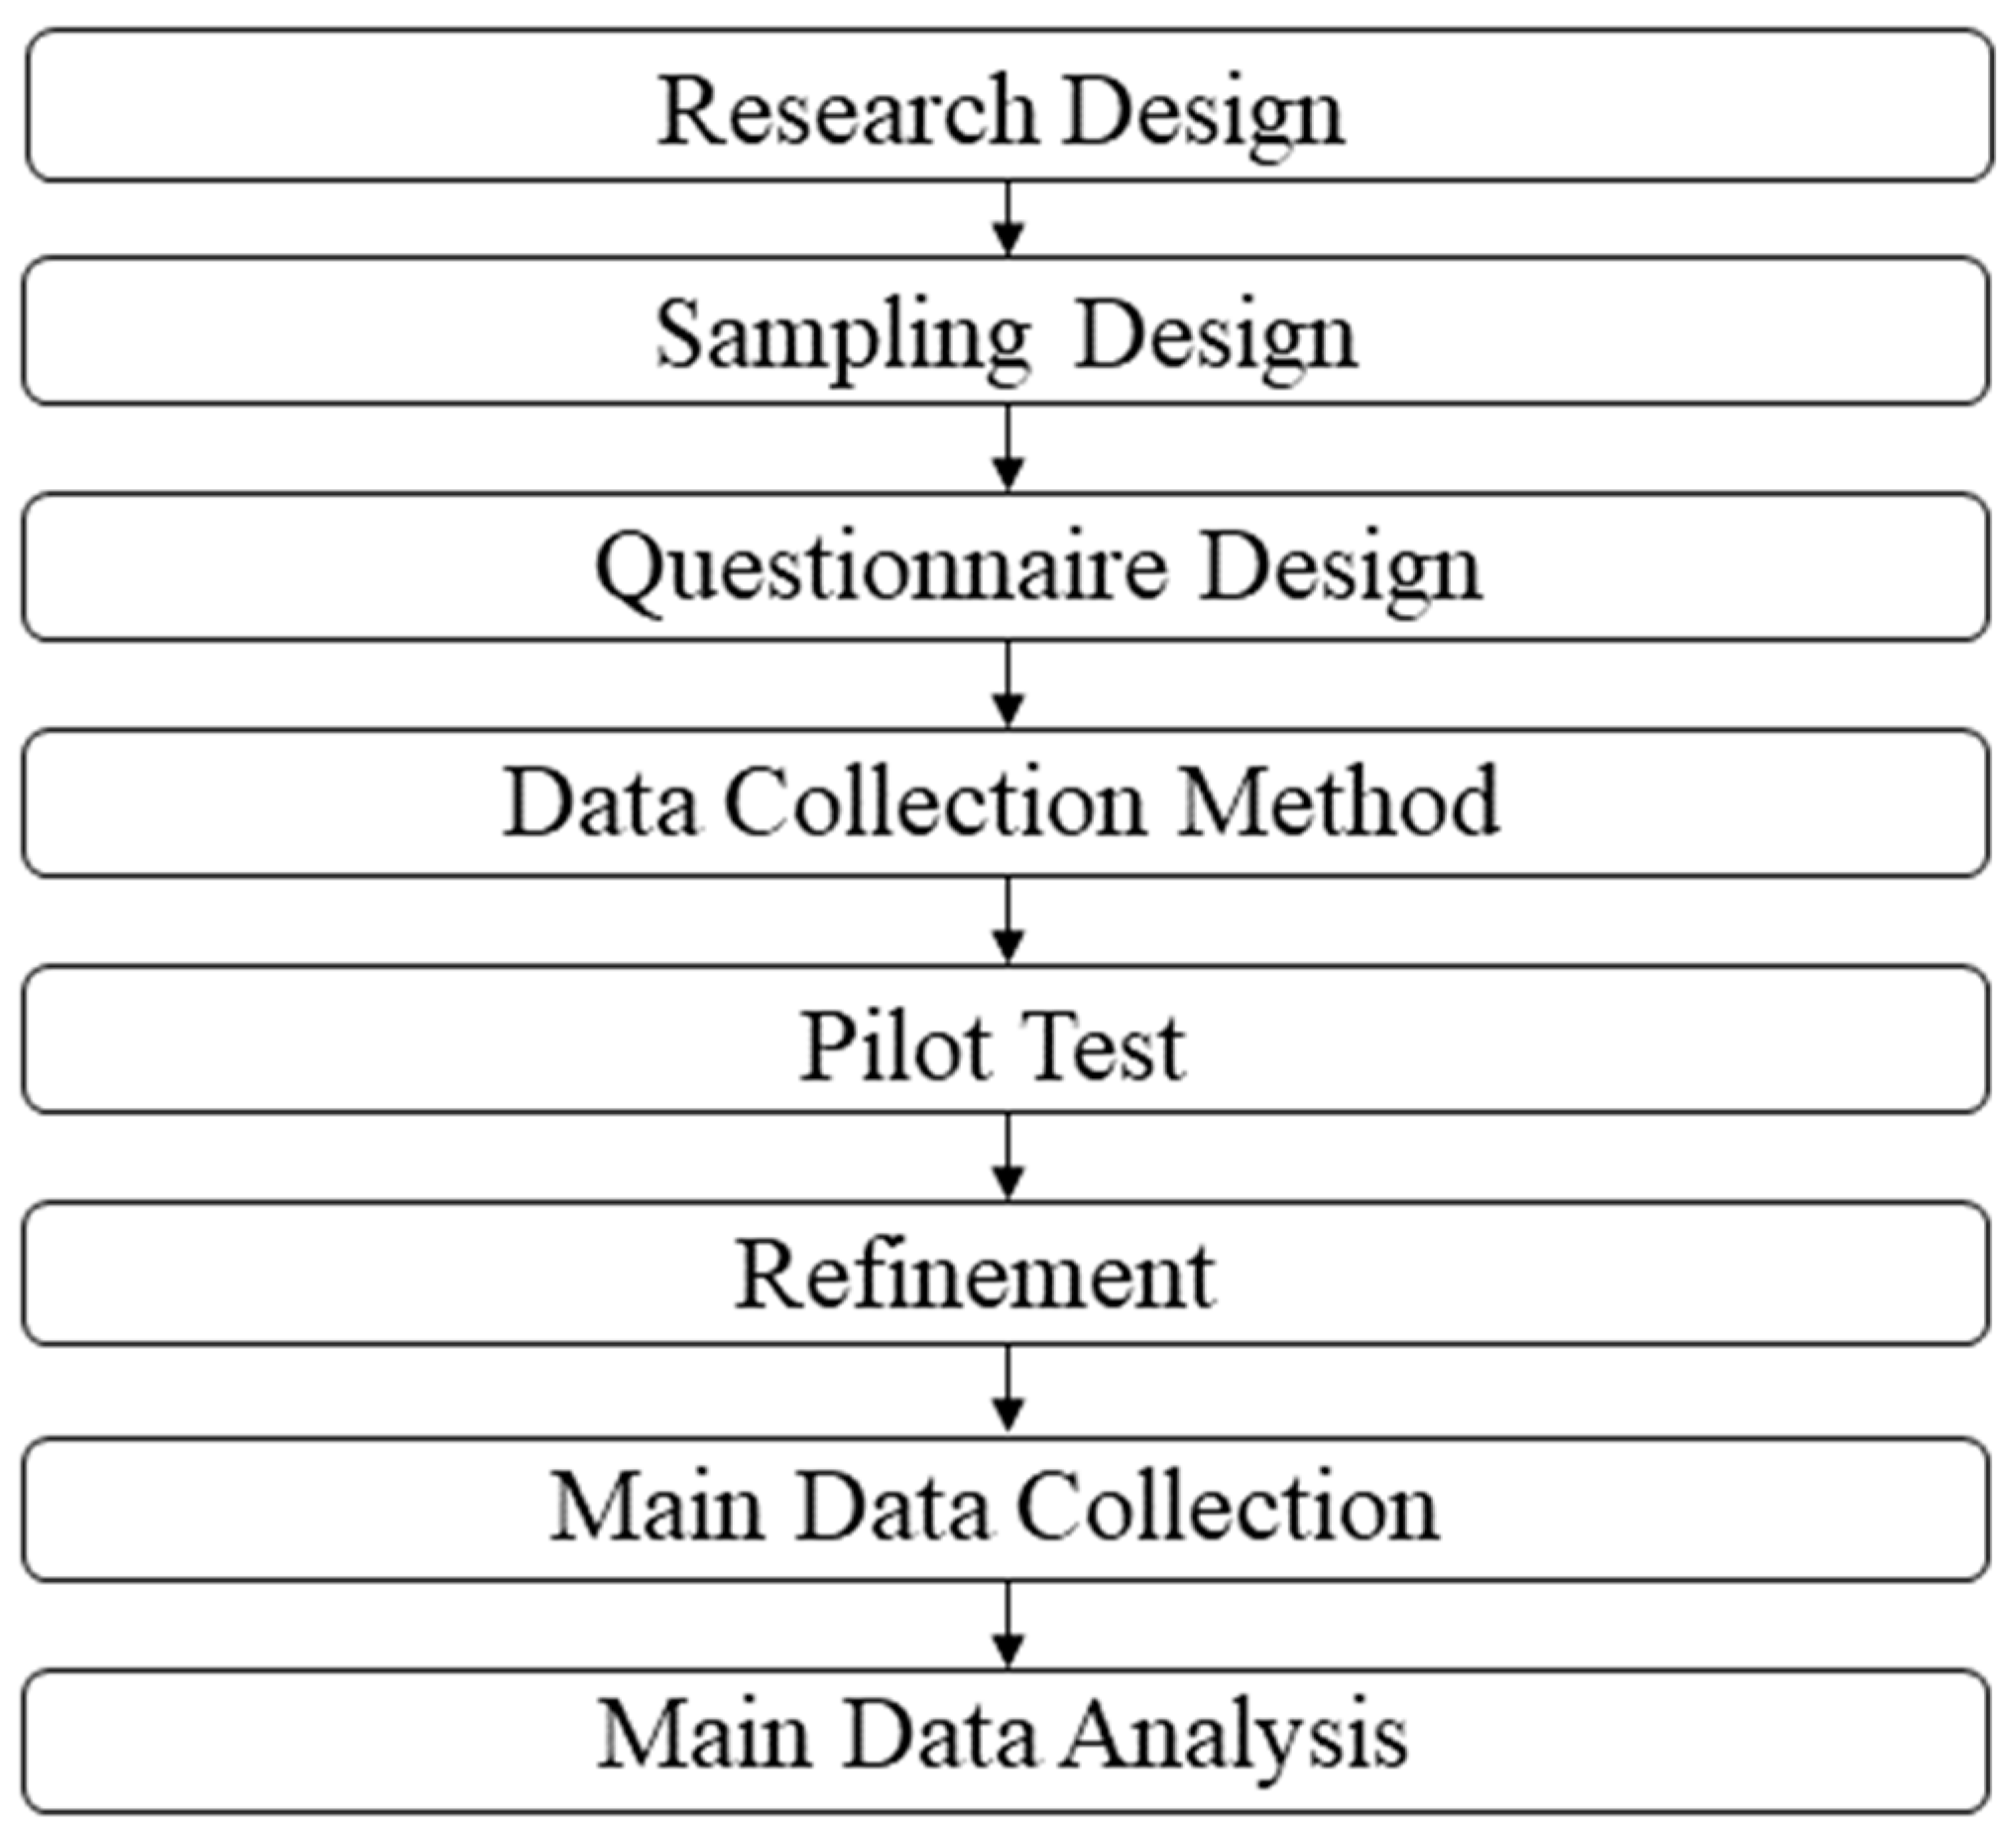


Disclaimer/Publisher’s Note: The statements, opinions and data contained in all publications are solely those of the individual author(s) and contributor(s) and not of MDPI and/or the editor(s). MDPI and/or the editor(s) disclaim responsibility for any injury to people or property resulting from any ideas, methods, instructions or products referred to in the content. |
© 2023 by the authors. Licensee MDPI, Basel, Switzerland. This article is an open access article distributed under the terms and conditions of the Creative Commons Attribution (CC BY) license (https://creativecommons.org/licenses/by/4.0/).