Abstract
The presence of Methyl Orange, a hazardous organic compound typically found in industrial wastewater, presents a significant environmental challenge, necessitating the development of effective strategies for its removal to mitigate adverse impacts on aquatic ecosystems and human health. In this work, we utilized 60-watt continuous-wave (CW) and high-power CO2 laser with 10.6 μm wavelength to synthesize Zinc Oxide nanoparticles (ZnO NPs) doped with 1% Cerium (Ce) as photocatalyst at standard laboratory conditions through Laser-Assisted Chemical Bath Synthesis (LACBS) technique. The synthesized nanostructures were thoroughly characterized using UV–vis spectroscopy, field-emission scanning electron microscopy (FESEM), and X-ray diffraction (XRD) techniques. Subsequently, their efficiency in degrading Methyl Orange (MO) dye was evaluated under UV and sunlight irradiation. The findings revealed that the 1% Ce-doped ZnO sample exhibited enhanced photocatalytic efficiency under both UV and sunlight irradiation, as well as active adsorption capabilities in the absence of light. Notably, the most effective photodegradation performance was achieved under solar radiation, with an impressive 95% of MO dye degradation observed after just 90 min of exposure.
1. Introduction
Water pollution due to organic dyes has been a global phenomenon. For the past five decades, a considerable quantity of organic dye pollutants, including Methyl Orange (MO), has been discharged into the natural environment, including water bodies. MO, as a prevalent synthetic dye, finds extensive application in numerous industries such as textiles, paper manufacturing, plastics, and cosmetics, substantially impacting both human life and the biosphere [1]. Numerous methodologies have been utilized to remediate effluents containing pollutants. However, these conventional approaches often generate secondary waste products that require additional treatment [2]. In recent years, significant attention has been directed toward the photodegradation of organic dyes employing semiconducting nanoparticles (NPs) through photoexcited electron–hole pairs, with semiconductors like TiO2 and Zinc Oxide (ZnO) under the influence of light [3]. This method has garnered substantial interest owing to its manifold benefits [2].
ZnO is a prominent metal oxide semiconductor characterized by its substantial direct band gap of 3.37 eV, a high binding energy of 60 meV, and remarkable thermal and chemical stability [4]. The photogenerated holes in ZnO exhibit strong oxidizing capabilities, attributed to their valence band (VB) position, enabling effective degradation of a wide range of organic dye compounds, making it a valuable component in wastewater treatment for environmental remediation [5]. Additionally, ZnO nanoparticles (ZnO NPs) have been extensively investigated due to the beneficial effects of nano-crystallization on the physical and optical properties of water treatment processes [6]. This has further contributed to the widespread exploration and application of ZnO NPs in various environmental purification efforts. Various methodologies have been utilized to augment the photocatalytic activity of ZnO. One well-known approach involves the introduction of specific cations through doping, which can create trapping sites for photogenerated charge carriers, leading to a reduction in the recombination rate of electron–hole pairs. Additionally, doping ZnO with transition and rare earth metals has been found to be a beneficial and feasible means of achieving a delicate equilibrium between enhanced chemical stability and favorable physical properties [7].
Cerium (Ce), a rare earth element, serves as an effective dopant capable of creating trapping sites for photogenerated charge carriers. Beyond its advantageous attributes of being cost-effective, low in toxicity, and environmentally friendly, Ce finds application as an oxygen storage promoter, leading to a reduction in the recombination rate of electron–hole pairs and the narrowing of the band gap through the generation of additional energy levels [8,9]. Typically, such dopants are integrated into the ZnO matrix, occupying either substitutional or interstitial sites. This strategic inclusion of dopants has yielded a broader absorption range and improved light utilization, culminating in a notable enhancement of the overall photocatalytic performance [10,11]. A variety of techniques, including the sol–gel spin-coating method, spray pyrolysis, hydrothermal synthesis, RF magnetron sputtering, pulse laser deposition, and other approaches, have been employed to synthesize Ce-doped ZnO (ZnO:Ce) nanorods. For instance, a study focused on the photodegradation capabilities of ZnO:Ce nanorods and the effects of Ce doping on the optical, structural, and electronic properties of ZnO rods was reported [12]. The results highlighted that ZnO:Ce nanorods exhibit dependable photocatalytic activity under solar-light irradiation. Interestingly, it was also elsewhere demonstrated that the synthesis of highly efficient Ce-doped ZnO nanorods as photocatalyst samples exhibited superior photocatalytic performance compared to pure ZnO nanorods [13]. On the other hand, ZnO and Ce-doped ZnO materials grown on glass substrates were also fabricated using the sol–gel method, spin coating, and water bath growth techniques. Subsequently, to achieve a rapid, facile, and high-yield production of Ce-doped ZnO NPs for photocatalytic degradation, the solution combustion approach was employed. Remarkably, the optimal Ce concentration (3.28%) demonstrated significant photocatalytic degradation efficiency (99.5%) after a reaction time of 70 min [14].
The investigation of Ce-doped ZnO nanomaterials for their photocatalytic capacity in degrading organic pollutants has been relatively limited, as evident from the available literature. Furthermore, the existing preparation methods often entail elevated temperatures, prolonged reaction durations, and toxic organic solvents and chemicals, posing environmental risks. Therefore, there is a critical need to explore alternative methodologies that are cost-effective, environmentally benign, non-toxic, and devoid of chemical hazards [15]. This study presents a novel investigation of 1% Ce-doped ZnO as a photocatalytic system fabricated utilizing a high-power CW CO2 laser. Notably, this laser-based technique is particularly intriguing for its energy efficiency, ease of handling, cost-effectiveness, and capacity to operate at room temperature to prepare Ce:ZnO NPs. The advantages of this approach lie in its rapid, straightforward, and facile synthesis process, yielding well-crystalline products with excellent structural and optical characteristics. The produced Ce-doped ZnO NPs were thoroughly characterized using various techniques, and their potential application as photocatalysts for degrading MO in aqueous wastewater solutions was investigated under both UV and solar-light irradiation. Consequently, the study delved into assessing degradation effectiveness, photothermal and decomposition effects, and the influence of laser energy. Additionally, the investigation encompassed a comprehensive analysis of the process kinetics and isotherms associated with the degradation process.
2. Materials and Methods
2.1. Material
All chemicals, including hexamethylenetetramine HMTA (C6H12N4), zinc acetate dehydrate (Zn(CH3COO)2·2H2O), as well as cerium (III) nitrate hexahydrate (Ce(NO3)3·6H2O) of molecular weight 434.23 g/mol, were purchased from R&M Chemicals, Marketing, Essex, UK, with purity 99.9%. Meanwhile, MO dye powder (C14H14N3NaO3S) of molecular weight 327.33 gm/mol was purchased from Junsei Chemicals, Tokyo, Japan.
2.2. Synthesis of Ce-Doped ZnO Nanoparticles by CO2 Laser
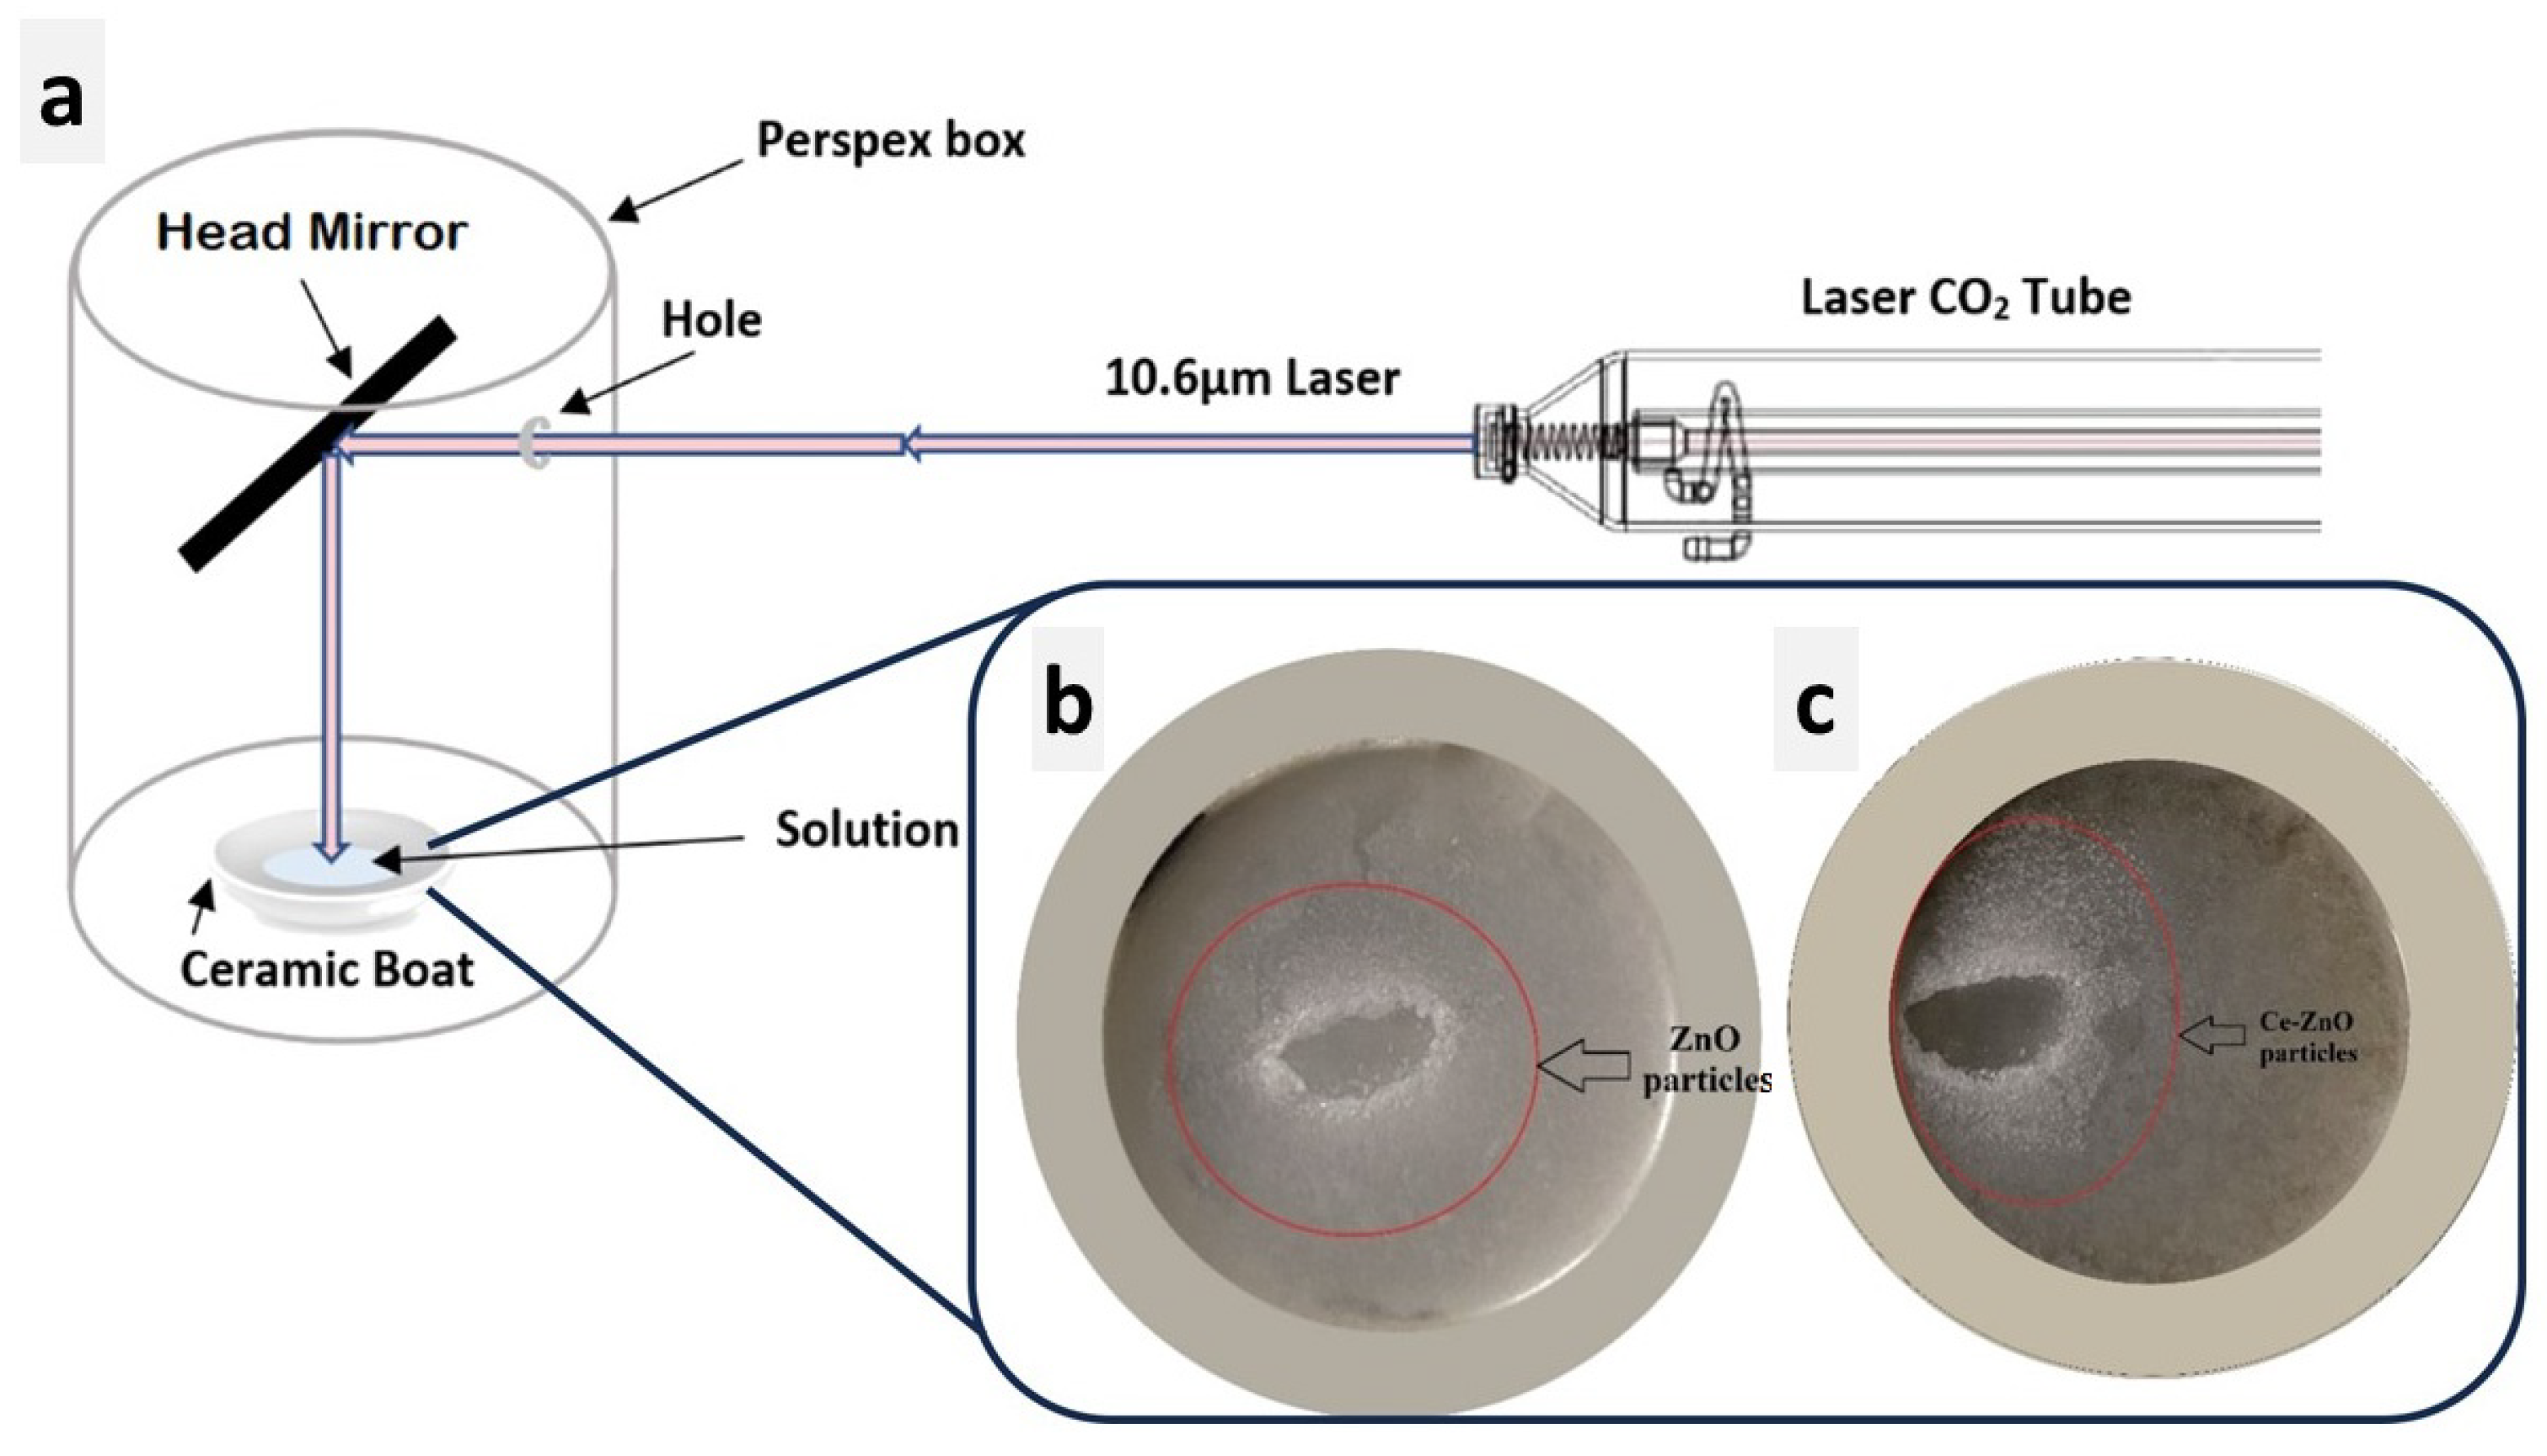
Figure 1 presents a schematic representation of the typical setup employed for generating the Laser-Assisted Chemical Bath Synthesis (LACBS) technique using a CO2 laser. The laser operates at a wavelength of 10.6 μm with a power output of 60 watts. Notably, a concave mirror is strategically positioned to focus the laser beam, which is directed at an inclined angle towards the solution under test, contained within a ceramic boat and isolated within a Perspex box. Subsequently, the solution, comprising undoped ZnO (preparation is in Section S1), undergoes irradiation for a duration of 10–15 min. The reaction occurs under atmospheric pressure and room temperature conditions, leading to the formation of ZnO nanoparticles (NPs) after approximately 10 min of irradiation [16]. The same experimental sequence is applied for the synthesis of doped ZnO, where the 1% Ce-doped ZnO NPs are produced following a similar procedure (see Section S2). The obtained ZnO and 1% Ce/ZnO powders, both with a concentration of 0.5 M, exhibited a milky-white appearance. These powders were then separated by centrifugation, followed by a thorough washing process using deionized water (DI) and ethanol to eliminate any existing impurities. Afterward, the powders were subjected to drying in an oven at 80 °C for one hour and subsequently calcined inside a furnace at 400 °C for a duration of 30 h.

Figure 1.
Schematic illustration of (a) the experimental setup featuring the CO2 laser. (b,c) Digital images depicting the formation of undoped ZnO NPs after CO2 laser irradiation inside the ceramic boat and 1% Ce/ZnO NPs, respectively.
2.3. Photocatalytic Activity
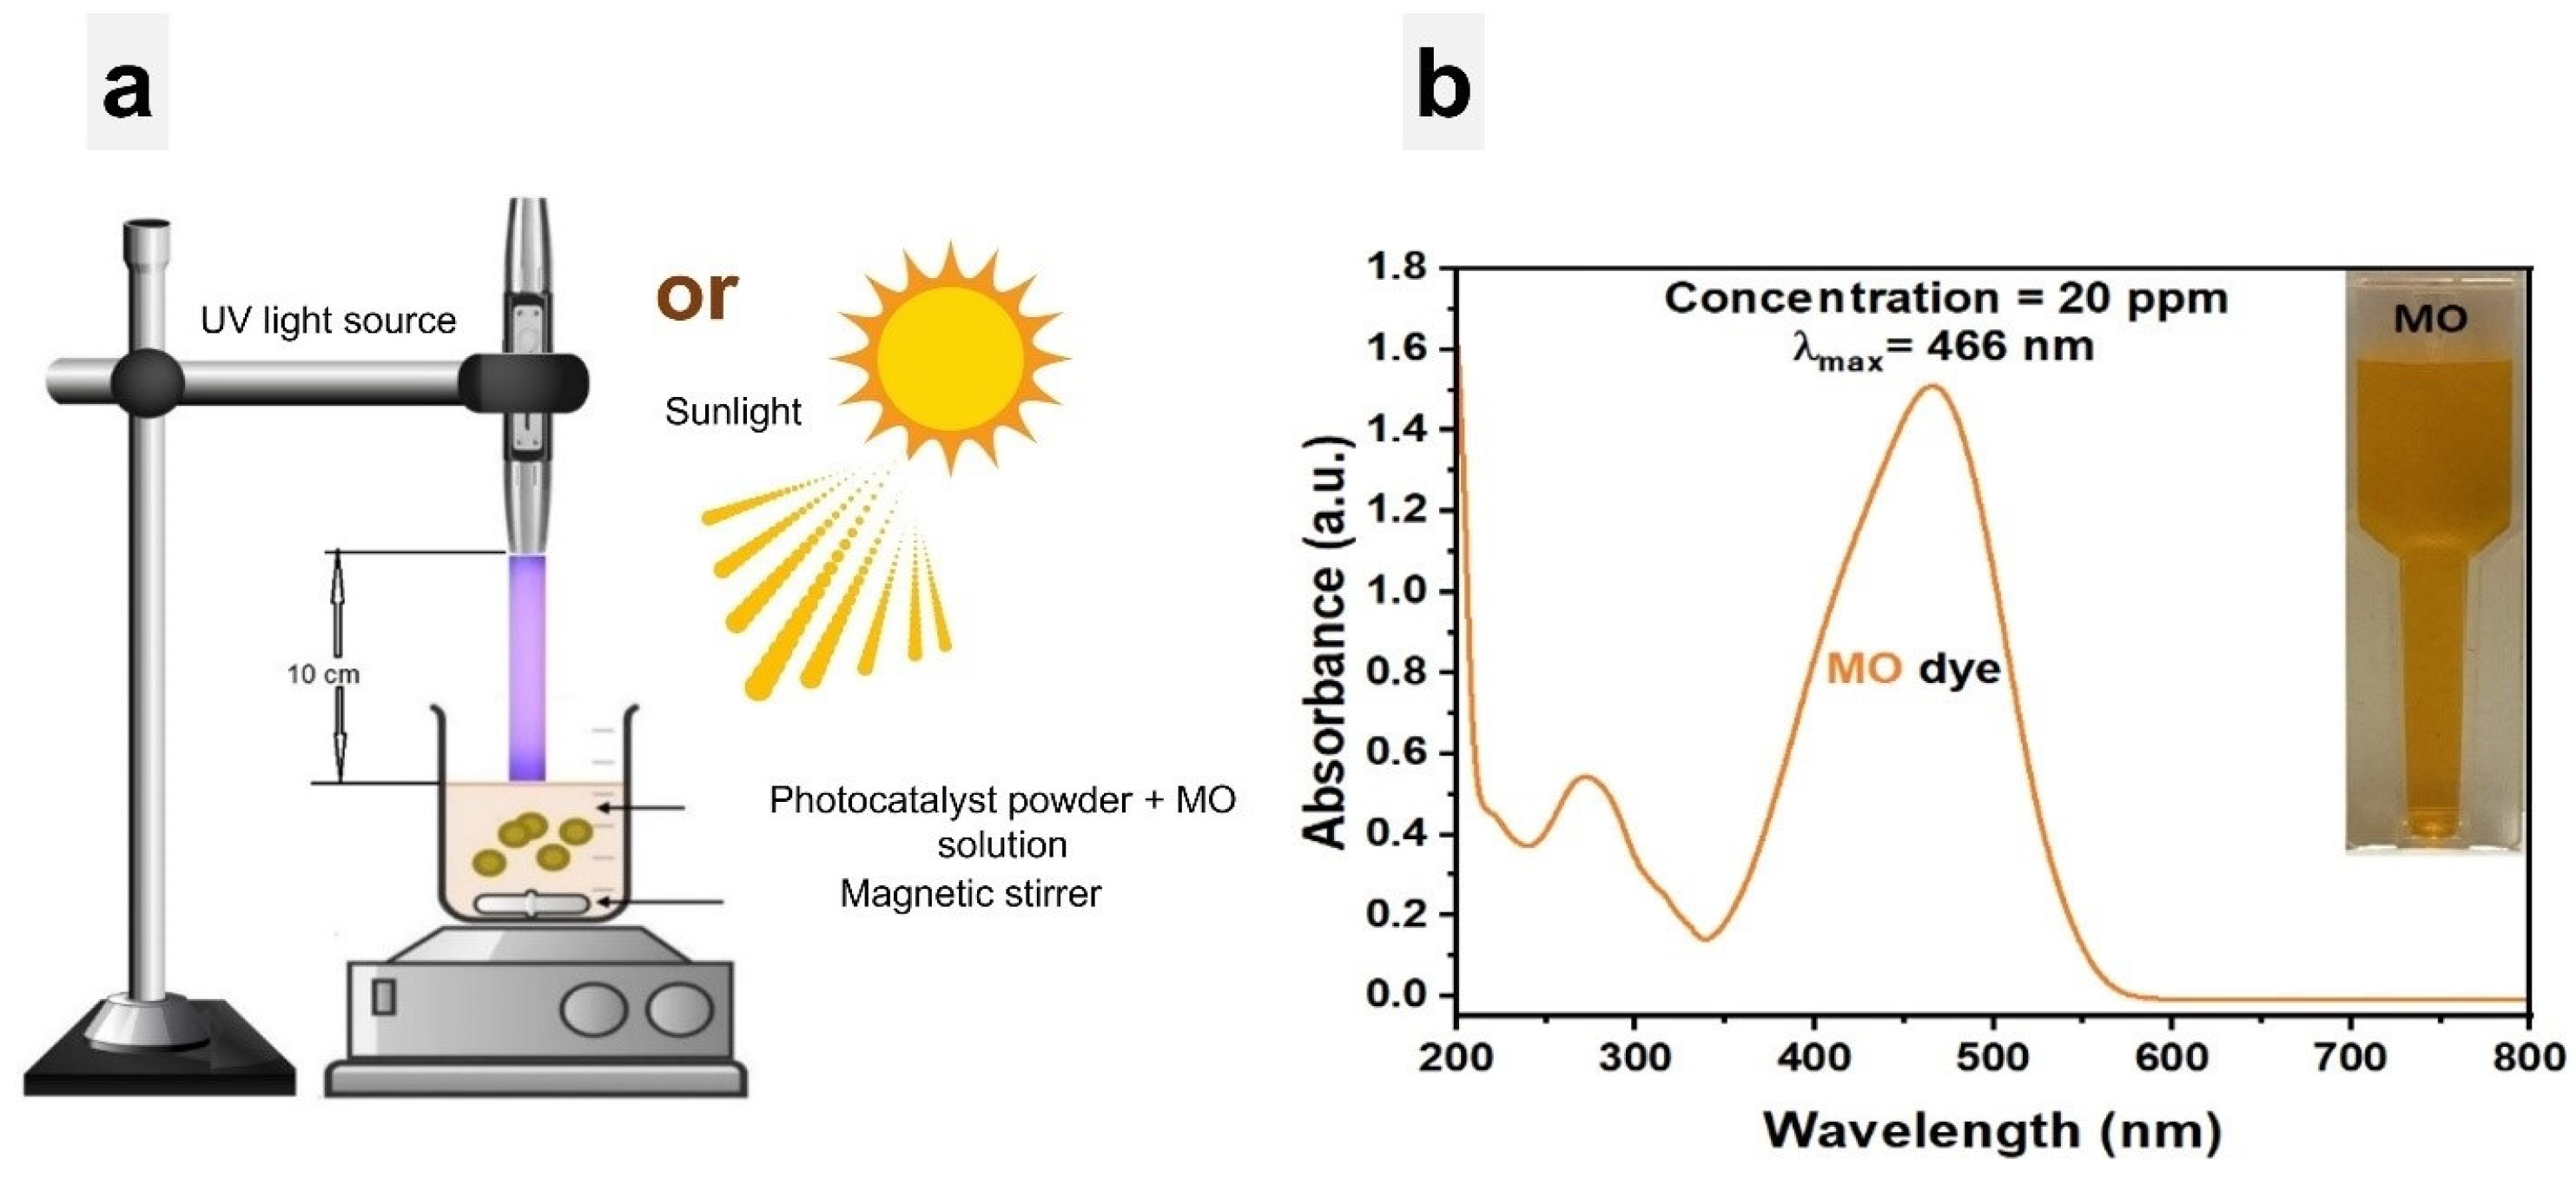
The photocatalytic activity of 1% Ce-doped ZnO NPs and undoped ZnO NPs was evaluated by measuring the rate of MO degradation under two different light sources: UV light at 396 nm (4.397 mW) and natural sunlight. The experiments were carried out in Penang, Malaysia, from 9 a.m. to 12 noon, with an average temperature of approximately 29 ± 1.5 °C. The MO dye photodegradation test was performed in a 50 mL beaker, which contained 20 ppm of MO dye and 0.05 g of photocatalysts, as shown in Figure 2a. Prior to irradiation, for achieving adsorption/desorption equilibrium, the solution was stored in the dark for 30 min. During the sequence of experiments, at 10-min intervals over 90 min, 2 mL of the solution was withdrawn each time until the solutions became colorless, indicating dye reduction. Subsequently, the UV–vis spectrum of the sampled solutions was analyzed within the wavelength range of 200 nm to 800 nm. It is important to mention that the standard absorption curve of the MO dye (shown in Figure 2b) exhibited its highest absorption peak at 466 nm.

Figure 2.
(a) Experimental setup for degradation of MO solution with photocatalysts under UV light and sunlight, respectively. (b) MO dye absorption curve.
2.4. Removal Efficiency of Degradation
The degradation efficacy refers to the catalyst’s performance in degrading MO dye. Thus, the percentage degradation efficiency was evaluated by employing the equation given below:
where is the concentration of aqueous MO dye without photocatalyst (20 ppm), and is the concentration of MO dye with photocatalyst through the reaction under light exposure for any time t (min) [17].
2.5. Kinetics Studies of Photocatalysis
To investigate the adsorption kinetics, the data from the photocatalytic activities were further used to analyze the rate of reactions. The nature of photocatalytic activity in the decolorization of MO dye may be depicted using the pseudo-first-order reaction kinetics, given by the equations as follows:
in which (min−1) refers to degradation’s rate constant. The linearity obtained in the ln (/) plot versus irradiation time results in pseudo-first-order kinetics [18].
2.6. Isotherms Study of Dye Molecules
Adsorption capacity (or loading) measures the quantity of adsorbate absorbed by the adsorbent per unit mass (or volume) of the adsorbent. It is used to explore the adsorption isotherms with respect to MO molecules [19]. The value denotes that the capacity of adsorbent (photocatalyst) at equilibrium in mg·g−1 was determined from the following relation:
where refers to the dye’s concentration at equilibrium (mg·L−1), denotes the adsorption capacity at equilibrium, refers to the dye solution volume in L, whereas resembles the photocatalyst mass in grams [19].
Consequently, (mg·g−1), which refers to the amount of MO dye adsorbed per gram with respect to adsorbent (photocatalyst) at any time t (min), can be discovered using the following equation:
where is the concentration of MO dye with photocatalyst through the reaction under light exposure for any time t (min) [17].
3. Results and Discussion
3.1. Nanoparticle Production: Photothermal Effect and Laser Decomposition
In this work, the laser served as a focused, potent energy source to accelerate the breakdown of ZnO in a DI water medium. The precursor solution began quickly evaporating within seconds of the exposure to the laser beam at 60 watts. Furthermore, fumes were formed from the reaction zone within the Perspex box, and a white condensed circle was visible on the substrate’s surface after irradiation, as shown in Figure 1b,c. Note that liquid water can absorb infrared radiation from a CO2 laser. The complex and rapid heating event is due to the laser’s Gaussian intensity distribution, which induces a Gaussian spatial temperature distribution. Two related phenomena occur when a laser beam is applied to a thin layer of liquid owing to the local increase in temperature [20]: (i) the heat will alter the liquid’s refractive index, resulting in thermal defocusing that enlarges and modifies the shape of the beam, (ii) this optical effect is accompanied by a change in the surface tension concerning the liquid layer, inducing thermocapillary. The local increase in temperature produces two effects: a rapid liquid flow away from the laser beam’s center and the formation of a depression surrounded by a ridge in the liquid layer. These effects are accompanied by the evaporation of the solvent, which induces a concentration gradient. When the precursor crystals in the solution react, convection eventually changes from thermocapillary to concentration convection, resulting in nucleation of ZnO (or Ce/ZnO) [21]. In laser decomposition, NPs are believed to be formed by the rapid condensation of reactant species in the liquid phase. Laser light’s penetration depth is proportional to its wavelength, with longer wavelengths penetrating deeper into the medium [22]. This results from the laser light’s thermal effect, which increases with increasing wavelength. The photon energy must be compatible with the energy gap between the excited and ground states to allow for electronic transition. Here, the photon energy of infrared light is insufficient for electrons to achieve higher excited states. Consequently, only transitions between vibrational levels are observed, and the energy loss from these levels occurs as heat due to the photothermal effect. Laser irradiation induces a non-equilibrium state that enhances the formation of nanostructures from precursor molecules. This process cannot be accomplished with the same oven temperature. Hence, locally heating the sample with a CO2 laser results in the potential hemolysis or dissociation of multiple bonds [23].
3.2. Characterizations
3.2.1. XRD Analysis
In Figure 3a, XRD pattern (JCPDS No. 01-080-0075) for ZnO NPs reveals distinct peaks at 2θ values of 31.76°, 34.41°, 36.25°, 47.54°, 56.58°, 62.85°, 66.36°, 67.92°, and 69.08° corresponding to the (100), (002), (101), (102), (110), (103), (200), (112), and (201) crystal planes, respectively. These peaks indicated the presence of the wurtzite hexagonal ZnO phase. The as-synthesized 1% Ce/ZnO samples exhibit peaks corresponding to the reflection planes of the cubic-structured CeO2 (JCPDS No. 03-065-2975), as shown in Figure 3b. These distinctive peaks observed at 2θ values of 28.86°, 33.14°, 47.24°, 56.06°, 59.22°, and 69.84° in the 1% Ce-doped ZnO NPs have been indexed as the (111), (200), (220), (311), (222), and (400) crystal planes, respectively, representing the crystalline CeO2 cubic phase. This finding provides evidence of Ce3+ or Ce4+ incorporation into the ZnO lattice [12]. Simultaneously, peaks at 32.44°, 34.28°, 35.84°, 66.30°, and 67.80° are attributed to the reflection planes (100), (002), (101), (200), and (112) of the wurtzite hexagonal ZnO phase, respectively [18,19]. The Ce doping reaches saturation within the ZnO lattice at 1%, leading to the formation of a new phase (second phase) consisting of cubic CeO2 in the 1% Ce/ZnO composite. As a result, it becomes evident that a considerable amount of Ce has been successfully accommodated within the ZnO lattice, leading to the formation of CeO2. This indicates that once the doping concentration was reached, a significant portion of Ce was incorporated into the ZnO NP lattice. Consequently, the presence of the second phase (CeO2) becomes noticeable [19]. However, due to the contribution of CeO2 to the diminished ZnO peak (Figure 3b), collecting ZnO diffraction data becomes challenging. Correspondingly, the crystallite size, D, is obtained by employing the Debye–Scherrer formula [24].
where D is the average crystalline diameter in nanometers (nm); β denotes the full width at half maximum (in radian); λ refers to the X-ray wavelength, which is 0.15418 nm for Cu-target Ka radiation, and θ represents the Bragg diffraction angle [25]. As presented in Tables S1 and S2, the crystal parameters according to the diffraction angle (2θo) and the Full Width at Half Maximum (FWHM), the crystallite size, as well as the d-spacing from several reflection planes for each peak are shown. The average crystal size of 1% Ce/ZnO (90 nm) was smaller compared to pure ZnO, which was 117 nm. This finding is in agreement with other findings reported elsewhere [24,26,27]. Ce-O-Zn bonds formed on the surface of Ce-doped ZnO samples limit or restrain the crystallites’ growth, causing a decrease in crystallite size [28]. In addition, Ce doping reduces crystallite size because Ce4+ has a larger ionic radius than Zn2+ and may penetrate the ZnO matrix because of the low nitrate decomposition temperature. Therefore, Ce4+ may diffuse into the ZnO matrix and replace the Zn2+ position to produce CeO2 [26,29]. The ZnO lattice parameters a and c were calculated from the (100) and (002) peaks’ positions, accordingly, as follows:
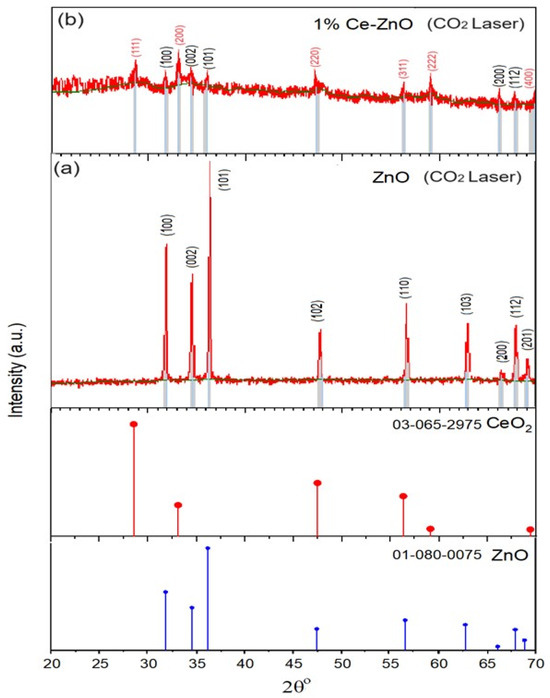
Figure 3.
XRD patterns of (a) undoped ZnO with standard XRD JCPDS No. 01-080-0075 data of ZnO and for peak comparison and (b) 1% Ce-ZnO nanoparticles with ZnO XRD JCPDS No. 01-080-0075 and CeO2 JCPDS No. 03-065-2975 data for peak comparison.
Here, the crystallinity degree Xc is measured employing the following empirical relation:
in which β denotes the FWHM (in degrees) of (002) Miller’s plane [30,31]. Here, the lattice constant a is the face-centered-cubic (fcc) structure of CeO2 crystals, and d(111) is the interplanar spacing between planes using a space lattice equation:
Therefore, we can only estimate the crystal size of each phase from the reflection planes of the Ce/ZnO sample with XRD data, as depicted in Table 1, which are in agreement with other findings reported in the literature.

Table 1.
Cell parameters a and c, average crystalline size D, and degree of crystallinity Xc.
3.2.2. FESEM and EDX Analysis
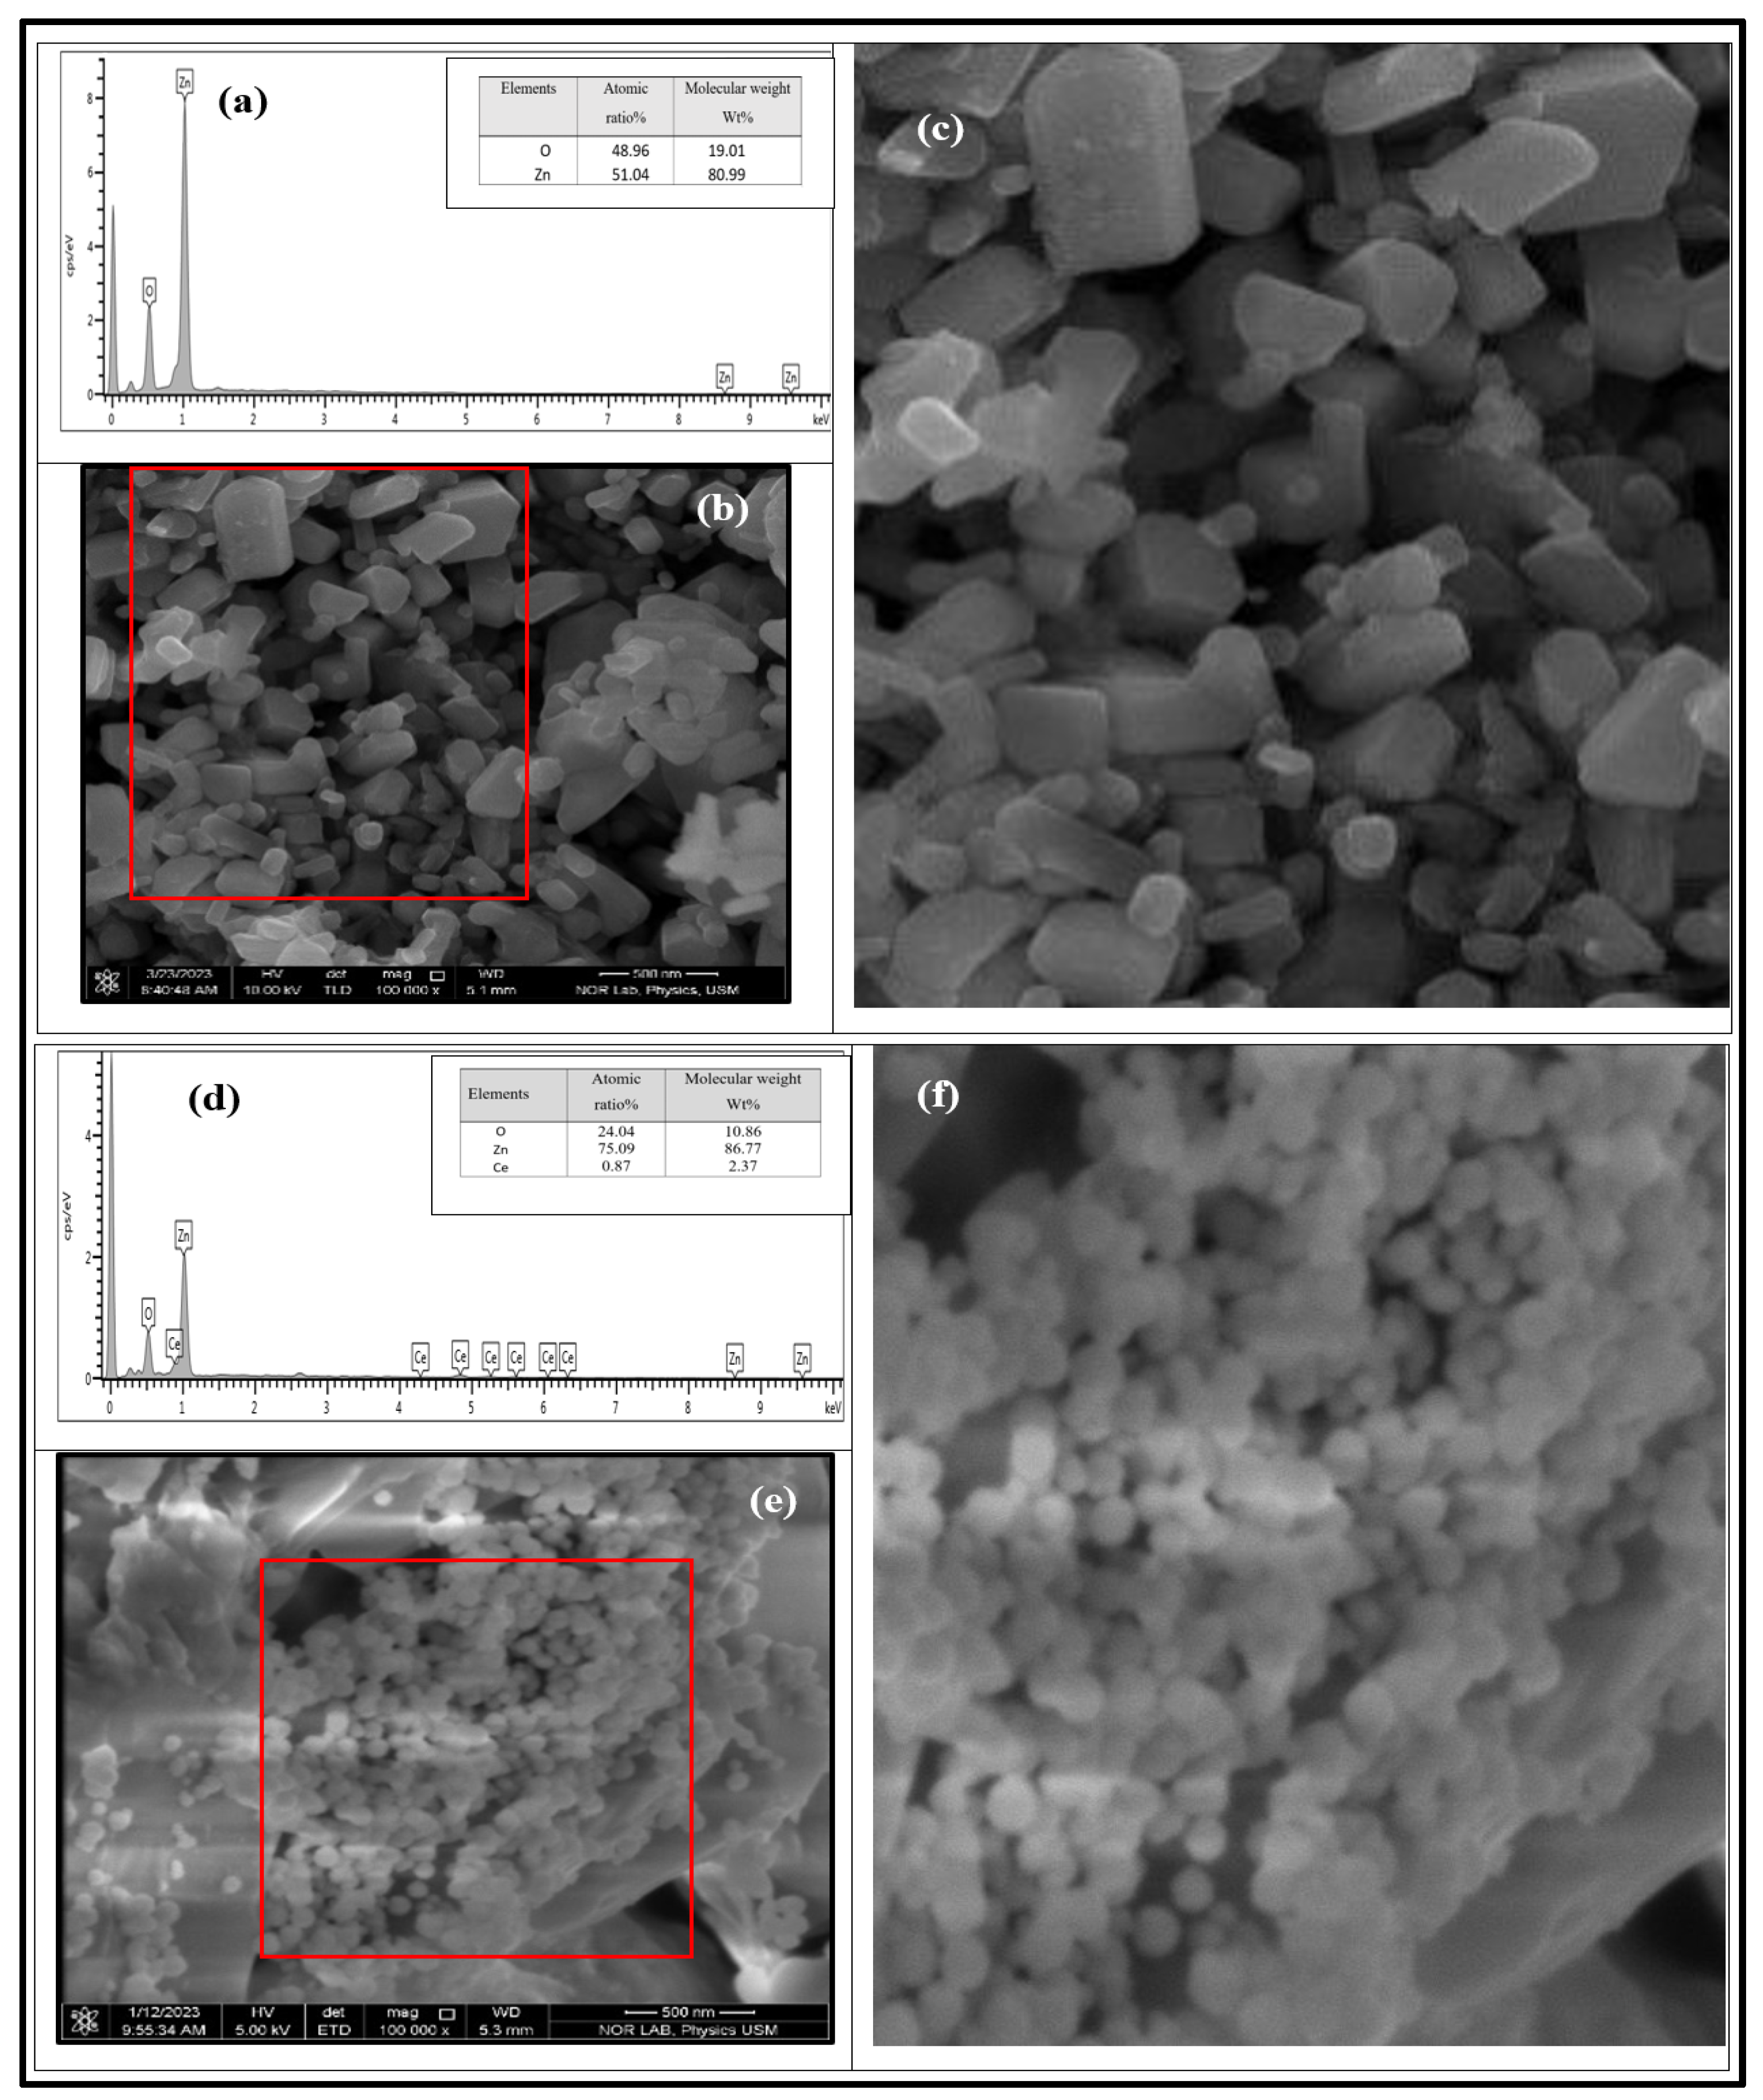
The prepared undoped ZnO and 1% Ce/ZnO NP powder morphologies were investigated using FESEM and EDX analysis. In Figure 4, the morphology of the undoped ZnO NPs is highlighted, showing their hexagonal shape with a closely packed arrangement. These NPs were prepared using a CO2 laser and exhibited diameters ranging from 26 to 350 nm, consistent with previous reports [32]. Furthermore, the FESEM analysis provided evidence of the successful incorporation of Ce into the ZnO powder. Using a high-power CW CO2 laser with an effective Ce source formed 3D spherical nanostructures, as depicted in Figure 4e,f. These 3D sphere-like NPs were observed to adhere to one another and exhibited a diameter range of 3.2–127 nm. To quantify the particle size, average diameter, and diameter range, a thousand particles were selected and measured using ImageJ software (ImageJ 1.46r, Java 1.6.0_20 (64-bit)) (refer to Table S3). Notably, the choice of Ce source, specifically Ce (NO3)3· 6H2O, significantly impacted the final product’s morphology [33]. Additionally, the morphology and crystal structure of the end products were directly influenced by factors such as the CO2 laser power, irradiation time, and wavelength.
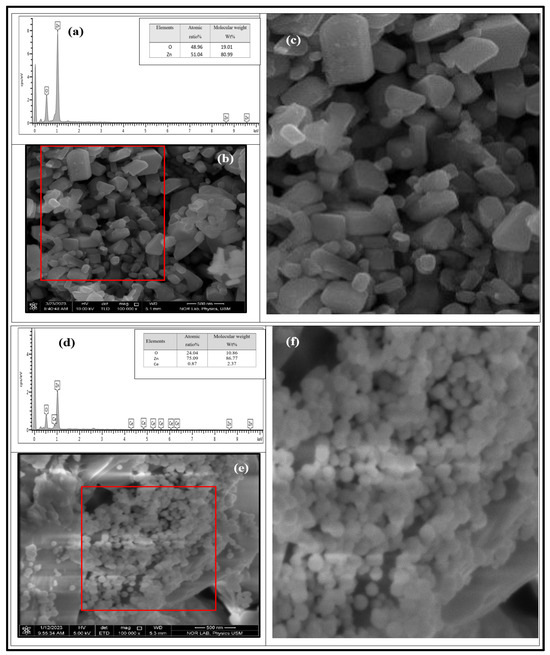
Figure 4.
(a) EDX analysis depicting the chemical composition of undoped ZnO NP powder. (b) FESEM micrograph illustrating the morphology of the sample, with a scale bar of 500 nm. (c) A magnified image of 234 particles is enclosed within the red box. (d) EDX analysis of the elemental composition, and (e,f) FESEM image and analysis displaying the elemental composition and the morphology of the 3D sphere-like nanoparticle powder, which is doped with 1% Ce-doped ZnO.
EDX analysis in Figure 4d revealed numerous well-defined peaks corresponding to Zn, Ce, and O, indicating their uniform distribution throughout the sample area. This observation provided strong evidence of the successful doping of Ce into the ZnO matrix. Significantly, the intensity of the Ce element surpassed that of Zn, indicating an enrichment of Ce within the NPs compared to its surroundings. The atomic ratio [Ce]/[Zn] was calculated to be 1.16%, which closely matches the theoretical doping level of 1% [30,34]. Moreover, the absence of any foreign elements detected in the synthesized samples further confirms the successful synthesis of Ce-doped ZnO. However, it was observed through EDX that an increase in oxygen vacancies in the 1% Ce/ZnO NPs also influenced the photocatalytic activity [11].
3.2.3. Optical Properties of the Prepared Samples
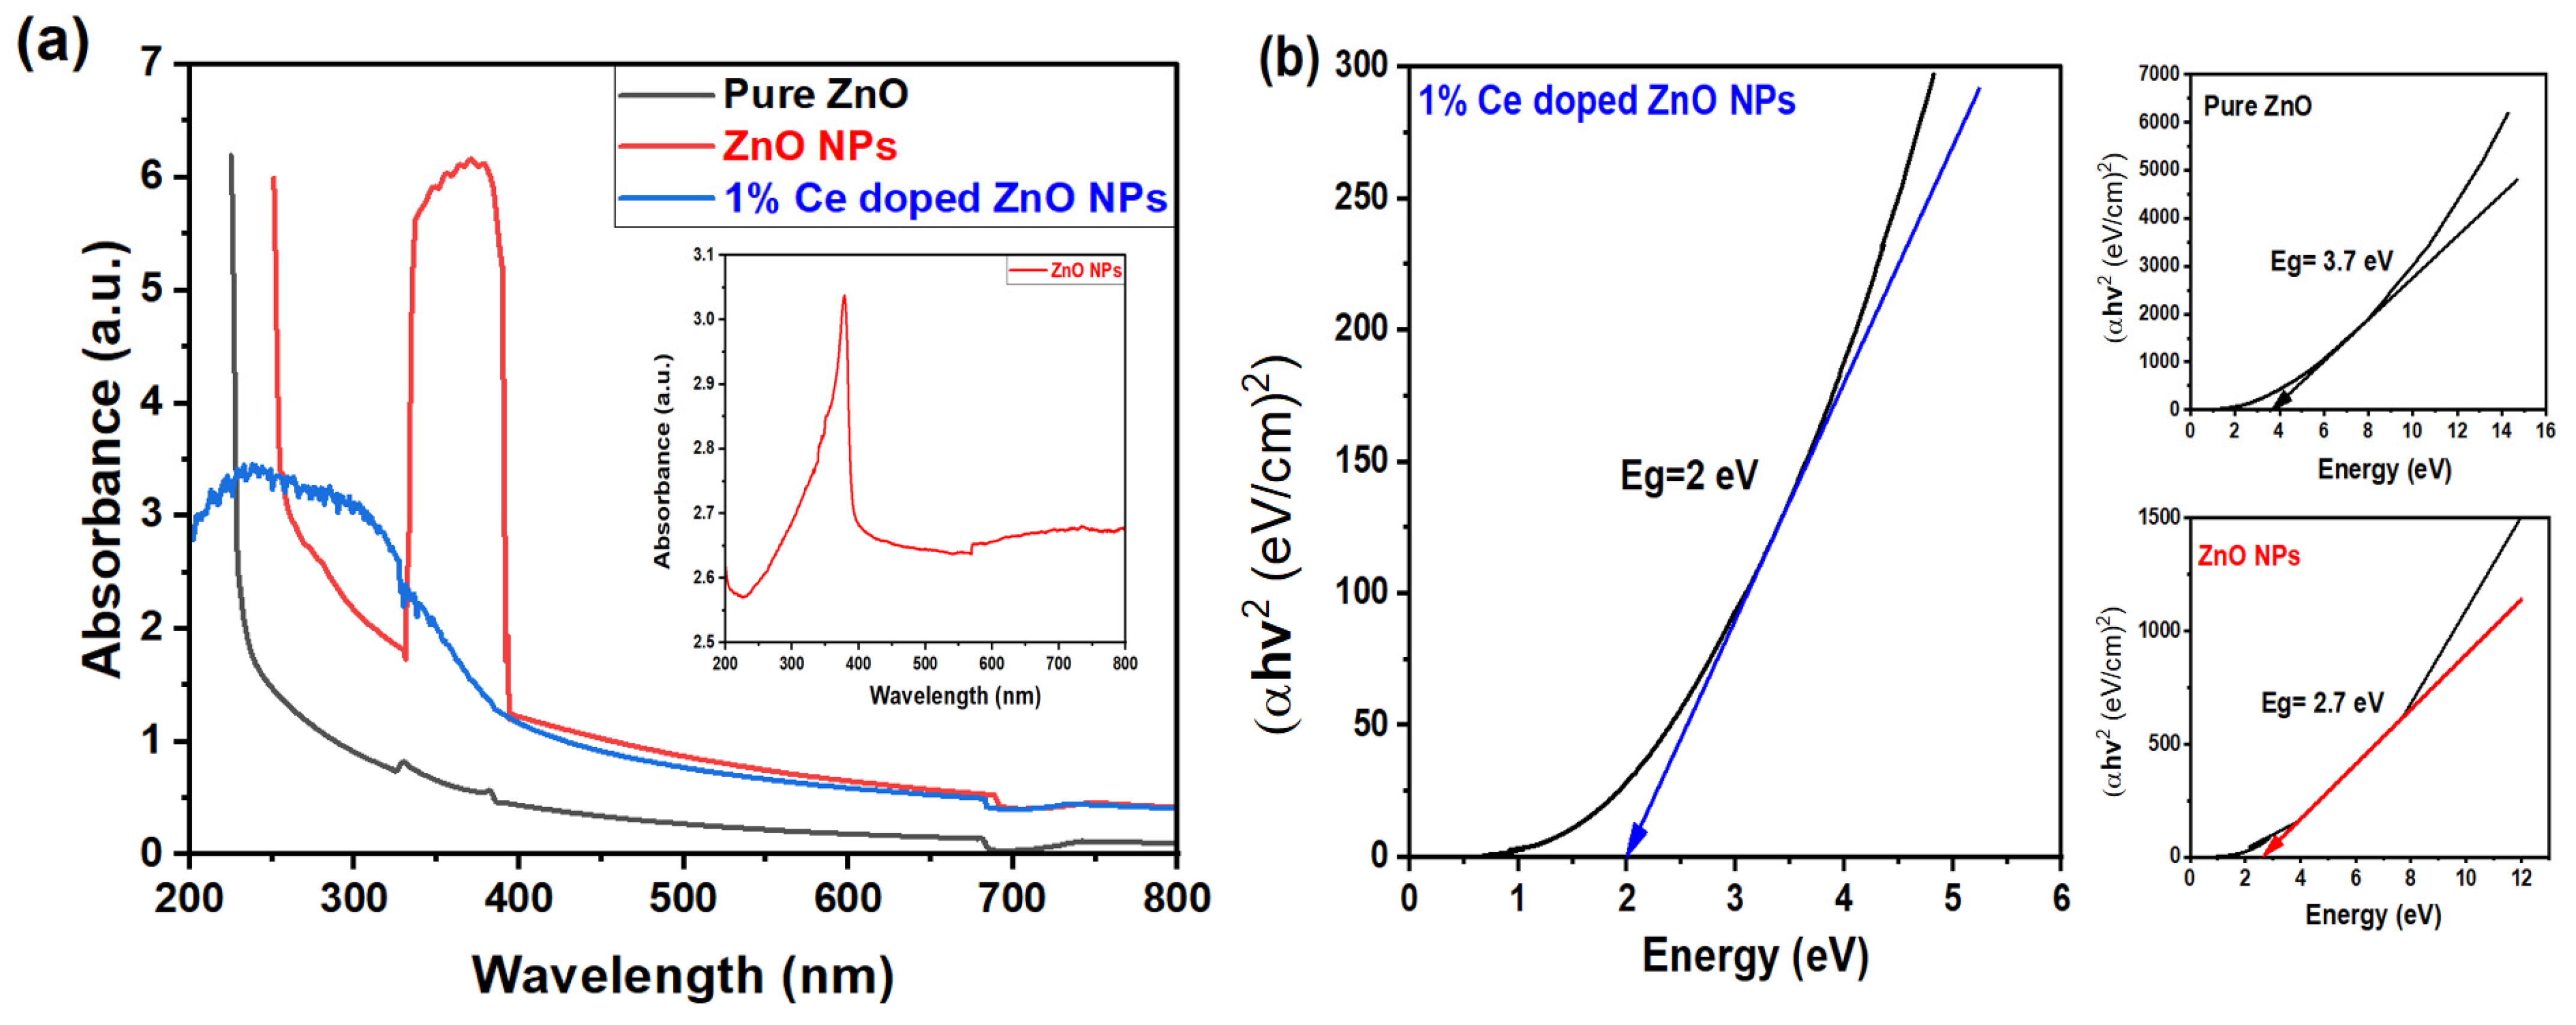
The optical profile of the nanoparticle (NP) solutions was analyzed using a UV–vis absorption spectrophotometer, and the absorbance was recorded from 200 nm to 800 nm, as depicted in Figure 5a. The comparison was made between 3D 1% Ce-doped ZnO spherical NPs, pure ZnO (precursor), and ZnO NPs (after CO2 laser irradiation). The absorbance spectra of pure ZnO exhibited an absorption peak between 200 and 250 nm, signifying the absorption of incident photon energy by ZnO. However, both ZnO NPs and 1% Ce-doped ZnO NPs displayed an absorption edge shift into the visible spectrum, around 400 nm. This shift is attributed to the presence of doped Ce and the formation of smaller NPs in the case of 1% Ce-doped ZnO NPs. The exceptionally high absorption observed in the case of ZnO NPs can be attributed to both the UV–vis spectrophotometer settings chosen by the operator and the elevated concentration of the sample (0.5 M). However, upon diluting the sample to 50%, a distinct peak becomes evident at around 400 nm, as shown in Figure 5a (inset). Several factors, such as band gap, oxygen deficiency, NP size, structure, and impurity centers, can influence the absorption behavior. This behavior of ZnO NPs, as well as Ce/ZnO NPs, is expected to decrease the band gap (Eg) value that is determined from a Tauc plot based on the relation below:
where hν denotes the incident photons energy, α resembles the absorption coefficient, A is a material constant, and n = 1/2 is for the direct band gap ZnO semiconductor. The band gap energy (Eg) is obtained from the extrapolation of the linear portions with respect to the plots onto the x-axis. Other than that, plots of (αhν)2 versus (hν) are made for pure ZnO, ZnO NPs, and 1% Ce/ZnO NPs.
(αhν)1/n = A (hν − Eg)

Figure 5.
(a) The optical absorbance spectra. The inset displays the 50% diluted ZnO NPs, and (b) the evaluation of (αE)2 versus E, to Eg for different samples: pure ZnO (black), ZnO NPs (red), and 1% Ce-doped ZnO NPs (blue).
As shown in Figure 5b, the band gap energy for pure ZnO (3.7 eV) was observed to be larger than that of ZnO NPs and 1% Ce/ZnO NPs (2.7 eV and 2 eV, respectively). This demonstrates the impact of CO2 laser power and wavelength on NP formation and band gap narrowing. Modifying Ce ions in Ce/ZnO proved advantageous for enhancing photocatalytic activity, as the Eg energy and hydroxyl radicals primarily influence photocatalytic reactions. Several crucial parameters, such as particle size, morphology, and defect concentration, influenced the value of Eg. The crystalline sizes, lattice parameters, optical energy band gaps, and average particle sizes obtained from XRD, FESEM, and UV–vis spectroscopies are presented in Table S4. Samples with smaller particle sizes, such as pure ZnO, typically exhibited broader Eg values, whereas narrower Eg values were observed in smaller NP samples. Consequently, it can be inferred that doping played a significant role in reducing the Eg value.
3.3. Photocatalytic Degradation of MO Dye
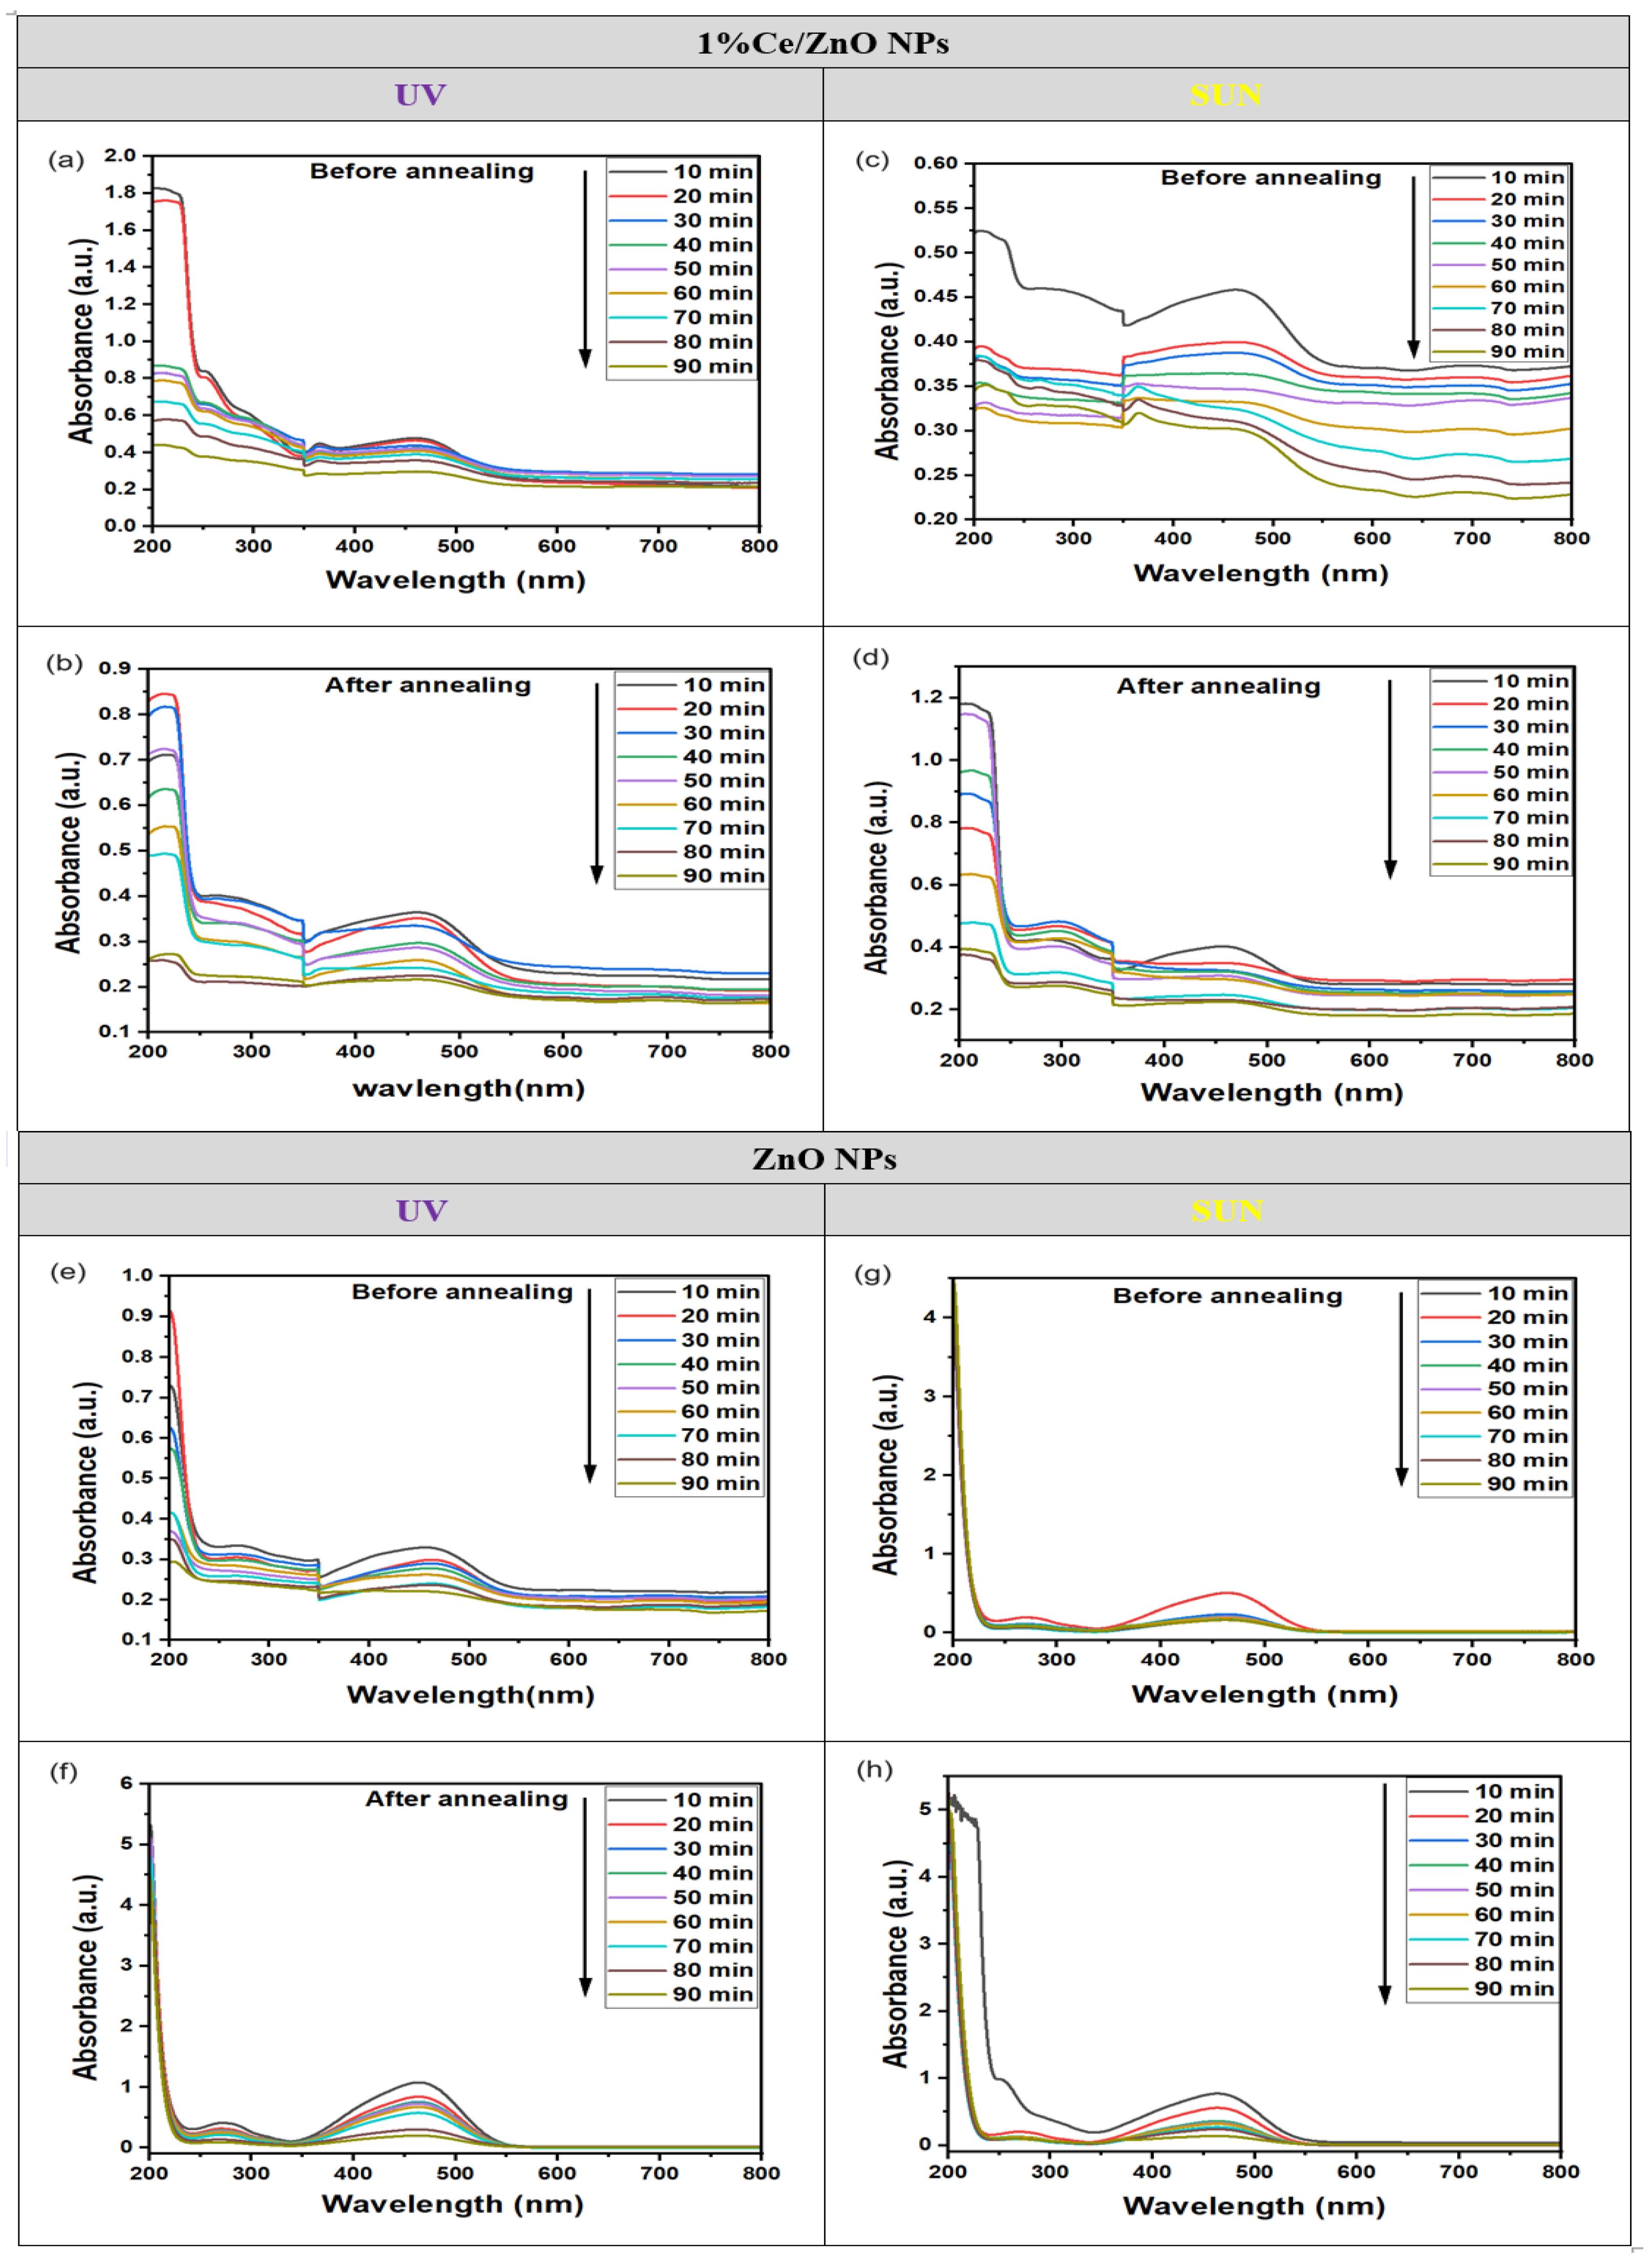
The photocatalytic degradation of dyes was investigated using UV and sunlight exposure with dynamic photocatalysts. In Figure 2b, the absorption curve of the MO dye without a photocatalyst displayed a maximum peak (λmax) at 466 nm. In contrast, Figure 6 illustrates the changes in absorbance bands at various time intervals for MO with the photocatalyst during irradiation, both before and after annealing. The decreasing maximal peaks observed in the absorbance spectra of ZnO NPs and 1% Ce/ZnO NP photocatalysts with increasing irradiation times indicate the degradation of MO and the formation of certain intermediate products. Notably, the absorption peaks corresponding to the dye were found in the wavelength range of 350–550 nm, which is of particular interest during the photocatalytic process.

Figure 6.
The absorption curves of the MO solution in the presence of 1% Ce/ZnO NPs: (a) before and (c) after annealing under UV light, as well as (b) before and (d) after annealing under sunlight. Additionally, the absorption curves of ZnO NPs are shown: (e) before and (g) after annealing under UV light, and (f) before and (h) after annealing under sunlight.
The results presented in Figure 6 demonstrate the remarkable photodegradation and decolorization capabilities of the 1% Ce/ZnO NPs photocatalyst for MO dye under both UV and sunlight exposure, as evidenced by the consistent patterns observed in Figure 6a–d, where significant decolorization occurs within just 90 min of exposure. The absorption peaks exhibit a drastic decrease after 10 min, as shown in Figure 6c,d, 20 min (Figure 6a), and 30 min (Figure 6b). This rapid reduction indicates the effective degradation of MO dye. In contrast, the ZnO NPs in Figure 6e–h experience irregular and less efficient degradation, with the excitonic absorption peaks diminishing gradually after 10 min and nearly disappearing only after 90 min of UV and sunlight irradiation. Moreover, the absorption curves of ZnO NPs in Figure 6e–h exhibits a decrease of around 466 ± 1 nm before and after annealing. Likewise, for 1% Ce/ZnO NPs, a small absorption peak between 300 and 400 nm becomes apparent. The results suggest that the 1% Ce/ZnO NPs photocatalyst is a promising material for efficient and consistent photodegradation of MO dye under both UV and sunlight exposure, outperforming the standard ZnO NPs in terms of regularity and efficiency in the degradation process.
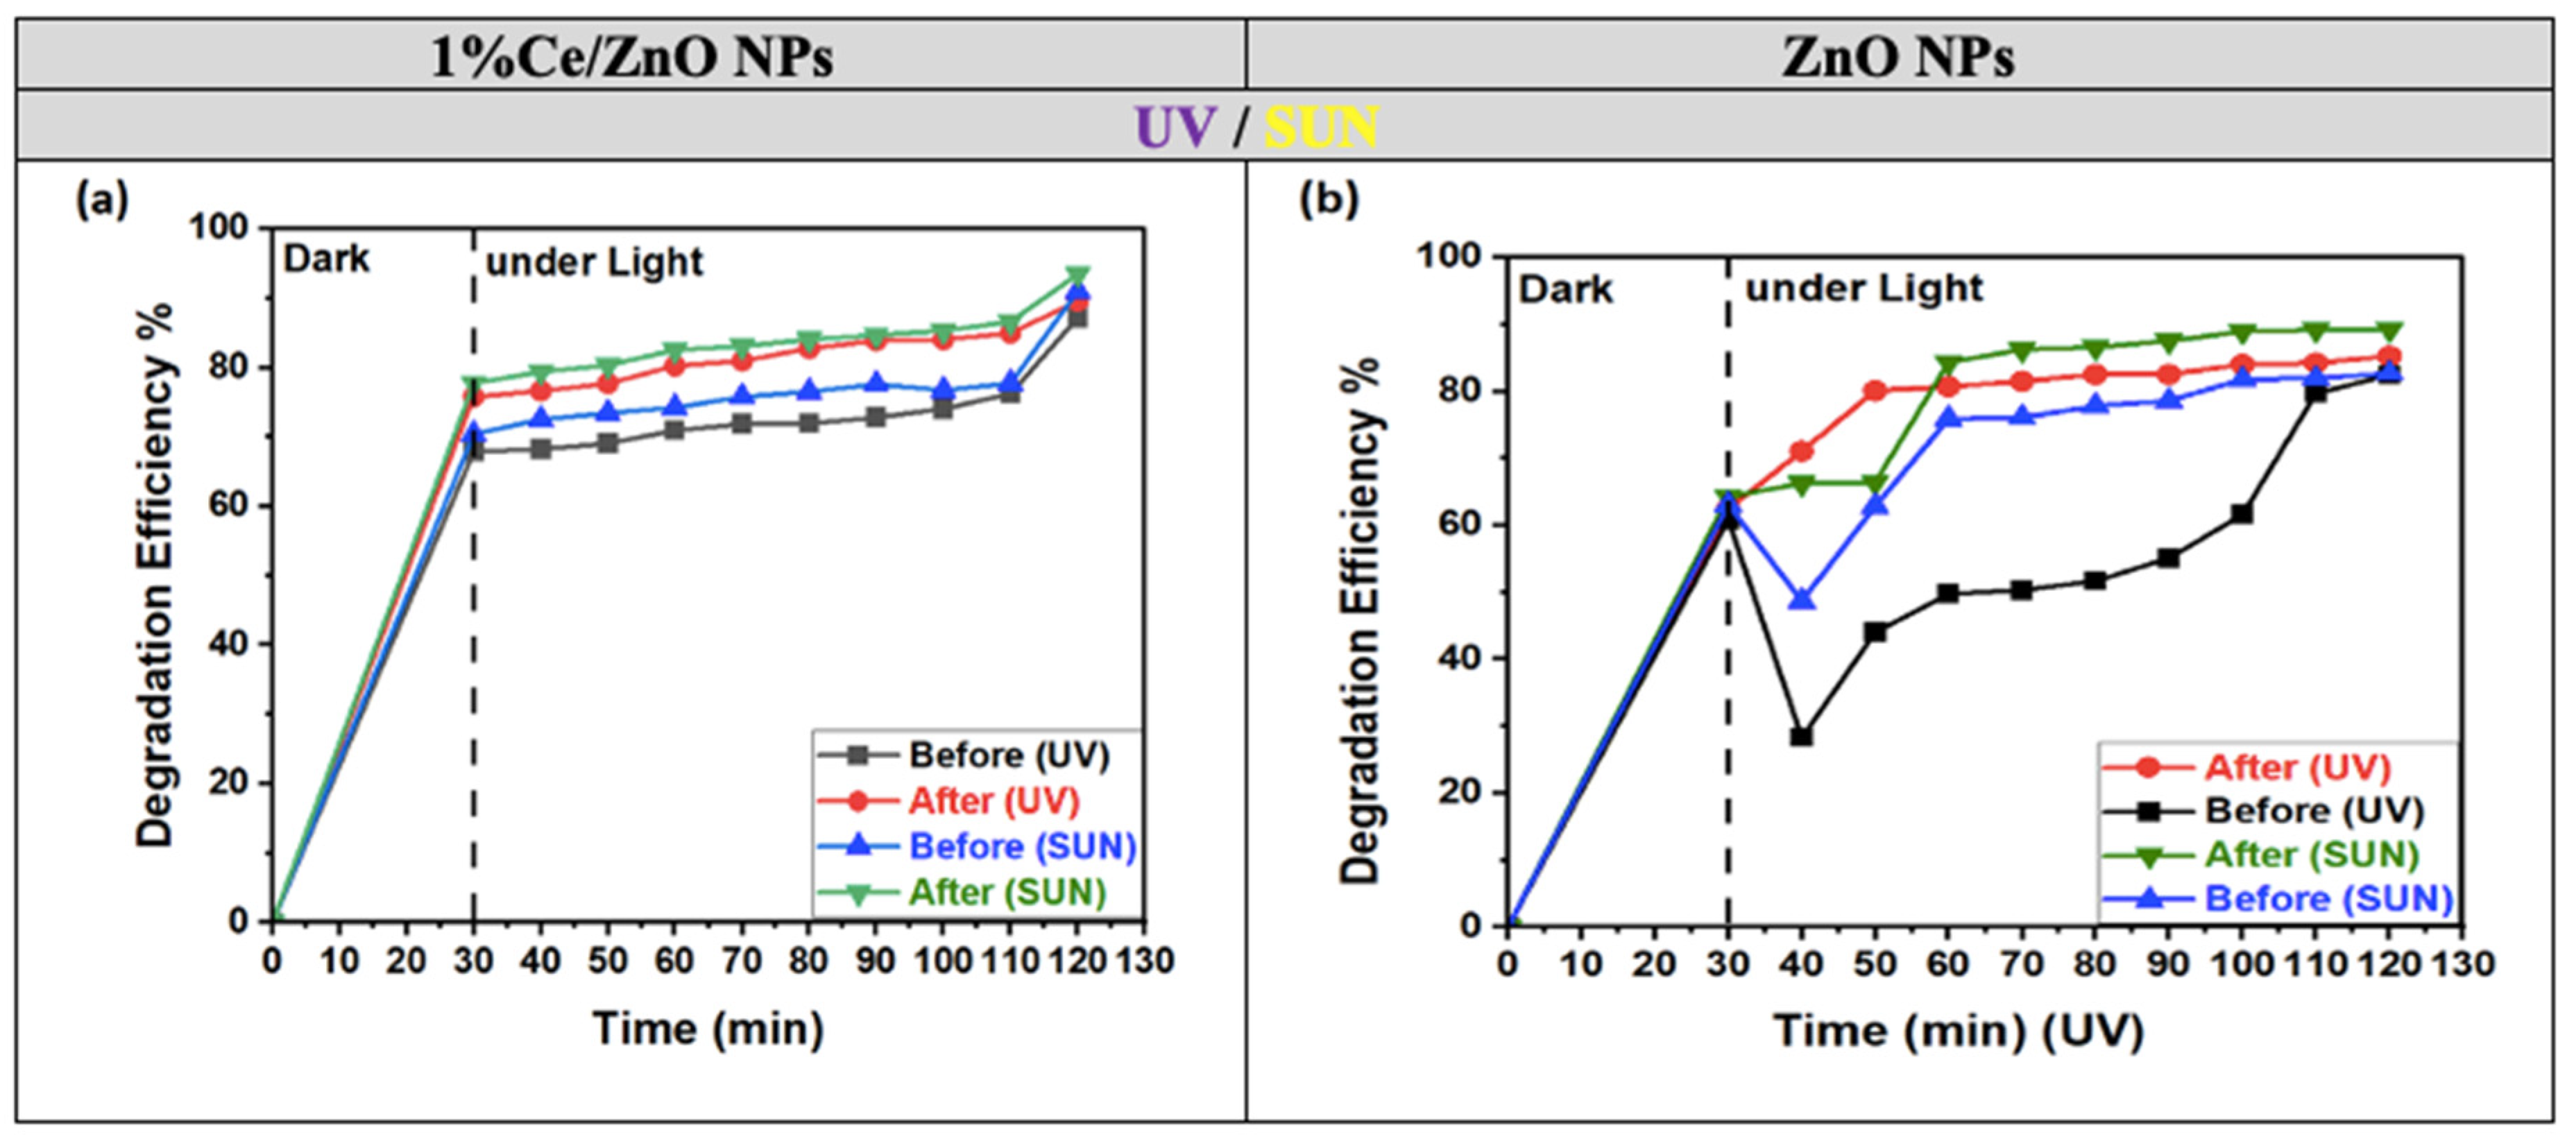
In Figure 7a,b, both photocatalysts show a significant increase in the decolorization of MO dye solutions when they are added within two minutes of adsorption/desorption equilibrium (0–30 min), as depicted on the left side of the graph. However, there are some notable differences between the two photocatalysts’ behaviors.
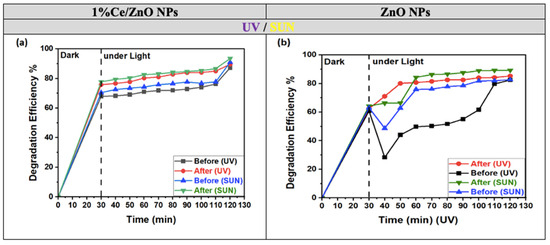
Figure 7.
Degradation efficiencies of MO dye by (a) 1% Ce/ZnO NPs and (b) ZnO NPs before and after annealing in the dark (left) and under UV and solar light (right).
The photocatalytic efficiency consistently increases for 1% Ce/ZnO NPs, reaching its peak value at 120 min during 30–120 min. In contrast, the efficiency of ZnO NPs exhibits irregular and turbulent behavior between 30 and 60 min and continues to fluctuate until 120 min. Table 2 presents the photodegradation results of the MO dye using both ZnO NPs and 1% Ce/ZnO NPs photocatalysts (both annealed and non-annealed) under UV and sunlight.
Table 2.
Variation of percentage efficiencies in detail under UV light and sunlight for undoped ZnO NPs and 1% Ce/ZnO NPs before and after annealing.
It is evident that ZnO NPs display superior efficiency when exposed to UV light compared to natural sunlight. Nevertheless, when subjected to sunlight, 1% Ce-doped ZnO NPs exhibit even higher efficiency, achieving peak degradation rates of 91% and 95% before and after annealing, respectively, surpassing the degradation rates observed under UV light (87% and 90%). Whether before or after annealing, the degradation efficiencies of 1% Ce-doped ZnO NPs under both UV and sunlight consistently outperform those of undoped ZnO NPs in all instances. The enhanced performance observed is attributed to the 1% Ce doping, which enhances photocatalytic activity by shifting the absorption band towards the visible light spectrum. This shift accelerates the degradation of MO as it becomes more responsive to visible light. When evaluating the degradation process in the absence of light (dark conditions), the superior rate of MO degradation in 1% Ce-doped ZnO NPs compared to undoped ZnO NPs within the initial 30 min can be ascribed to the interaction between the catalyst surface and MO molecules. This interaction promotes the cleavage of the azo bonds in MO, generating electrons in the process. Additionally, the presence of numerous free surface sites available for adsorption in the absence of light further facilitates this reaction [32]. Consequently, these electrons initiate a series of reactions, forming hydroxyl radicals. These species emerge as the primary oxidative species responsible for the degradation of MO, both in both dark and illuminated conditions, as indicated by our findings [35].
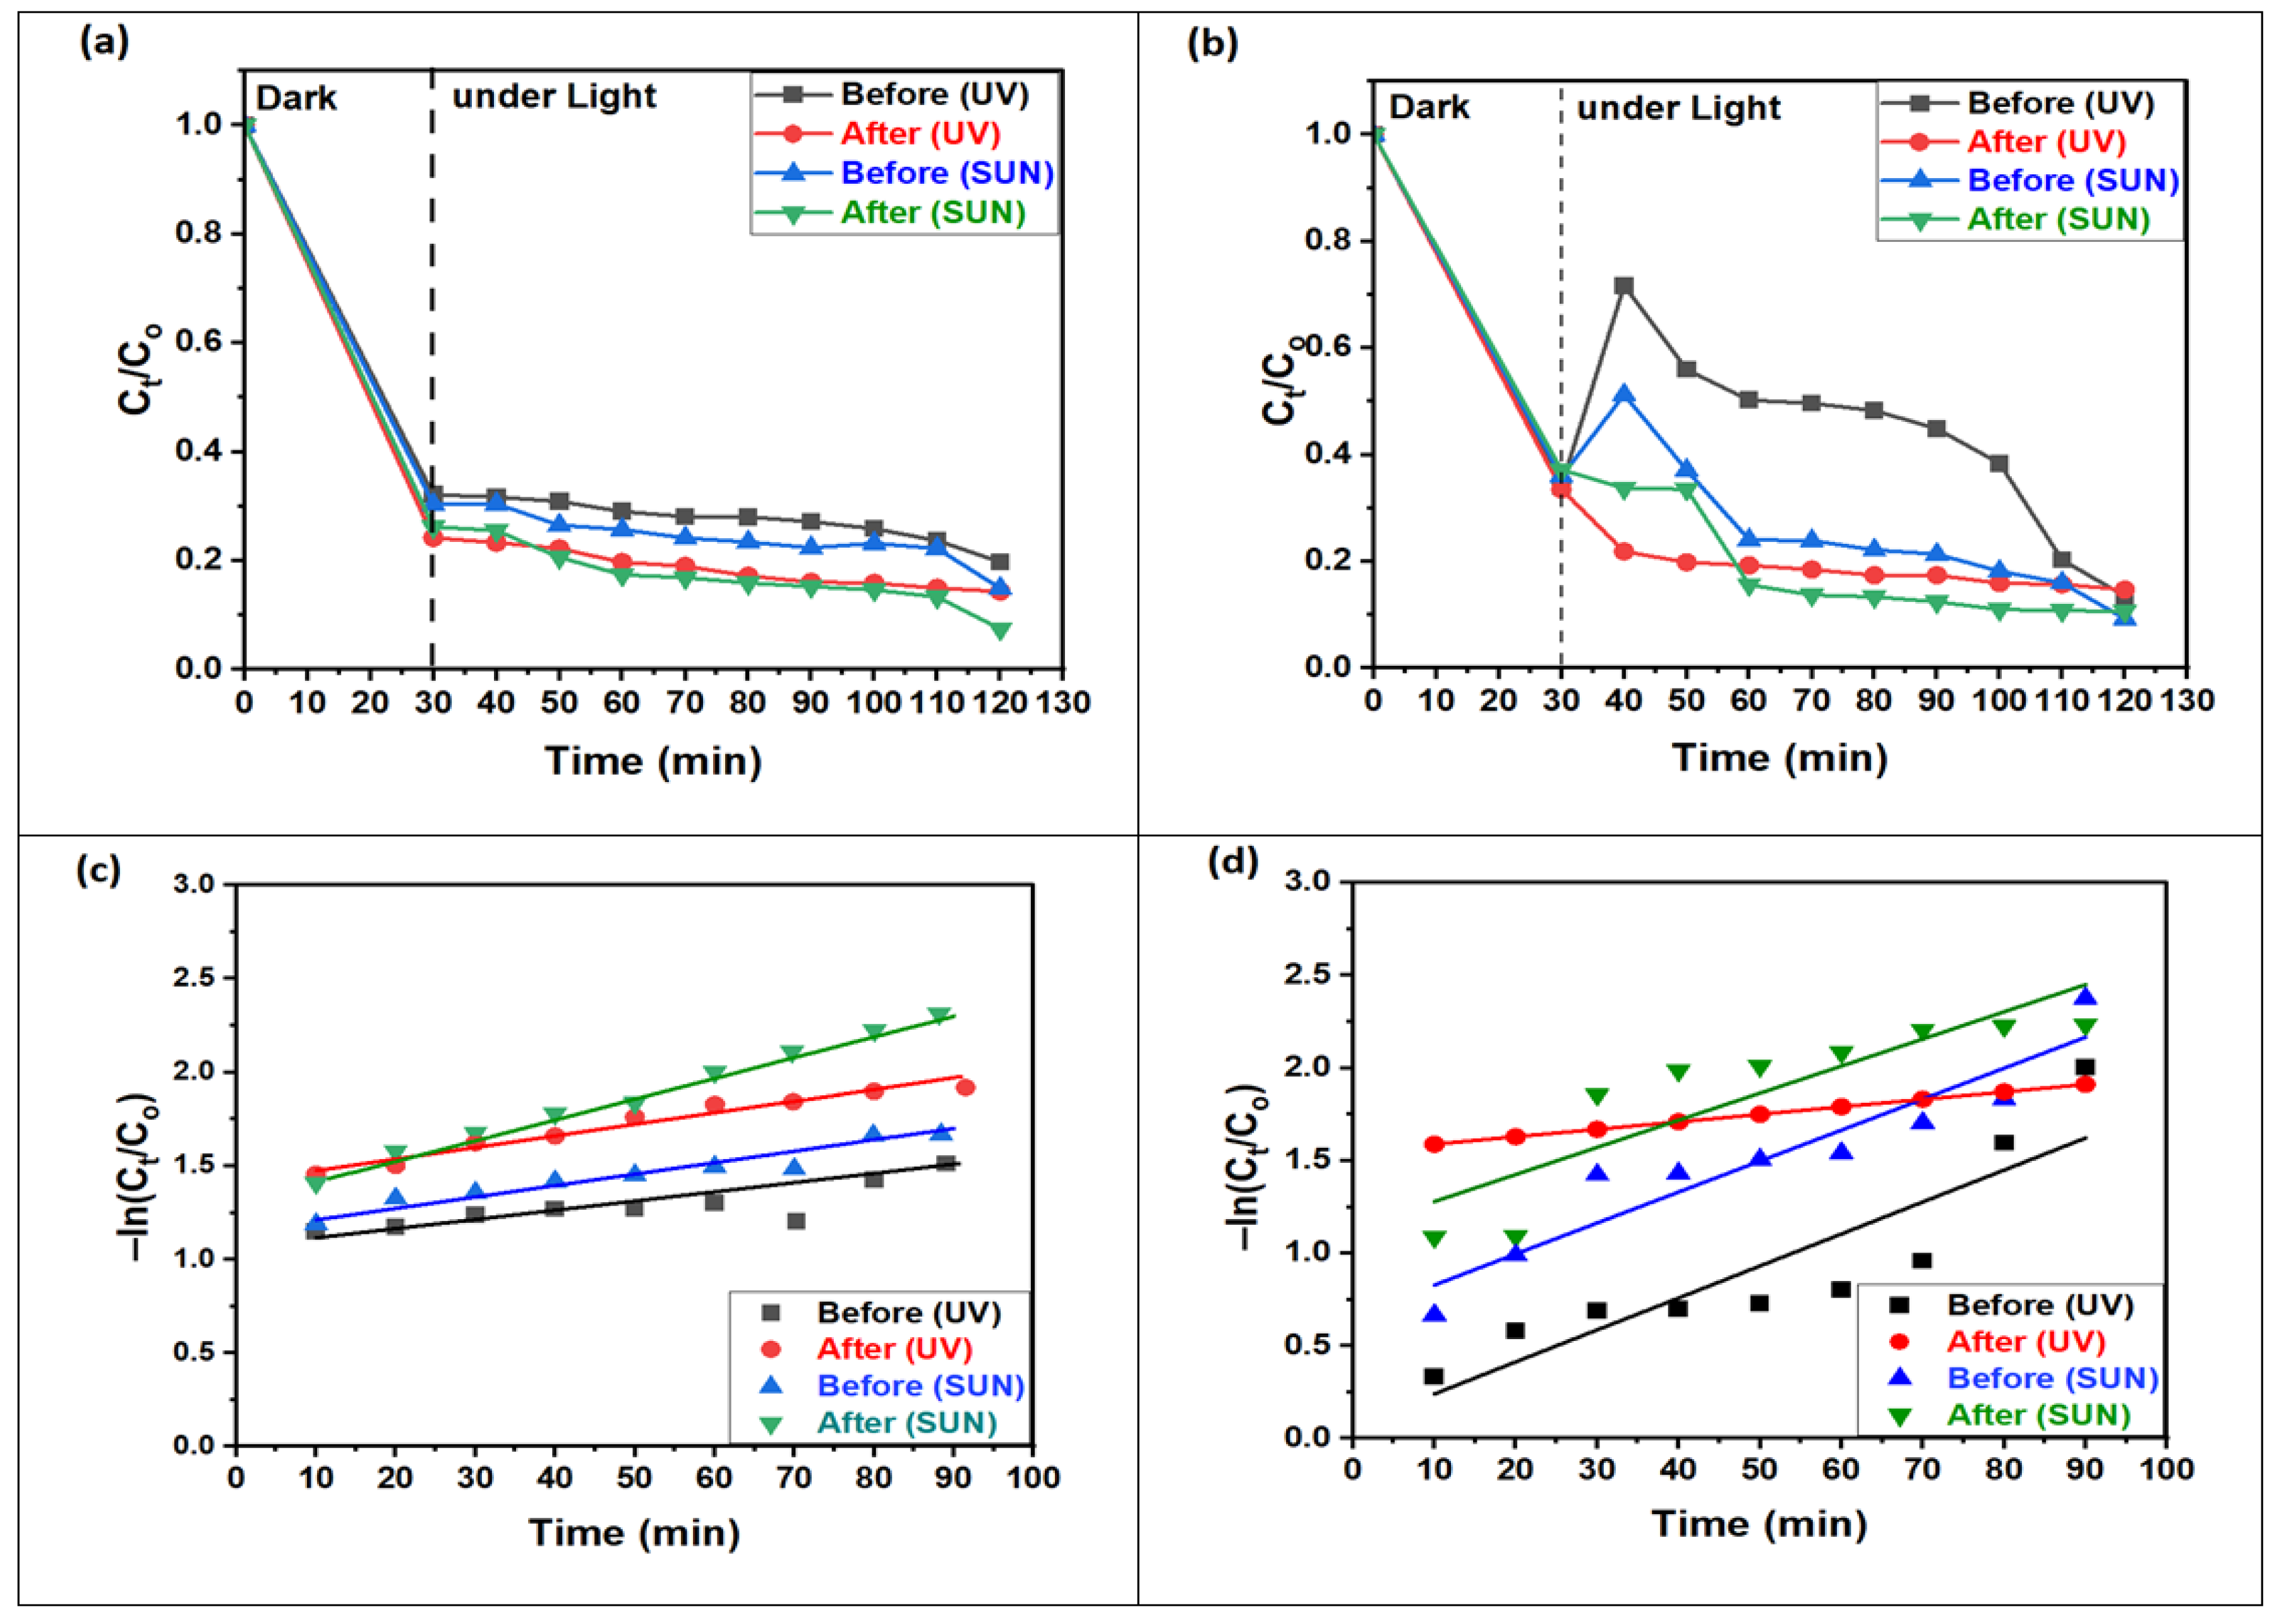
Figure 8a,b presents the photodegradation of MO dye using ZnO NPs and 1% Ce/ZnO NP photocatalysts before and after annealing under UV and sunlight irradiation. The results show a consistent trend, where the absorption of MO dye (lower MO concentration) decreases with increasing irradiation time for all types of radiation and photocatalysts within the first 90 min. The remarkable performance of 1% Ce/ZnO NPs, which exhibit nearly complete photodegradation of MO dye after 90 min, is shown. This photocatalyst demonstrates a regular and gradual degradation behavior compared to ZnO NPs. The variability noted in the degradation curves of ZnO NPs may be linked to the instability in the adsorption/desorption equilibrium. Numerous research papers have provided comprehensive analyses and discussions on the topic of dye degradation [36,37,38,39,40]. However, the excellent performance can be attributed to the high surface area offered by the nanoparticles, making it a favorable choice for solar photocatalysis. The abundance of surface-active sites enhances interfacial charge carrier transfer during photocatalysis, leading to efficient adsorption of pollutants and achieving a higher degradation rate. In Figure 8c,d, the −ln (Ct/Co) plots exhibit a linear correlation with the irradiation time, indicating that the MO photodegradation follows a pseudo-first-order kinetic reaction. The figure also shows the linear relationship fit for 1% Ce-doped ZnO NPs, both before and after annealing, when exposed to UV and sunlight, respectively. ZnO NPs, when subjected to UV and sunlight, also demonstrate acceptable linear fits, as summarized in Table 3. The rate constants (k) for the degradation of MO dye, calculated using Equation (4) [41], demonstrate an approximately 1-fold increase in the reaction rate for non-annealed and annealed ZnO NPs under UV and sunlight. In contrast, for 1% Ce-doped ZnO NPs, k increases by approximately 2-fold under UV and 3-fold under sunlight for both non-annealed and annealed samples. This substantial enhancement in photocatalytic activity can be attributed to the annealing process, which enhances crystallization and other physical properties [42]. Additionally, the increased concentration of electron acceptors (Ce4+ ions) and oxygen vacancies, combined with precise doping with respect to Ce4+ ions in the ZnO nanostructure, contributes to the increased photocatalytic activity. Moreover, the presence of Ce4+ on the surface of ZnO NPs plays a crucial role in facilitating interfacial charge transfer and suppressing electron–hole recombination. As a result, Ce4+ may act as an electron scavenger during the degradation of the MO dye [27].
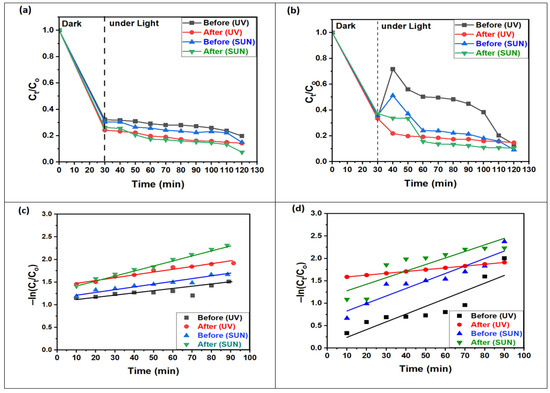
Figure 8.
Efficiency of relative concentrations of MO molecules photodegradation for (a) 1% Ce/ZnO NPs and (b) ZnO NPs; concentration decay of MO in logarithmic scale for (c) 1% Ce/ZnO NPs and (d) ZnO NPs (before and after annealing) under UV and solar light.
Table 3.
Rate constants (k min−1) with linear regressions (R2) for ZnO NPs and 1% Ce/ZnO NPs before and after annealing.
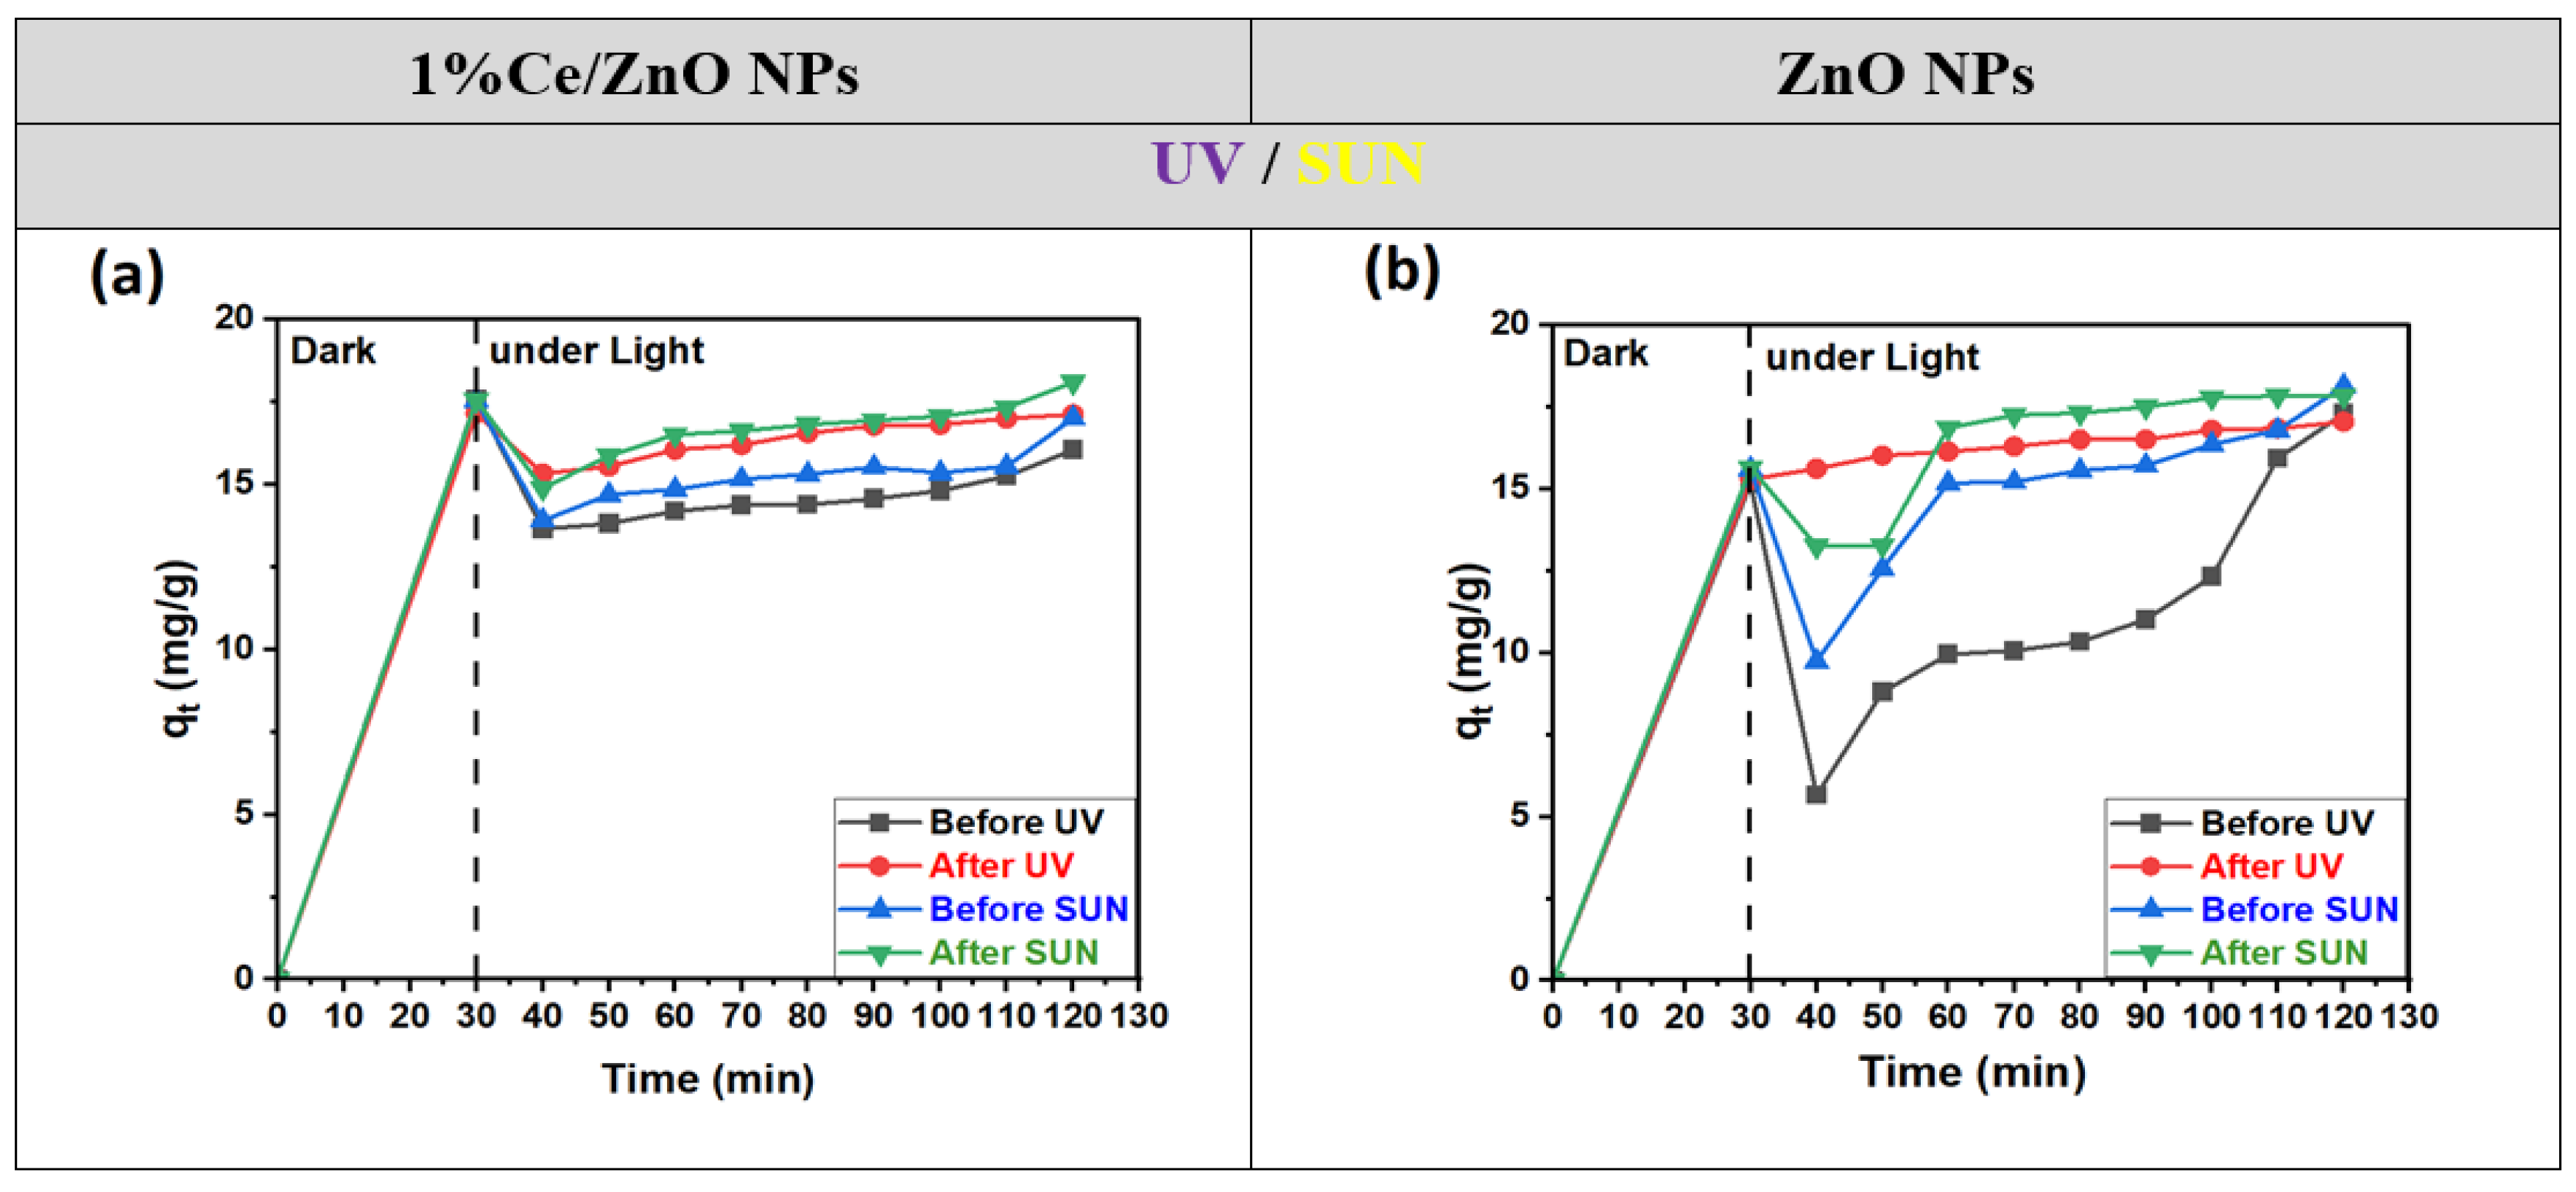
As observed from Figure 9, under optimized conditions, adsorption reaches equilibrium within 30 min for both 1% Ce-doped ZnO NPs and undoped ZnO, both before and after annealing. The adsorption capacity remains nearly consistent across all cases. Notably, 1% Ce-doped ZnO NPs exhibit higher adsorption capacities in the absence of light (dark conditions). Upon irradiation, their degradation performance is significantly enhanced, leading to complete photodegradation of MO within 90 min, both before and after annealing.
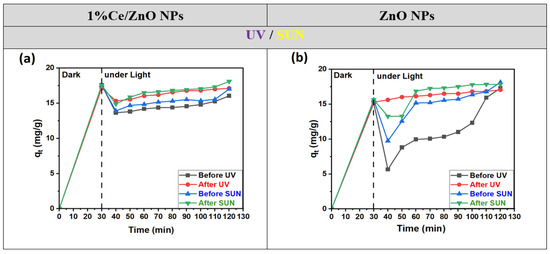
Figure 9.
Adsorption capacity of MO dye with time before and after annealing for (a) 1% Ce/ZnO NPs and (b) ZnO NPs photocatalysts, in the dark and under UV and sun radiation, respectively.
3.4. The Mechanisms of Action
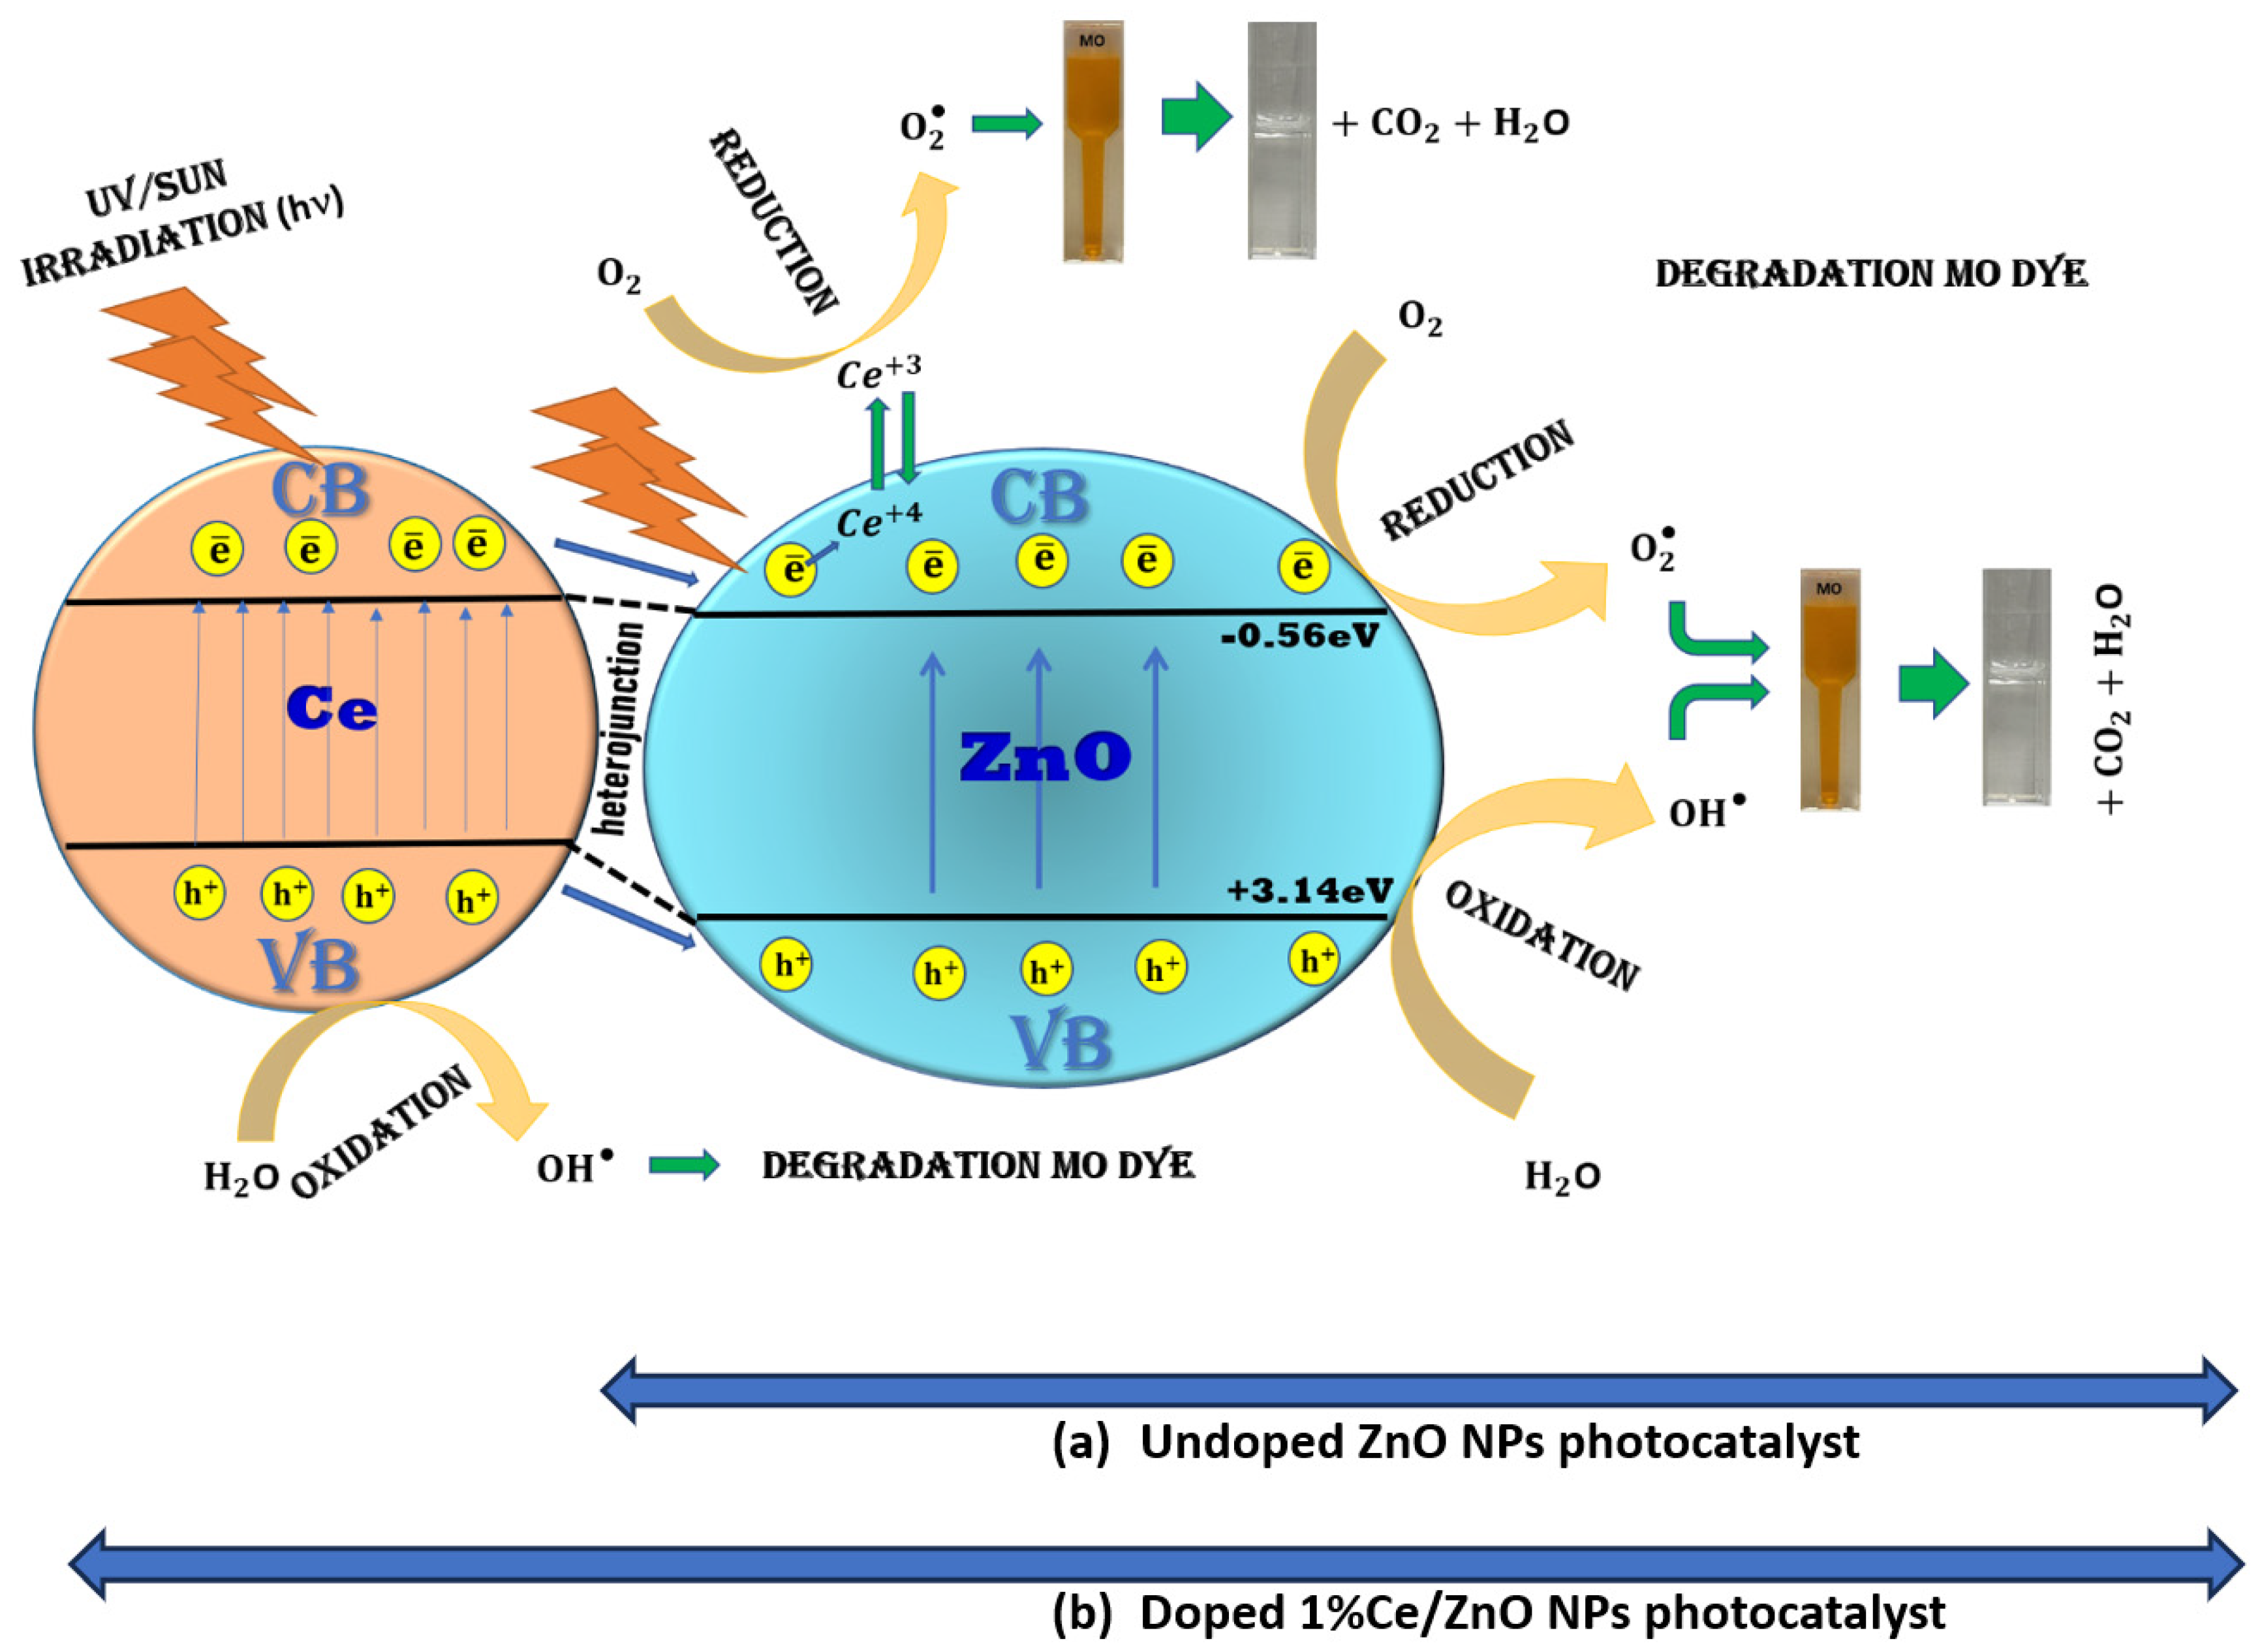
Figure 10 illustrates the proposed mechanisms responsible for the enhanced photocatalytic activity observed in undoped ZnO NPs and 1% Ce-doped ZnO NPs. In the case of undoped ZnO NPs, photocatalytic activity is achieved through oxidation and reduction reactions initiated by electromagnetic irradiation, generating electron–hole pairs on the surface of the ZnO NPs. The presence of photogenerated electrons in the conduction band (CB) with sufficient reduction power, and photogenerated holes in the valence band (VB) with high oxidation power, are essential for efficient photocatalytic reactions [5,11]. During photocatalysis, charge carriers such as electrons (e−) and holes (h+) are produced in CB and VB, respectively, in a photocatalyst upon light irradiation. These photogenerated holes have the ability to oxidize water molecules within the photocatalytic system or hydroxyl ions adsorbed on the catalyst’s surface, resulting in the formation of hydroxyl free radicals (•OH). Simultaneously, the photogenerated electrons interact with adsorbed oxygen molecules to produce superoxide anion radicals [43].
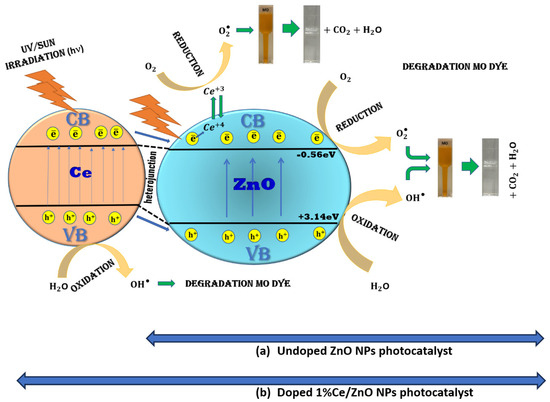
Figure 10.
Mechanisms of dye degradation on the surface of (a) undoped ZnO NPs photocatalyst and (b) doped 1% Ce/ZnO NPs photocatalyst.
However, identifying the major contributor between ROS species is very critical. The generation of ROS and their involvement in the oxidation of MO primarily relies on the appropriate potential of the band edges inherent in a photocatalyst. Hence, the following equations have been employed to compute the band-edge potentials:
where is the geometric mean of the absolute electronegativity of the constituent atoms, is the energy of free electrons on the hydrogen scale (~4.5 eV), is the photocatalyst’s band gap, is the conduction band potential, and is the valence band potential. Moreover, the Pearson absolute electronegativity values for Zn and O were 4.45 eV and 7.54 eV, respectively. The Eg values of ZnO estimated using a Tauc plot are 3.7 eV. As a result, the calculated and values of ZnO were −0.56 eV and +3.14 eV, respectively. The calculated energy values of the respective bands indicate that the ECB of ZnO is more negative than the reduction potential of O2 to O2•− (−0.28 eV). Therefore, electrons in the CB of ZnO are capable of producing superoxide anion radicals. The system has electrons in the CB (−0.56 eV) for O2•− generation and holes in the VB (+3.14 eV) of ZnO for •OH generation. Furthermore, the valence band maximal positions of ZnO were 3.14 eV [43,44]. On the other hand, for Ce-doped ZnO NPs, a distinct mechanism comes into play. It involves Ce4+ ions absorbing photoexcited electrons from the ZnO CB and reducing to Ce3+ ions. These Ce3+ ions are then oxidized by adsorbed O2 molecules, leading to the generation of superoxide radicals. These radicals, along with hydroxyl radicals, participate in the degradation of MO, resulting in the production of CO2 and H2O. The presence of Ce4+ on the surface of the ZnO NPs acts as an electron scavenger, and the O2•− radical anions further contribute to the formation of •OH radicals, which are responsible for the degradation of the dye. The slight reduction in the band gap energies observed in Ce-ZnO can be attributed to the presence of Ce ion-4f orbitals, enabling charge transfer between the VB and CB. In photocatalytic reactions, band gap energy plays a crucial role, and the generation of hydroxyl radicals is primarily governed by this energy level [5,11,26,45]. The photocatalytic efficiency of 1% Ce-doped ZnO was compared with other reported photocatalysts in the existing literature (Table S5).
4. Conclusions
In this study, we successfully synthesized ZnO NPs and Ce-doped ZnO NPs using CW and high-power CO2 laser decomposition methods. XRD analysis confirmed the successful incorporation of Ce ions into ZnO, revealing a secondary phase identified as CeO2 at a 1 wt % dopant concentration. Additionally, there was a variation in the optical band gap, transitioning from 3.7 eV for pure ZnO to 2.6 eV for undoped ZnO NPs, further decreasing to 2 eV for 1% Ce/ZnO NPs. This shift suggests that both doping and CO2 laser treatment influence particle size reduction and band gap modification. The investigation explored the effects of Ce doping on ZnO’s morphology, nanostructure, and optical properties. The photocatalytic activities of Ce-doped ZnO were evaluated for the degradation of MO dye, as the target pollutant, under both UV and sunlight exposure, utilizing annealed and non-annealed photocatalysts. Notably, the incorporation of Ce ions acted as an electron reservoir, reducing the rate of electron–hole pair recombination. Based on the experimental findings, it was determined that 1 wt % Ce doping represents the optimal condition for achieving maximum photoinduced oxidative catalytic degradation and complete MO dye degradation. The synthesis process offers a combination of low cost and high efficiency, yielding degradation of 92% under UV light and 95% under sunlight, positioning Ce-doped ZnO as a promising candidate for environmental remediation applications.
Supplementary Materials
The following supporting information can be downloaded at: https://www.mdpi.com/article/10.3390/app132111857/s1, Section S1. Synthesis of un-doped ZnO solution; Section S2. Synthesis Ce doped ZnO solution; Table S1: XRD data crystal parameters of undoped ZnO nanoparticles.; Table S2: XRD data crystal parameters of Ce 1% doped ZnO nanoparticles.; Table S3: Details measurement of ZnO NPs and 1%Ce-ZnO NPs via ImageJ software; Table S4: Lattice parameters, crystalline sizes, average particle sizes, and optical energy band gaps.; Table S5: Comparison of 1% Ce-doped ZnO NPs with other photocatalysts for the MO degradation. References [46,47] are cited in the supplementary materials.
Author Contributions
Conceptualization, N.M.A. and F.K.Y.; Methodology, A.H.A.; Software, I.A.W.; Validation, N.M.A., F.K.Y., Z.U.Z., I.A.W., K.H.I. and H.C.; Formal analysis, A.H.A.; Investigation, A.H.A.; Resources, A.M.B., O.A. and K.H.I.; Data curation, Z.U.Z.; Writing—original draft, A.H.A.; Writing—review & editing, H.C.; Visualization, H.C.; Supervision, N.M.A., F.K.Y., O.A. and K.H.I.; Project administration, Z.U.Z., A.M.B., O.A. and K.H.I.; Funding acquisition, A.M.B., O.A. and K.H.I. All authors have read and agreed to the published version of the manuscript.
Funding
The authors extend their appreciation to the Deputyship for Research & Innovation, Ministry of Education in Saudi Arabia for funding this research through the project number IFP-IMSIU-2023083. The authors also appreciate the Deanship of Scientific Research at Imam Mohammad Ibn Saud Islamic University (IMSIU) for supporting and supervising this project.
Institutional Review Board Statement
Not applicable.
Informed Consent Statement
Not applicable.
Data Availability Statement
Not applicable.
Acknowledgments
The authors are grateful to the School of Physics (USM) for research facilities. Also, the authors also appreciate the valuable assistance from Ahmad Alsadig (University of Trieste, Italy) throughout this work.
Conflicts of Interest
The authors declare no conflict of interest.
References
- Nguyen-Hong, Y.X.; Luu, T.V.H.; Doan, V.D. Green synthesis of Ce-doped ZnO nanoparticles using Hedyotis capitellata Leaf extract for efficient photocatalytic degradation of Methyl Orange. Vietnam. J. Chem. 2021, 59, 648–659. [Google Scholar]
- Dutta, P.; Rabbi, M.R.; Abu Sufian, M.; Mahjebin, S. Effects of textile dyeing effluent on the environment and its treatment: A review. Eng. Appl. Sci. Lett. 2022, 5, 1. [Google Scholar]
- Abdelhamid, M.; Korte, D.; Cabrera, H.; Pliekhova, O.; Ebrahimpour, Z.; Lavrenčič Štangar, U.; Franko, M. Thermo-Optical Characterization of Cu- and Zr-Modified TiO 2 Photocatalysts by Beam Deflection Spectrometry. Appl. Sci. 2021, 11, 10937. [Google Scholar] [CrossRef]
- Iqbal, J.; Jan, T.; Ismail, M.; Ahmad, N.; Arif, A.; Khan, M.; Adil, M.; Arshad, A. Influence of Mg doping level on morphology, optical, electrical properties and antibacterial activity of ZnO nanostructures. Ceram. Int. 2014, 40, 7487–7493. [Google Scholar] [CrossRef]
- Al Abri, R.; Al Marzouqi, F.; Kuvarega, A.T.; Meetani, M.A.; Al Kindy, S.M.; Karthikeyan, S.; Kim, Y.; Selvaraj, R. Nanostructured cerium-doped ZnO for photocatalytic degradation of pharmaceuticals in aqueous solution. J. Photochem. Photobiol. A Chem. 2019, 384, 112065. [Google Scholar] [CrossRef]
- Guan, Y.; Pedraza, A. Synthesis and alignment of Zn and ZnO nanoparticles by laser-assisted chemical vapor deposition. Nanotechnology 2008, 19, 045609. [Google Scholar] [CrossRef]
- Sethi, M.; Bhat, D.K. Facile solvothermal synthesis and high supercapacitor performance of NiCo2O4 nanorods. J. Alloys Compd. 2019, 781, 1013–1020. [Google Scholar] [CrossRef]
- Asma, F.; Prasetyo, W.; Nurhasanah, I. Synthesize of Cerium-doped ZnO nanoparticles as antioxidant agent. J. Phys. Conf. Ser. 2021, 2190, 012045. [Google Scholar] [CrossRef]
- Dao, T.-P.; Huang, S.-C. Design and multi-objective optimization for a broad self-amplified 2-DOF monolithic mechanism. Sādhanā 2017, 42, 1527–1542. [Google Scholar] [CrossRef]
- Ai, J.P.; Liao, W.X.; Luo, S.S.; Zhou, T.; Cheng, L.H.; Chen, Z.Q.; Chen, Y.; Yang, Y.L.; Li, W.K. Hydrothermal Method Preparation of Flower-Like Ce-Doped ZnO as an Efficient Photocatalyst. Solid State Phenom. 2018, 281, 872–877. [Google Scholar] [CrossRef]
- Lang, J.; Wang, J.; Zhang, Q.; Li, X.; Han, Q.; Wei, M.; Sui, Y.; Wang, D.; Yang, J. Chemical precipitation synthesis and significant enhancement in photocatalytic activity of Ce-doped ZnO nanoparticles. Ceram. Int. 2016, 42, 14175–14181. [Google Scholar] [CrossRef]
- Chouchene, B.; Chaabane, T.B.; Balan, L.; Girot, E.; Mozet, K.; Medjahdi, G.; Schneider, R. High performance Ce-doped ZnO nanorods for sunlight-driven photocatalysis. Beilstein J. Nanotechnol. 2016, 7, 1338–1349. [Google Scholar] [CrossRef]
- Faisal, M.; Ismail, A.A.; Ibrahim, A.A.; Bouzid, H.; Al-Sayari, S.A. Highly efficient photocatalyst based on Ce doped ZnO nanorods: Controllable synthesis and enhanced photocatalytic activity. Chem. Eng. J. 2013, 229, 225–233. [Google Scholar] [CrossRef]
- Kumar, R.; Umar, A.; Kumar, G.; Akhtar, M.; Wang, Y.; Kim, S. Ce-doped ZnO nanoparticles for efficient photocatalytic degradation of direct red-23 dye. Ceram. Int. 2015, 41, 7773–7782. [Google Scholar] [CrossRef]
- Baig, F.; Ashraf, M.W.; Asif, A.; Imran, M. A comparative analysis for effects of solvents on optical properties of Mg doped ZnO thin films for optoelectronic applications. Optik 2020, 208, 164534. [Google Scholar] [CrossRef]
- Poondi, D.; Subramanian, R.; Otooni, M.; Singh, J. Synthesis of Silver Nanoparticles by a Laser–Liquid–Solid Interaction Technique. J. Mater. Synth. Process. 1998, 6, 89–104. [Google Scholar] [CrossRef]
- Abebe, B.; Murthy, H.A.; Amare, E. Enhancing the photocatalytic efficiency of ZnO: Defects, heterojunction, and optimization. Environ. Nanotechnol. Monit. Manag. 2020, 14, 100336. [Google Scholar] [CrossRef]
- Rajendran, S.; Khan, M.M.; Gracia, F.; Qin, J.; Gupta, V.K.; Arumainathan, S. Ce3+-ion-induced visible-light photocatalytic degradation and electrochemical activity of ZnO/CeO2 nanocomposite. Sci. Rep. 2016, 6, 31641. [Google Scholar] [CrossRef]
- Elsayed, M.S.; Ahmed, I.A.; Bader, D.M.; Hassan, A.F. Green synthesis of nano zinc oxide/nanohydroxyapatite composites using date palm pits extract and eggshells: Adsorption and photocatalytic degradation of methylene blue. Nanomaterials 2021, 12, 49. [Google Scholar] [CrossRef]
- Fauteux, C.; Longtin, R.; Pegna, J.; Therriault, D. Fast synthesis of ZnO nanostructures by laser-induced decomposition of zinc acetylacetonate. Inorg. Chem. 2007, 46, 11036–11047. [Google Scholar] [CrossRef]
- Inaba, H.; Ito, H. Observation of power-dependent distortion of an infrared beam at 10.6 μm from a CO2 laser during propagation in liquids. IEEE J. Quantum Electron. 1968, 4, 45–48. [Google Scholar] [CrossRef]
- Jaleh, B.; Nasrollahzadeh, M.; Mohazzab, B.F.; Eslamipanah, M.; Sajjadi, M.; Ghafuri, H. State-of-the-art technology: Recent investigations on laser-mediated synthesis of nanocomposites for environmental remediation. Ceram. Int. 2021, 47, 10389–10425. [Google Scholar] [CrossRef]
- Bonardi, A.-H.l.; Dumur, F.d.r.; Gigmes, D.; Xu, Y.-Y.; Lalevée, J. Light-induced thermal decomposition of alkoxyamines upon infrared CO2 laser: Toward spatially controlled polymerization of methacrylates in laser write experiments. ACS Omega 2020, 5, 3043–3046. [Google Scholar] [CrossRef] [PubMed]
- Xin, M. Crystal structure and optical properties of ZnO: Ce nano film. Molecules 2022, 27, 5308. [Google Scholar] [CrossRef]
- Rodwihok, C.; Choopun, S.; Ruankham, P.; Gardchareon, A.; Phadungdhitidhada, S.; Wongratanaphisan, D. UV sensing properties of ZnO nanowires/nanorods. Appl. Surf. Sci. 2019, 477, 159–165. [Google Scholar] [CrossRef]
- Rodwihok, C.; Wongratanaphisan, D.; Tam, T.V.; Choi, W.M.; Hur, S.H.; Chung, J.S. Cerium-oxide-nanoparticle-decorated zinc oxide with enhanced photocatalytic degradation of methyl orange. Appl. Sci. 2020, 10, 1697. [Google Scholar] [CrossRef]
- Kannadasan, N.; Shanmugam, N.; Cholan, S.; Sathishkumar, K.; Viruthagiri, G.; Poonguzhali, R. The effect of Ce4+ incorporation on structural, morphological and photocatalytic characters of ZnO nanoparticles. Mater. Charact. 2014, 97, 37–46. [Google Scholar] [CrossRef]
- Wang, P.; Meng, F.; Gao, C.; Xie, W.; Wang, J.; Li, A. Structural, morphological and optical characteristics of fusiform Co-doped CeO 2 via a facile hydrothermal method. J. Mater. Sci. Mater. Electron. 2018, 29, 11482–11488. [Google Scholar] [CrossRef]
- Jiang, J.; Zhang, K.; Chen, X.; Zhao, F.; Xie, T.; Wang, D.; Lin, Y. Porous Ce-doped ZnO hollow sphere with enhanced photodegradation activity for artificial waste water. J. Alloys Compd. 2017, 699, 907–913. [Google Scholar] [CrossRef]
- Abdelouhab, Z.A.; Djouadi, D.; Chelouche, A.; Hammiche, L.; Touam, T. Structural and morphological characterizations of pure and Ce-doped ZnO nanorods hydrothermally synthesized with different caustic bases. Mater. Sci.-Pol. 2020, 38, 228–235. [Google Scholar] [CrossRef]
- Djouadi, D.; Slimi, O.; Hammiche, L.; Chelouche, A.; Touam, T. Effects of (Ce, Cu) Co-doping on the Structural and Optical Properties of ZnO Aerogels Synthesized in Supercritical Ethanol. J. Phys. Conf. Ser. 2018, 987, 012008. [Google Scholar] [CrossRef]
- Mohammed, M.; Abdul Razak, A.A.; Hussein Al-Timimi, D.A. Modified multiwalled carbon nanotubes for treatment of some organic dyes in wastewater. Adv. Mater. Sci. Eng. 2014, 2014, 201052. [Google Scholar] [CrossRef]
- Phokha, S.; Pinitsoontorn, S.; Chirawatkul, P.; Poo-Arporn, Y.; Maensiri, S. Synthesis, characterization, and magnetic properties of monodisperse CeO2 nanospheres prepared by PVP-assisted hydrothermal method. Nanoscale Res. Lett. 2012, 7, 1–13. [Google Scholar] [CrossRef]
- Tarat, A.; Nettle, C.J.; Bryant, D.T.; Jones, D.R.; Penny, M.W.; Brown, R.A.; Majitha, R.; Meissner, K.E.; Maffeis, T.G. Microwave-assisted synthesis of layered basic zinc acetate nanosheets and their thermal decomposition into nanocrystalline ZnO. Nanoscale Res. Lett. 2014, 9, 11. [Google Scholar] [CrossRef]
- Sfirloaga, P.; Ivanovici, M.-G.; Poienar, M.; Ianasi, C.; Vlazan, P. Investigation of Catalytic and Photocatalytic Degradation of Methyl Orange Using Doped LaMnO3 Compounds. Processes 2022, 10, 2688. [Google Scholar] [CrossRef]
- Wang, Q.; Zhao, S.; Zhao, Y.; Deng, Y.; Yang, W.; Ye, Y.; Wang, K. Construction of Z-scheme Bi2O3/CeO2 heterojunction for enhanced photocatalytic capacity of TiO2 NTs. Spectrochim. Acta Mol. Biomol. Spectrosc. 2023, 304, 123405. [Google Scholar] [CrossRef] [PubMed]
- Wang, Q.; Zhao, Y.; Zhang, Z.; Liao, S.; Deng, Y.; Wang, X.; Ye, Q.; Wang, K. Hydrothermal preparation of Sn3O4/TiO2 nanotube arrays as effective photocatalysts for boosting photocatalytic dye degradation and hydrogen production. Ceram. Int. 2023, 49, 5977–5985. [Google Scholar] [CrossRef]
- Wang, Q.; Zhu, S.; Zhao, S.; Li, C.; Wang, R.; Cao, D.; Liu, G. Construction of Bi-assisted modified CdS/TiO2 nanotube arrays with ternary S-scheme heterojunction for photocatalytic wastewater treatment and hydrogen production. Fuel 2022, 322, 124163. [Google Scholar] [CrossRef]
- Jia, Y.; Liu, P.; Wang, Q.; Wu, Y.; Cao, D.; Qiao, Q.-A. Construction of Bi2S3-BiOBr nanosheets on TiO2 NTA as the effective photocatalysts: Pollutant removal, photoelectric conversion and hydrogen generation. J. Colloid Interface Sci. 2021, 585, 459–469. [Google Scholar] [CrossRef]
- Wang, Q.; Li, H.; Yu, X.; Jia, Y.; Chang, Y.; Gao, S. Morphology regulated Bi2WO6 nanoparticles on TiO2 nanotubes by solvothermal Sb3+ doping as effective photocatalysts for wastewater treatment. Electrochim. Acta 2020, 330, 135167. [Google Scholar] [CrossRef]
- Pathak, T.K.; Coetsee-Hugo, E.; Swart, H.; Swart, C.; Kroon, R. Preparation and characterization of Ce doped ZnO nanomaterial for photocatalytic and biological applications. Mater. Sci. Eng. B 2020, 261, 114780. [Google Scholar] [CrossRef]
- Palneedi, H.; Park, J.H.; Maurya, D.; Peddigari, M.; Hwang, G.T.; Annapureddy, V.; Kim, J.W.; Choi, J.J.; Hahn, B.D.; Priya, S. Laser processing of metal oxides: Laser irradiation of metal oxide films and nanostructures: Applications and advances (Adv. Mater. 14/2018). Adv. Mater. 2018, 30, 1870094. [Google Scholar] [CrossRef]
- Mateen, S.; Nawaz, R.; Qamar, M.T.; Ali, S.; Iqbal, S.; Aslam, M.; Raheel, M.; Awwad, N.S.; Ibrahium, H.A. Integration of WO3-Doped MoO3 with ZnO Photocatalyst for the Removal of 2-Nitrophenol in Natural Sunlight Illumination. Catalysts 2023, 13, 1262. [Google Scholar] [CrossRef]
- Cao, Q.; Li, Q.; Pi, Z.; Zhang, J.; Sun, L.-W.; Xu, J.; Cao, Y.; Cheng, J.; Bian, Y. Metal–organic-framework-derived ball-flower-like porous Co3O4/Fe2O3 heterostructure with enhanced visible-light-driven photocatalytic activity. Nanomaterials 2022, 12, 904. [Google Scholar] [CrossRef]
- Alahiane, S.; Sennaoui, A.; Sakr, F.; Qourzal, S.; Dinne, M.; Assabbane, A. A study of the photocatalytic degradation of the textile dye Reactive Yellow 17 in aqueous solution by TiO2-coated non-woven fibres in a batch photoreactor. J. Mater. Environ. Sci. 2017, 8, 3556–3563. [Google Scholar]
- Kumar, M.; Chauhan, M.S.; Akhtar, M.S.; Umar, A. Effect of cerium ions in Ce-Doped ZnO nanostructures on their photocatalytic and picric acid chemical sensing. Ceram. Int. 2021, 47, 3089–3098. [Google Scholar] [CrossRef]
- Djaja, N.F.; Saleh, R. Characteristics and photocatalytics activities of Ce-doped ZnO nanoparticles. Mater. Sci. Appl. 2013, 4, 145. [Google Scholar] [CrossRef]

Disclaimer/Publisher’s Note: The statements, opinions and data contained in all publications are solely those of the individual author(s) and contributor(s) and not of MDPI and/or the editor(s). MDPI and/or the editor(s) disclaim responsibility for any injury to people or property resulting from any ideas, methods, instructions or products referred to in the content. |
© 2023 by the authors. Licensee MDPI, Basel, Switzerland. This article is an open access article distributed under the terms and conditions of the Creative Commons Attribution (CC BY) license (https://creativecommons.org/licenses/by/4.0/).