
Laboratory Tests and Numerical Simulation of the Thermal–Mechanical Response of a Fiber-Reinforced Phase Change Concrete Pile

 , ,
, , 
Abstract
:1. Introduction
2. Model Test
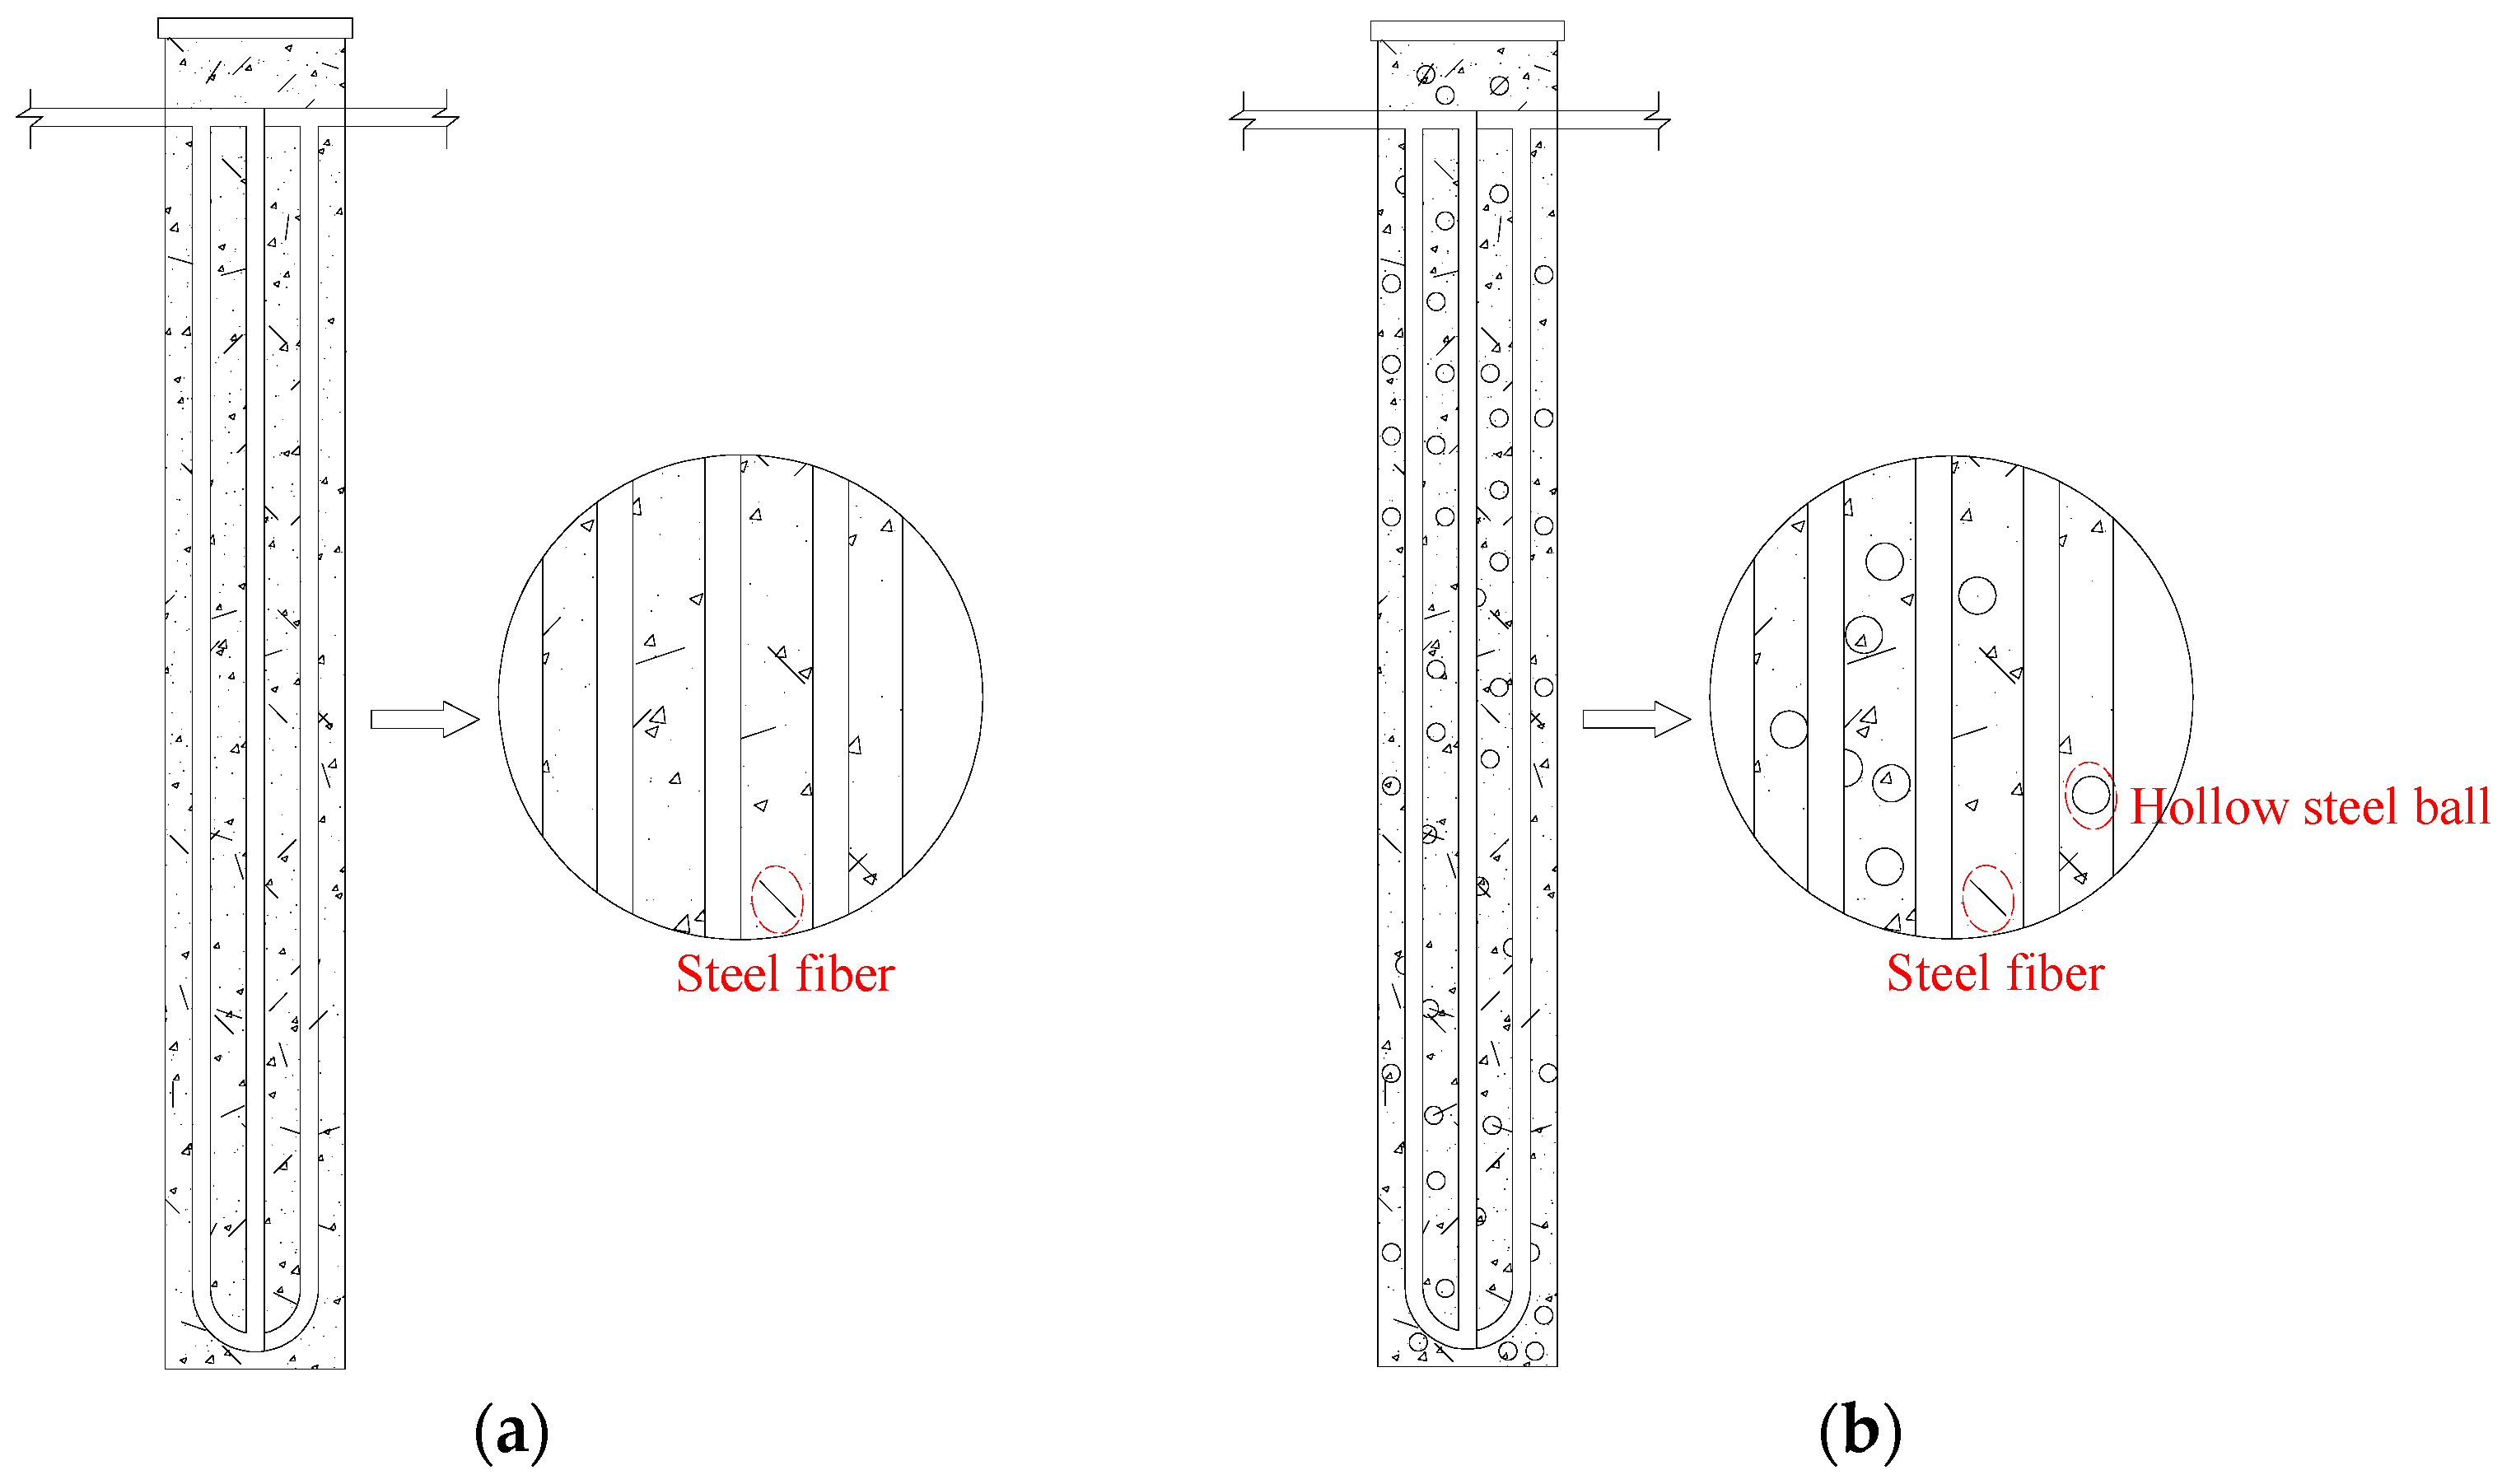
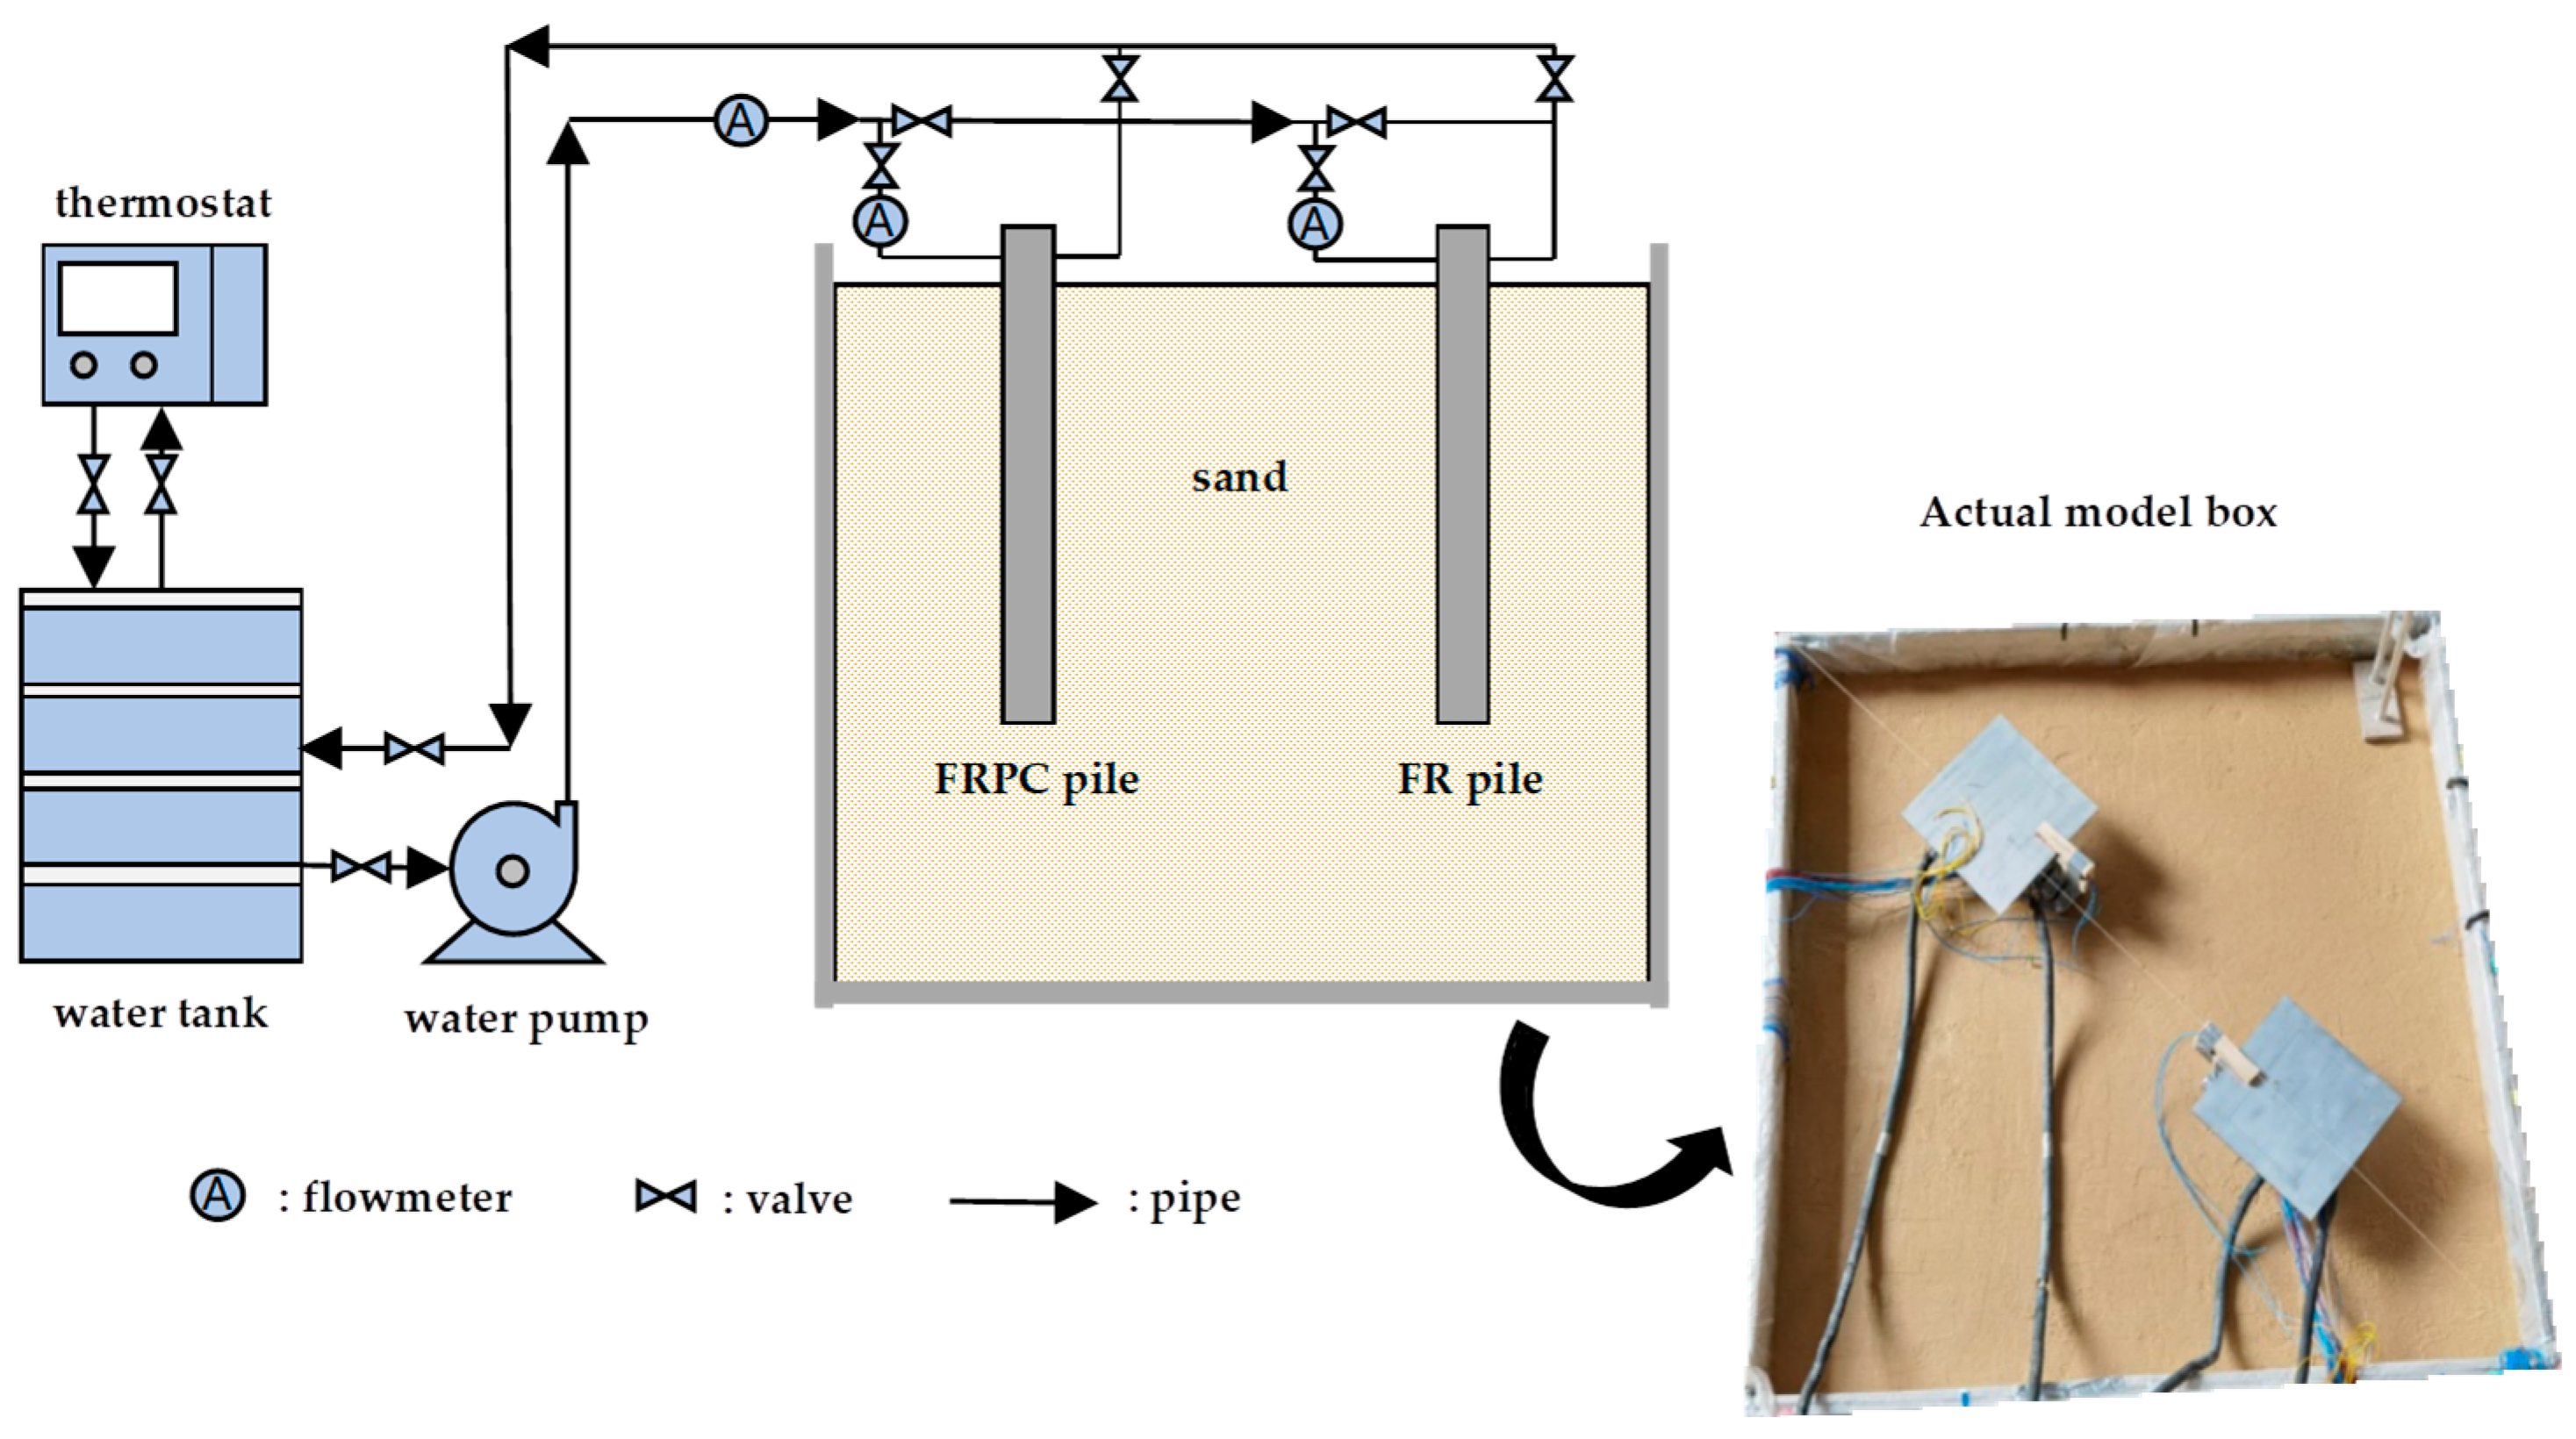
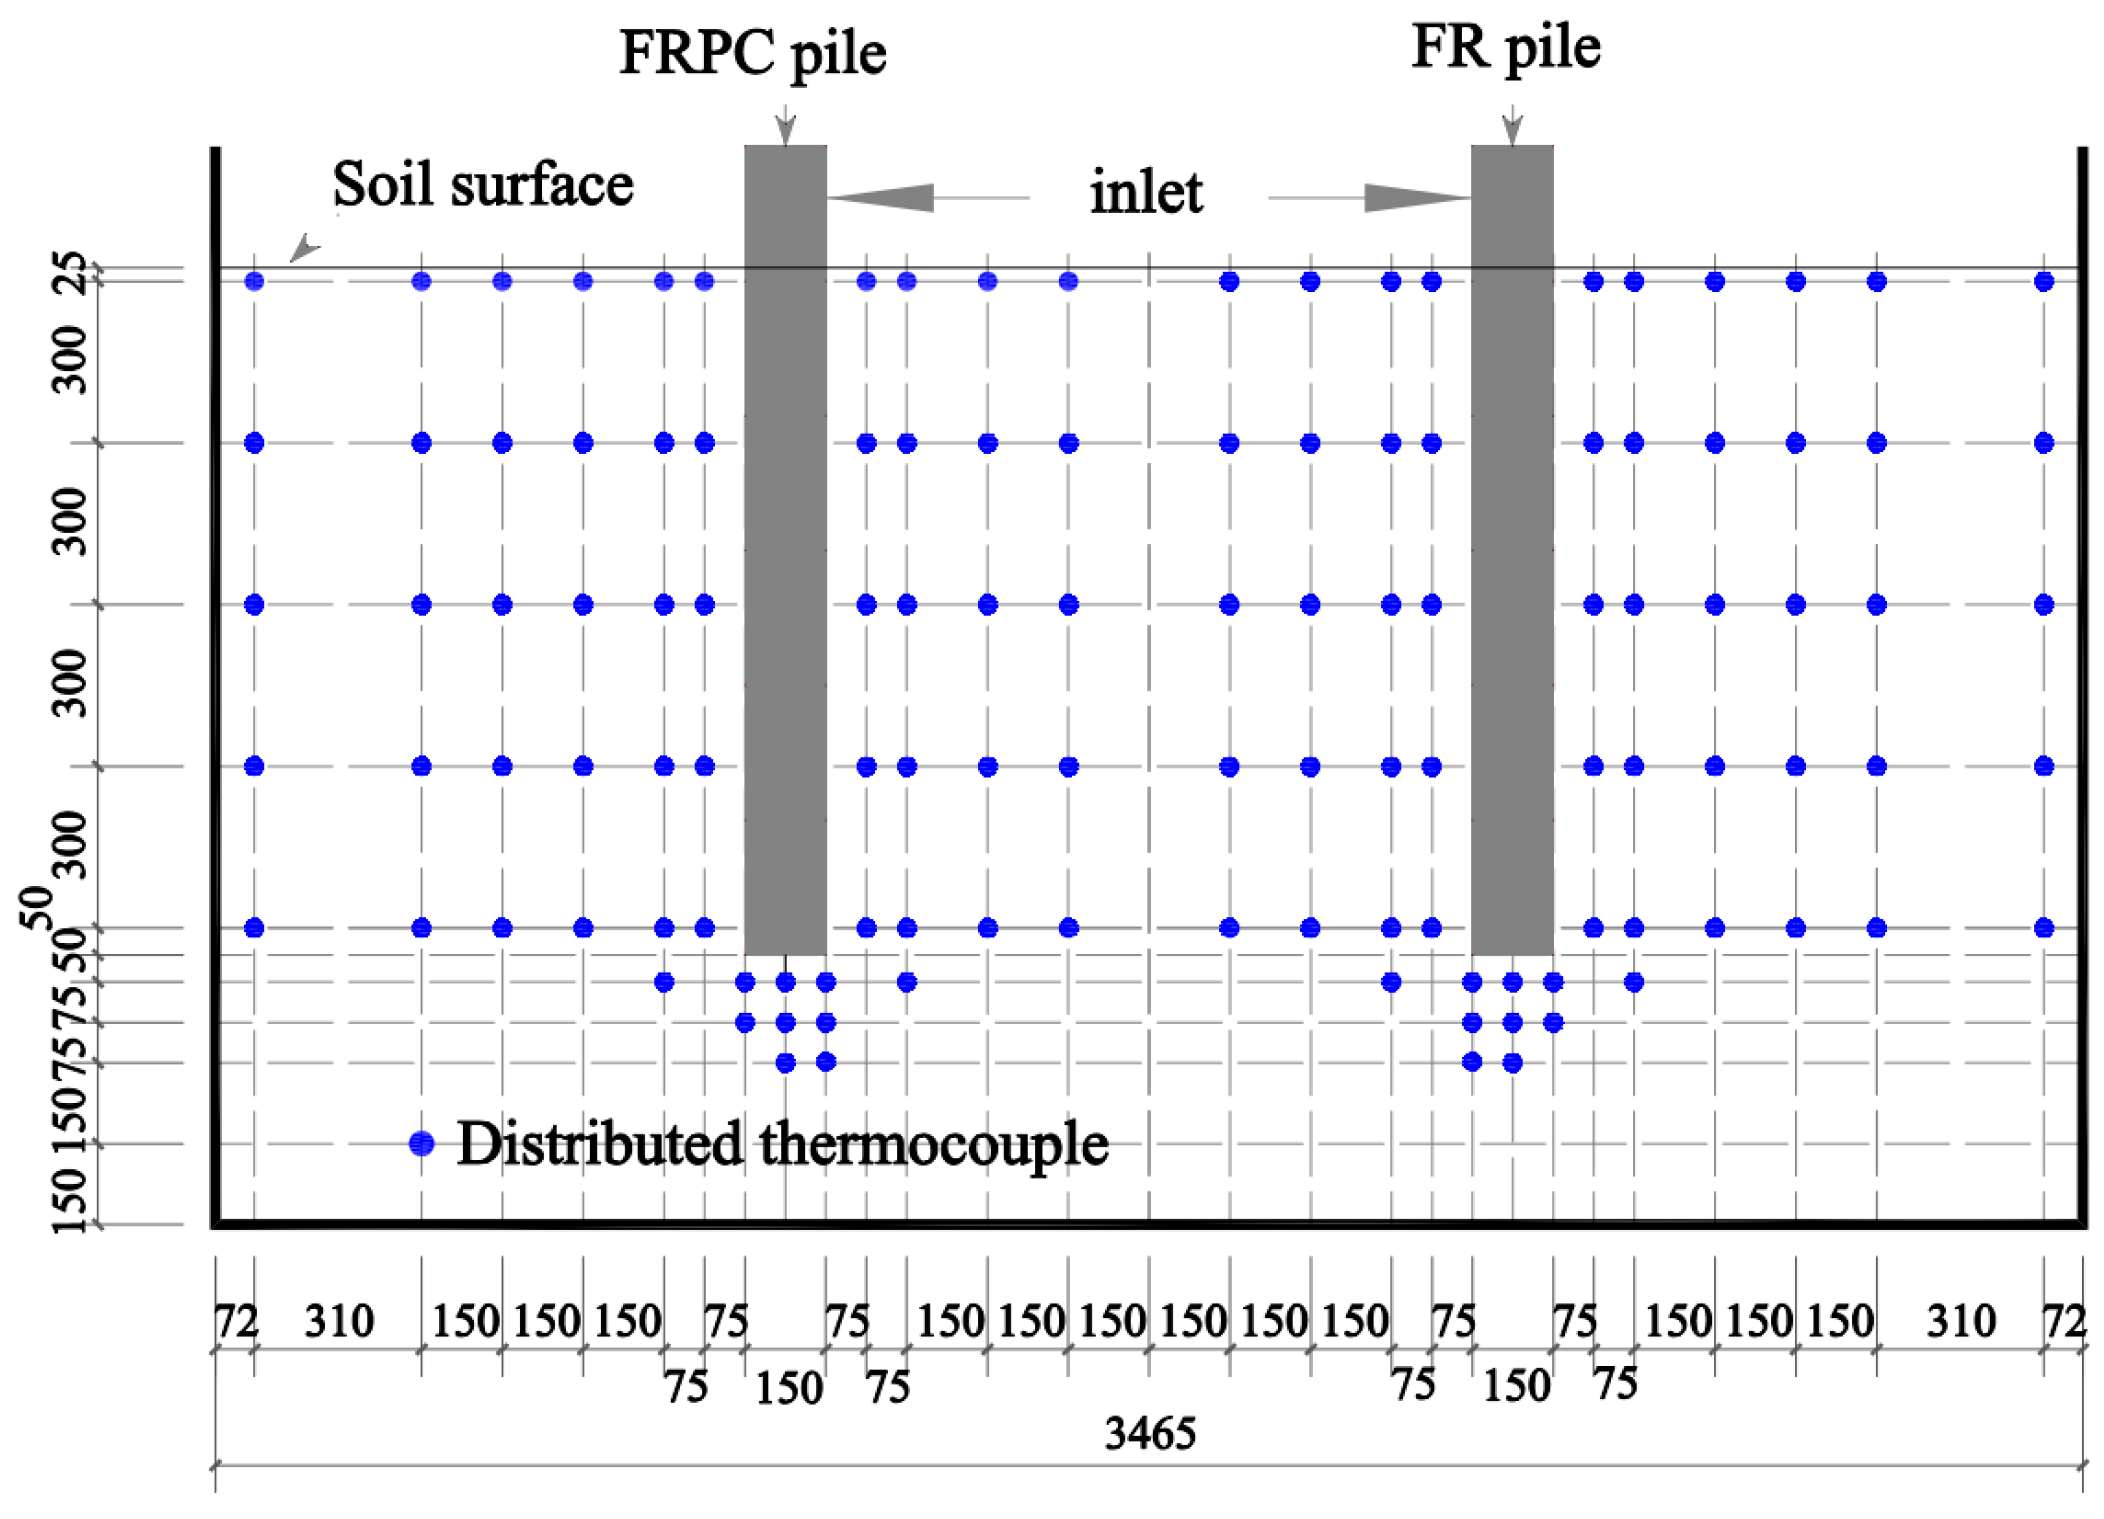
2.1. Test Device
2.2. Test Conditions
2.3. Thermal Parameters of Materials
2.4. Test Error Analysis
3. Numerical Simulation
3.1. Basic Assumption
- Changes in the thermal parameters of materials, such as thermal conductivity, elastic modulus, and specific heat capacity, were not considered when there was a temperature change.
- It was assumed that heat exchange occurred only through heat conduction between the sand and water, without considering the heat convection of the soil’s pore water.
3.2. Governing Equations
- (1)
- Non-isothermal pipe flow
- (2)
- Heat transfer in solids
- (3)
- Phase change interface
3.3. Finite Element Model
4. Results and Discussions
4.1. Comparison of Tests and Simulation Results
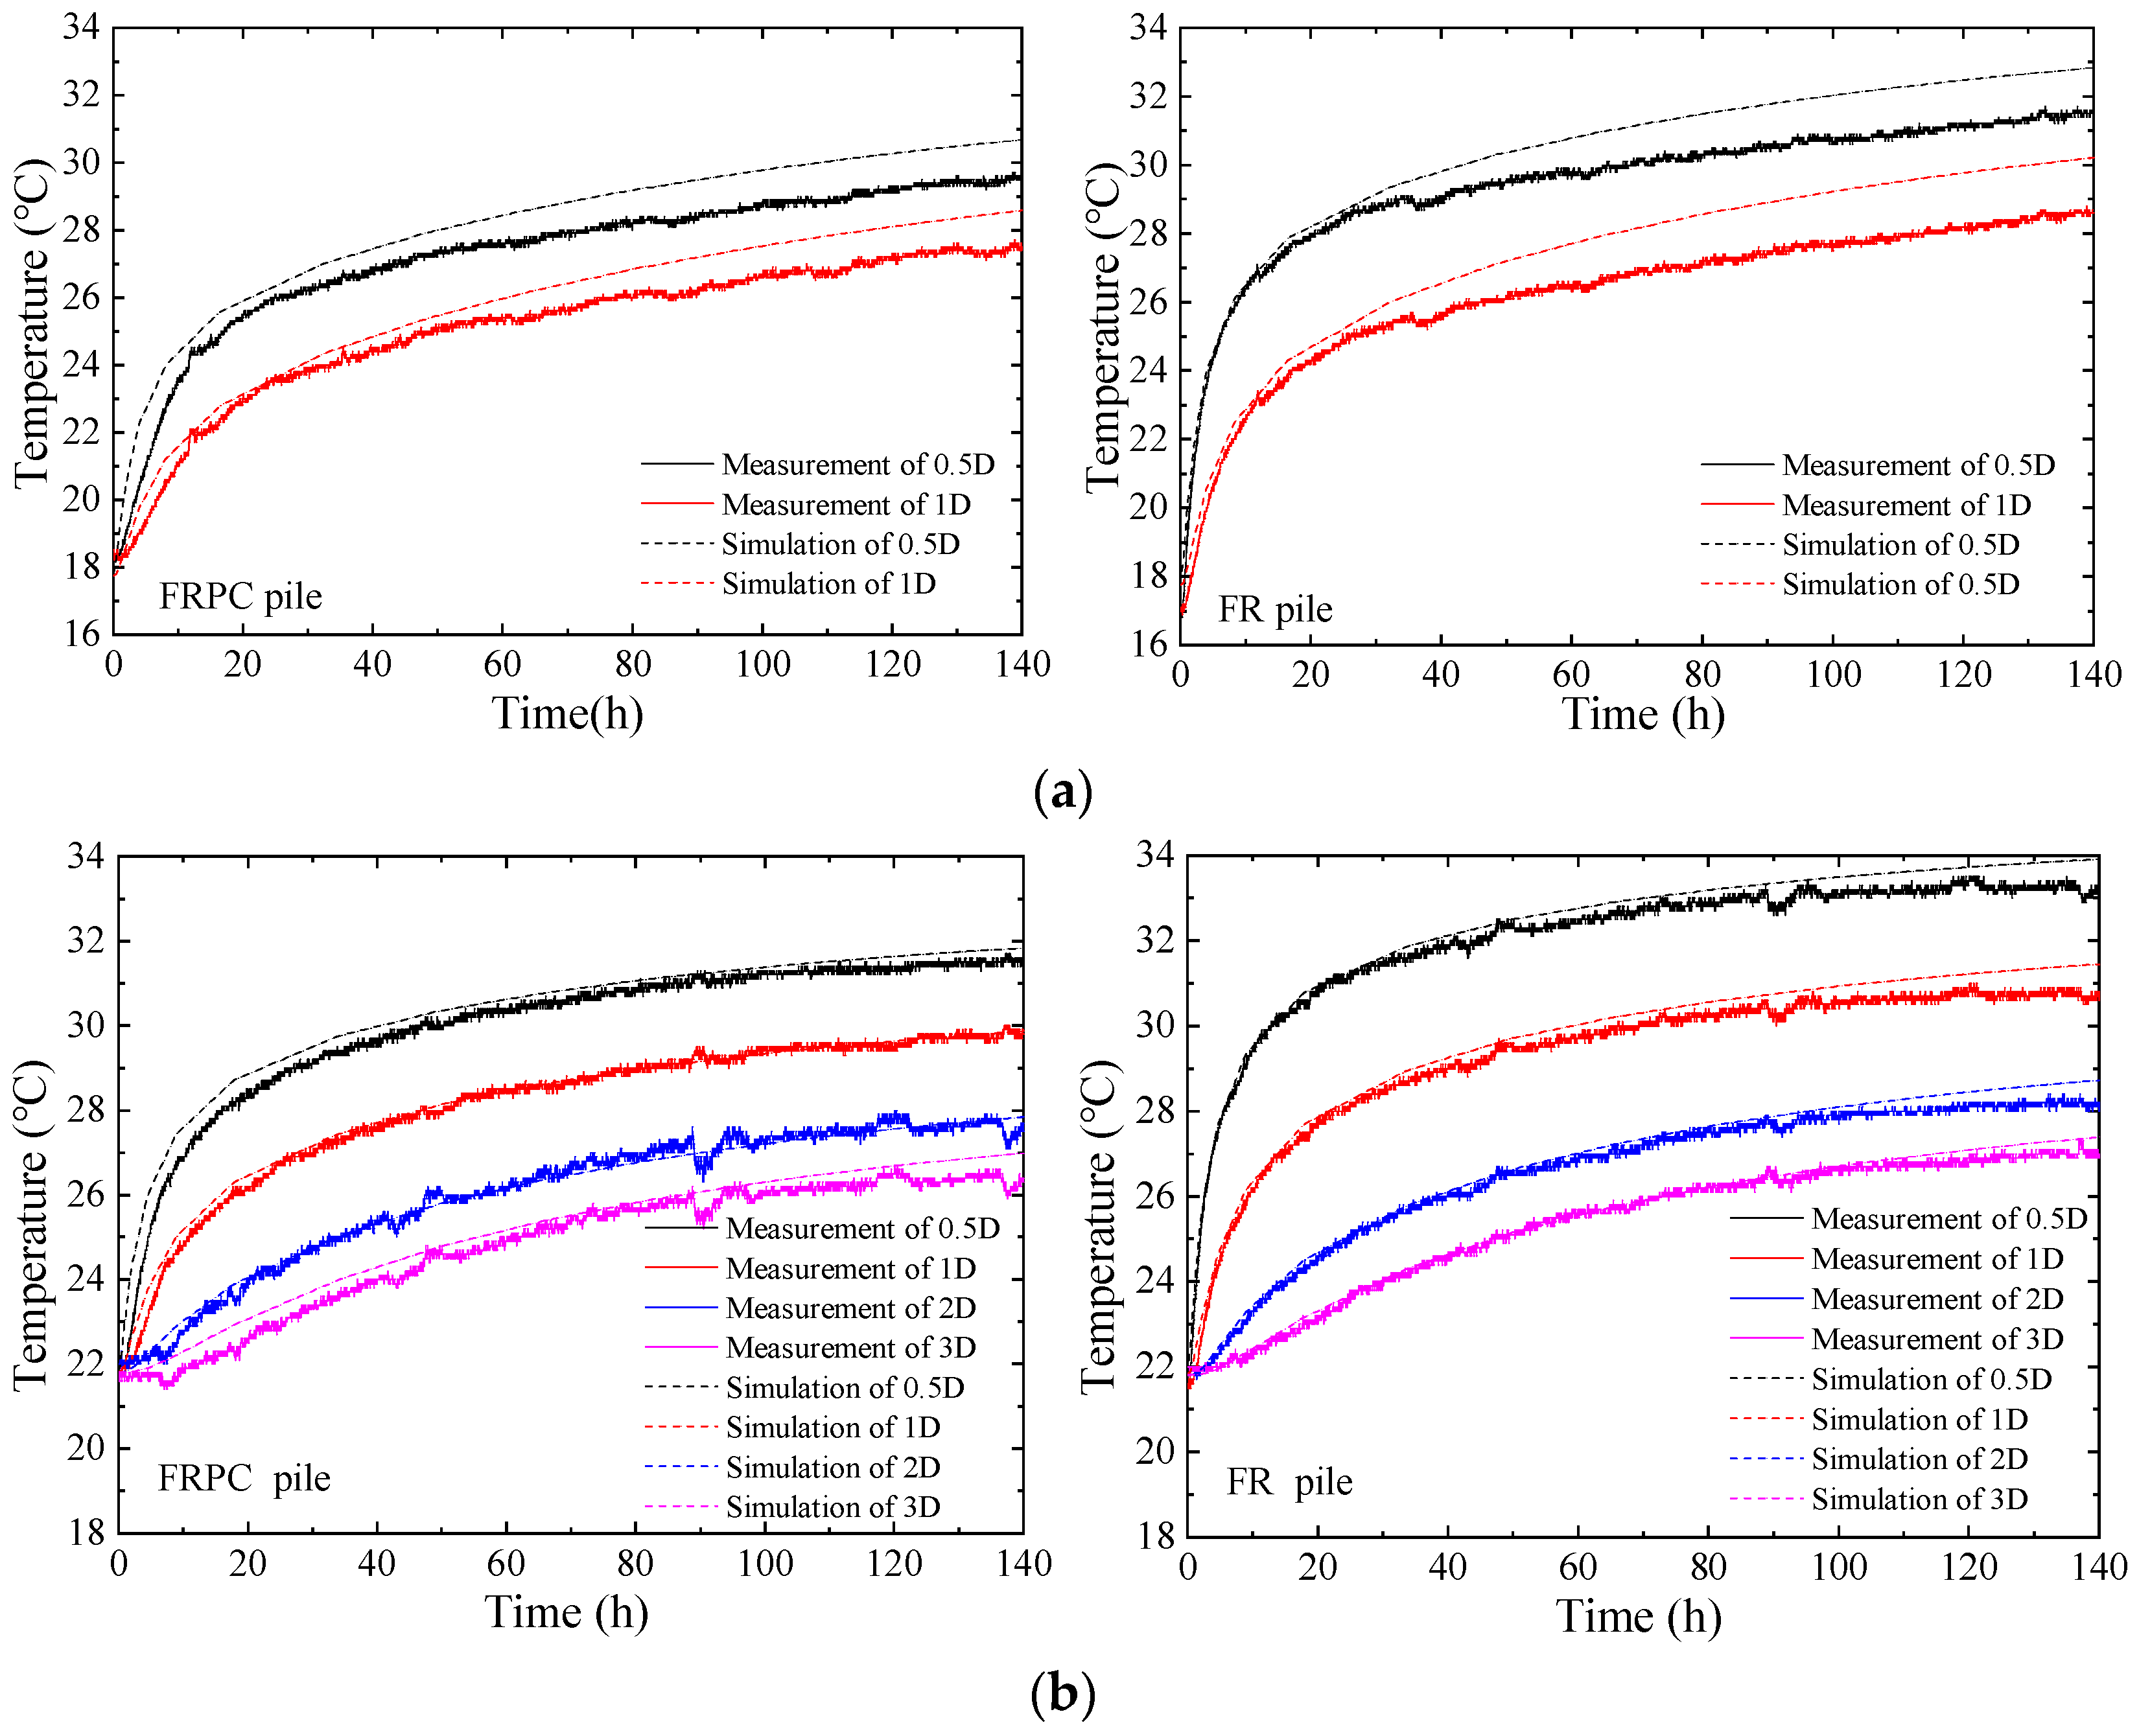
4.1.1. Horizontal Temperature Change
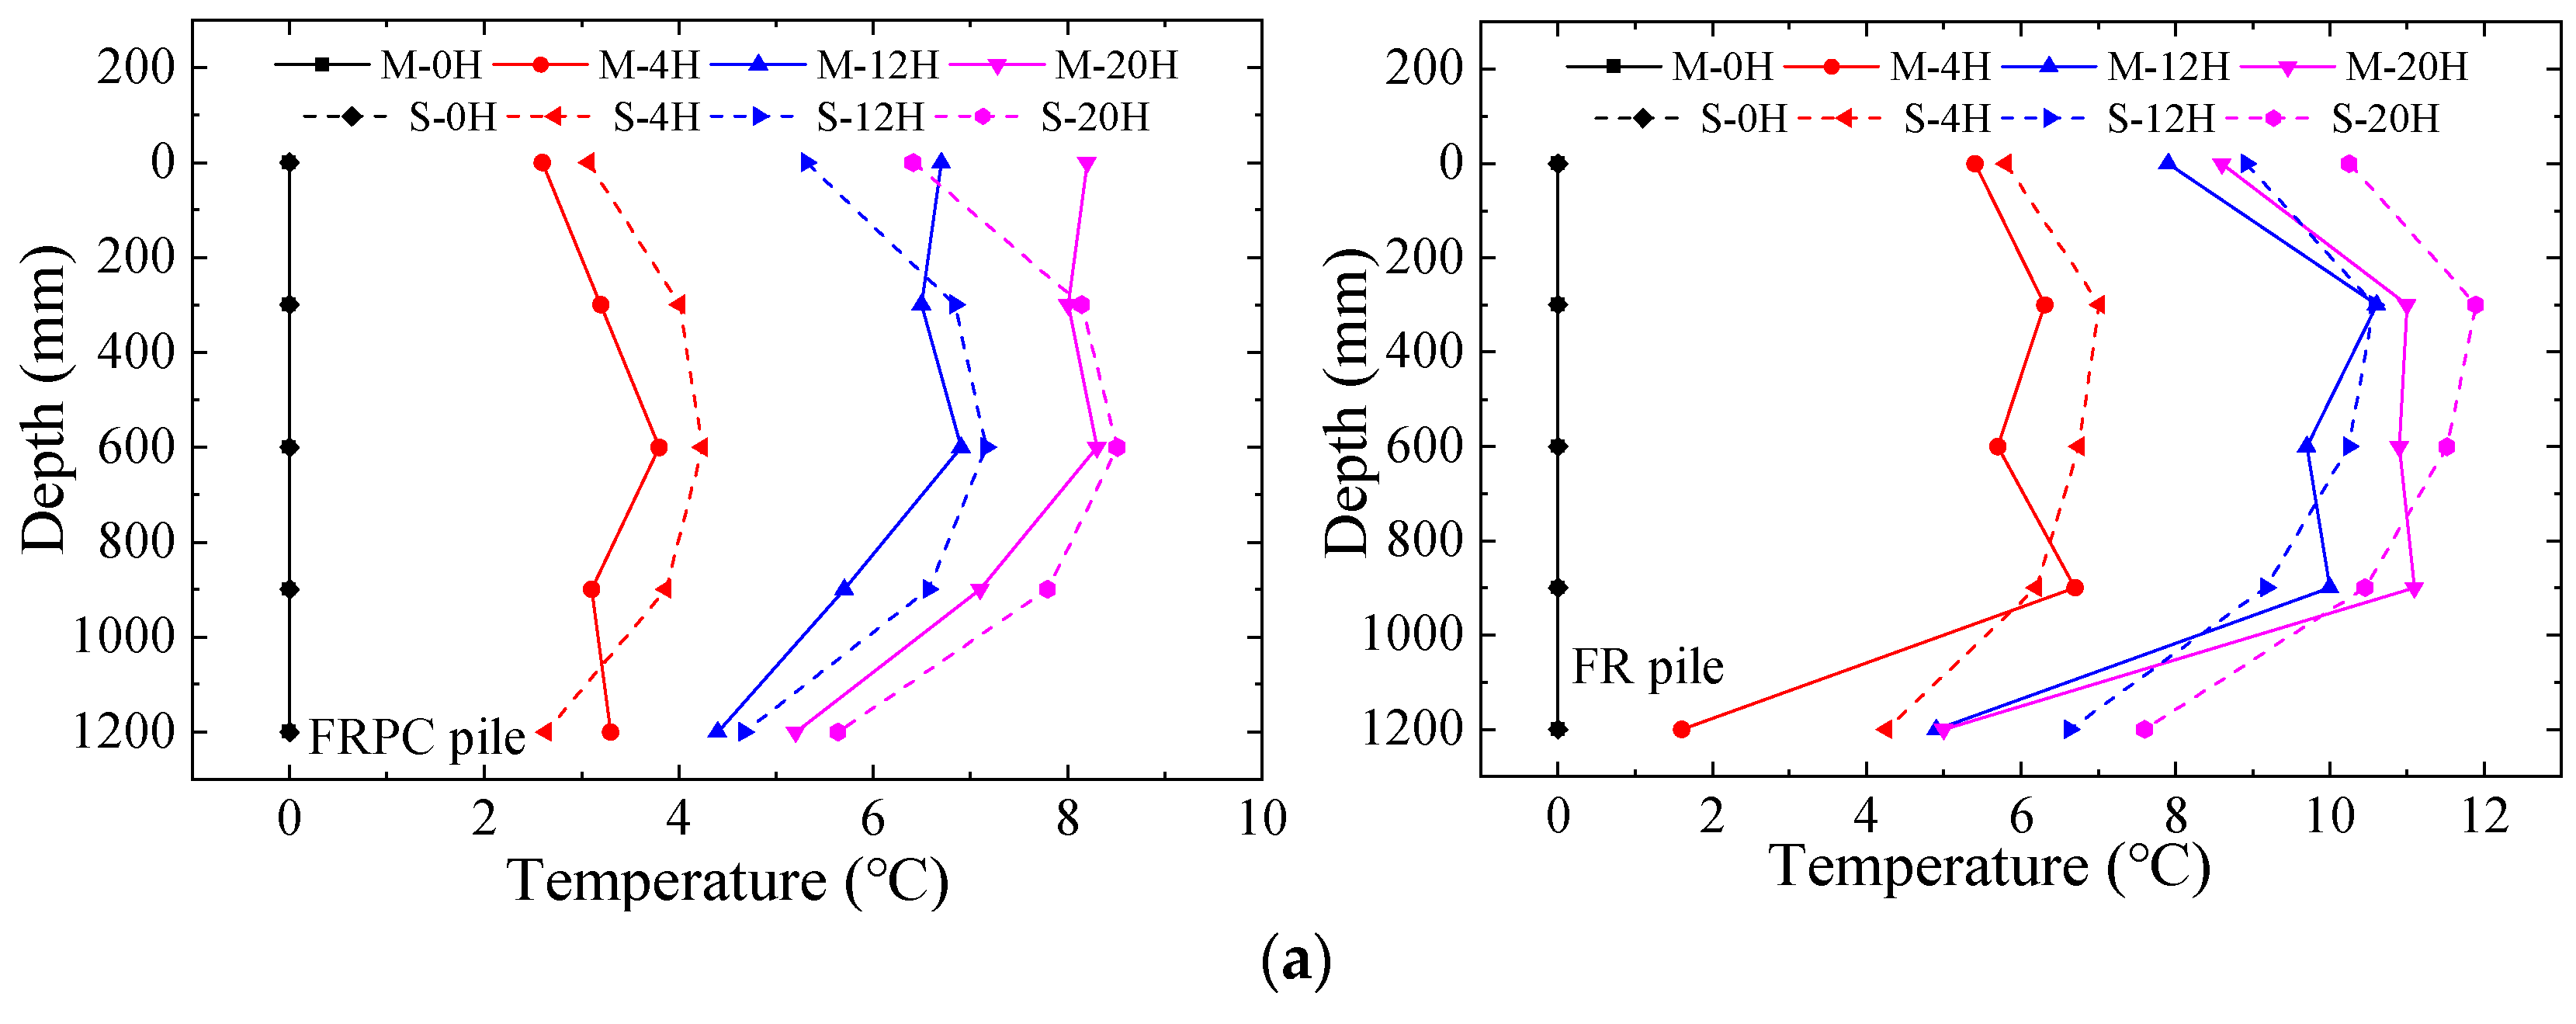
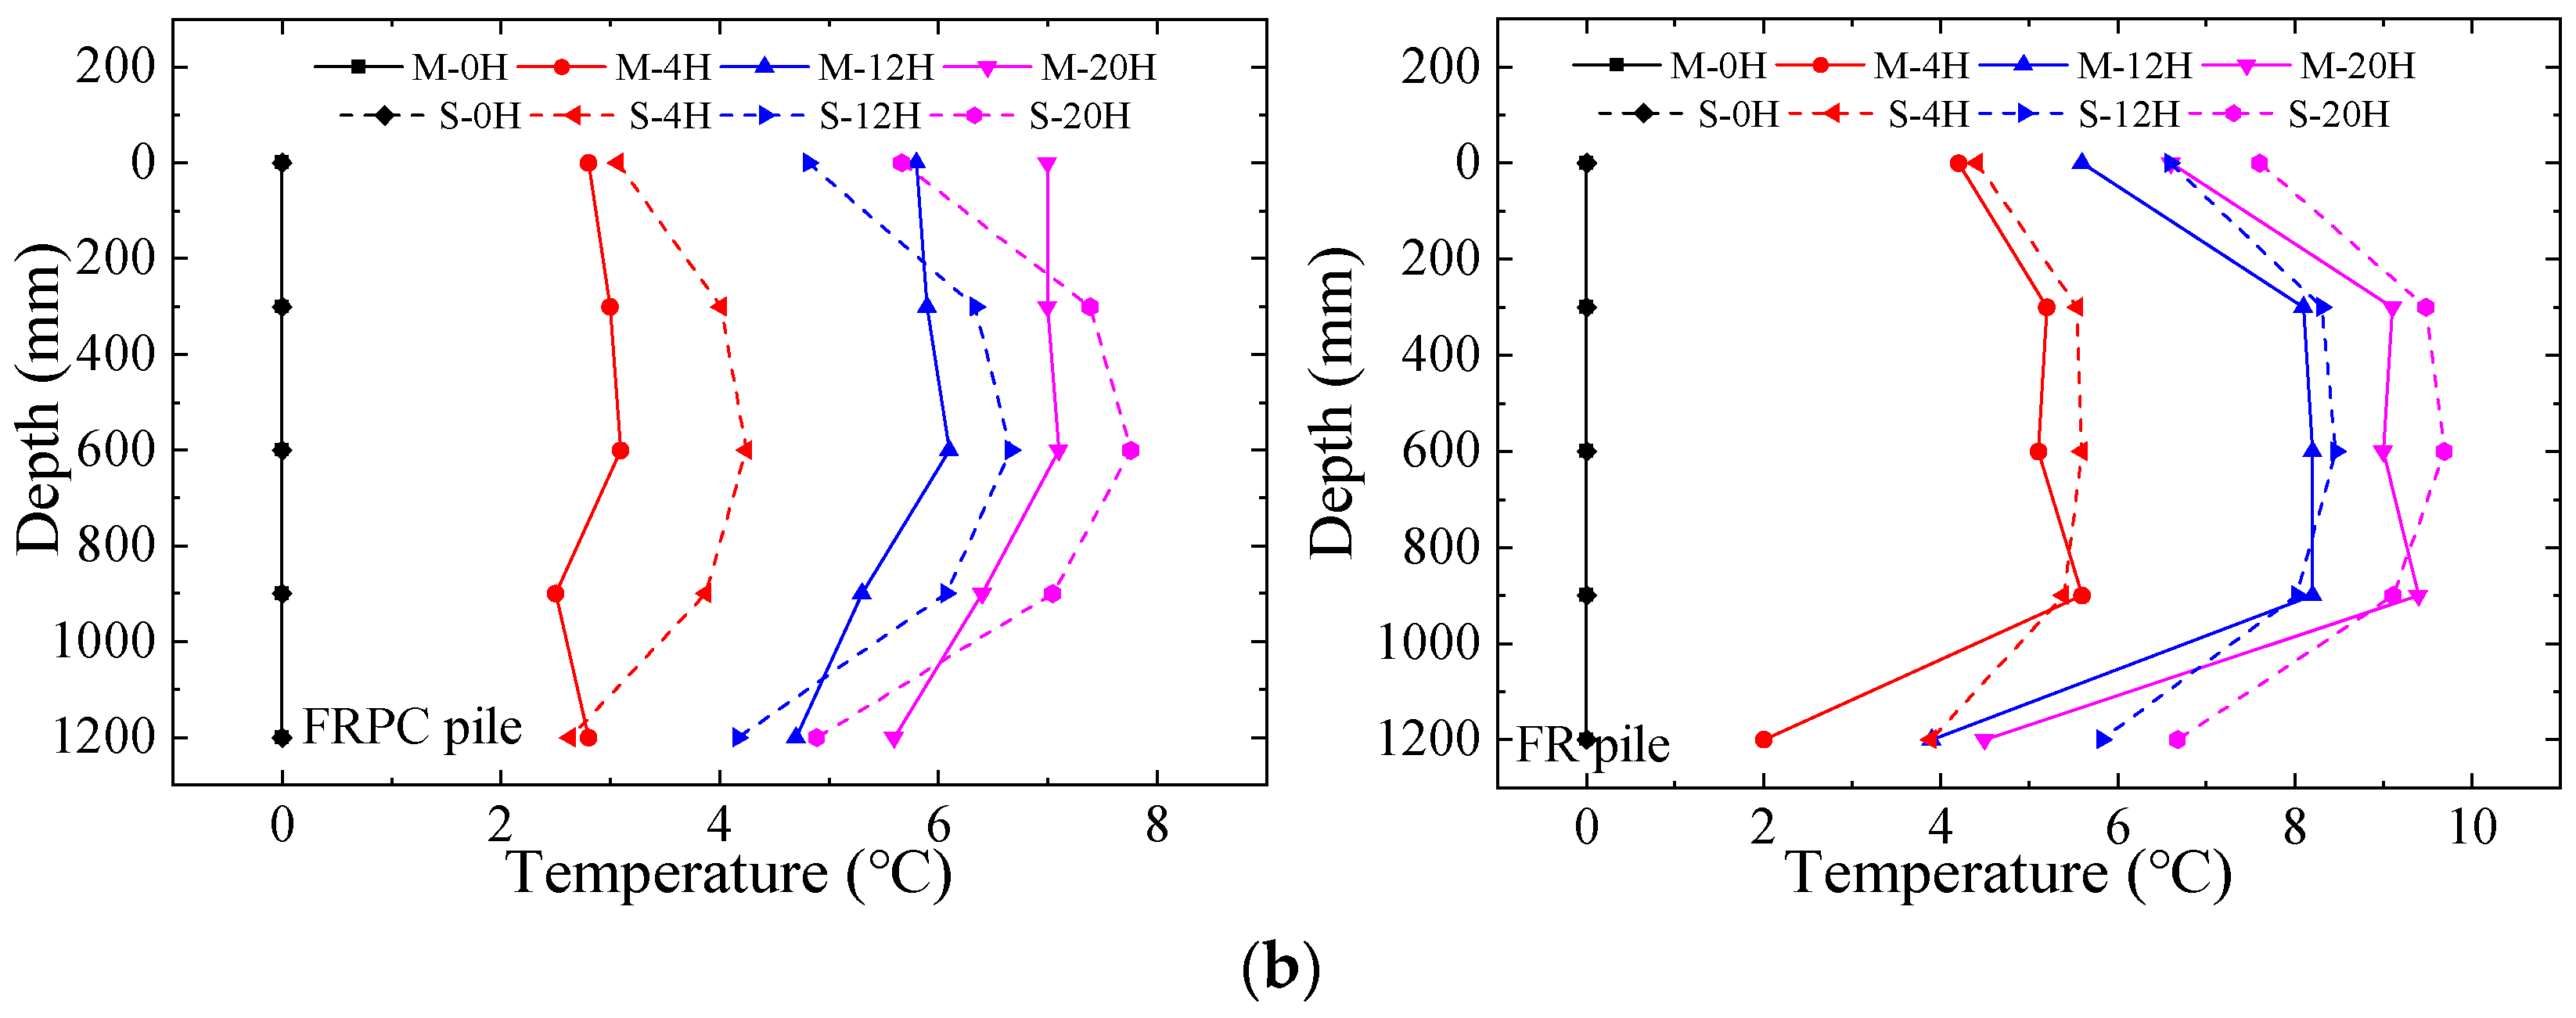
4.1.2. Temperature Change with Depth
4.2. Simulation Results
4.2.1. Phase Transition Progression inside the Pile
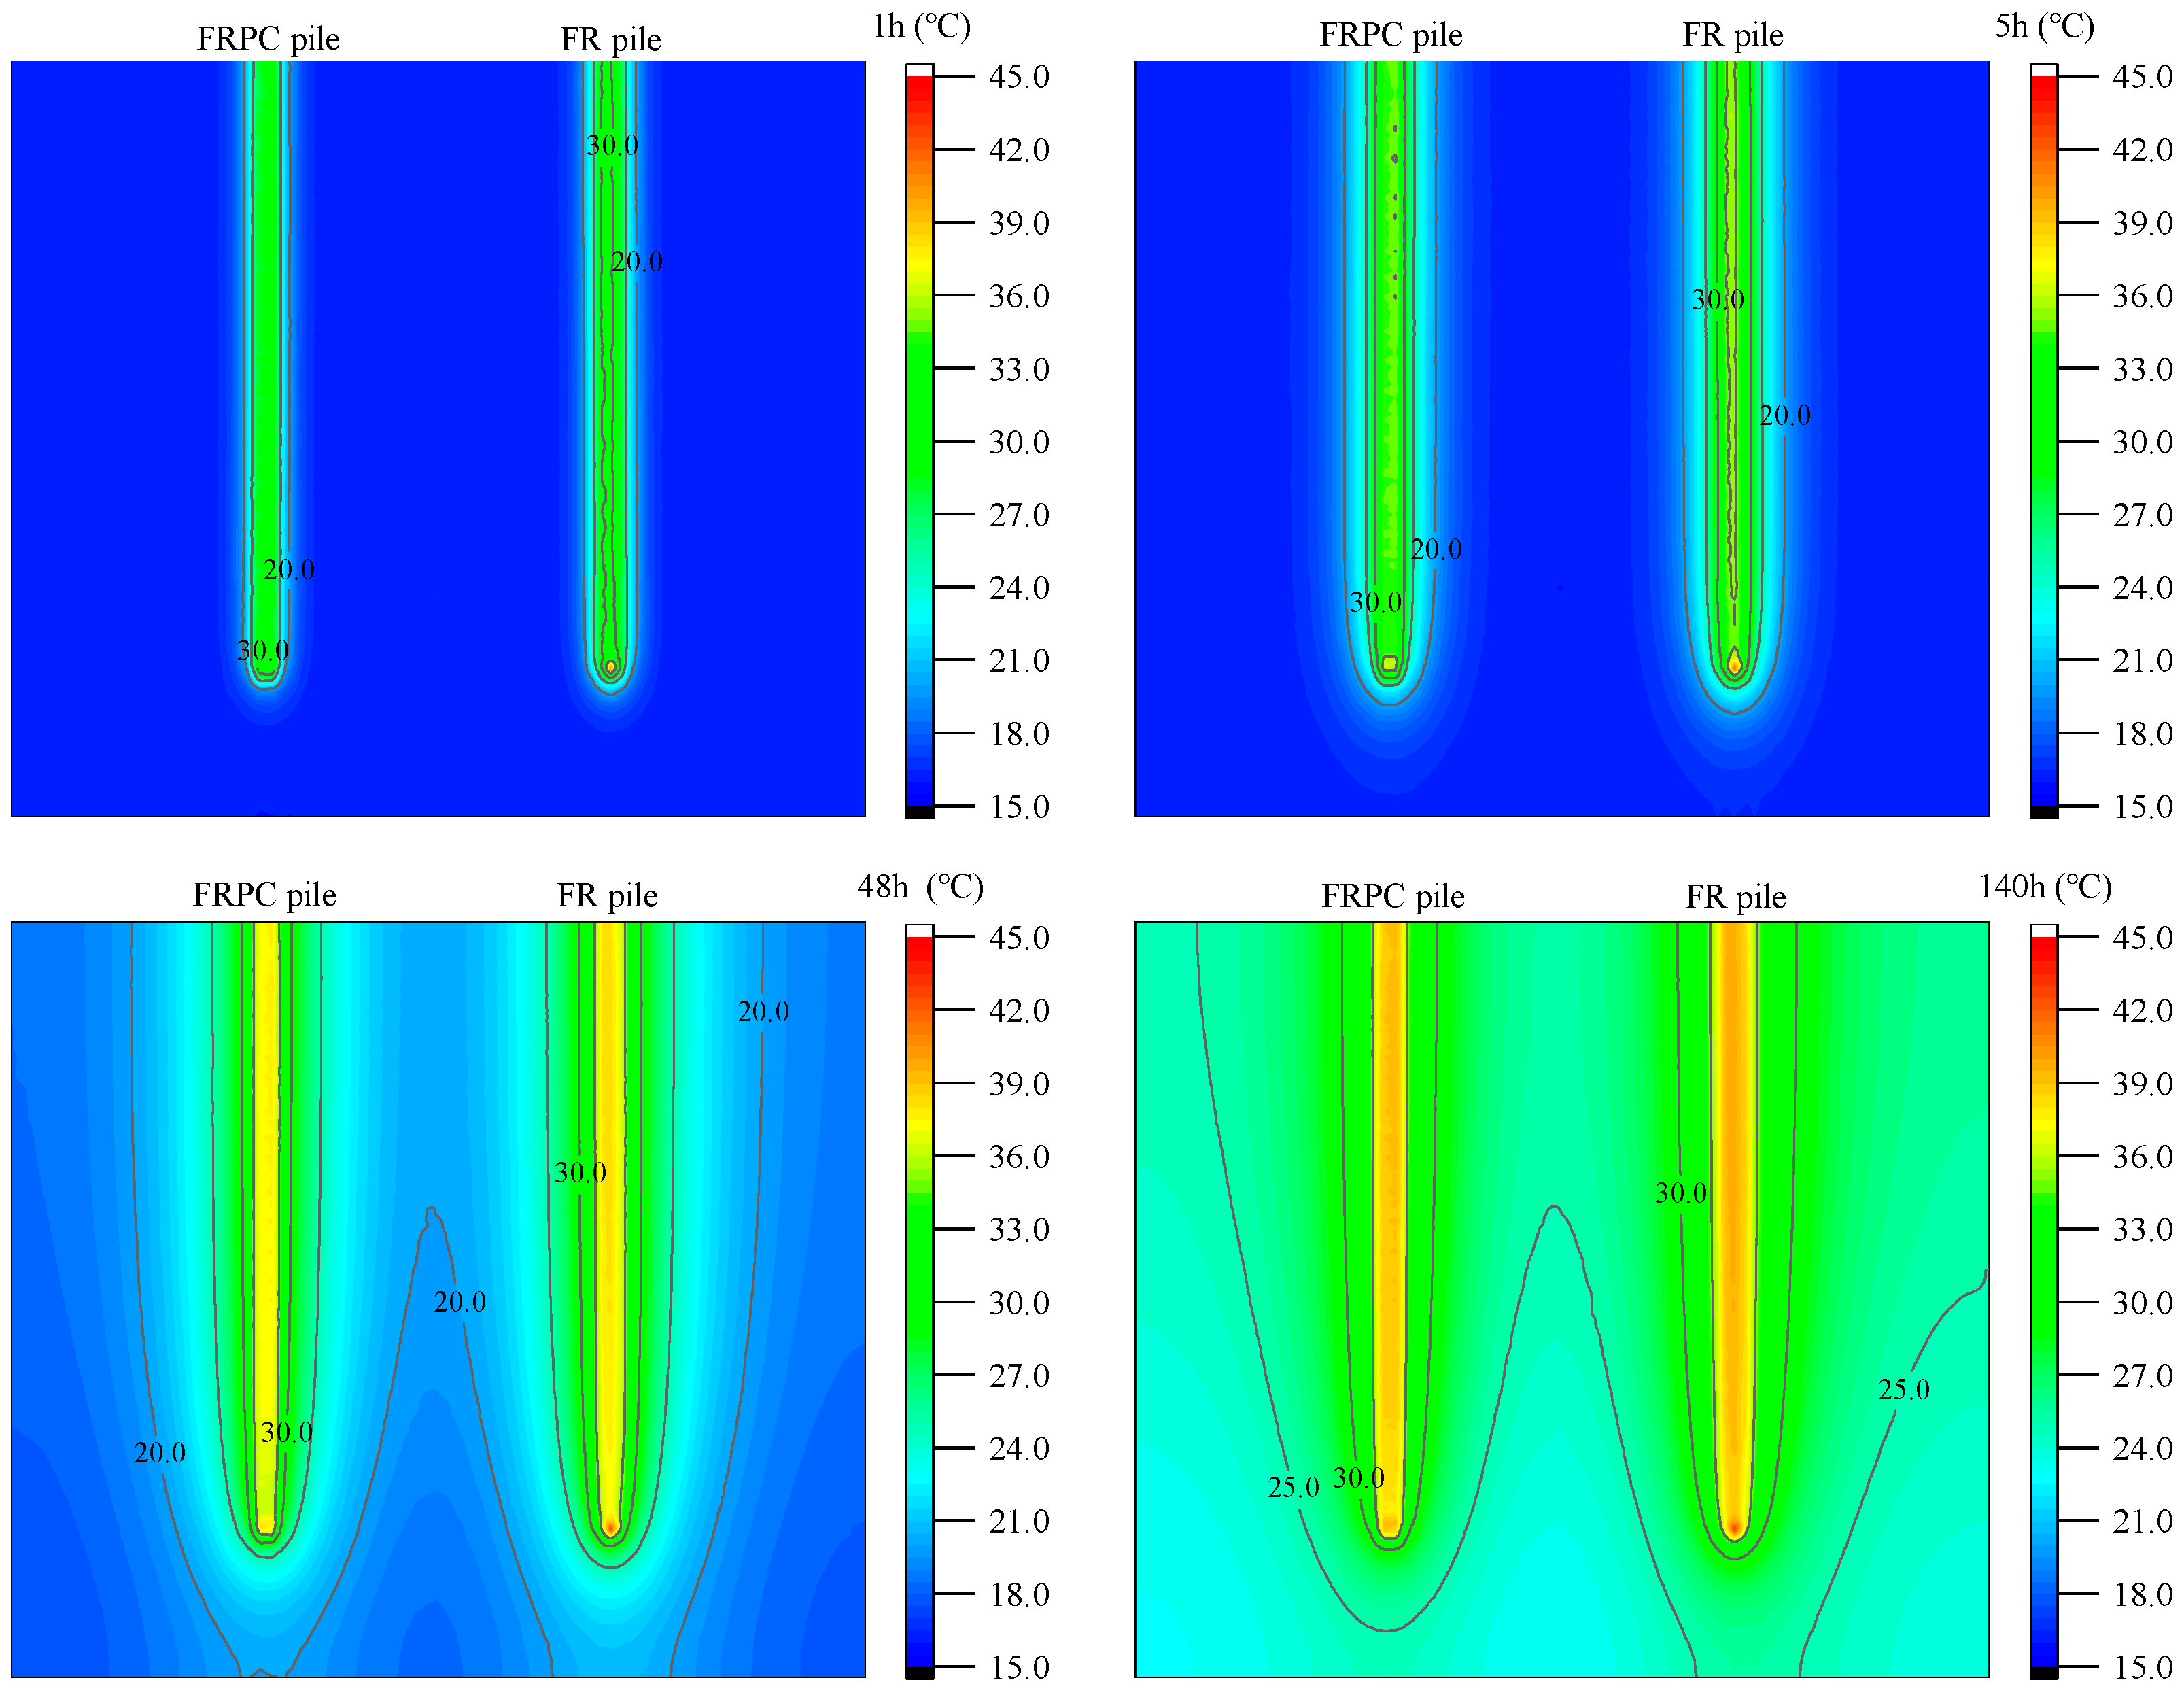
4.2.2. Temperature Distribution in Pile–Soil
4.2.3. Heat Power
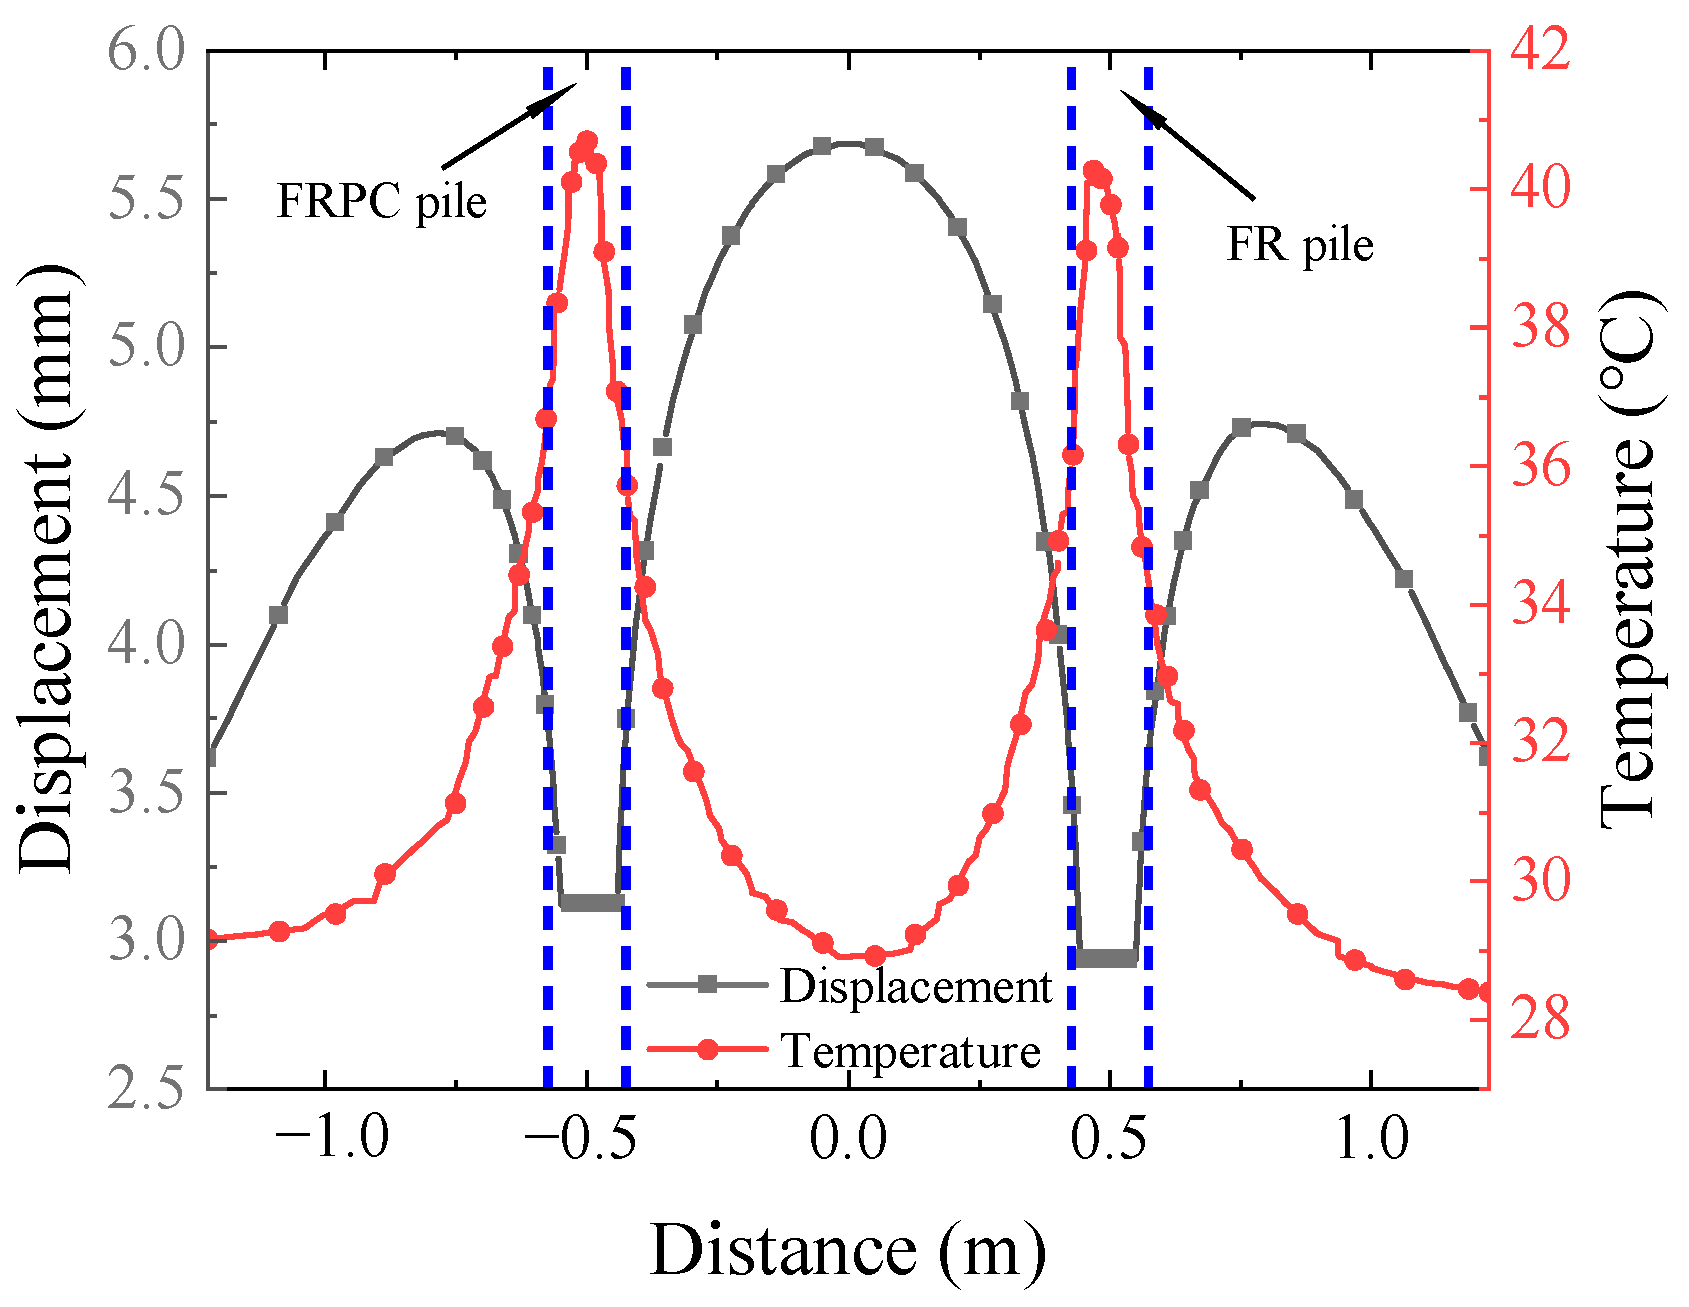
4.2.4. Pile–Soil Displacement
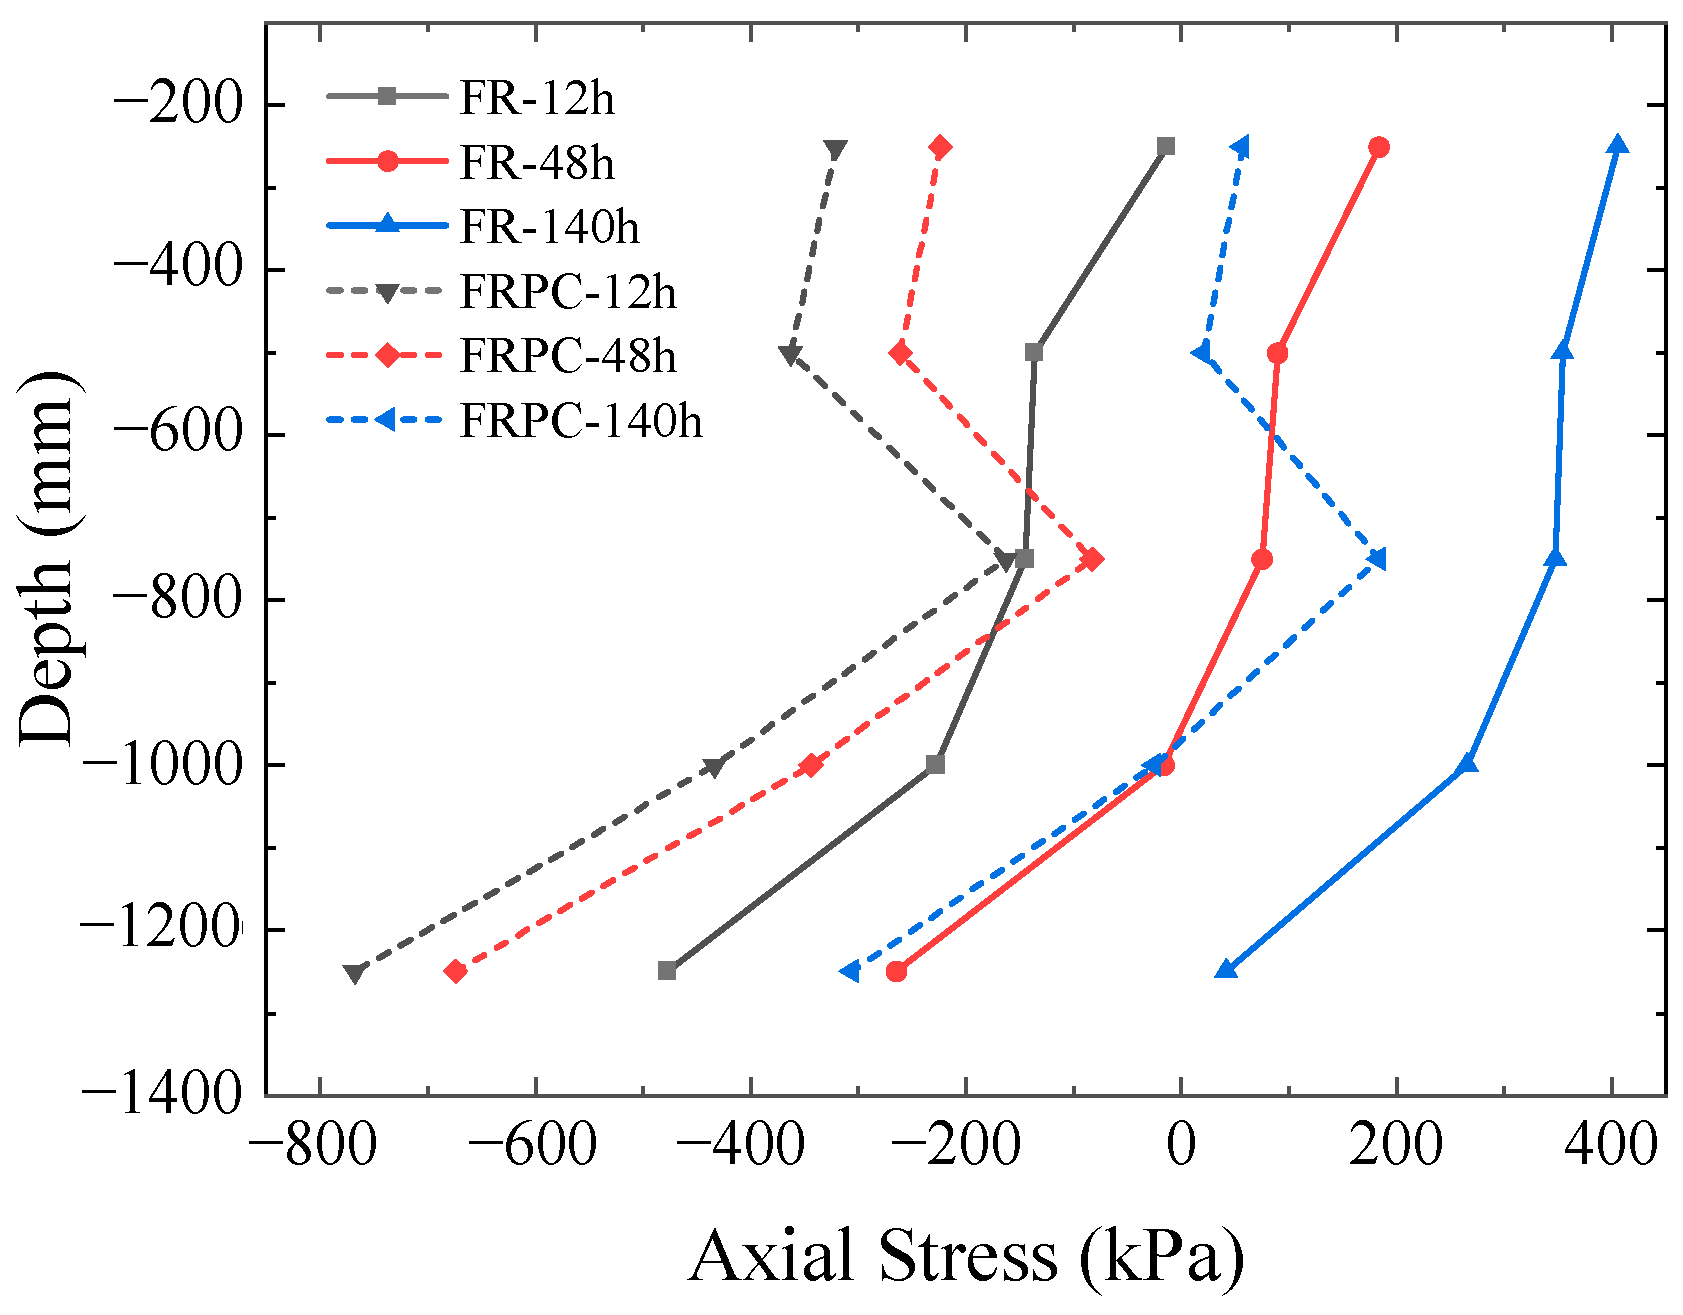
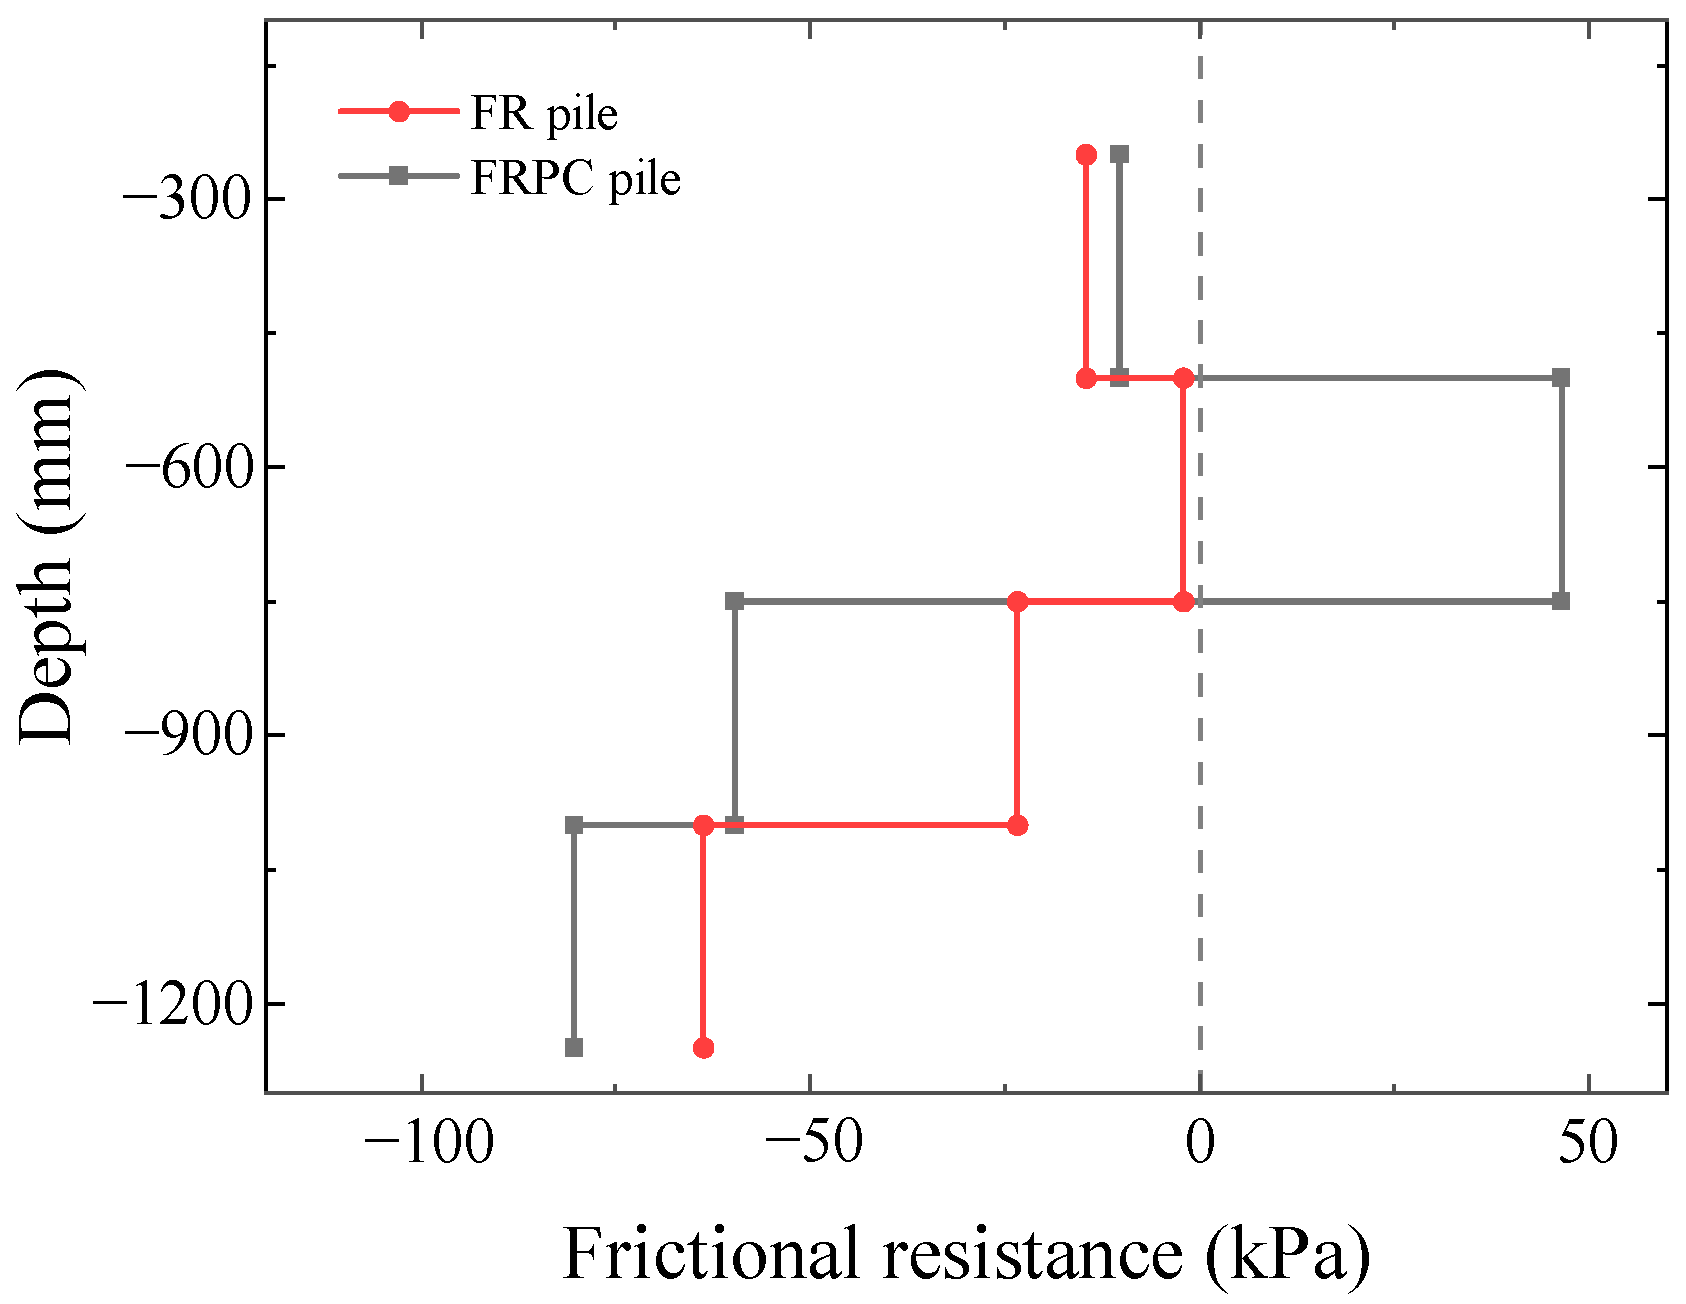
4.2.5. Pile Internal Stress and Side Friction
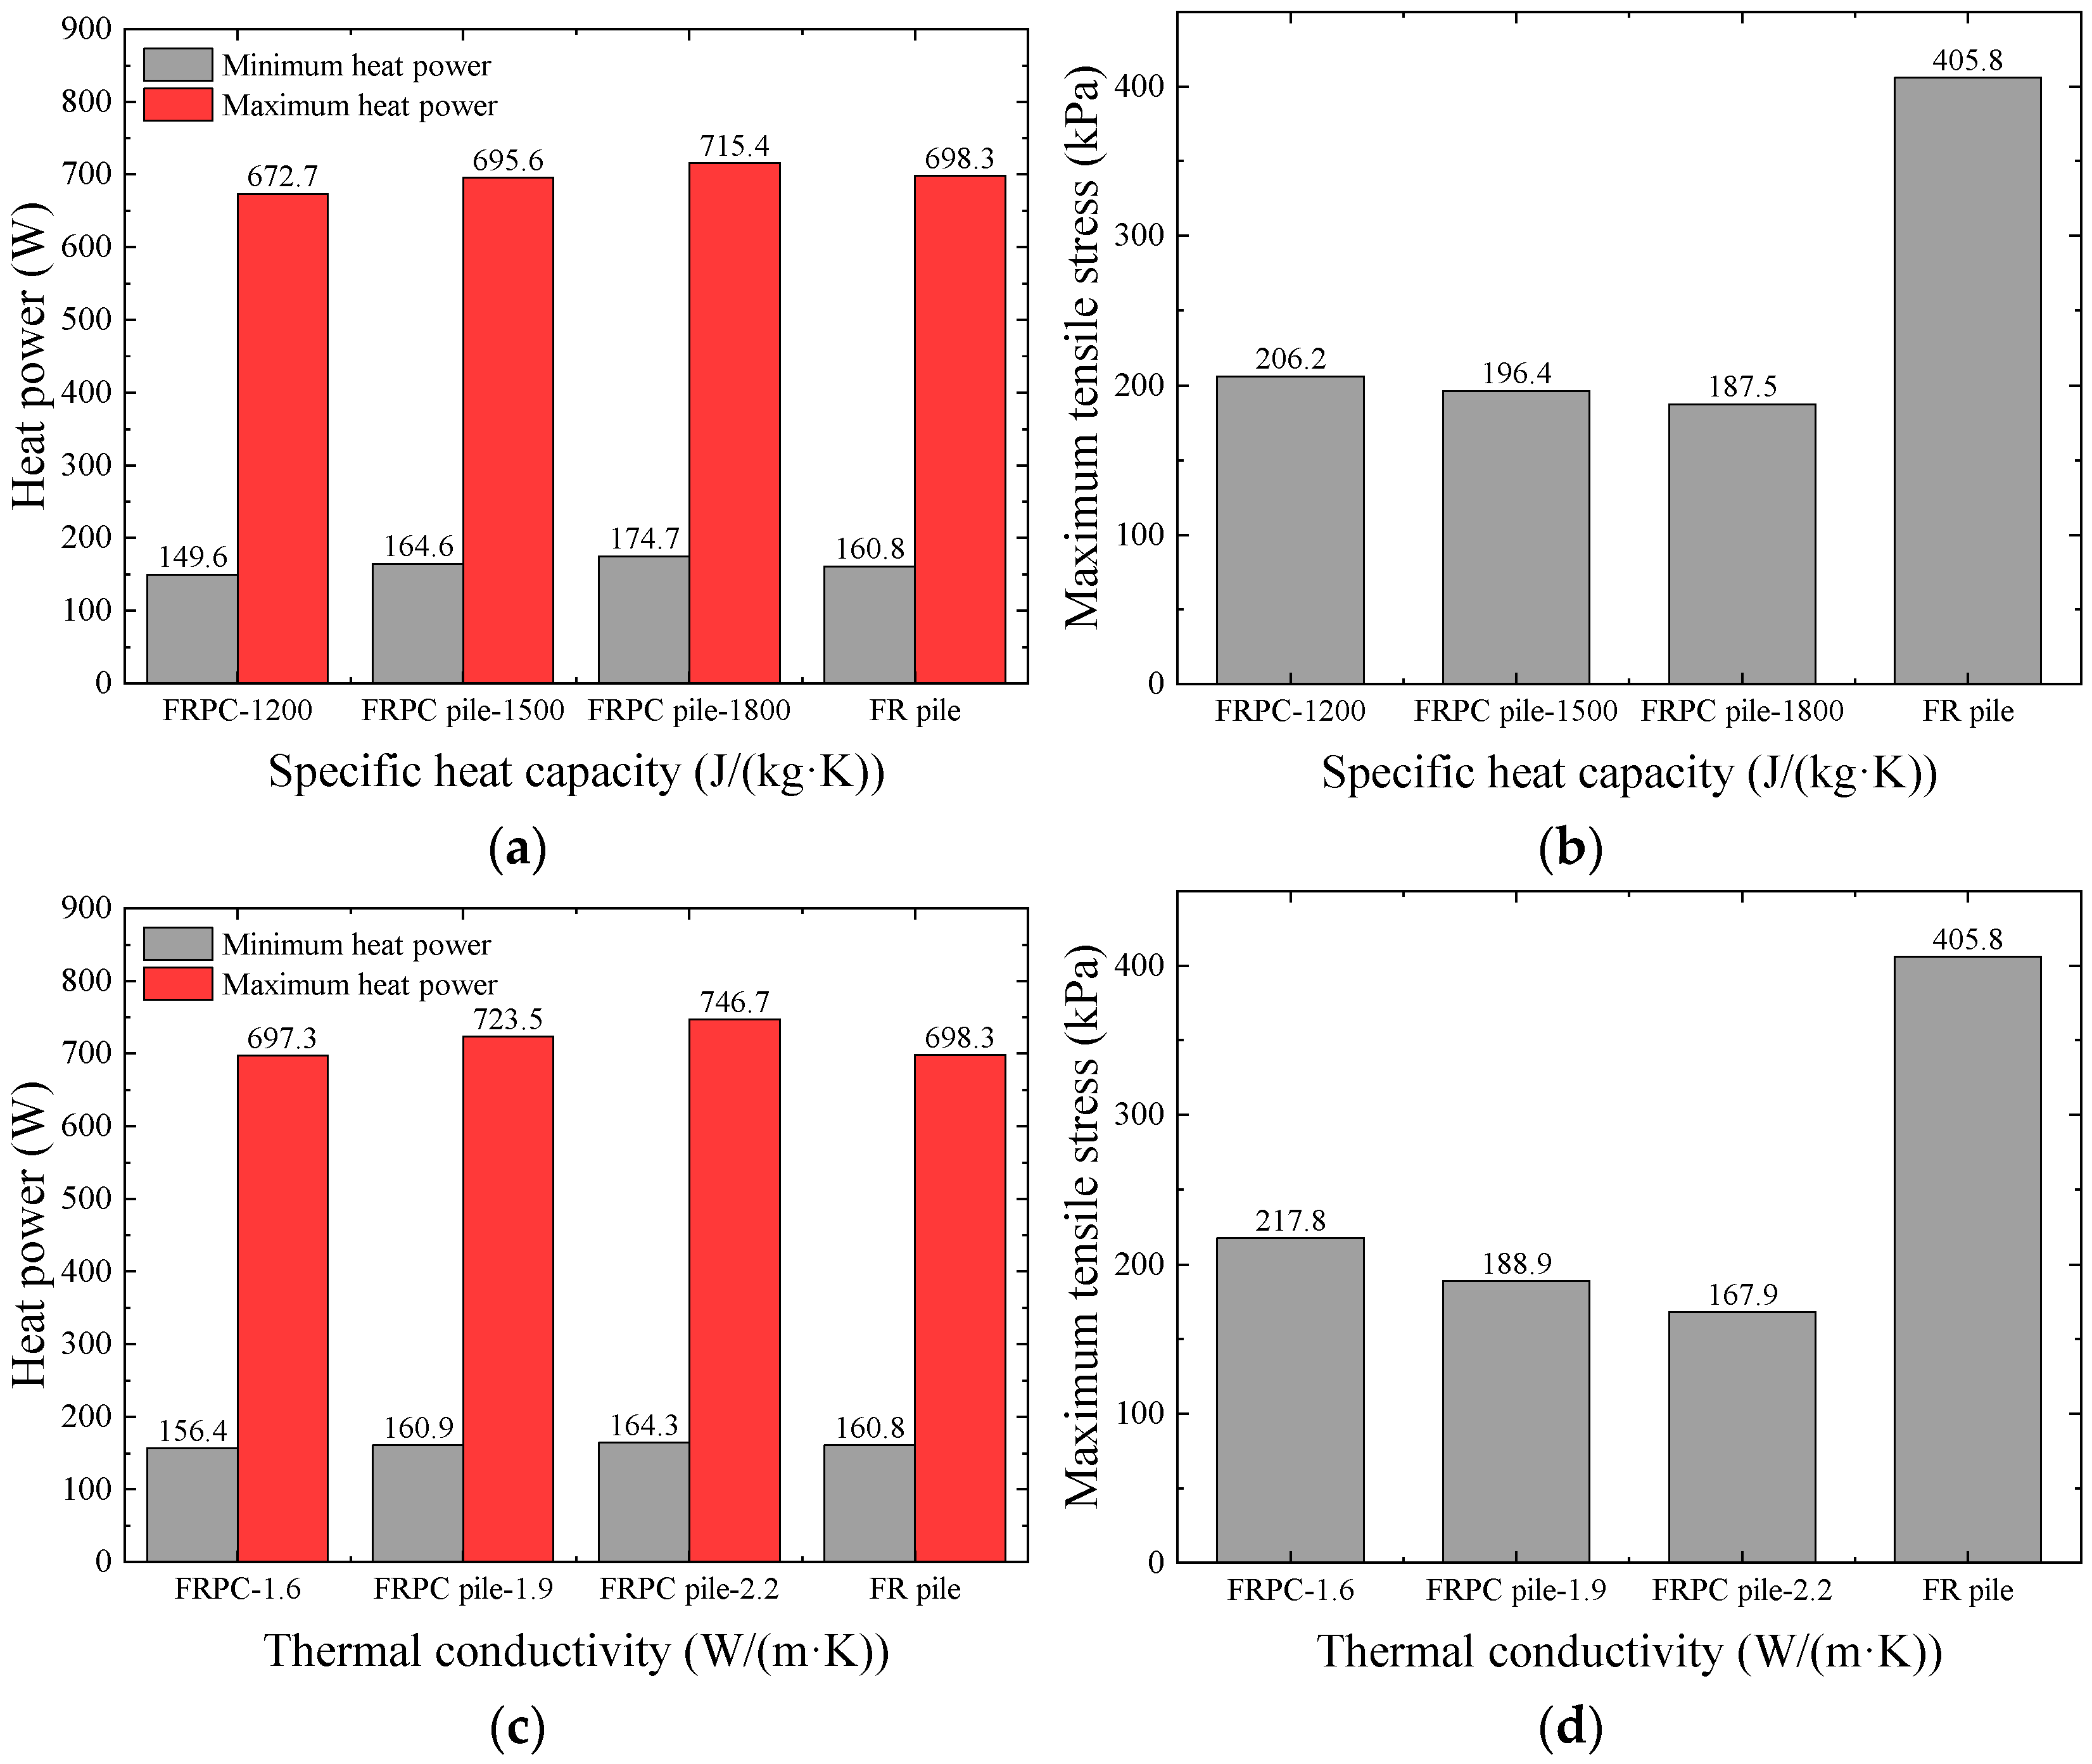
4.3. Parametric Optimization Results
4.4. Discussion
4.4.1. Thermo–Mechanical Response Behavior of the FRPC Pile
4.4.2. Parametric Analysis
5. Conclusions
- The FRPC pile effectively reduced the thermal influence radius surrounding the pile. However, incorporating PCM introduced uneven temperature distribution within the FRPC pile and a 9.4% reduction in heat transfer capacity compared to the FR pile. Compared with the heating condition, the FRPC pile is more suitable for cooling conditions.
- The mechanical response of energy piles under thermal loading can be effectively reduced through PCM in pile concrete. Under long-term heat transfer conditions, the axial stress change at the top of the FRPC pile caused by thermal loading could be reduced by 85.9%. The pile-side friction generally shows a downward trend in heating conditions.
- The phase change path of the phase change material in the pile is that the heat exchange tube gradually starts the phase change to the pile surface, and the phase change is completed quickly. Since the thermal conductivity of the phase change material in the liquid phase is generally lower than that in the solid phase, the FRPC pile is more suitable for cooling conditions compared with the heating condition.
- The increase in flow rate had a greater impact on the initial peak heat power of the PCM pile. However, the relationship between the two was not proportionally linear. There is an optimal economic flow rate to balance the system’s energy consumption and heat power in different conditions.
- The improvement in the thermal conductivity of energy pile concrete enhanced the overall heat transfer capacity and reduced the mechanical response of the pile structures. Compared with the OC pile, the FRPC pile is more suitable for long-term heat exchange operations.
Author Contributions
Funding
Institutional Review Board Statement
Informed Consent Statement
Data Availability Statement
Conflicts of Interest
References
- Fadejev, J.; Simson, R.; Kurnitski, J.; Haghighat, F. A review on energy piles design, sizing and modelling. Energy 2017, 122, 390–407. [Google Scholar] [CrossRef]
- Sani, A.K.; Singh, R.M.; Amis, T.; Cavarretta, I. A review on the geothermal energy pile foundation’s performance, design process, and applications. Renew. Sust. Energ. Rev. 2019, 106, 54–78. [Google Scholar] [CrossRef]
- Faizal, M.; Bouazza, A.; Singh, R.M. Heat transfer enhancement of geothermal energy piles. Renew. Sust. Energ. Rev. 2016, 57, 16–33. [Google Scholar] [CrossRef]
- Bourne-Webb, P.J.; Amatya, B.; Soga, K.; Amis, T.; Davidson, C.; Payne, P. Energy pile test at Lambeth College, London: Geotechnical and thermodynamic aspects of pile response to heat cycles. Geotechnique 2009, 59, 237–248. [Google Scholar] [CrossRef]
- Laloui, L.; Nuth, M.; Vulliet, L. Experimental and numerical investigations of the behaviour of a heat exchanger pile. Int. J. Numer. Anal. Methods Geomech. 2006, 30, 763–781. [Google Scholar] [CrossRef]
- Amatya, B.L.; Soga, K.; Bourne-Webb, P.J.; Amis, T.; Laloui, L. Thermo-mechanical behaviour of energy piles. Geotechnique 2012, 62, 503–519. [Google Scholar] [CrossRef]
- Akrouch, G.A.; Sanchez, M.; Briaud, J.L. Thermo-mechanical behavior of energy piles in high plasticity clays. Acta Geotech. 2014, 9, 399–412. [Google Scholar] [CrossRef]
- Stewart, M.A.; Mccartney, J.S. Centrifuge Modeling of Soil-Structure Interaction in Energy Foundations. J. Geotech. Geoenviron. Eng. 2014, 140, 04013044. [Google Scholar] [CrossRef]
- Yavari, N.; Tang, A.M.; Pereira, J.M.; Hassen, G. Mechanical behaviour of a small-scale energy pile in saturated clay. Géotechnique 2016, 66, 878–887. [Google Scholar] [CrossRef]
- Park, S.; Lee, D.; Lee, S.; Chauchois, A.; Choi, H. Experimental and numerical analysis on thermal performance of large-diameter cast-in-place energy pile constructed in soft ground. Energy 2017, 118, 297–311. [Google Scholar] [CrossRef]
- Han, C.J.; Shen, Y.; Chen, K.H.; Gong, C.; Liu, T.L.; Qu, B. Characteristics and energy performance of novel MicroPCM C50 energy pile in cooling mode. Energy Build. 2022, 274, 112442. [Google Scholar] [CrossRef]
- Wang, Y.X.; Du, G.Y.; Shi, G.; Liu, S.Y. Experimental Study of High-Thermal Conductivity SiC Concrete Energy Piles. Int. J. Civ. Eng. 2023, 21, 647–664. [Google Scholar] [CrossRef]
- Qu, B.; Liu, T.L.; Gong, C.; Liu, J.X.; Shen, Y.; Chen, K.H.; Han, C.J. Investigation of microencapsulate phase change material-based energy pile group: Energy analysis and optimization design. J. Clean. Prod. 2022, 381, 135204. [Google Scholar] [CrossRef]
- Ren, X.; Ding, Y.X.; Liu, Q.F.; Chen, S.J.; Song, F. Effect of different volume fraction of steel fiber/graphite on thermal conductivity and compressive properties of concrete. Front. Mater. 2022, 9, 1003830. [Google Scholar] [CrossRef]
- Li, H.Y.; Chen, B.G.; Zhu, K.C.; Gong, X.L. Flexural Toughness Test and Inversion Research on a Thermal Conductivity Formula on Steel Fiber-Reinforced Concrete Components Post-Fire. Materials 2022, 15, 5103. [Google Scholar] [CrossRef] [PubMed]
- Cui, H.Z.; Zou, J.P.; Gong, Z.; Zheng, D.P.; Bao, X.H.; Chen, X.S. Study on the thermal and mechanical properties of steel fibre reinforced PCM-HSB concrete for high performance in energy piles. Constr. Build. Mater. 2022, 350, 128822. [Google Scholar] [CrossRef]
- Guo, G. Preparation and mechanical properties of steel fiber reinforced concrete. J. Funct. Mater. 2020, 51, 012037. [Google Scholar]
- Liu, K.; Lu, L.; Wang, F.; Liang, W. Theoretical and experimental study on multi-phase thermal conductivity model for fiber reinforced concrete. Constr. Build. Mater. 2017, 148, 465–475. [Google Scholar] [CrossRef]
- Zhang, H.; Wang, H.; Li, F.; Zhang, L. Experimental Investigation and the Development of Phase Change Heat Storage Device Adapted to the Solar Energy Heat Pump. Adv. Mater. Res. 2014, 860, 191–195. [Google Scholar] [CrossRef]
- Chang, H.; Jin, L. Preparation and Heat Transfer Performance of Steel Ball Phase Change Concrete. J. New Mat. Electrochem. Syst. 2020, 23, 204–212. [Google Scholar] [CrossRef]
- Ling, Z.; Wang, F.; Fang, X.; Gao, X.; Zhang, Z. A hybrid thermal management system for lithiumion batteries combining phase change materials with forced-air cooling. Appl. Energy 2015, 148, 403–409. [Google Scholar] [CrossRef]
- Gulfam, R.; Zhang, P.; Meng, Z. Advanced thermal systems driven by paraffin-based phase change materials—A review. Appl. Energy 2019, 238, 582–611. [Google Scholar] [CrossRef]
- Veerakumar, C.; Sreekumar, A. Phase change material based cold thermal energy storage: Materials, techniques and applications—A review. Int. J. Refrig. 2016, 67, 271–289. [Google Scholar] [CrossRef]
- Tang, Y.; Liu, G.; Zheng, M.; Shi, S. Model test on thermal response of phase change pile in saturated silt ground. Rock Soil Mech. 2022, 43, 282–290. [Google Scholar]
- Shahidi, S.; Hajialilue-Bonab, M.; Tohidvand, H.R.; Khosravi, A. Experimental investigation on the efficiency of the phase change materials for enhancing the thermal performance of energy piles in sandy soils. Energy Build. 2023, 298, 113544. [Google Scholar] [CrossRef]
- Yang, W.B.; Sun, T.F.; Yang, B.B.; Wang, F. Laboratory study on the thermo-mechanical behaviour of a phase change concrete energy pile in summer mode. J. Energy Storage 2021, 41, 102875. [Google Scholar] [CrossRef]
- Bao, X.; Memon, S.A.; Yang, H.; Dong, Z.; Cui, H. Thermal Properties of Cement-Based Composites for Geothermal Energy Applications. Materials 2017, 10, 462. [Google Scholar] [CrossRef]
- Yang, H.; Memon, S.A.; Bao, X.; Cui, H.; Li, D. Design and Preparation of Carbon Based Composite Phase Change Material for Energy Piles. Materials 2017, 10, 391. [Google Scholar] [CrossRef]
- Yang, W.; Lu, P.; Chen, Y. Laboratory investigations of the thermal performance of an energy pile with spiral coil ground heat exchanger. Energy Build. 2016, 128, 491–502. [Google Scholar] [CrossRef]
- Bao, X.H.; Qi, X.D.; Cui, H.Z.; Tang, W.C.; Chen, X.S. Experimental study on thermal response of a PCM energy pile in unsaturated clay. Renew. Energy 2022, 185, 790–803. [Google Scholar] [CrossRef]
- Lu, H.-W.; Jin, X.; Jiang, G.; Liu, W.-Q. Numerical Analysis of the Thermal Performance of Energy Pile with U-Tube. Energy Procedia 2017, 105, 4731–4737. [Google Scholar] [CrossRef]
- Wya, B.; Lz, A.; Hz, A.; Feng, W.A.; Xl, C. Numerical investigations of the effects of different factors on the displacement of energy pile under the thermo-mechanical loads. Case Stud. Therm. Eng. 2020, 21, 100711. [Google Scholar]
- Gao, J.; Xu, Z.; Liu, J.; Li, K.; Jie, Y. Numerical and experimental assessment of thermal performance of vertical energy piles: An application. Appl. Energy 2008, 85, 901–910. [Google Scholar] [CrossRef]
- Li, T.; Yu, X.; Lei, G.; Habibzadeh-Bigdarvish, O.; Hurley, M. Numerical analyses of a laboratory test of a geothermal bridge deck externally heated under controlled temperature. Appl. Therm. Eng. 2020, 174, 115255. [Google Scholar] [CrossRef]
- Ferrantelli, A.; Fadejev, J.; Kurnitski, J. Energy Pile Field Simulation in Large Buildings: Validation of Surface Boundary Assumptions. Energies 2019, 12, 770. [Google Scholar] [CrossRef]
- Qi, D.; Pu, L.; Sun, F.; Li, Y. Numerical investigation on thermal performance of ground heat exchangers using phase change materials as grout for ground source heat pump system. Appl. Therm. Eng. 2016, 106, 1023–1032. [Google Scholar] [CrossRef]
- Han, C.; Yu, X.B. An innovative energy pile technology to expand the viability of geothermal bridge deck snow melting for different United States regions: Computational assisted feasibility analyses. Renew. Energy 2018, 123, 417–427. [Google Scholar] [CrossRef]
- Lyu, W.; Pu, H.; Chen, J.N. Thermal Performance of an Energy Pile Group with a Deeply Penetrating U-Shaped Heat Exchanger. Energies 2020, 13, 5822. [Google Scholar] [CrossRef]
- Bao, X.H.; Li, Y.B.; Feng, T.J.; Cui, H.Z.; Chen, X.S. Investigation on thermo-mechanical behavior of reinforced concrete energy pile with large cross-section in saturated sandy soil by model experiments. Undergr. Space 2020, 5, 229–241. [Google Scholar] [CrossRef]
- Han, C.; Yu, X.B. Sensitivity analysis of a vertical geothermal heat pump system. Appl. Energy 2016, 170, 148–160. [Google Scholar] [CrossRef]
- Singh, R.M.; Bouazza, A.; Wang, B. Near-field ground thermal response to heating of a geothermal energy pile: Observations from a field test. Soils Found. 2015, 55, 1412–1426. [Google Scholar] [CrossRef]
- Yin, Y.; Li, Q.W.; Qiao, L. Response of energy pile-soil structure and pile group effect: An indoor similarity simulation study. J. Build. Eng. 2022, 51, 104247. [Google Scholar] [CrossRef]


| Test Tag | Type of Test | Flow Rate (mL/min) | Inlet Temperature (°C) | Average Value (°C) |
|---|---|---|---|---|
| 1 | Heating | 1500 | 45 | 16.11 |
| 2 | Heating | 3000 | 45 | 21.31 |
| Material | Thermal Conductivity (W/(m·K)) | Specific Heat Capacity (J/(kg·K)) |
|---|---|---|
| Sand (saturated) | 2.7 | 1155 |
| FR concrete | 1.89 | 944.7 |
| FRPC concrete | 1.61 (solid) 1.43 (liquid) | 1196 (solid) 1069.9 (liquid) |
| Terms | Unit | Range of Instrument | Accuracy | Measurement Minimum | Maximum Relative Error |
|---|---|---|---|---|---|
| Temperature | Thermocouple | −50~500 °C | ±0.044% | 15.89 °C | 1.38% |
| Data logger | −60~1372 °C | ±0.036% | 15.89 °C | 3.14% | |
| Flow | Flowmeter | 50~5000 mL/min | ±0.8% | 1250 mL/min | 3.20% |
| Items | Solid | Liquid |
|---|---|---|
| Density (kg/m3) | 833.8 | 786.7 |
| Thermal conductivity (W/(m∙K)) | 0.3 | 0.167 |
| Specific heat capacity (J/(g∙K)) | 2.16 | 2.02 |
| Phase change temperature (°C) | 23 ± 1 | |
| Latent heat (J/g) | 188.04 | |
| Time | Energy Pile | Stress at Different Buried Depths in the Pile (MPa) | ||||
|---|---|---|---|---|---|---|
| 0.25 m | 0.5 m | 0.75 m | 1.00 m | 1.25 m | ||
| 12 h | FRPC pile | −0.321 | −0.363 | −0.163 | −0.433 | −0.767 |
| FR pile | −0.013 | −0.136 | −0.145 | −0.228 | −0.477 | |
| 48 h | FRPC pile | −0.224 | −0.261 | −0.083 | −0.344 | −0.674 |
| FR pile | 0.184 | 0.089 | 0.075 | −0.016 | −0.265 | |
| 140 h | FRPC pile | 0.057 | 0.021 | 0.184 | −0.025 | −0.306 |
| FR pile | 0.405 | 0.354 | 0.347 | 0.265 | 0.042 | |
Disclaimer/Publisher’s Note: The statements, opinions and data contained in all publications are solely those of the individual author(s) and contributor(s) and not of MDPI and/or the editor(s). MDPI and/or the editor(s) disclaim responsibility for any injury to people or property resulting from any ideas, methods, instructions or products referred to in the content. |
© 2023 by the authors. Licensee MDPI, Basel, Switzerland. This article is an open access article distributed under the terms and conditions of the Creative Commons Attribution (CC BY) license (https://creativecommons.org/licenses/by/4.0/).
Share and Cite
Bao, X.; Shi, J.; Chen, G.; Li, Y.; Hu, J.; Cui, H. Laboratory Tests and Numerical Simulation of the Thermal–Mechanical Response of a Fiber-Reinforced Phase Change Concrete Pile. Appl. Sci. 2023, 13, 11853. https://doi.org/10.3390/app132111853
Bao X, Shi J, Chen G, Li Y, Hu J, Cui H. Laboratory Tests and Numerical Simulation of the Thermal–Mechanical Response of a Fiber-Reinforced Phase Change Concrete Pile. Applied Sciences. 2023; 13(21):11853. https://doi.org/10.3390/app132111853
Chicago/Turabian StyleBao, Xiaohua, Jiaxin Shi, Guancong Chen, Yingpeng Li, Jinxin Hu, and Hongzhi Cui. 2023. "Laboratory Tests and Numerical Simulation of the Thermal–Mechanical Response of a Fiber-Reinforced Phase Change Concrete Pile" Applied Sciences 13, no. 21: 11853. https://doi.org/10.3390/app132111853
APA StyleBao, X., Shi, J., Chen, G., Li, Y., Hu, J., & Cui, H. (2023). Laboratory Tests and Numerical Simulation of the Thermal–Mechanical Response of a Fiber-Reinforced Phase Change Concrete Pile. Applied Sciences, 13(21), 11853. https://doi.org/10.3390/app132111853