1. Introduction
Saliva has been proposed in the medical field as a biological fluid collected with non-invasive methods, suitable for discreet monitoring of health conditions [
1]. Saliva is an “ultra-filtered” blood and salivary biomarkers can virtually be applied to evaluate the physiological conditions of the patient, to track the progression of a disease and to monitor the efficacy of therapies [
2]. Saliva analysis is a potential substitute for blood analysis, sampling is non-invasive and can also be performed by the patient himself; it is particularly suitable for long-term monitoring, for screening large numbers of patients [
3,
4], as well as for the development of point-of-care salivary technology [
5]. However, saliva sampling requires a standardization phase with the choice of a suitable device and an indication of the factors that can influence the salivary composition, such as blood contamination, a factor capable of invalidating the determination of the salivary biomarker [
6]. The literature reports various applications of salivary dosages with a different clinical value in the diagnosis, in the monitoring of oncological, cardiovascular, autoimmune, viral and bacterial diseases, or in the assessment of the risk to of exposure to toxic substances [
7].
Levels of bone turnover markers (BTM) that provide an estimate of bone resorption and formation can also be measured non-invasively using saliva. Numerous proteins or derived biomarkers are released during remodeling by osteoblasts or osteoclasts and are generically described as bone turnover markers (BTM) [
8,
9]. The most used markers are N-terminal collagen extension propeptide type I (PINP), osteocalcin and bone alkaline phosphatase for indicators of the process of bone formation and crosslinking C-terminal collagen telopeptide type I (bCTX-I), N- terminal telopeptide of collagen type I (NTX), resistant to acid tartrate phosphatase isoform 5b (TRAP5b) for bone resorption. Each bone marker has distinct characteristics that reflect particular aspects of bone physiology. [
10].
Bone is a dynamic and metabolically active tissue that is continuously remodeled by the coordinated actions of osteoclasts and osteoblasts in cellular packages. In particular, PINP is an indicator of bone formation and is produced during the formation of the bone matrix by cleavage of type I collagen; TRAcP 5b reflects the number of osteoclasts and is correlated to bone resorption; Parathyroid hormone-related protein (PTHrP) instead intervenes in the physiological regulation of bone remodeling (an endocrine mechanism) but it is also locally produced (paracrine function) by osteoblast progenitors; it promotes the differentiation of mature osteoblasts by inhibiting the apoptosis process that allows bone formation; moreover it stimulates the differentiation of the osteoclasts that is responsible of the bone resorption [
11]. PTHrP is present in the enamel organ and is responsible for the formation of the eruptive pathway [
11]. This observation has inspired various studies that have focused on the role of PTHrP in mediating osteoclastogenesis. Parathyroid hormone-related protein (PTHrP) is also a protein, which has several biologically active domains, and plays a vital role in regulating bone metabolism. [
12]. Such as Parathyroid hormone-related protein (PTHrP) is also a protein, which has several biologically active domains and plays a vital role in regulating bone metabolism.
Some studies have evaluated the bone turnover markers CTX and B-ALP in particular using the salivary matrix and have correlated them with the concentrations on serum samples [
11,
12,
13,
14]. Others found significant correlations between concentrations and age, body mass index, and bone mineral density concluding that saliva could be used as a fluid sample to evaluate bone remodeling [
13,
15].
In orthodontic and periodontal research, the knowledge of BTM expression of cellular bone remodeling processes have provided information on the mechanical aspects related to the treatment to avoid side effects [
14,
15,
16,
17].
The determination of single bone biomarkers cannot be interpreted on single measurements in a static manner statically interpreted on single measurements but on the contrary, a variation in monitoring is the most useful tool for detecting the dynamics of the metabolic imbalance itself [
1,
2]. Changes in bone turnover markers are not disease specific but reflect, as an integral measure, alterations in skeletal shell metabolism. Most bone turnover markers show significant variability. Whenever a change in the level of a bone marker is observed in an individual patient, for example following a therapeutic intervention, it has to be interpreted against the background of the variability of the respective marker [
16,
17,
18]. The main change for their adoption in the routine practice of BTM on the salivary matrix is above all the reproducibility between and within-subject, the verification of the analytical sensitivity of the laboratory methods in use, as a function of the salivary matrix, the knowledge of the sources of variability and the strategies used to limit them [
16,
17].
The aim of the present study was to determine the Biological Variability of BTM in young subjects, on serial biological salivary samples using analytical methodologies already validated for serum measurements. The aim is to provide the variations in the single subject (intraindividual biological variability) of the concentrations of bone metabolism analytes on saliva and to evaluate the correct use in clinical monitoring.
2. Materials and Methods
2.1. Study Description
We analyzed 20 saliva samples from apparently healthy children and young adults mean age of 11.6 (females 9 mean age 11.2 and males 11 mean age 12.1). Samples were obtained and collected three times every 15 days. The samples were selected at the Department of Periodontology of Foggia from September 2022 to February 2023; the determinations of biomarkers of bone metabolism were performed at the Clinical Hospital Pathology of the Policlinic, University of Bari. The study was approved by ethical committees of the Policlinico University Hospital of Bari (Biomarkers of Bone Metabolism, Study number. 38359/COMET of 27 April 2021 BMOPed). Before enrollment in the study, each patient received complete information on the nature and objectives of the study before signing a form of informed consent that has been signed by both parents. Samples were collected in accordance with the principles of the Declaration of Helsinki and the International Conference on Harmonization Guidelines for Good Clinical Practice.
2.2. Study Population
Pediatric subjects aged between 10 and 16 years who underwent a follow-up dental visit were recruited in this study. At the intraoral objective examination, the subjects presented all the teeth of the permanent series completely erupted in relation to their age and no erupting teeth. None of the subjects presented rare dental pathologies affecting the hard and soft tissues of the oral cavity (carious processes, enamel hypoplasia, white and brown spot lesions, aphthae, gingivostomatitis, neoplastic lesions, included teeth) and lesions attributable to periodontal diseases or requiring periodontal therapies. Each subject provided serially collected unstimulated saliva samples. In order to standardize the population studied, saliva samples were collected between 9 a.m. and 11 a.m. from patients who had not done any physical activity in the last week.
Apparently, healthy children were enrolled in the study, with no history of chronic diseases, kidney diseases, heart diseases, gastrointestinal diseases, endocrine disorders, or undergoing to minor surgical procedures and other conditions that could affect the calcium-phosphate balance.
2.2.1. Inclusion Criteria
The subjects recruited in this study were systemically healthy, with a normal physical work-up (weight, height, nutritional status and gonadal/sexual status), normal laboratory values determined within the year, with a minimum of 28 erupted teeth; they had not taken any medications in the past 3 months. On physical examination, they had to present with BOP < 10%, PPD ≤ 3 mm, healthy periodontium and oral mucosa; no signs of current or recent oropharyngeal infections and no recent dental eruption. Furthermore, the enrolled patients had not undergone any orthodontic treatment in the last three months.
2.2.2. Exclusion Criteria
Subjects with rare diseases, thyroid, renal, hepatic, cardiovascular, pulmonary, intestinal or clinically significant pathologies hospitalized for diagnostic reasons, patients with ongoing severe diseases or previous surgery including surgery for bone fractures within 3 months were excluded. Besides, patients with abnormal laboratory exams and/or with vitamin D deficiency (<20 ng/mL) in the last year were excluded. Exclusion criteria included subjects with included teeth, dental implants, undergoing any prior periodontal therapy within the past three months, or currently in active periodontal treatment. Patients who had received antibiotic treatments or immunosuppressant drugs in the last three months, with sleep-disordered breathing [
18,
19], temporomandibular disorders, pregnant or breastfeeding women were also excluded. To exclude misjudgments of the salivary analyte concentration due to blood contamination, each subject was evaluated for the presence of buccal lesions and/or dental eruptions and all subjects presenting with bleeding buccal lesions of any nature including mechanics were excluded during each step of sample collection.
2.3. Collection of Saliva Samples
Saliva samples were collected from study subjects after a specialized intraoral examination. For the passive salivation method [
16,
19] Salivette
® with cotton swabs was used, for saliva examination (Sarstedt) Salivette
® is an optimal method for the hygienic collection of total saliva. Subjects can easily take diagnostic samples even without the need for medical personnel. The execution procedure includes a preparatory phase with fasting and a ban on smoking in the 2 h preceding the collection of saliva (with the exception of water). Pre-collection of saliva includes a preparatory phase of buccal cleaning 10 min before collection with mouth rinses with a glass of water. The sampling phase involves removing the cap, passing the swab directly into the mouth and delicately chewing the swab for two minutes. The advantage of this system is that samples can be stored at room temperature until delivered to the laboratory. According to the recommendations provided by the manufacturer, the “Salivette” system was not used in children less than 3 years of age: all subjects were provided with written recommendations from the preparatory phase to the collection of the salivary sample. Medical personnel have verified the appropriateness of specimen collection and handling. All subjects presenting samples with biochemical evidence of blood contamination were excluded. After collection, samples were stored at 4–8 °C for 24 h and centrifuged at 4000×
g for 3 min and stored at −30 °C until analysis. The samples were sent to the laboratory at a controlled temperature of 4–8 °C.
2.4. Verification of Blood Contamination on the Salivary Samples
Since transferrin (TRF) is a protein present in very high concentrations of serum (mg/dL) under normal circumstances, but only in trace amounts in oral fluid, all salivary samples were tested for transferrin as a biomarker of salivary contamination with blood at the Clinical Hospital Pathology of the Policlinic, University of Bari. The method of analysis used a nephelometric method (STRF FLEX reagent cartridge) on a Dimension VISTA 1500 instrumentation clinical chemistry analyzer (Siemens, Munich, Germany). Additionally, all samples were evaluated for possible blood contamination by checking for the presence of hemoglobin using an automated spectrophotometric (HIL) method on a Dimension VISTA 1500 instrumented clinical chemistry analyzer (Siemens, Munich, Germany). Samples with TRF concentrations higher than the detection limit (TRF LOD: 8.74 mg/dL) and with Hemoglobin (Hgb) values > 50 mg/dL evaluated by the spectrophotometric method using a clinical chemistry instrument were excluded.
2.5. Bone Turnover Markers (BTM)
The study involved the dosage of Parathyroid Hormone-Related Peptide (1–34) (PTHrP), Procollagen type I N Propeptide (PINP), Tartrate Resistant Acid Phosphatase isoform 5b (TRAP5b) on salivary matrix. The dosage of Parathyroid Hormone-Related Peptide (1–34) (PTHrP) was measured with a “competitive” enzyme immunoassay (ELISA) designed to measure the subunit (1–34) (Parathyroid hormone-related protein (PTHrP) (1–34) EIA kit, (Catalog # EK-056-04) (PHOENIX PHARMACEUTICALS, INC.; 330 Beach Rd. Burlingame, CA 94010, USA)) and was performed using the DSX ® TGSTA Dynex Technologies, Inc. This method has an analytical sensitivity of 0.15 ng/mL, and a linear range of 0.5–4.46 ng/mL. The TRAcP isoform 5b (IDS-iSYS TRAcP 5b (BoneTRAP®) (Catalog # IS-4100) (Immunodiagnostic Systems LtD 10 Didct Way, Boldon Business Park, Boldon, Tyne and Wear, NE35 9PD) analytical sensitivity of 0.9 U/L, linear range of 0.8–14.0 U/L and P1NP (IDS-iSYS Intact P1NP) (Catalog No. IS-4000) (Immunodiagnostic Systems LtD 10 Didct Way, Boldon Business Park, Boldon, Tyne and Wear, NE35 9PD) analytical sensitivity limits of quantification of 1 ng/mL, a linear range of 2–230 ng/mL was performed with chemiluminescence assay using the TGSTA Technogenetics instrumentation (Technogenetics, Milano, Italy).
All tests were performed in compliance with the manufacturer’s instructions and using suitable internal quality controls.
The assay of amiNo-Terminal cross-linked telopeptides of type 1 collagen (NTX) and Collagen type 1 propeptide (C1CP), Bone Alkaline Phosphatase (BAP) C-terminal cross-linking telopeptide of type I collagen (CTX) Osteocalcin (OC) as the methods in use at the laboratory had Limits of Quantification (LoD) unsuitable for detecting the concentrations of BTM on saliva.
2.6. Statistical Analysis
The evaluation of the descriptive statistics of the concentrations of biomarkers of bone metabolism assayed on salivary matrix on twenty study subjects included the overall means and distribution intervals (range and SD). The D’Agostino-Pearson test was used to assess the normality of the distribution of investigated parameters; Tukey’s statistical criterion was applied for the verification of BTM values considered suspected outliers. The presence of data outliers was a criterion for the exclusion of the subjects. The analytical variability of biomarkers of bone metabolism assays were determined by calculating the interassay imprecision (CVA), in accordance with the procedure described in Clinical and Laboratory Standards Institute (CLSI) document EP15-A2, using five aliquots of 2 saliva pools at different concentration. The analysis of variance (ANOVA) test was used to calculate intra and interindividual variance; variance and overall mean were used to calculate the total intra- and interindividual variability (CVT). CVI and CVG, were calculated as described by Harris and Yasaka [
16,
17,
18,
20,
21,
22] CVI = (CVTI2 − CVA2)1/2; CVG = (CVTG2 − CVA2)1/2. The individuality index (II) was calculated with the following formula: II = CVI/CVG and the RCV, the clinically significant variation between 2 results in a series in the same individual, was evaluated with the formula: RCV = 2½Z (CVA2 + CVI2)½ The Z score of 1.96 was regarded as significant for 2-way variation with a 95% confidence interval [
20,
21,
22,
23]. The comparison between the data in the single subjects was graphically illustrated with multiple variable graphs showing all the single determinations; the Box and Whisker plot was used for graphical comparison of data. A
p value < 0.05 was considered statistically significant. In order to obtain for this study the desired statistical power ≥ 80% with a significance level set to 5%, 20 subjects were found to constitute an appropriate sample size [
22,
23,
24]. The MedCalc software program, version 11.6.1.0 (MedCalc Software, Mariakerke, Belgium) and Analite.it have been used for statistical analysis.
3. Results
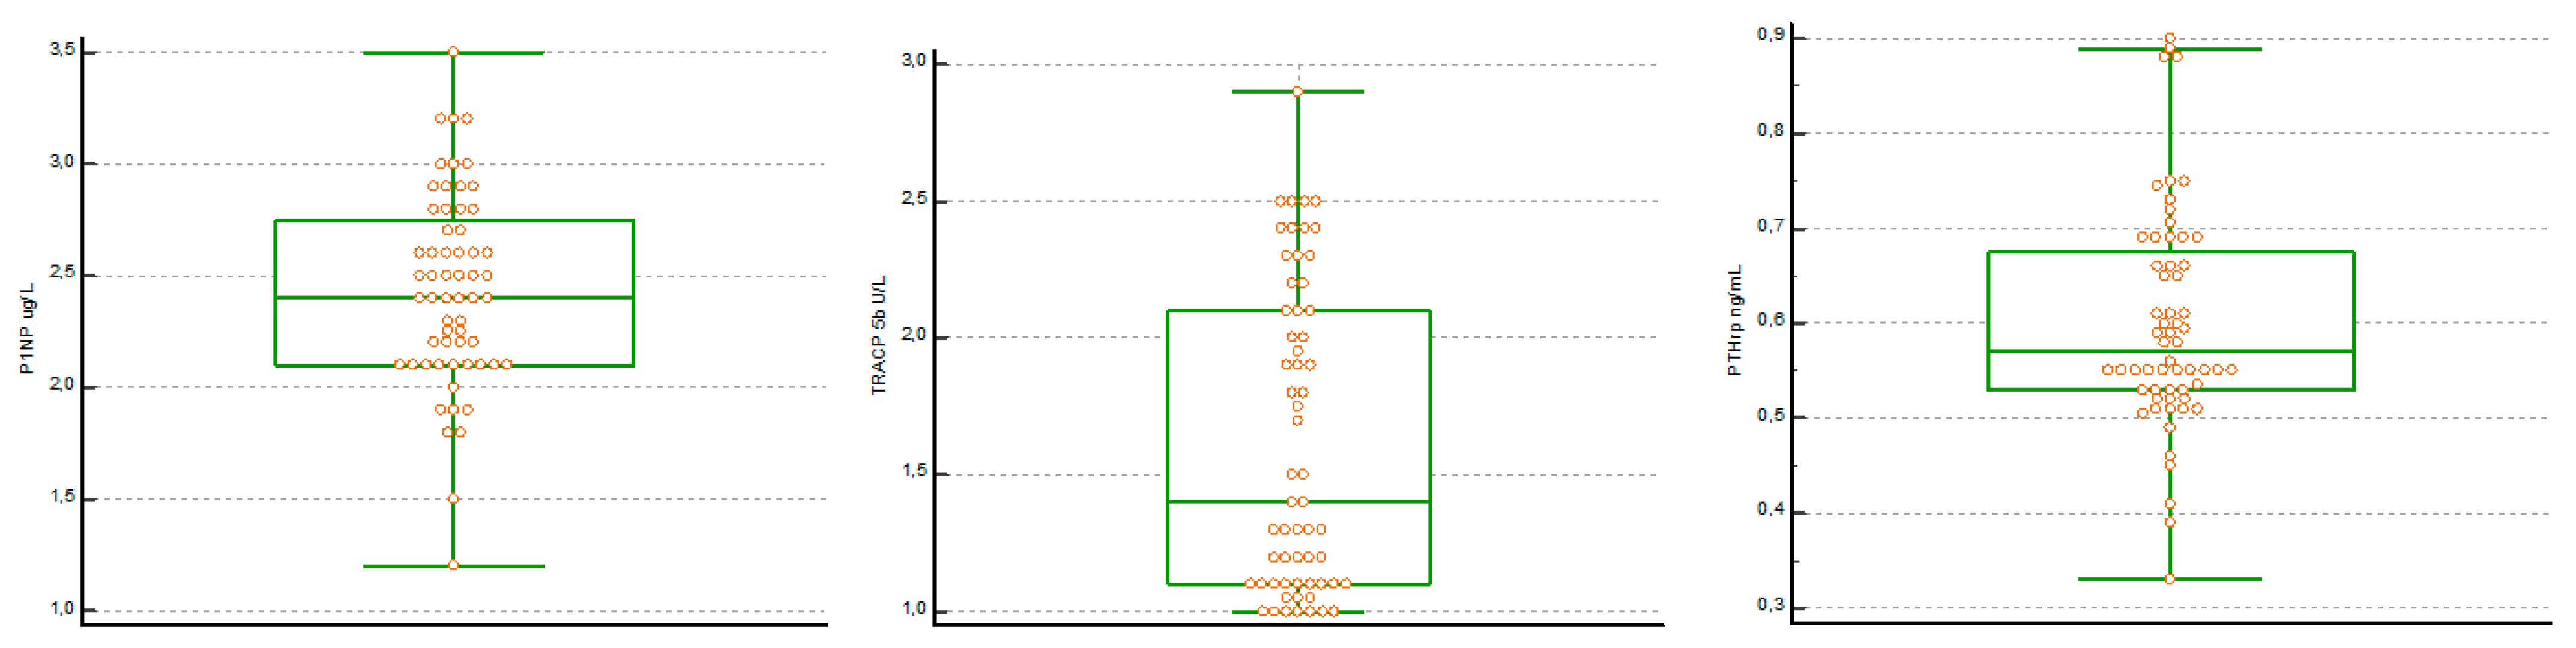
The concentrations of BTM on a salivary matrix of 20 subjects were evaluated after the identification and exclusion of n 3 subjects with aberrant values reported by the statistical evaluation. The assessment for suspected Tukey right-sided outliers was used as low values below the limit of quantification were previously excluded. The distribution of the data showed a parametric distribution only for the P1NP data; therefore, the calculation of the biological variability parameters for PTHrP and for TRACP 5b were calculated. The results are reported in
Table 1. Particularly, it was verified that the salivary concentrations of P1NP, TRAcP 5b and PTHrP were higher than the LoD of the analytical method. The Boxplot of the distribution of the values of the BTM evaluated shows the statistical summary of the concentration of the individual determinations and confirms the absence of any outside values included (
Figure 1).
The analytical variability (CVA) of BTM assays, was determined by calculating the between-run imprecision, in accordance with the procedure described in Clinical and Laboratory Standards Institute (CLSI) document EP15-A2 for P1NP, TRACP 5b and PTHrP were 5.1%, respectively (average concentration 2.0 µg/L); 4.5% (mean concentration 1.50 U/L) and 9% (mean concentration 0.52 ng/mL).
Estimates of CVA and components of biological variation for all subjects and derived individuality index (II, RCV) of salivary BTM assays are shown in
Table 2. Mean biological within-subject variance (CVI) was higher for PTHrP (23.0%) and minimal for P1NP (5.6%) while the biological variance between subjects (CVG) was higher for TRAcP 5b (35.0%). The within-subject biological variability (CVI) and between-subject BV (CVG) estimates were not calculated for sex (male and female) and on age subgroups for all measurands because the number of subjects included in the study did not allow for a correct layering. The individual mean value and the absolute range of values for each individual included in the study were reported in the multiple-variable graphs. The graphs of P1NP and TRACP 5b confirmed the high individuality of P1NP and TRACP 5b. In fact, the concentrations of the analytes in the single subject did not cover the entire range of distribution of the values (
Figure 2). The RCV was maximum for PTHrP (68.4%) and minimum for P1NP (21.2%) indicating that the significance of the change in concentrations between the two measurements was different for the BTM evaluated for laboratory test interpretation. P1NP and TRACP 5b, based on the values obtained for the biological variability, showed high individuality indicating that for the interpretation of the results of these biomarkers the comparison with any reference intervals calculated on the saliva was of little use. For the evaluation of the individuality index (II), the cut-off reported in the literature of 0.60 was considered suitable.
4. Discussion
Studies on the biological variability of BTM on saliva have received increasing attention in the last decades because they are considered essential elements to judge the potential clinical significance of a biomarker. The data on the biological variability of an analyte allow to obtain important information [
25,
26] for the evaluation of the usefulness of the reference intervals (RI) for the interpretation of the specific analytical performance of a given measurement and, above all, for the evaluation of the correct use and how to interpret the results [
23,
24,
25,
27].
Within-subject biological variability (CVI) is a component of the total variability (CVT) of a laboratory result. Therefore, the evaluation of the biological variability required an experimental protocol that included the verification of any pre-analytical variables, the selection of suitable subjects and the careful estimation of the CVA [
26,
27,
28,
29,
30].
It was necessary to strictly control each step from the selection and the preparation of the subjects, from the collection of the sample to the analytical measurements. In this regard, it was also necessary to consider the intake of drugs, alcohol and smoking as exclusion criteria. The study evaluated a group of pediatric and young adult subjects, without stratification into subgroups based on sex and age because previous studies have shown no differences in CVI between subjects in different age groups.
To obtain a reliable estimate of the CVI, blood samples were taken at regular time intervals defined according to the biomarker release processes. [
29,
31] The study took into consideration that bone resorption comprises a 4–6 week process in which osteoclasts excavate the bone to cause resorption gaps, with the release of calcium and biomarkers which from the microenvironment subsequently pass into the circulation. Bone resorption triggers bone formation by osteoblasts; this is a longer process that involves filling the resorption cavities with a non-mineralized osteoid, a collagen-rich connective tissue. Thus, biomarker levels assayed in saliva reflect the activity and number of bone-forming cells (osteoblasts) and bone-degrading cells (osteoclasts), providing an estimate of bone resorption and bone formation in a homeostatic condition. [
30,
32].
The selection of saliva samples included a check for the presence of any lesions of the buccal cavity, both hard and soft tissue [
31,
32,
33,
34] or the presence of blood contamination. In particular, it has been considered that blood can leak into the oral fluids as a result of accidental injuries, due to poor oral health or periodontal disease but also during infectious processes or as a consequence of factors which that are known to damage the mucous membranes of the oral cavity (e.g., presence of orthodontic appliances). The blood present in the saliva is a significant source of non-systematic errors and can lead to an incorrect evaluation of the salivary concentration of BTM [
31,
32,
33,
34]. In this study transferrin (TRF), a protein present in high concentrations in serum (mg/dL), but only in traces in oral fluid has been evaluated. TRF is therefore considered a potential marker of contamination of saliva with blood. Therefore, all patients with a high risk of oral health problems or visibly contaminated samples or with biochemical evaluation of blood contamination (transferrin concentrations above the LOD; HBg concentration > 150 mg/dL evaluated spectrophotometrically) were excluded from the evaluation.
CVA is associated with analytical performance in terms of measurement errors. (Sensitivity of the analytical method).
Before starting the statistical analysis, we verified that all the concentrations obtained were higher than the LoD of the analytical method, a concentration characterized by a high variability. The data reported on the analytical variability were verified with the EP15A2 protocol; however, the awareness remains that in the calculation of biological variability, unlike the pre-analytical variability, this cannot be completely removed.
Components related to biological variability were typically specific for each analyte of bone metabolism and showed a tendency to vary between subjects. The variations of the values obtained in the single subject (CVI), which are physiological in the saliva of the biomarker concentrations, are the result of a dynamic control and attributable to individual biological factors, reflect the random fluctuation of the analyte concentration around the homeostatic set point and were specific for individual biomarkers: P1PN (5.6%), TRAcP 5b (20%) and PTHrP (23%), respectively. Biological variation between subjects (CVG) i.e., the difference between homeostatic set points for the same analyte in different individuals gave different values for P1PN (18%), TRAcP 5b (35%) and PTHrP (19%9) respectively. The differences found in the expression of the components of the biological variability of P1NP, TRAcP 5b and PTHrP may be an expression of the different mechanisms of action in the bone regeneration process that occurs in the growth phase. Bone is a dynamic and metabolically active tissue that is continuously remodeling by the coordinated actions of osteoclasts and osteoblasts in cellular packages.
PINP is an indicator of bone formation and is produced during the formation of the bone matrix by cleavage of type I collagen; TRAcP 5b reflects the number of osteoclasts and is correlated to bone resorption; PTHrP instead intervenes in the physiological regulation of bone remodeling (endocrine mechanism) but it is also locally produced (paracrine function) by osteoblast progenitors; it promotes the differentiation of mature osteoblasts by inhibiting the apoptosis process that allows bone formation; moreover it stimulates the differentiation of the osteoclasts that is responsible of the bone resorption [
35]. PTHrP is present in the enamel organ and is responsible for the formation of the eruptive pathway [
36]. This observation has inspired various studies that have focused on the role of PTHrP in mediating osteoclastogenesis [
37]. In subjects in the development age, the values on the biological variability of PTHrP in saliva, the low individuality, the higher critical difference with respect to the other evaluated biomarkers and the concentrations with secretion dynamics similar to those of the serum could be explained according to the constant local paracrine production related to the need for a regulatory mechanism on bone formation and tooth growth [
35,
36,
37,
38].
P1NP and TRAcP 5b [
38] show high individuality (individuality index (II) < 0.6) equal to 0.12 and 0.56 respectively; the variation of values for each individual assessed occupies only a small part of the distribution of values for the whole group. In these cases, there is the risk of considering the value of an analyte in an individual to be improperly physiological and significantly far from its homeostatic set point but still included within the range of values obtained. On the contrary, the PTHrP shows low individuality and the dispersion of value in each individual covers most of the dispersion between individuals (ranging from 0.33 ng/mL to 0.90 ng/mL) making it useful for the interpretation of determinations a greater variation than 68.44% [
36,
37,
38,
39]
The evaluated calculation of the biological variability of the bone biomarkers was of particular interest as it provides parameters for the calculation of the critical difference (RCV). RCV is of particular interest in evaluating variations in the concentrations of bone biomarkers on salivary matrix during pathology and/or dental therapy.
The noninvasive nature and convenience of repetitive sampling of BTM from saliva in pediatric and young adult patients and the availability of tools to interpret changes in monitoring concentrations may be advantageous. In orthodontics, biomarkers related to bone turnover may introduce new possibilities for understanding bone growth and remodeling. Knowledge of the processes occurring in the periodontal tissues during orthodontics can lead to a correct choice of mechanical load with the aim of shortening the treatment period and to avoid shortening the treatment period and avoid the adverse effects associated with the treatment [
40,
41]. The impact of the saliva collection technique can also influence the concentration of the different analytes. Saliva collected from specific salivary glands is more suitable if the analyte of interest is mainly secreted by a specific gland; stimulated samples are often very diluted; the whole saliva we used is easier and faster to sample than glandular saliva and with less preanalytical variability [
42,
43].
Limitations of the Study
The guidelines do not define the total number of subjects to be enrolled, but it is intuitive that the higher the number, the better the mean estimate of the biological variation will be. In our case, the number of subjects enrolled resulted in a compromise between a high ideal number and a minimum of ten subjects that which has been considered the sufficient limit to obtain a good estimate of the biological variation for analytes not yet studied [
42,
43].
5. Conclusions
In recent decades, studies on biological variability have received increasing attention due to the practical application of this knowledge in defining important parameters for the interpretation and use of laboratory tests. Considering the importance of data on biological variation in laboratory medicine, it is essential to calculate them accurately and reliably. Taking a blood sample requires clinical indications and trained personnel, it is not only unpleasant but also technically demanding. The determination of bone turnover markers in the saliva is a potential non-invasive alternative to serum analysis. However, the question arises of the selection of the BTM serum assay methodology capable of providing accurate results in the salivary matrix (saliva sampling). Saliva analysis as a routine approach in the clinical setting can be improved by the use of standardized procedures. This study, for the first time, provides the possibility of being able to correctly integrate the biological variability of BTMs on the salivary matrix.
Besides, the salivary dosage of BTM during dental treatments, correctly established the biological variability, could be fundamental to establish the timing of the treatment and, in the case of orthodontic treatments, to evaluate the effectiveness of the applied forces.


 ,
, 


