Abstract
In this study, we aimed to evaluate the effectiveness of a brain robot in rehabilitation that combines motor imagery (MI), robotic motor assistance, and electrical stimulation. Thirteen in-patients with severe post-stroke hemiplegia underwent electroencephalography (EEG), measured according to the international 10–20 method, during MI. The dicephalus robotic system (DiC) was activated by detecting event-related desynchronization (ERD) using the Markov switching model (MSM) and relative power (RP) from the EEG of the motor cortex (C3 and C4). The reaction times (the time between ERD detection and DiC activation) of the MSM and RP were compared using Wilcoxon’s signed rank sum test. ERD was detected in all 13 and 12 patients with the MSM and RP, respectively. The DiC reaction time for the ERD detection process was significantly shorter for the MSM (13.02 ± 0.16 s) than for the RP (19.95 ± 7.45 s) (W = 9, p = 0.0037). The results of this study suggest that ERD responses can be detected in the motor cortex during MI in patients with severe upper-extremity paralysis; the MSM is more effective than the RP in detecting ERD when the EEG signal is used as a switch to activate the robot, and the reaction time to detect the signal is shorter.
1. Introduction
Motor dysfunction due to stroke limits mobility, activities of daily living, and social participation. Naturally, patients hope for an improvement of upper-extremity paralysis; however, the recovery of patients with severe upper-limb paralysis is poor, with approximately 60% of patients not reaching a practical, functional level 6 months after stroke [1].
According to Hebb’s law (use-dependent plasticity), the inability of patients with severe motor paralysis to perform voluntary upper-limb movements may not be compensated by sufficient motor activity for recovery [2,3]. Recent rehabilitation studies have shown that the principles of brain plasticity and motor learning rules are deeply involved in the improvement of motor skills after stroke [4]. Motor learning is presumed to be facilitated because active upper-limb manipulation results in better neurotransmission from motor planning to somatosensory perception than passive upper-limb practice, and somatosensory stimulation is more likely to provide feedback [5]. Therefore, voluntary active exercise is recommended to improve motor function. In rehabilitation, the use of a robot in combination with exercise therapy is recommended, as the robot supplements the amount of exercise required for the recovery of patients with severe paralysis. For example, a robot is used to ensure that the amount of exercise required outside the rehabilitation time is fulfilled. Exercise-support robots can provide exercise assistance on behalf of the therapist [6,7], and monitoring robots that allow remote therapist–patient interaction allow patients to train under therapist supervision at home [8]. In addition, robots that can encourage independent practice have been developed to enable effective training regardless of location and time [9]. Techniques have also been developed to assess joint motion with an accuracy comparable to that of humans and evaluate the effectiveness of these robotic exercises [10,11].
In rehabilitation robots, brain–computer interface (BCI) technology is used to transmit the patient’s active brain activity to the robot. A BCI is a system that records brain signals, decodes them, and converts them into effector movements. This technology operates robots based on changes in the brain waves and cerebral blood flow [12]. A biofeedback approach combining BCI with an exoskeletal robot as an effector and electrical stimulation has been reported to improve the Fugl–Meyer Assessment of upper-extremity (FMA-UE) function scores compared with conventional robotic therapy [13]. Motor imagery (MI), which activates certain brain regions when performing movements [14], has been reported to exhibit a phenomenon in which the electrical potential of the brain rapidly decreases compared with its resting state, known as event-related desynchronization (ERD) [15]. Therefore, MI-related brain waves are sometimes utilized as biomarkers in BCIs, leading to the development of BCI robots that provide feedback, such as movement assistance and electrical stimulation.
The dicephalus robotic system (DiC), a training robot for the upper-extremity joint range of motion developed at Saitama Prefectural University, can partially reproduce a therapist-assisted upper-limb movement [16]. Patients can practice repetitive upper-limb motion exercises with almost accurate trajectories through assisted movements reproduced by the robot, thus recovering upper-limb functions. However, BCIs are currently unable to determine whether the patient is actively performing upper-limb exercises; therefore, a BCI that can determine the patient’s active participation to enhance motor function recovery is needed. During rehabilitation, neurofeedback enables active motor function training, even in patients with poor motor skills due to paralysis. The sequence of joint movements and sensory feedback in accordance with the motor intention is called a closed loop, and this repetitive stimulation promotes recovery from paralysis [17]. In other words, when a robot is activated by a BCI using the brain waves of a patient performing MI, even a patient with severe paralysis can perform active-assistive upper-limb movements. By combining the feedback method with brain wave driving, patients can perform the closed-loop exercise and repeat it, which is expected to accelerate recovery more than the conventional rehabilitation method [18].
Patients with severe paralysis of the upper extremities after a stroke are believed to have decreased brain function due to disused plasticity [19]. However, it may be operable if the ERD in MI can be detected, even in a state of brain dysfunction [20]. Therefore, we aimed to verify whether ERD can be detected in patients with severe paralysis of the upper extremities in the recovery phase when they perform MI while watching a movie about arm movements. We also aimed to verify the appropriate ERD detection method to develop a BCI application that can activate and deactivate a robot by analyzing electroencephalography (EEG) signals when patients with severe paralysis of the upper extremities imagine an arm movement (Figure 1). The DiC is a six-axis dual-arm robot, and its movement direction is inputted by assisted movement, which allows for a greater degree of freedom of movement than a typical BCI robot for upper-limb training [16]. We believe that if a BCI–DiC is developed and introduced into a DiC, a new exoskeletal type of BCI robot for upper-extremity training of patients with severe paralysis will be more effective.
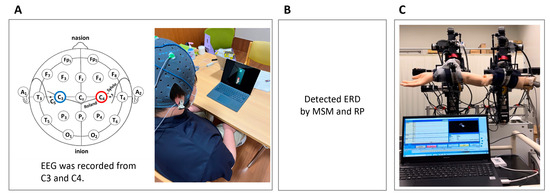
Figure 1.
Diagram of the research overview. (A) Recording of EEG signals while the patient performs motor imagery. (B) Detection of ERD from the EEG using a classifier of the MSM and RP. (C) Measurement of reaction time, which is from the start of the EEG to when the arm starts to move. EEG, electroencephalogram; ERD, event-related desynchronization; MSM, Markov switching model; RP, relative power.
2. Materials and Methods
2.1. Outline of the Method
First, event-related synchronization (ERS) was detected using the Markov switching model (MSM), and we verified whether it could be used as an operational signal for the DiC. ERS is a phenomenon in which the brain potential decreases sharply during MI in stroke survivors. MSM can accurately detect ERDs with a shorter processing time than conventional calculation methods [21]. Second, when the DiC detects ERD due to MI, we can verify whether the MSM or relative power (RP), which has been conventionally used, is more suitable.
2.2. Participants
The participants of this study were patients who were admitted to a convalescent care unit within 6 months of the onset of cerebral hemorrhage or infarction. The eligibility criteria were an FMA-UE score of <20 and a Mini-Mental State Examination (MMSE) score of ≥24. Patients with visual impairment, those with cognitive impairment to the extent that they could not understand the MI instructions, and those with difficulty concentrating, as determined by their therapists, were excluded. The diagnosis, brain lesions, onset dates, age, sex, height, and weight of the patients were obtained from their medical records.
2.3. EEG Measurement
A Polymate Pro 6100 (Miyuki Giken Co., Ltd., Tokyo, Japan) was used for the EEG signal measurements. Active electrodes were applied to C3 and C4 according to the international 10–20 method. Each participant was seated in a 40-cm-high chair or wheelchair in a resting position. A 15-inch LCD screen displaying moving images was placed before each participant. The participant’s hands were placed bilaterally on the thighs. A movie of a paralyzed patient extending the upper extremity of the paralytic side forward was shown, and the participant was instructed to “Please imagine that you are moving your arm forward in the same way as the arm movement on the screen. However, do not actually move your hand.” If the participant’s arm moved, a supervisor stopped the participant’s arm to minimize body movement. EEG signals were recorded during the MI (Figure 2).
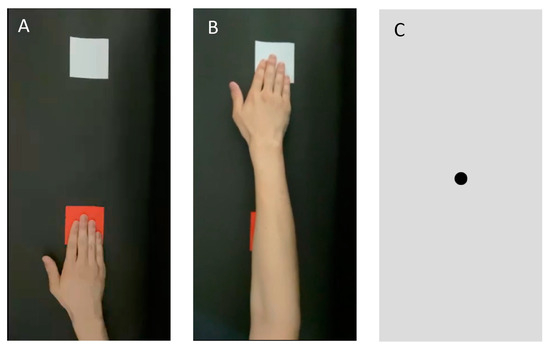
Figure 2.
Images used for the motion image. (A) An image shown 1 s before the start of MI. The patient was instructed not to perform MI during this phase. (B) After 1 s, the patient was shown a movie of a hand reaching out from a red card to a white card. The patient was instructed to imagine that he/she was stretching his/her hand in accordance with the motion picture. They were cautioned not to move their body. (C) After 4 s, the image was switched to a still image of the gazing point. MI, motion imagery.
The patients were asked to view the movie 20 times, with 10 s for one task (1 s for the presentation of a still image of the paralyzed forearm on a desk, 5 s for the movie of the upper-extremity movement, and 4 s for the interval gazing point). Before measuring the EEG signals, the patients were shown the same movie 20 times for the MI practice. The interval between the practice and EEG recording phases was 2 min. The participants were instructed to rest without thinking while looking at the gazing point. This was one task and had to be performed 20 times. The patients practiced first and were then tested (Figure 3).
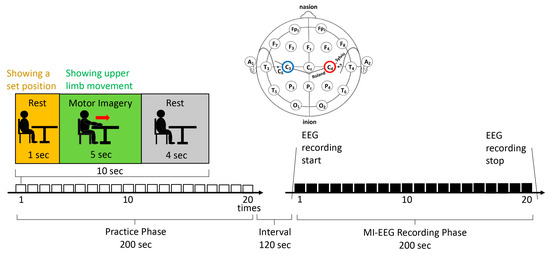
Figure 3.
Electroencephalogram recording protocol.
2.4. EEG Analysis
The detection of ERD using the MSM and activation of the DiC by the EEG in patients with moderate to severe upper-extremity paralysis was verified. The reaction time from the detection of ERD to the activation of the DiC was measured.
2.4.1. EEG Data Conversion Procedure
The EEG data acquired using the experimental protocol were transformed according to the following procedures and used for the ERD detection experiment:
- EEG data were converted into CSV files without filtering from the EEG detection.
- The CSV files were converted to CAL files compatible with the DiC application using a data converter application.
- In the CAL files, according to the MI protocol, potential data were associated with binary data of 1 during the MI period and 0 during the rest period.
- The CAL files were loaded into the DiC application, and the MSM and RP classifiers were created.
- In the MSM, the ERD transition probability was derived from four events: the true-positive rate (TPR), false-positive rate (FPR), true-negative rate (TNR), and false-negative rate (FNR).
- In RP, the ERD was derived by calculating the root mean square (RMS) from the resting potential and dividing it by the EEG potential.
- The EEG threshold for ERD appearance was set as the signal that activated the DiC; therefore, the ERD appearance probability for MSM and the rate of change based on the resting EEG for RP were used.
- The CAL files were loaded again into the DiC application, and when the MSM or RP threshold was exceeded, a signal was sent to control the DiC, and the DiC arm was activated.
2.4.2. Detecting ERD
The MSM was predicted from the change in brain potentials in 1 s to the change in brain potentials that occurred in the next second (Figure 4). The calculation involved the following steps: rest time data, which were considered as the EEG reference, were used for machine learning. The magnitude of the EEG amplitude was converted into a variance, and variance S1 of the rest state and variance S2 of the ERD state were defined by Equation (1):
where yt represents the time, t, and the variance at that time, and represents the state, St, as shown in Equation (2):
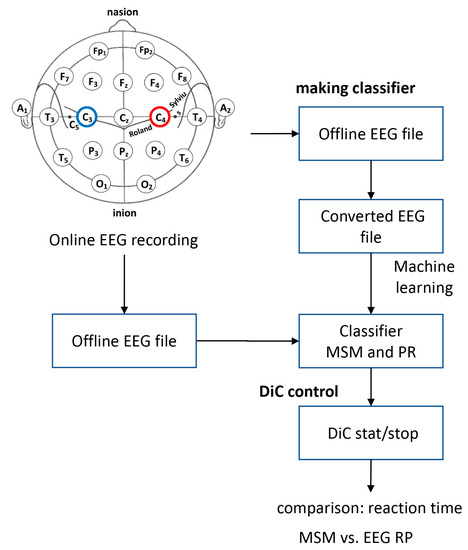
Figure 4.
Procedure for recording EEG to control the DiC.
If the probability of being S1 is p and that of being S2 is q, the probability of the state of St after 1 s can be expressed in the following form, Equation (3):
where p = positive, 1 − p = false − positive, 1 – q = false − negative, and q = negative.
The probability of St can be calculated by Equation (4):
The probability of ERD occurrence predicted by MSM was calculated using Equation (5):
where is or , and y is the brain potential being measured.
2.4.3. ERD Calculation with RP
The EEG signals of patients during MI were converted to the RMS using Equation (6) and were used as baseline data.
Using Equation (7), the potential difference was calculated by subtracting the brain potential read using the DiC from the baseline at the time of EEG detection. In addition, the relative potential decrease or increase was determined using Equation (8):
2.5. The DiC
The DiC assists patients’ upper-extremity movements by activating the two arms that support the upper arm and forearm. The DiC also memorizes the positions of the two arms in the movements assisted by the therapist. It can reproduce almost the same movements of the patient’s upper arm and forearm [22]. The DiC can perform repetitive exercises while reproducing smooth motions performed by humans and practice exercises in the same manner as therapists. ERDs detected by the MSM or RP classifier were converted into signals to activate the DiC, and the reaction time taken from the EEG playback to the ERD detection was measured using the respective calculation methods of MSM and RP.
2.6. Reaction Time of the DiC
The EEG data recorded from the patients were loaded into the DiC, and the reaction time from when the analysis of ERD detection started to when the DiC arm was activated was measured. This reaction time was defined as δ(t) from when the EEG was replayed to when the elbow joint of the arm held by the DiC started flexing.
2.7. Sample Size
The main outcome was considered the EEG processing time for the MSM and RP, with an α error probability of 0.05, a 1−β error probability of 0.8, and an effect size of 0.71. The minimum sample size was calculated to be 8 using G*Power version 3.1.9. 2 (HHU, Düsseldorf, Germany; 2014).
2.8. Statistical Analysis
The ability to detect ERD in stroke survivors was determined using the activation of the DiC. In the MSM, the sliding window of the EEG-signaled DiC activation occurred when the probability of ERD occurrence was <60% and the probability of the resting state was <40% during a moving average of 1 s. In RP, the RMS of the resting EEG was used as the reference value, and a signal to activate the DiC was sent when the RMS exceeded 1.5 times the reference value for >0.2 s. If the elbow joint of the arm held by the DiC moved with each signal, ERD was considered detected. The time (t) between the EEG playback and ERD detection was measured using the MSM and RP, and the reaction times of both systems were compared using Wilcoxon’s signed rank sum test. The statistical significance level was set at <5%.
2.9. Methods for Exclusion of Missing Data and Outliers for the Reaction Time from the EEG Playback to ERD Detection
The difference between the third and first quartiles of the total reaction time from the EEG playback to ERD detection was defined as the interquartile range (IQR). ‘Mean + IQR’ and ‘mean − IQR’ were defined as the upper and lower inner boundary points, respectively; values beyond the upper and lower inner boundary points were excluded from the statistical analysis as outliers.
2.10. Patients’ Subjective Evaluation of MI
The visual analog scale (VAS) was used for the subjective evaluation of MI by the patients. The VAS scores (1–10), which were provided by the patients, indicated the quality of the MI.
2.11. Method for Analyzing the Relationship between the Subjective Quality of MI and the Time from EEG Playback to ERD Detection
The correlation between the MI quality based on the VAS and the reaction time from the EEG playback to ERD detection was analyzed using Spearman’s rank correlation coefficient.
3. Results
3.1. Participant Analysis
Among the hospitalized stroke survivors, 18 met the eligibility criteria. Among them, 16 provided informed consent to participate in this study. The case of one patient, who was discharged from the hospital after the experiment, was postponed because of the COVID-19 outbreak, and two patients who recovered from paralysis and whose FMA-UE scores exceeded the eligibility criteria of 20 points were excluded, leaving 13 patients for the experimental analysis. In the experiment in which ERDs were detected by the MSM and RP algorithms, the data regarding the 13 patients were detected by MSM, and one patient, whose data could not be detected by RP, was excluded from the analysis. In the measurements of the reaction time using the DiC activated by the ERD data detected by the MSM, one patient, who was an outlier, and three patients whose reaction times could not be measured owing to machine trouble were excluded. Finally, nine patients were included in the analysis. Using the ERD data detected by RP, two outliers were excluded, and 10 patients were analyzed (Figure 5).
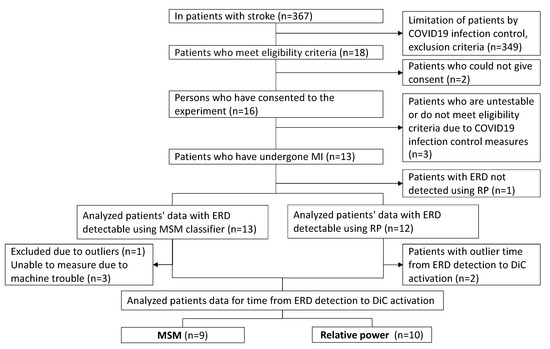
Figure 5.
Flow chart regarding participant selection.
3.2. Descriptive Data Regarding the Participants
All the patients were right-handed and had the following clinical characteristics (presented as medians with [first quartile, third quartile]): age, 63 [53, 77] years; height, 167.0 [153.0, 171.5] cm; weight, 58.5 [57.0, 60.3] kg; days from onset, 84.0 [44.0, 109.0]; FMA-UE score, 8.0 [7.0, 9.0]; and MMSE score, 28.0 [27.0, 29.0]. Five patients had a capsular hemorrhage, three had open coronary infarction, one had a thalamic hemorrhage, one had an infarction in the basal ganglia region, one had a lacunar infarction in the left internal hind leg, and one had an infarction in the left anterior cerebral artery (ACA)/middle cerebral artery (MCA) region (Table 1).

Table 1.
Clinical characteristics of the patients.
3.3. ERD Detection during MI
ERD was detected in all 13 patients with the MSM and 12 of the 13 patients with the RP. An example of ERD detection is shown in Figure 6. ERDs were detected in both the MSM and RP, and the movement of the DiC arm, which was reconfirmed by moving images, was included in the analysis.
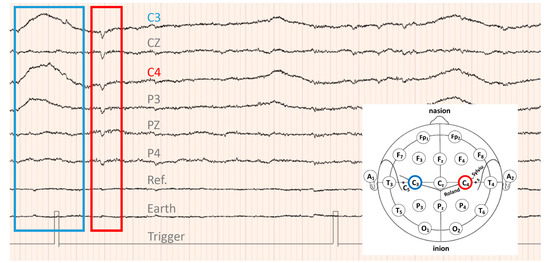
Figure 6.
EEG data of patient 6: lesion, right radial coronary infarction; FMA-UE score, 8 points; MMSE score, 30 points; age, 77 years. The patient passed 109 days from the onset of stroke. ERD, downward convex waveform surrounded by red lines; ERS, upward convex waveform surrounded by blue lines.
In terms of RP, no joint motion of the DiC was observed in the movie captured during the experiment with patient 1. Therefore, we concluded that the ERD signal could not be detected in this patient. The data for patient 1 were excluded from the RP analysis. In addition, outliers were tested for each of the 12 patients, except for patient 1, and two patients with outliers were excluded from the analysis. Finally, the RP reaction time was analyzed in 10 patients.
3.4. Comparison of the Reaction Time between the MSM and RP
The reaction time of the DiC for detecting ERD by the MSM and RP were compared. The time between the start of the EEG playback and the start of elbow flexion by the DiC was measured and compared with the reaction time (t) (Table 2). Because data normality was not confirmed when the Shapiro–Wilk test was performed regarding the MSM and RP reaction times (MSM, W = 0.79, p = 0.014; RP, W = 0.84, p = 0.044), Wilcoxon’s signed rank sum test was used for this analysis. The MSM reaction time (13.02 ± 0.16 s) was significantly shorter than that of the RP (19.95 ± 7.45 s) (W = 9, p = 0.0037; Figure 7).
Table 2.
Reaction time between the reception of the electroencephalogram and activation of the DiC and patients’ subjective quality of MI.
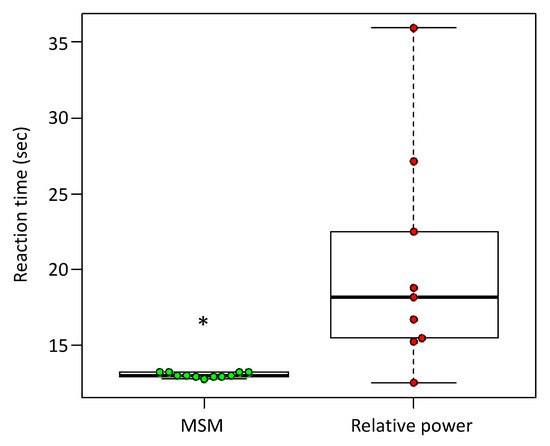
Figure 7.
Comparison of the reaction time from ERD detection to DiC activation for the MSM and RP. The vertical axis indicates reaction time; MSM, n = 12; RP, n = 10; * W = 12, p < 0.0017, by Wilcoxon’s signed rank sum test.
3.5. Relationship between the Subjective Quality of MI and the Reaction Time of the DiC
Table 2 shows the time from EEG playback in the MSM and RP until the DiC performed elbow joint flexion and the patients’ subjective MI quality. No significant correlation between the reaction time from EEG playback to ERD detection and the subjective quality of MI was found for either MSM (NMSM = 8, rMSM = 0.28, pMSM = 0.50) or RP (NRP = 9, rRP = −0.11, pRP = 0.78) (Figure 8).
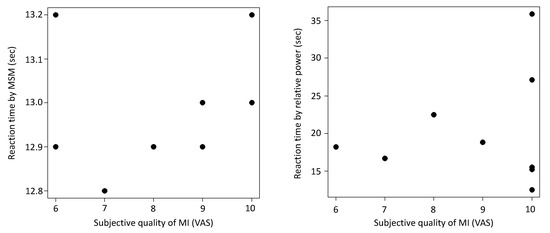
Figure 8.
Correlation between the reaction time from event-related desynchronization (ERD) detection to DiC activation and subjective quality of motor imagery (MI) in the MSM and relative power (RP). The vertical axis shows the response time, and the horizontal axis shows the quality score regarding MI based on the visual analog scale (VAS). (Left) MSM, r = −0.110, p = 0.779, n = 9. (Right) RP, r = 0.280, p = 0.503, n = 10.
4. Discussion
4.1. ERD Detection during MI in Patients with Severe Post-Stroke Hemiplegia
In the present study, a decrease in EEG potential was observed during MI in a patient with severe upper-extremity paralysis, and an ERD response was confirmed. ERD suggests a decrease in EEG potential, which is characterized by a change from α waves seen in a resting EEG to β and γ waves during MI [23]. Similarly, a recent study reported ERD based on changes in the EEG potential and frequency bands during MI [22]. In this study, ERD was detected from the ratio of the RMS of the resting EEG and EEG potential differences during MI, suggesting that ERD manifesting during MI is detectable in patients with stroke.
The time since stroke onset varied among the patients, with a median of 84 days, a minimum of 29 days, and a maximum of 194 days. The aim of this study was to verify whether ERD can be detected in patients with severe paralysis of the upper extremities in the recovery phase when they perform MI while watching a movie about arm movements. Patients with stroke experience long-standing deterioration of brain function due to disused plasticity after stroke onset [16]. Although inactivation of the motor cortex was presumed to have occurred in the participants of the present study, ERD was detected in 12 of the 13 patients. In this study, 20 MI sessions were performed as a practice set before analyzing the test set. Our results suggest that MI can excite the motor cortex and detect ERD, even in patients with short or long periods of inactivity due to severe paralysis of the upper extremities.
4.2. Implementation of BCI Application by the MSM and RP
The results of this study suggest that the MSM is more efficient than the RP in detecting ERD. In this study, one MI was performed every 10 s, and an ERD appeared once every 10 s. However, several patients with RP required >20 s before an ERD was detected. This is presumably because ERD was detected during the second and subsequent trials and not during the first RP trial.
Owing to the difference between the MSM and RP processing, the reaction time of the DiC suggested that the MSM required a shorter processing time than RP. This is presumably because the MSM performs computational processing while predicting the EEG change after 1 s, and the time required for feedback is shorter than that for processing based on the RP results [21]. However, the reaction time from ERD detection to the activation of the DiC was >10 s, which is too long for real-time feedback, and the issue of shortening the robot’s reaction time remains. In addition, there was no correlation between the reaction time from ERD detection to the activation of the DiC and the subjective quality of MI. Two types of MI have been reported: visual motor imagery (VMI) and kinesthetic motor imagery (KMI) [24]. A previous study showed a correlation between KMI and the ERD magnitude during MI [24]. However, the results of this study suggested that the quality of MI did not affect the time to onset of ERD. This infers that subjective KMI is not related to how quickly corticospinal excitability is transmitted but to how large the change from resting to motor imagery state is. Therefore, it is difficult to improve the quality of MI to reduce ERD detection time, and the control system needs to be adjusted by improving the application to reduce the detection time. Therefore, the DiC control system must be improved to provide real-time feedback. The current DiC is programmed to return to the initial position of elbow flexion before starting the movement to safely move the patient’s joints. This movement takes approximately 5.1 s for MSM. In addition, to prepare the patient for joint movements, a countdown was provided for 4 s before the DiC performed joint movements. If the time to return to the initial position and the countdown time can be eliminated, the time can be shortened to approximately 9 s. However, at present, priority must be given to the safety of the patient’s joint motions rather than eliminating the time loss of real-time feedback.
Barrett Technologies’ (Newton, MA, USA) WAM 7-degree-of-freedom arm is a BCI robot proposed by Gomez-Rodriguez et al., in which each movement block is controlled [25]. WAM was set to perform one trial per block and one drive per MI, and an interval of a few seconds was provided for each block. For MI, patients are instructed to “relax” at the beginning, followed by MI following a “GO” cue. When the robot is activated, the patients are prepared for the exercise, and safety is ensured by not providing rapid assistance. The current BCI–DiC should also follow this approach and consider controlling the movement of one block and trial simultaneously.
4.3. Limitations
A potential limitation of our study is the small sample size; it does not reflect the complexity of the motor dysfunctions in EEG, which are multifactorial in nature and include factors such as muscle weakness and spasticity after a stroke. Additionally, the MSM data acquisition failed in 4 out of 13 participants. This failure suggests that the DiC did not obtain sufficient measurement settings in this study. Therefore, further studies with a larger number of participants, including ERD estimations of the DiC with multiple EEG detection methods of the robotic system, are warranted to improve the generalizability of our findings.
Our analyses were conducted in a laboratory using the sampled patients’ EEGs, and the patients did not directly manipulate the DiC. Therefore, this study did not prove that the patients could operate the DiC appropriately. In addition, the time from stroke onset varied among the patients, which may have caused individual differences in the quality of MI due to the different degrees of progression of disused plasticity. In our next study, a more limited investigation of the onset period is needed to clarify the operability of the DiC.
5. Conclusions
The results of our study suggest that ERD can be detected on EEGs, even in patients with severe upper-extremity paralysis. This is an important finding for expanding the range of applications of BCI robots. To make the BCI–DiC practical, it will be necessary to conduct investigations regarding methods to shorten the feedback time, improve safety control systems, devise problem-solving methods, and verify the effectiveness of the BCI–DiC for development.
6. Patents
Rehabilitation Support System, Patent No. 6598319, 2019, Japan.
Author Contributions
Methodology, T.H.; software, T.H.; validation, T.H.; formal analysis, T.Y.; research, T.Y.; resources, T.Y.; data curation, T.Y.; editing, T.Y. and T.H.; visualization, T.Y. and T.H.; supervision, T.H.; project management, T.H.; funding, T.H. All authors have read and agreed to the published version of the manuscript.
Funding
This study was supported by Grants for Robot Development from the Department of Industry and Labor, Saitama Prefectural Government 2015−2017, awarded to T.H.
Institutional Review Board Statement
The study was conducted in accordance with the Declaration of Helsinki, and the protocol was approved by the Toda Central Rehabilitation Hospital Ethics Review Board on 8 July 2021 (approval No. R3-6).
Informed Consent Statement
The participants were informed of the details of the experiment, and informed consent was obtained from all the patients involved in this study.
Data Availability Statement
The data presented in this study are available upon request from the corresponding author. The data are not publicly available due to ethical restrictions.
Acknowledgments
The authors are deeply grateful to the patients who participated in this study. We thank Seiichi Nishino, director of the Toda Chuo Rehabilitation Hospital, Tatsuya Inagaki, and Naoki Tsurugasaki for their technical assistance with the experiments. We also thank Takashi Yasojima of the Saitama Prefectural University Faculty of Health and Welfare for the years of collaboration and advice.
Conflicts of Interest
The authors declare no conflict of interest. The funders had no role in the design of the study; in the collection, analyses, or interpretation of data; in the writing of the manuscript; or in the decision to publish the results.
Abbreviations
ACA, anterior cerebral artery; BCI, brain–computer interface; FNR, false-negative rate; FMA-UE, Fugl–Meyer Assessment of upper-extremity; DiC, dicephalus robotic system; EEG, electroencephalography; ERD, event-related desynchronization; ERS, event-related synchronization; FPR, false-positive rate; IQR, interquartile range; KMI, kinesthetic motor imagery; MSM, Markov switching model; MCA, middle cerebral artery; MMSE, Mini Mental State Examination; MI, motor imagery; RP, relative power; RMS, root mean square; TNR, true-negative rate; TPR, true-positive rate; VAS, visual analog scale; VMI, visual motor imagery.
References
- Samar, M.; Saussez, G.; della Faille, M.; Prist, V.; Zhang, X.; Dispa, D.; Bleyenheuft, Y. Rehabilitation of motor function after stroke: A multiple systematic review focused on techniques to stimulate upper extremity recovery. Front. Human Neurosci. 2016, 10, 442. [Google Scholar] [CrossRef]
- Thrane, G.; Emaus, N.; Askim, T.; Anke, A. Arm use in patients with subacute stroke monitored by accelerometry: Association with motor impairment and influence on self-dependence. J. Rehabil. Med. 2011, 43, 299–304. [Google Scholar] [CrossRef]
- Nudo, R.J.; Milliken, G.W.; Jenkins, W.M.; Merzenich, M.M. Use-dependent alterations of movement representations in primary motor cortex of adult squirrel monkeys. J. Neurosci. 1996, 16, 785–807. [Google Scholar] [CrossRef] [PubMed]
- Schaechter, J.D.; Kraft, E.; Hilliard, T.S.; Dijkhuizen, R.M.; Benner, T.; Finklestein, S.P.; Rosen, B.R.; Crame, S.C. Motor recovery and cortical reorganization after constraint-induced movement therapy in stroke patients: A preliminary study. Neurorehabilit. Neural Repair 2002, 16, 326–338. [Google Scholar] [CrossRef] [PubMed]
- Fetz, E.E.; Finocchio, D.V.; Baker, M.A.; Soso, M.J. Sensory and motor responses of precentral cortex cells during comparable passive and active joint movements. J. Neurophysiol. 1980, 43, 1070–1089. [Google Scholar] [CrossRef] [PubMed]
- Chien, W.-T.; Chong, Y.-Y.; Tse, M.-K.; Chien, C.-W.; Cheng, H.-Y. Robot-assisted therapy for upper-limb rehabilitation in subacute stroke patients: A systematic review and meta-analysis. Brain Behav. 2020, 10, e01742. [Google Scholar] [CrossRef]
- Xia, W.; Dai, R.; Xu, X.; Huai, B.; Bai, Z.; Zhang, J.; Jin, M.; Niu, W. Cortical mapping of active and passive upper limb training in stroke patients and healthy people: A functional near-infrared spectroscopy study. Brain Res. 2022, 1788, 147935. [Google Scholar] [CrossRef]
- Ameur, L.; Ridha, K.; Ahmed, C. AI-based Human Tracking for Remote Rehabilitation Progress Monitoring. In Proceedings of the ICAECE 2023—International Conference on Advances in Electrical and Computer Engineering, Tebessa, Algeria, 15–16 May 2023. HAL ID: lirmm-04107931. [Google Scholar]
- Johanna, R.O.; Livia, N. Design of a mobile game application to support hand rehabilitation of stroke patients in Indonesia. Int. J. Technol. 2017, 2, 250–261. [Google Scholar] [CrossRef]
- Ferriero, G.; Sartorio, F.; Foti, C.; Primavera, D.; Brigatti, E.; Vercelli, S. Reliability of a new application for smartphones (DrGoniometer) for elbow angle measurement. PM&R 2011, 3, 1153–1154. [Google Scholar] [CrossRef]
- Ameur, L.; Ridha, K.; Ahmed, C.; Adlen, K. Reliability and validity analysis of MediaPipe-based measurement system for some human rehabilitation motions. Measurement 2023, 214, 112826. [Google Scholar] [CrossRef]
- Baniqued, P.D.E.; Stanyer, E.C.; Awais, M.; Alazmani, A.; Jackson, A.E.; Mon Williams, M.A.; Mushtaq, F.; Holt, R.J. Brain–computer interface robotics for hand rehabilitation after stroke: A systematic review. J. Neuroeng. Rehabil. 2021, 18, 15. [Google Scholar] [CrossRef] [PubMed]
- Ang, K.K.; Chua, K.S.G.; Phua, K.S.; Wang, C.; Chin, Z.Y.; Kuah, C.W.K.; Low, W.; Guan, C. A randomized controlled trial of EEG-based motor imagery brain-computer interface robotic rehabilitation for stroke. Clin. EEG Neurosci. 2015, 46, 310–320. [Google Scholar] [CrossRef] [PubMed]
- Hanakawa, T.; Immisch, I.; Toma, K.; Dimyan, M.A.; Van Gelderen, P.; Hallett, M. Functional properties of brain areas associated with motor execution and imagery. J. Neurophysiol. 2003, 89, 989–1002. [Google Scholar] [CrossRef] [PubMed]
- Li, F.; Peng, W.; Jiang, Y.; Song, L.; Liao, Y.; Yi, C.; Zhang, L.; Si, Y.; Zhang, T.; Wang, F.; et al. The dynamic brain networks of motor imagery: Time-varying causality analysis of scalp EEG. Int. J. Neural Syst. 2019, 29, 1850016. [Google Scholar] [CrossRef]
- Saito, Y.; Suzuki, M.; Koike, Y.; Koizumi, K.; Nakaya, N.; Abo, M.; Hamaguchi, T. Reproducibility between robot and human movements: Preliminary development of a robotic device reconstructing therapeutic motion. J. Ergon. Technol. 2020, 20, 10–19. [Google Scholar]
- Jia, J. Exploration on neurobiological mechanisms of the central–peripheral–central closed-loop rehabilitation. Front. Cell Neurosci. 2022, 16, 982881. [Google Scholar] [CrossRef]
- López-Larraz, E.; Sarasola-Sanz, A.; Irastorza-Landa, N.; Birbaumer, N.; Ramos-Murguialday, A. Brain-machine interfaces for rehabilitation in stroke: A review. NeuroRehabilitation 2018, 43, 77–97. [Google Scholar] [CrossRef]
- Newbold, D.J.; Laumann, T.O.; Hoyt, C.R.; Hampton, J.M.; Montez, D.F.; Raut, R.V.; Ortega, M.; Mitra, A.; Nielsen, V.; Miller, D.B.; et al. Plasticity and spontaneous activity pulses in disused human brain circuits. Neuron 2020, 107, 580–589. [Google Scholar] [CrossRef]
- Zhang, J.; Wang, M. A survey on robots controlled by motor imagery brain-computer interfaces. Cogn. Robot. 2021, 1, 12–24. [Google Scholar] [CrossRef]
- Lisi, G.; Rivela, D.; Takai, A.; Morimoto, J. Markov switching model for quick detection of event related desynchronization in EEG. Front. Neurosci. 2018, 12, 24. [Google Scholar] [CrossRef]
- Paszkiel, S.; Dobrakowski, P. Brain–computer technology-based training system in the field of motor imagery. IET Sci. Meas. Technol. 2020, 14, 1014–1018. [Google Scholar] [CrossRef]
- Pfurtschellera, G.; Lopes da Silva, F.H. Event-related EEG/MEG synchronization and desynchronization: Basic principles. Clin. Neurophysiol. 1999, 110, 1842–1857. [Google Scholar] [CrossRef] [PubMed]
- Toriyama, H.; Ushiba, J.; Ushiyama, J. Subjective Vividness of Kinesthetic Motor Imagery Is Associated with the Similarity in Magnitude of Sensorimotor Event-Related Desynchronization Between Motor Execution and Motor Imagery. Front. Neurosci. 2018, 12, 295. [Google Scholar] [CrossRef] [PubMed]
- Gomez-Rodriguez, M.; Grosse-Wentrup, M.; Gharabaghi, J.H.A.; Scholkopf, B.; Peters, J. Towards brain-robot interfaces in stroke rehabilitation. In Proceedings of the 2011 IEEE International Conference on Rehabilitation Robotics, Zurich, Switzerland, 29 June–1 July 2011; pp. 1–6. [Google Scholar] [CrossRef]
Disclaimer/Publisher’s Note: The statements, opinions and data contained in all publications are solely those of the individual author(s) and contributor(s) and not of MDPI and/or the editor(s). MDPI and/or the editor(s) disclaim responsibility for any injury to people or property resulting from any ideas, methods, instructions or products referred to in the content. |
© 2023 by the authors. Licensee MDPI, Basel, Switzerland. This article is an open access article distributed under the terms and conditions of the Creative Commons Attribution (CC BY) license (https://creativecommons.org/licenses/by/4.0/).