Article

Applying Statistical Models to Optimize the Weld Bead Geometry in the Vertical Oscillation Arc Narrow Gap All-Position GMAW

School of Mechanical Engineering, Xinjiang University, Urumqi 830049, China
*
Author to whom correspondence should be addressed.
Appl. Sci. 2023, 13(11), 6801; https://doi.org/10.3390/app13116801
Submission received: 29 April 2023 / Revised: 31 May 2023 / Accepted: 1 June 2023 / Published: 3 June 2023
(This article belongs to the Special Issue Metal Additive Manufacturing and Welding)

Abstract

:
Vertical oscillation arc welding for narrow gap gas metal arc welding (NG-GMAW) has a relatively simple structure, and it is widely used in all-position pipeline field welding. However, it has some shortcomings, such as incomplete fusion defects on the sidewall and interlayer. Aiming at resolving these shortcomings, a mathematical model is proposed to obtain appropriate welding parameters in different positions. In this model, the response surface methodology (RSM) based on the central composite design (CCD) was developed to study the interactions between welding parameters and the weld bead geometry. Then the analysis of variance (ANOVA) was used to evaluate the accuracy and significance of the proposed model. Finally, experiments were carried out in flat, vertical, and overhead positions to obtain the optimal parameters. The macroscopic metallography of the transversal section of the weld bead under the optimizing welding parameters showed that the weld beads were free of defects in the sidewall and interlayers.

1. Introduction

Compared to traditional welding methods, all-position narrow gap gas metal arc welding (NG-GMAW) has lower heat input, lower material consumption, small thermal deformation, and high productivity. Accordingly, this method has been widely used in diverse industries such as oil and gas and even the nuclear industry to weld large structural parts, pressure vessels, and pipelines [1,2,3,4,5]. In the all-position narrow gap welding process, when the welding position changes from flat to an overhead position, gravity affects the molten pool in the opposite direction gradually. The molten pool is also affected by other factors such as voltage, current, speed of welding, shielding gas composition, and flow rate. Because of these factors, incomplete fusion is prone to occur in the welding bead, sidewall, and interlayers [2,6,7]. Studies show that these defects generally originate from the lack of heat input control and the formation of the poor upper weld bead. Aiming at resolving this problem, numerous investigations have been carried out to improve the quality of narrow gap welding, and different methods, such as angular swing arc [8,9,10], rotating arc [1,11,12], tandem GMAW [13,14,15], laser welding [16,17,18], hybrid laser-arc welding [19,20,21], and cable-type wire welding [6,22,23] have been developed. Although these methods have remarkable achievements, they have high requirements for welding equipment in welding long-distance pipelines in the field environment, which limits the development of automatic welding for pipelines in the field. In order to resolve this shortcoming, vertical oscillation arc welding with relatively fewer requirements on equipment structure was developed, but the stability of the welding process and quality of the weld bead should be further promoted. A review of the literature indicates that mathematical models are powerful tools that can help find the relationship between input and target parameters. Modensi [24] adopted the partial factorial design scheme to investigate the influence of input variables and their interactions in determining weld bead shape in NG-GMAW. Response Surface Methodology (RSM) has captured the interest of many researchers and engineers worldwide [25]. Xu et al. [2,26] used RSM based on central composite design (CCD) to predict and optimize weld bead geometry for angular swing arc NG-GMAW. Chang et al. [27] employed the optimized BP neural network to predict the penetration of asymmetrical fillet root welding in GMAW. Padmanaban et al. [28] developed an empirical relationship to predict the tensile strength of laser beam welded AZ31B magnesium alloy using response surface methodology. Li et al. [29] proposed a hybrid model to describe the groove sidewall penetration dynamics for the rotational arc NG-GMAW process, which includes a support vector machine (SVM)-based dynamic model and a cubic polynomial regression model to predict the penetration. Wang et al. [30] established the mapping model between weld parameters and process parameters under limited sample conditions based on a four-layer BP neural network optimized with a genetic algorithm. Li et al. [31] presented an integrated process-performance model, which is composed of a finite element-based process model to calculate the weld area and an artificial neural network-based performance model to predict the weld quality. Shi et al. [7] applied statistical models to study the interactions between welding parameters and geometry of a single bead and provided a guidance trajectory for automatic multi-pass narrow-gap laser welding. Pan et al. [32,33] optimized laser welding parameters on Mg alloy and its multiple quality characteristics via a Taguchi method-based grey analysis. Asit [34] performed the grey Taguchi analysis and optimized laser parameters in the laser welding of dissimilar materials to increase hardness and reduce HAZ during welding. The abovementioned methods show that statistical methods can be effectively applied to optimize the welding parameters.
In the present study, combined with previous research work [35], it was intended to combine the all-position NG-GMAW method with vertical oscillation arc welding. Then the welding parameters were optimized to achieve the desired sidewall penetration and weld bead shape and reduce incomplete fusion on the sidewall and interlayer. Statistical techniques were employed to design the experiments and analyze the generated data. The response surface methodology (RSM) based on central composite design (CCD) was employed to develop the statistical model of the weld bead shape and optimize the welding parameters.

2. Materials and Methods

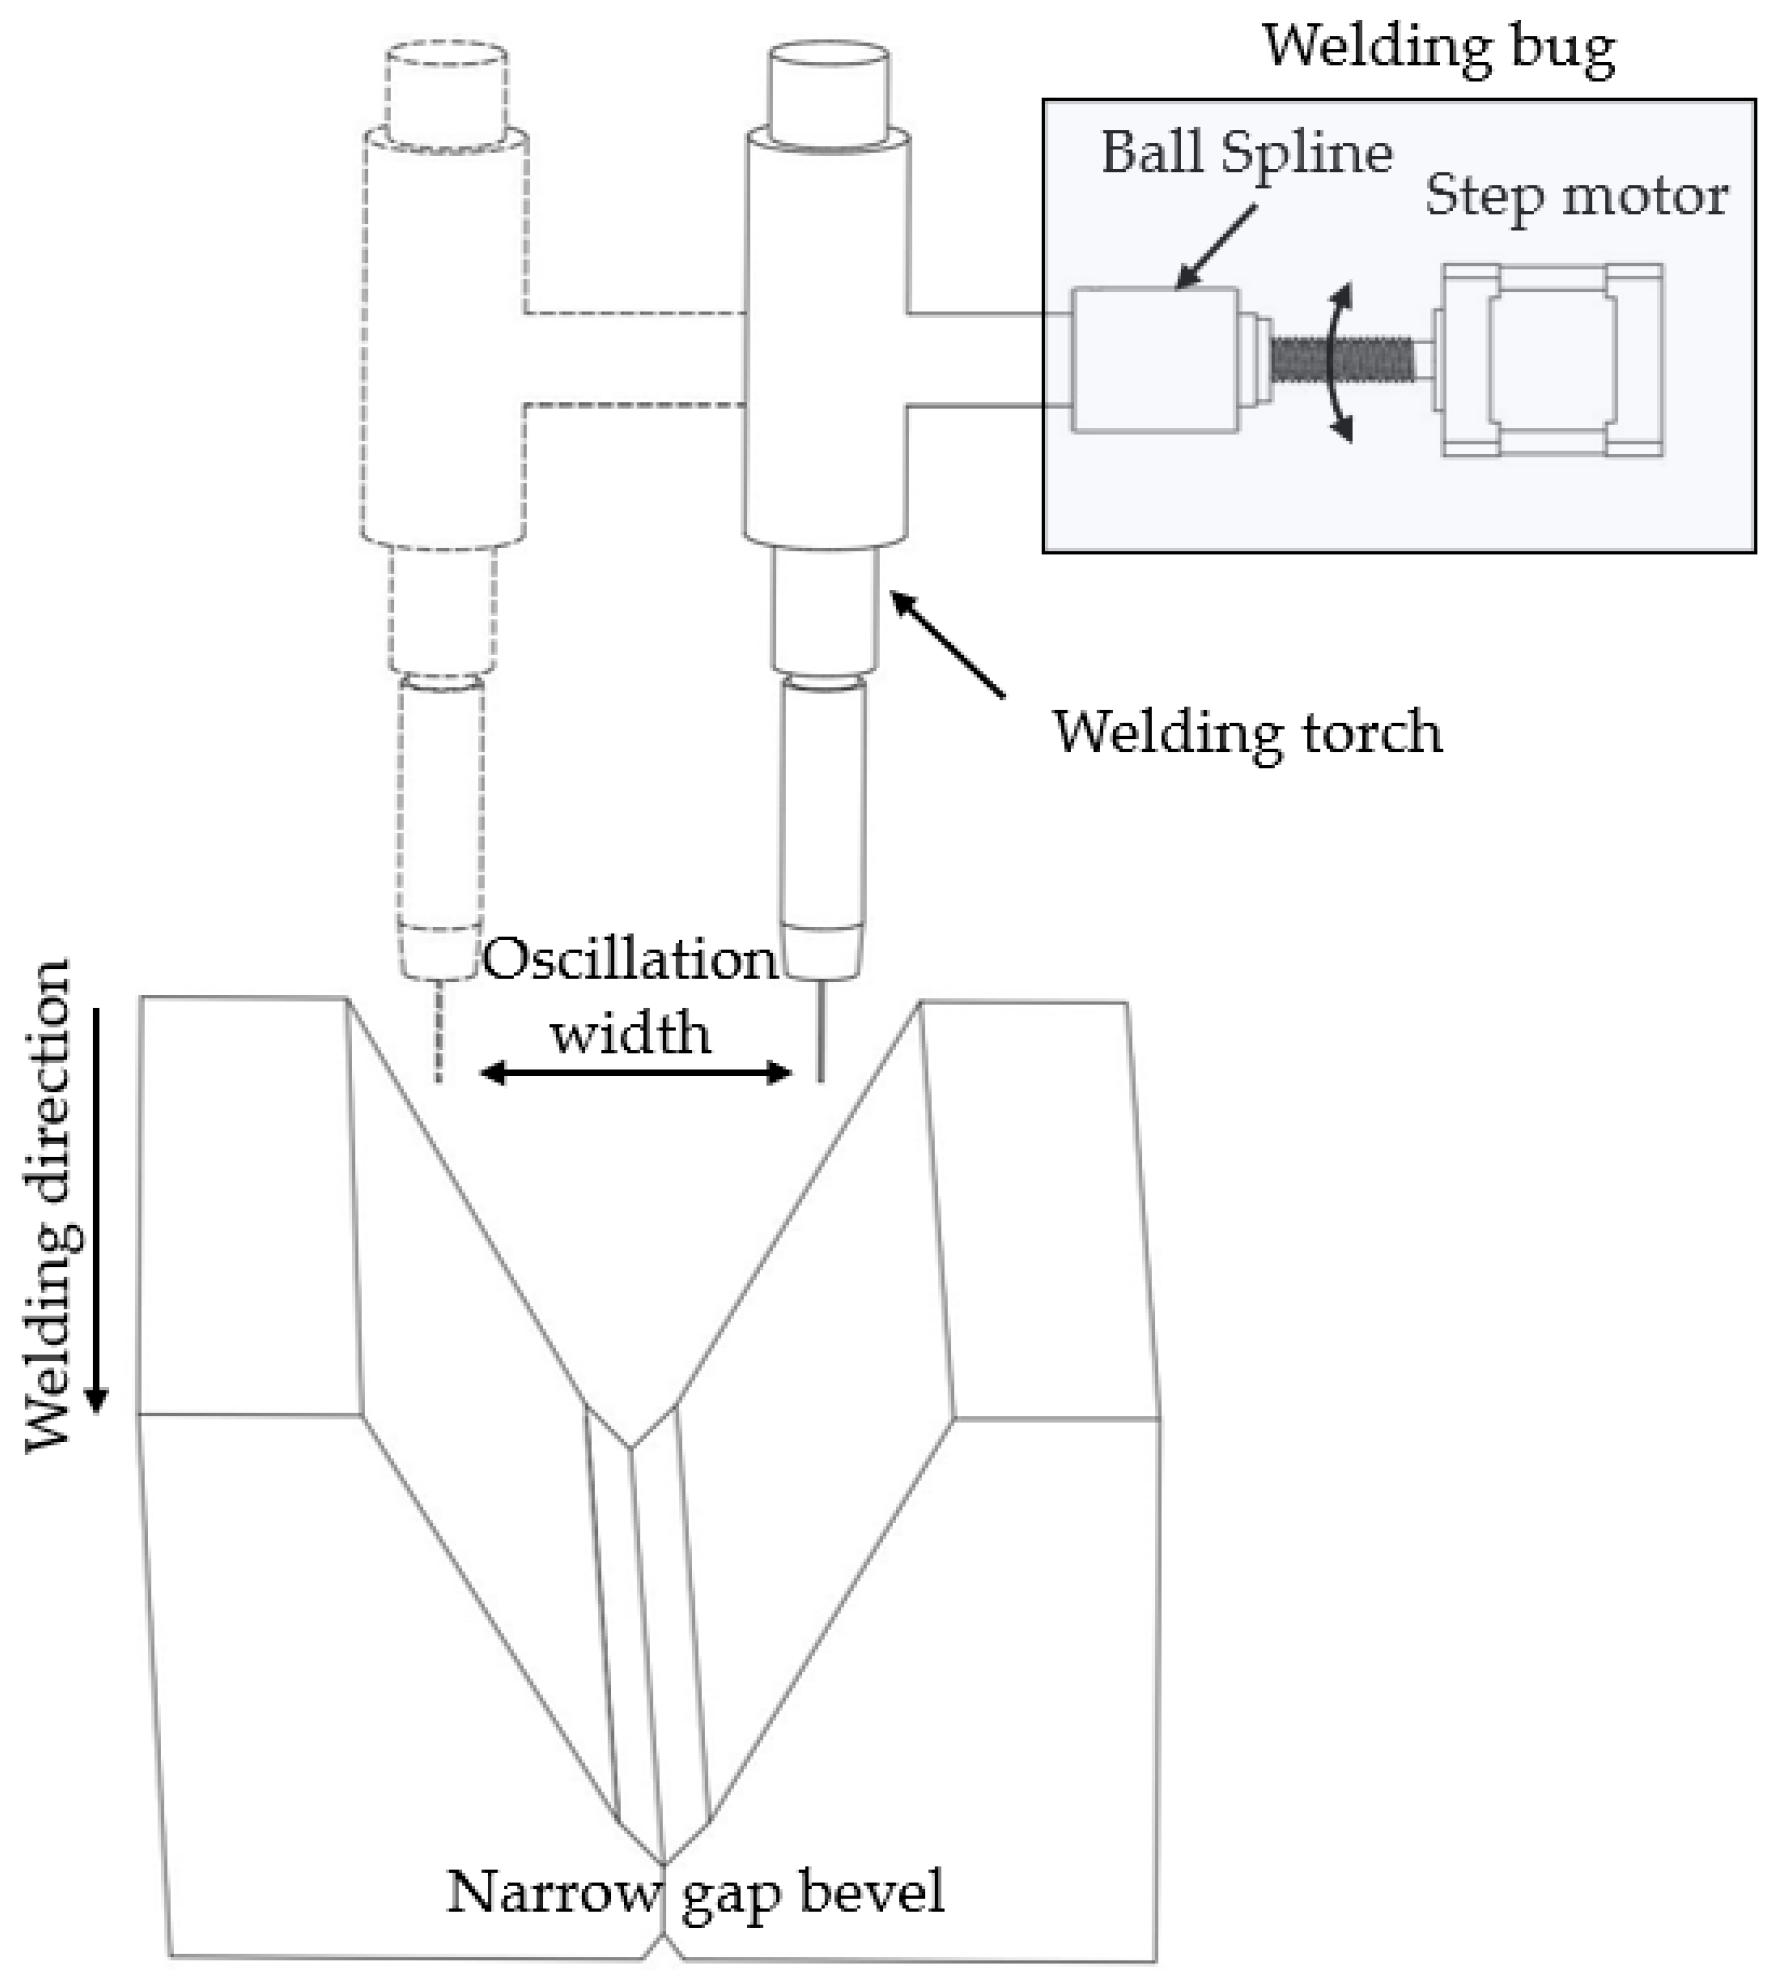
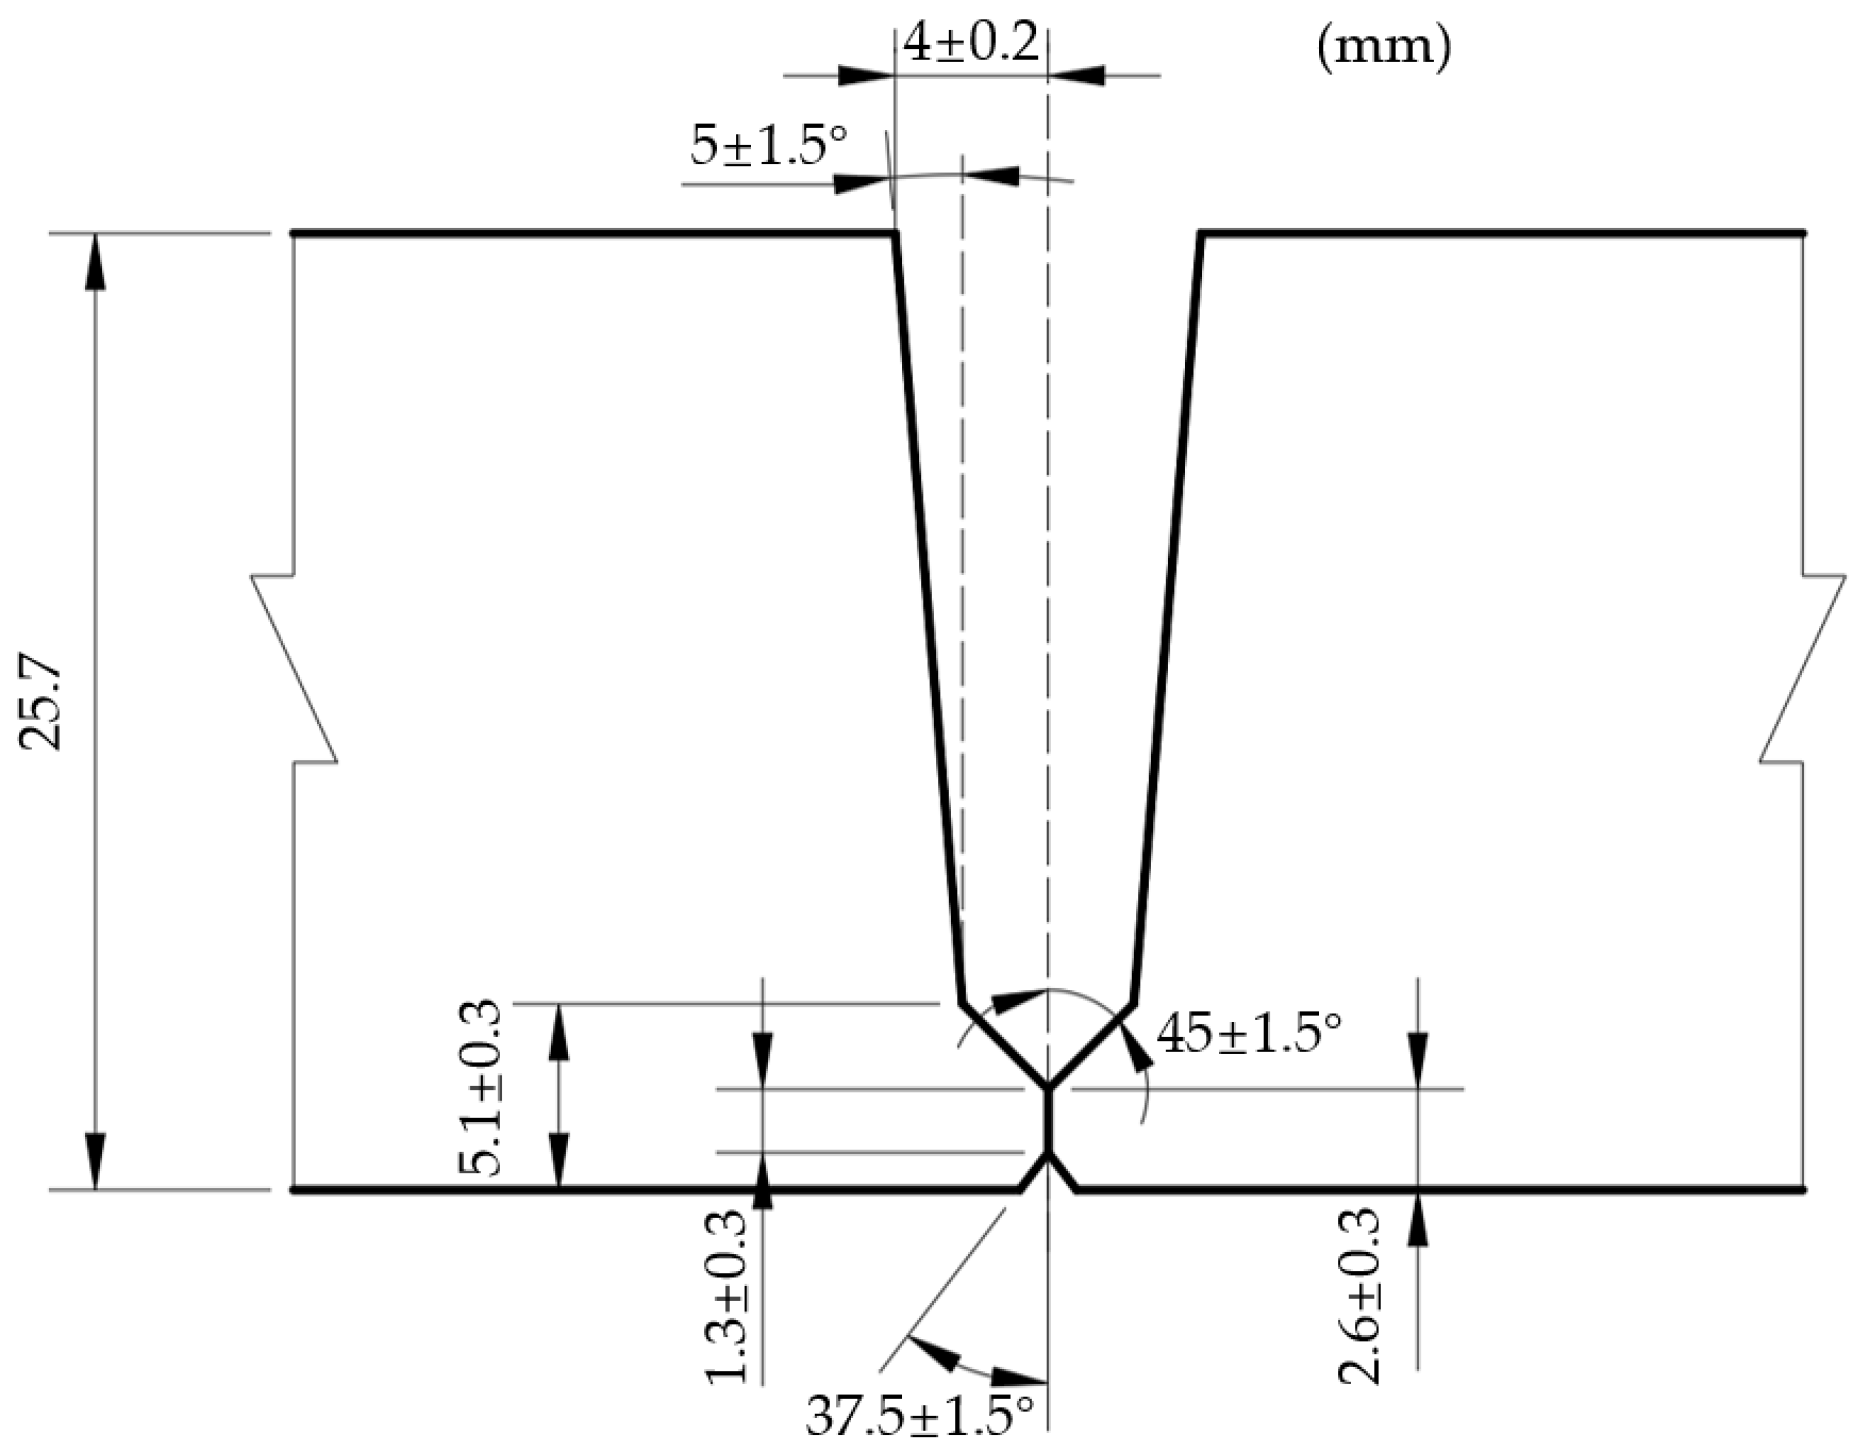
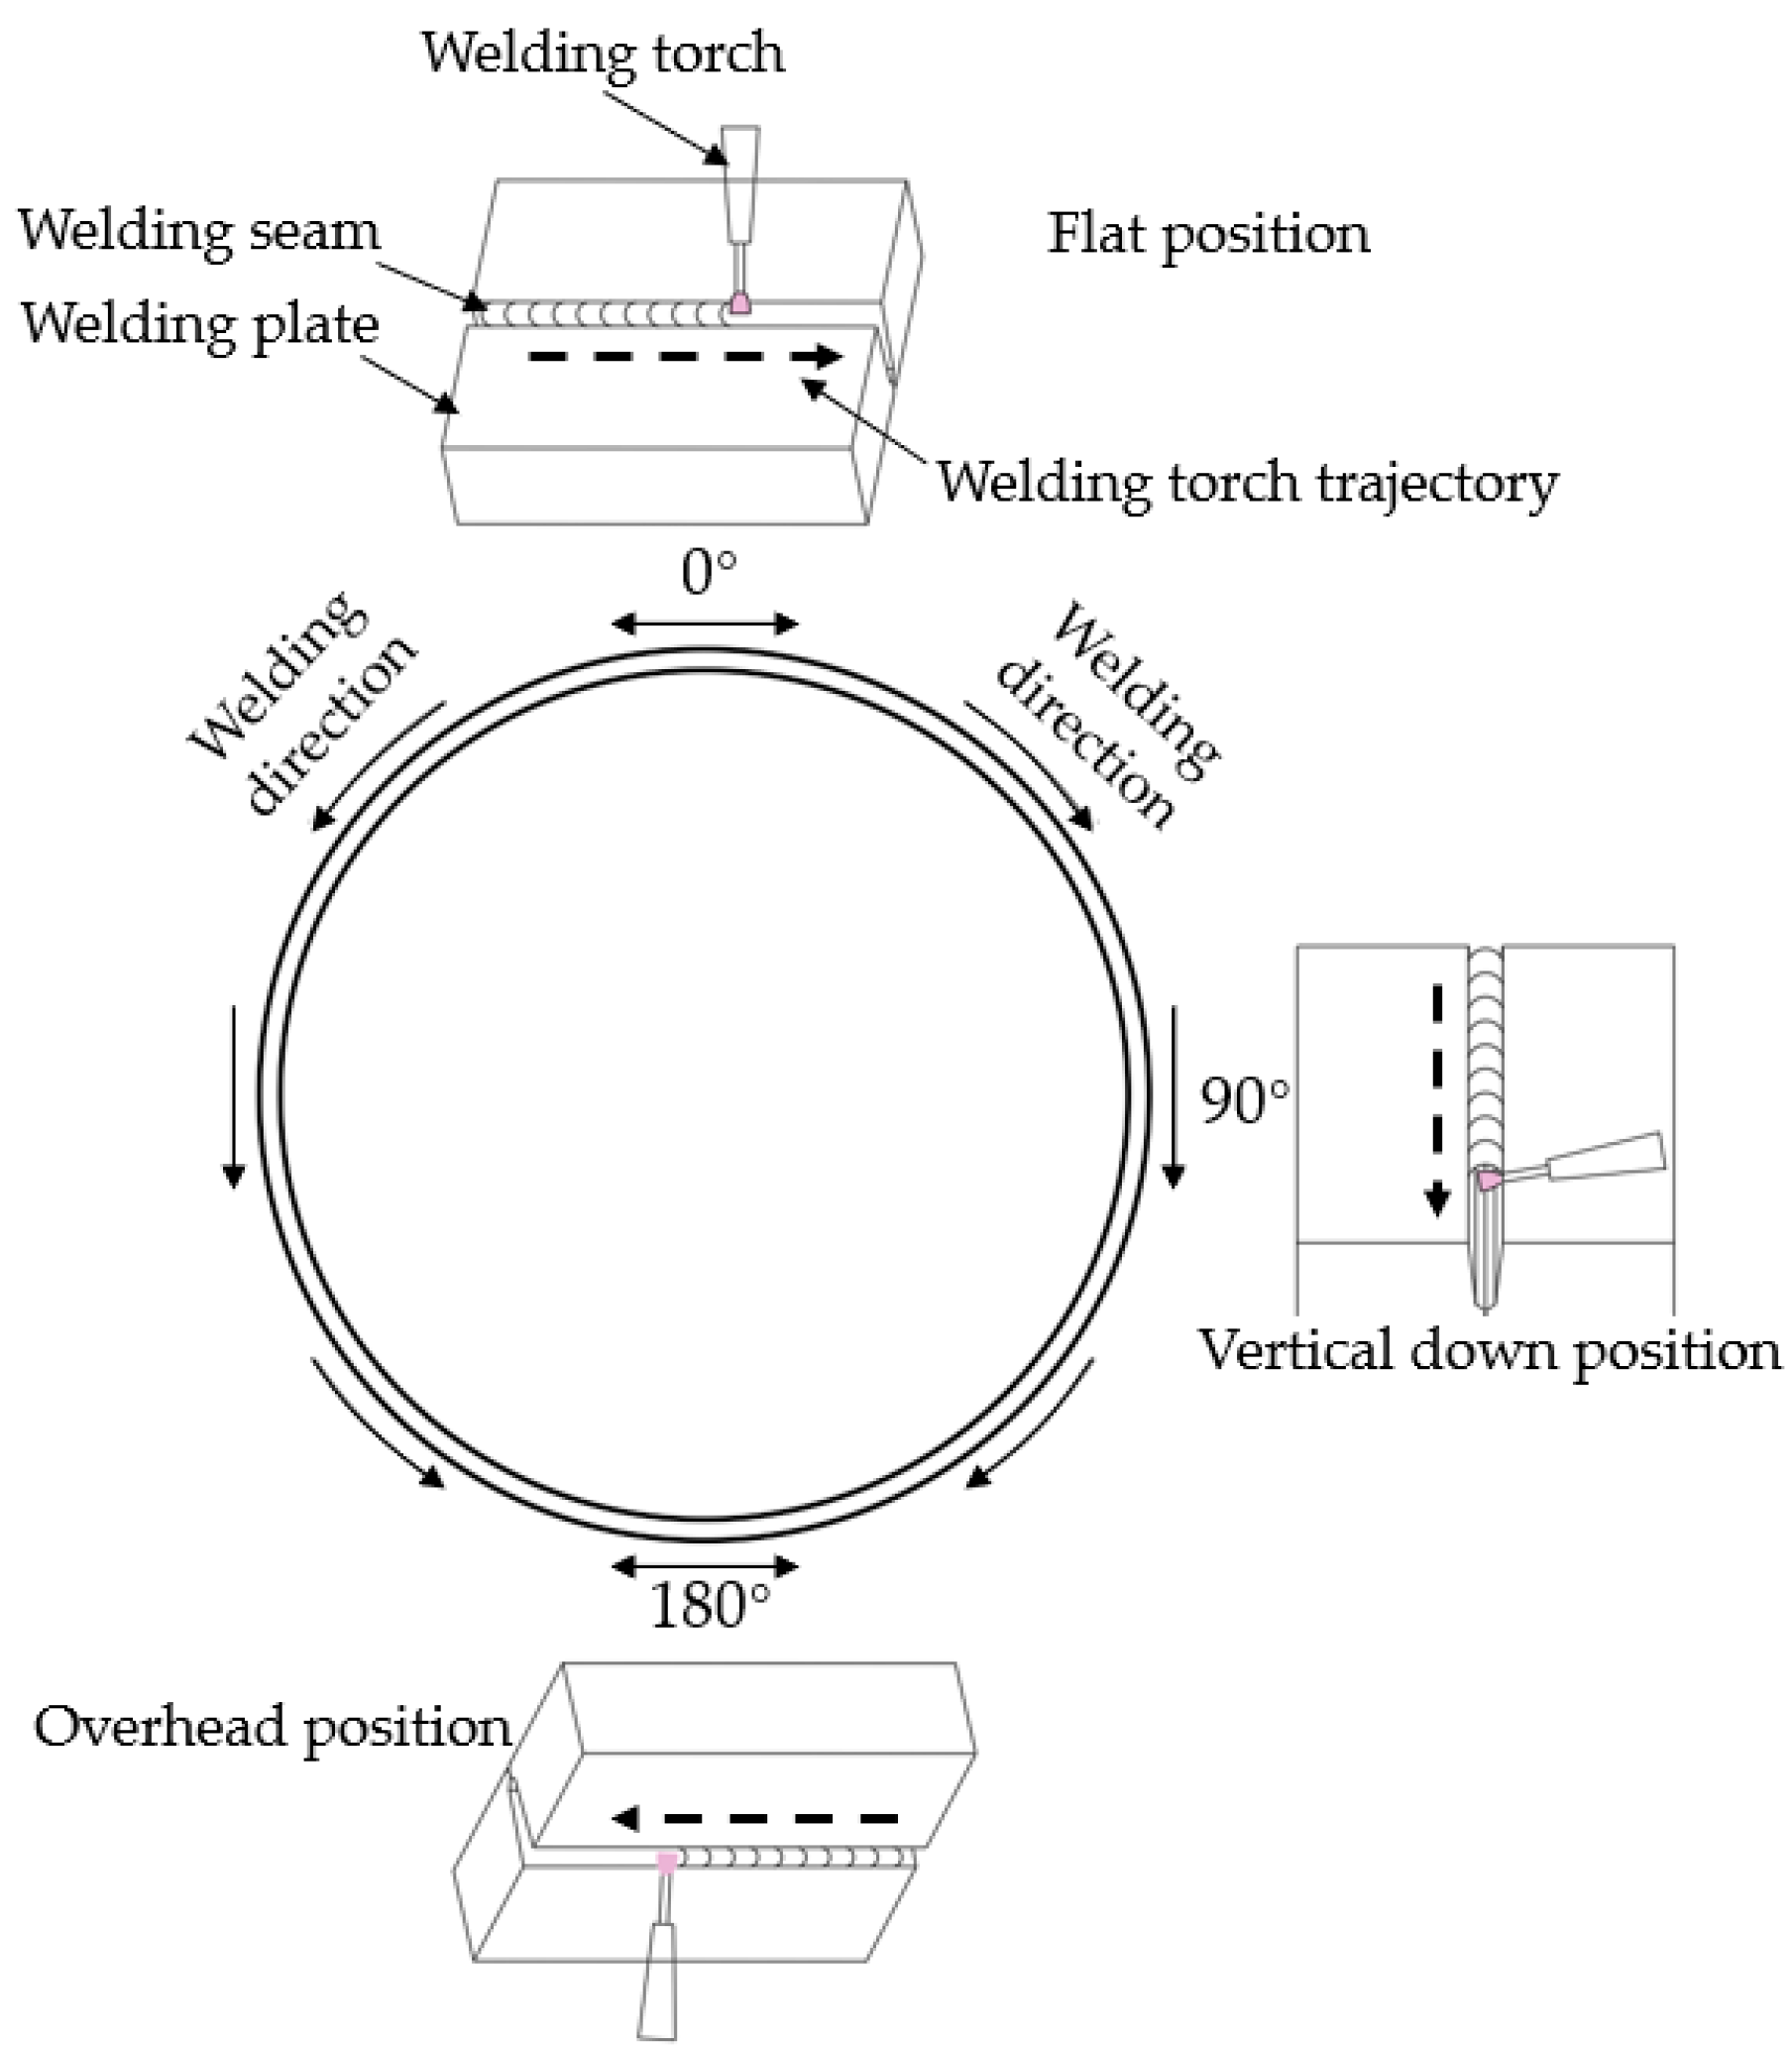
2.1. Experiment Process and Materials

Figure 1 shows the schematic diagram of the vertical oscillation arc welding torch for NG-GMAW. The ball spline converts the rotary motion of the ball screw driven by the stepper motor into the reciprocating motion of the welding torch. Then the vertical oscillation arc forms with the welding torch movement, and it is used to weld the narrow gap bevel. A welding bug takes this set of oscillation mechanisms to move around the pipe in all positions for girth welding.
In the present study, plate specimens were used to simulate welding on the pipe surface on the positioner and analyze the effect of welding parameters on the weld forming at a fixed position. Figure 2 shows the geometry of the narrow gap on the welding plate with a double V bevel, which was spliced by two pieces of the specimen. The dimension of both specimens is 80 mm × 300 mm × 25.7 mm. During the experiment, specimens were fixed using a clamping device.
The specimens were made of X80, and the filler wire was a 1.0 mm diameter Lincoln 80Ni1. The chemical compositions of the specimen and the filler wire are listed in Table 1. The composition of the shieling gas was 80%Ar + 20%CO2, and the gas flow rate was 30 L/min.
The transections of the test weld bead at flat, vertical, and overhead positions were polished, respectively. The cross-section face was corroded with 10% ammonium persulfate solution, and the macroscopic morphology of the welds was observed with a positive metallograph microscope MJ21 (Kunshan gaopin precision instrument Co., Ltd., Kunshan, China). The weld dimension was measured using high-accuracy software provided by the MJ21.
The experiment was established by the Design-Expert software, which includes five factors, and each factor has five levels. All tests are designed in full type with one block. Then the statistical model was generated and checked to optimize the welding parameters and reach the desired weld bead geometry. Figure 3 shows the workflow of this process.

2.2. Method

2.2.1. Selecting Input and Response Parameters

Figure 4 shows the welding position on the positioner. Based on the presented figure, 0°, 90°, and 180° denote the flat welding, vertical down welding, and overhead welding positions, respectively. The welding direction is downward around the pipeline.
During welding from 0° to 180°, gravity has an opposite force on the molten pool, and the weld bead shows a different morphology. Figure 5 shows the typical weld bead morphology at different positions. It is observed that at the flat position, the cross-section of the weld bead is semioval, and the top of the weld bead is slightly concave. Moreover, Figure 5a shows that the weld pool is uniformly solidified in the weld groove. At the vertical welding position, Figure 5b shows that the weld-bead morphology changes greatly; the concave degree at the top of the weld bead increases sharply, and the bottom morphology of the weld bead changes from elliptic to conical form. Compared to the center of the weld bead, the molten pool is mainly solidified on both sides of the bevel. At the overhead position, the gravity is opposite to the solidification of the molten pool, which results in the convex shape of the welding bead, as shown in Figure 5c.
However, the concave and convex morphology, as shown in Figure 5b,c, are prone to forming defective weld beads in subsequent welding. Therefore, many researchers optimize welding process parameters to obtain as flat a weld bead as possible. Xu et al. [2] and Hao et al. [7] showed that in all-position NG-GMAW, wire feeding speed ( W f ), welding speed ( W s ), and welding position ( α ) have obvious influences on the welding bead formation. Zhang et al. [36] showed that the welding voltage ( V ) affects the arc shape, thereby affecting the welding pass formation. As the vertical oscillation arc was used in this study, the effect of the oscillation width ( O W ) on the weld bead formation should be considered in the calculations; Accordingly, wire feeding speed ( W f ), welding speed ( W s ), welding voltage ( V ), welding position ( α ), and oscillation width ( O W ) were selected as the input parameters. The geometric dimensions of the weld bead, including the sidewall penetration S p , welding penetration D p , welding height W h , and the flatness degree of the weld bead surface C were introduced to the model as the response parameters. Measurement metrics of concave and convex weld beads are presented in Figure 6a,b, respectively. C is the flatness degree of the weld bead, and negative and positive values of C reflect concave and convex weld beads, respectively.

2.2.2. Designing and Conducting the Experiment

In this section, the single-factor experiment scheme was used to determine the selection range of each input parameter separately. The criteria were used to determine a reasonable range of parameters so that the welding process was stable and had no defect on the weld bead. In order to ensure the sequential and rotational properties of the experiment, the CCD method was used to design the experiment matrix. It is worth noting that sequential properties ensure the consistency and extensibility of the experiment, while the rotational properties ensure whether the designed experiment points are on the same sphere as the central point. Moreover, the rotational properties also ensure the consistency of the prediction variance of the experiment point. In the present study, five levels were considered for each input parameter, and each level was defined with a code named β , −1, 0, +1, + β . The value of β can be calculated using the following expression:
β = 2 k 1 / 4
In this article, five input parameters are considered in the experiments, so k is set to 5 and β = 2.38. Therefore, the upper limit and lower limit of the design code are +2.38 and −2.38, respectively. The relationship between the actual value and code value for each parameter is shown in Table 2.
The experiment matrix obtained from Design-Expert software is presented in Table 3. The experiment was carried out in accordance with the experimental matrix. The measured weld-bead geometry is presented in Table 3.

2.2.3. Verifying the Model

According to the experiment matrix and measured responses value shown in Table 3, a statistical model is generated that covers different parameters. The model is optimized using stepwise regression, in which forward and backward regression are combined. This method can be used to eliminate insignificant terms automatically. The significance of the model and the affecting terms are tested by the analysis of variance (ANOVA).
The ANOVA test results for the sidewall penetration S p are presented in Table 4. The F value is 25.77 > F0.01(6,43) = 3.29, and the values of Prob > F is less than 0.0001, which implies that the model is significant. The “Lack of Fit” of 0.7966 implies that the Lack of Fit is not significant relative to the pure error, which means the model is accurate for sidewall penetration S p . In addition, the value of Prob > F is less than 0.05, indicating that the model terms are significant, and if the value of Prob > F is less than 0.001, it means it is the most significant model term. In this case, S p , V , and O W are the most significant terms in the model. Moreover, W s has a significant impact on S p . The ultimate statistical model for sidewall penetration S p in terms of actual factors can be expressed in the form below:
ln S p = 3.5273 + 0.117 V 0.00151359 W s + 0.24786 O W
Table 5 shows the ANOVA test result for the welding penetration D p . The p-value (Prob > F) of the model is less than 0.0001, indicating that the model is significant, and the Lack of Fit indicates that the welding penetration model is accurate. Furthermore, the p-value (Prob > F) of model terms shows that W f , V , interaction items of oscillation width and welding position ( O W × α ), and second-order of W s ( W s 2 ) are significant terms in modeling the welding penetration D p . After stepwise regression to the model, W s should be added to the model as a hierarchical term to support the significant term W s 2 , and the same as O W . The ultimate statistical models for welding penetration D p in terms of actual factors is shown below:
ln D p = 4.82304 + 0.088931 W f + 0.033066 V + 0.016112 W s + 0.31161 O W + 0.010437 α 0.00385421 O W × α 1.93449 × 10 5 W s 2
The results of ANOVA for the welding height W h model is presented in Table 6. The p-value of model terms shows that W s has the most significant effect on the welding height. The interaction items of oscillation width and welding position ( O W × α ), and the second-order term O W ( O w 2 ) are significant terms in modeling welding height W h . The F value and p-value indicate that the model is significant, and the Lack of Fit item demonstrates that the model of the welding height W h is adequate. The ultimate statistical model for the welding height W h in terms of actual factors is as the following:
ln W h = 1.17036 + 0.074716 W f 0.00245086 W s + 0.49667 O W 0.010674 α + 0.00588373 O W × α 0.24781 W s 2
Table 7 shows the ANOVA test results for the model of the flatness degree of the weld bead C . The F value and p-value indicate that the model is significant, and the Lack of Fit item reveals that the flatness degree of the weld pass C is adequate. The p-value of the model shows that the terms α and α 2 have the most significant effect on the welding height. Meanwhile, the terms V , W f 2 , V 2 , and W s 2 have a significant effect on the flatness degree of the weld bead. The statistical model for the flatness degree of the weld-bead surface C in terms of the affecting factors can be expressed as follows:
C = 69.42264 3.73275 W f 3.67518 V 0.044209 W s 0.040437 α + 0.18979 W f 2 + 0.078645 V 2 + 0.0000577 + 0.000266 α 2

3. Results and Analysis

Based on the established generated model, the effect of input parameters and their relationship with the sidewall penetration model, weld penetration model, weld height model, and the flatness degree of the weld-bead surface model can be analyzed. These analyses are discussed in the following sections.

3.1. Effects of Input Parameters on the Sidewall Penetration

Figure 7 exhibits the influence of welding parameters on the depth of the sidewall penetration. Figure 7a shows that as the welding voltage increases from 21.5 V to 24 V, the penetration depth of the sidewall increases from 0.33 mm to 0.44 mm. This is mainly attributed to the increase of the welding voltage that increases the heat input per unit time. Meanwhile, as the welding voltage increases, the influence range of the welding arc increases. The influence range of the arc on the sidewall also increases, thereby increasing the penetration depth on the sidewall.
Figure 7b shows that the sidewall penetration decreases with the increase in the welding speed. This phenomenon may be attributed to the decrease of the line energy originating from low welding speeds, which decreases the sidewall penetration depth.
Figure 7c shows that the oscillation width of the welding torch obviously affects the sidewall penetration depth. It should be indicated that in a real welding process, an increase in the oscillation width directly expands the affected range of the welding arc on the sidewall. Subsequently, as the oscillation width of the welding torch increases, the corresponding penetration depth of the sidewall increases.

3.2. Effects of Input Parameters on the Welding Penetration

Figure 8a shows the effects of the wire feed rate on the welding penetration. It is observed that as the wire feed rate increases, the welding penetration increases. This is because the greater the wire feed rate, the greater the input heat into the molten pool and the deeper the welding penetration.
Figure 8b shows that the welding penetration increases gradually as the welding speed increases from 350 mm/min to 420 mm/min. However, when the welding speed increases further, the welding penetration depth decreases slightly.
Figure 8c,d show that the oscillation width and the welding position affect the welding penetration. When the oscillation width increases from 1.5 mm to the critical point, the welding penetration increases sharply with the increase in the welding position. Moreover, the oscillation width further increases until it exceeds the critical point. It is found that as the welding position increases, the corresponding welding penetration increases slowly. This may be attributed to the influence of the gravity force on the molten pool along the opposite direction, which results in different variation trends of the oscillation width and uneven stability of the molten pool.

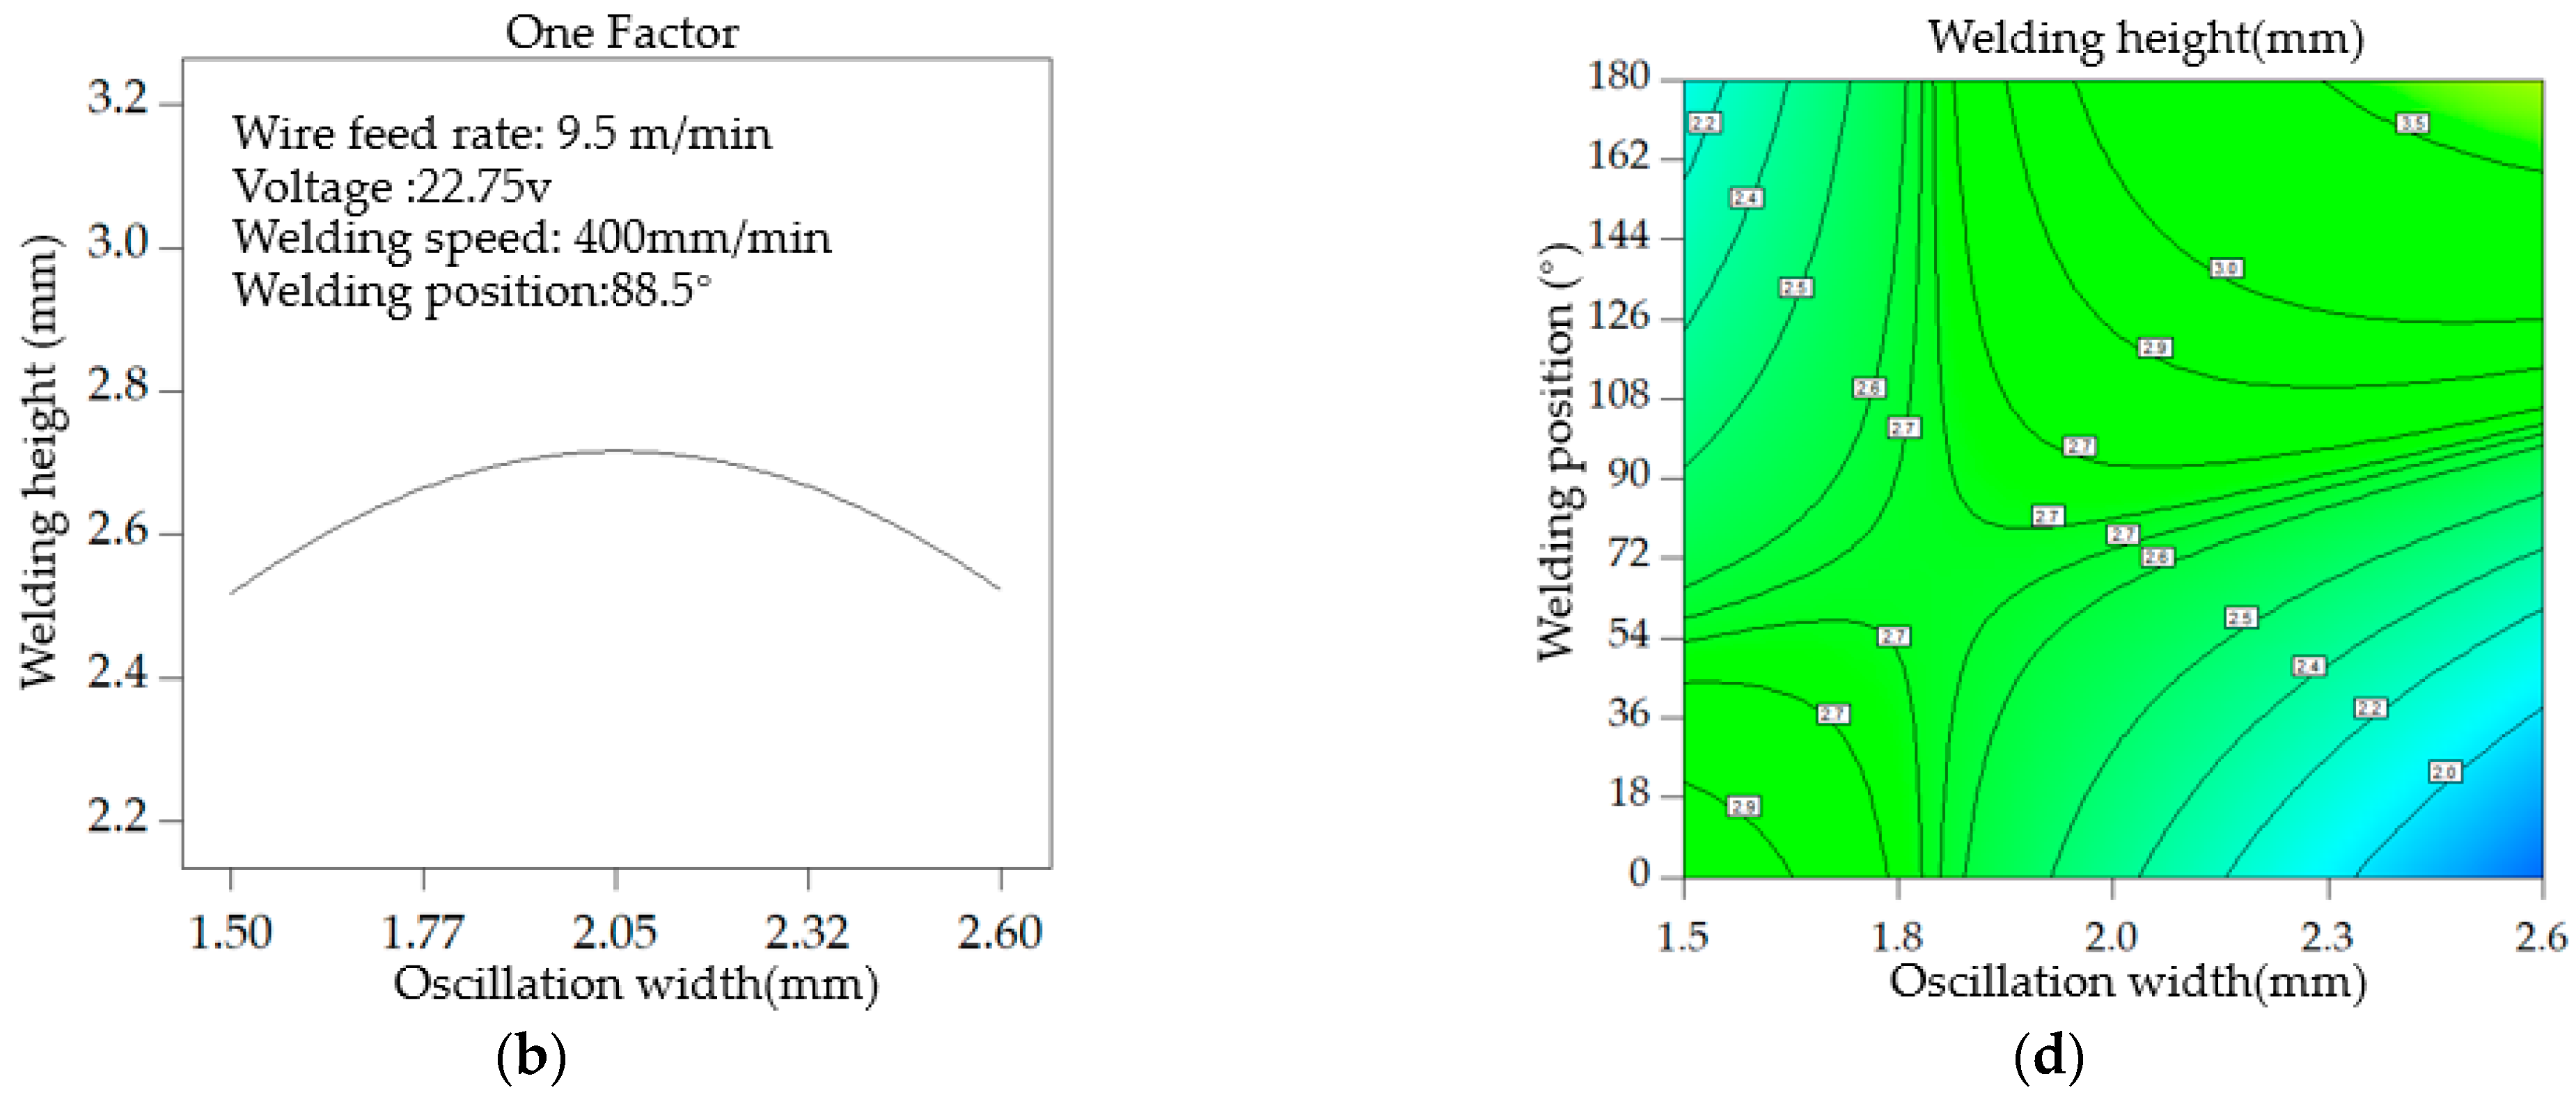
3.3. Effects of Input Parameters on the Welding Height

Figure 9a shows that the welding height decreases with the increase of the welding speed. This trend is mainly because the volume of the molten welding wire falling into the welding pass decreases with the increase of the welding speed, thereby decreasing the welding height.
Figure 9b shows the influence of the oscillation width on the welding height. When the oscillation width is between 1.5 mm and 2.05 mm, the welding height increases with the increase in the oscillation width. However, when the oscillation width exceeds 2.05 mm, the increase in the oscillation width reduces the welding height.
Figure 9c,d illustrates the influence of the oscillation width and the welding position on the welding height. It is observed that as the welding position α changes from 52° to the critical point, the welding height decreases with the increase in the oscillation width. Once the welding position passes the critical point, the welding height increases with the increase in the oscillation width. This phenomenon mainly originates from the influence of gravity, resulting in the molten pool flocking together and solidifying in the center of the weld bead.

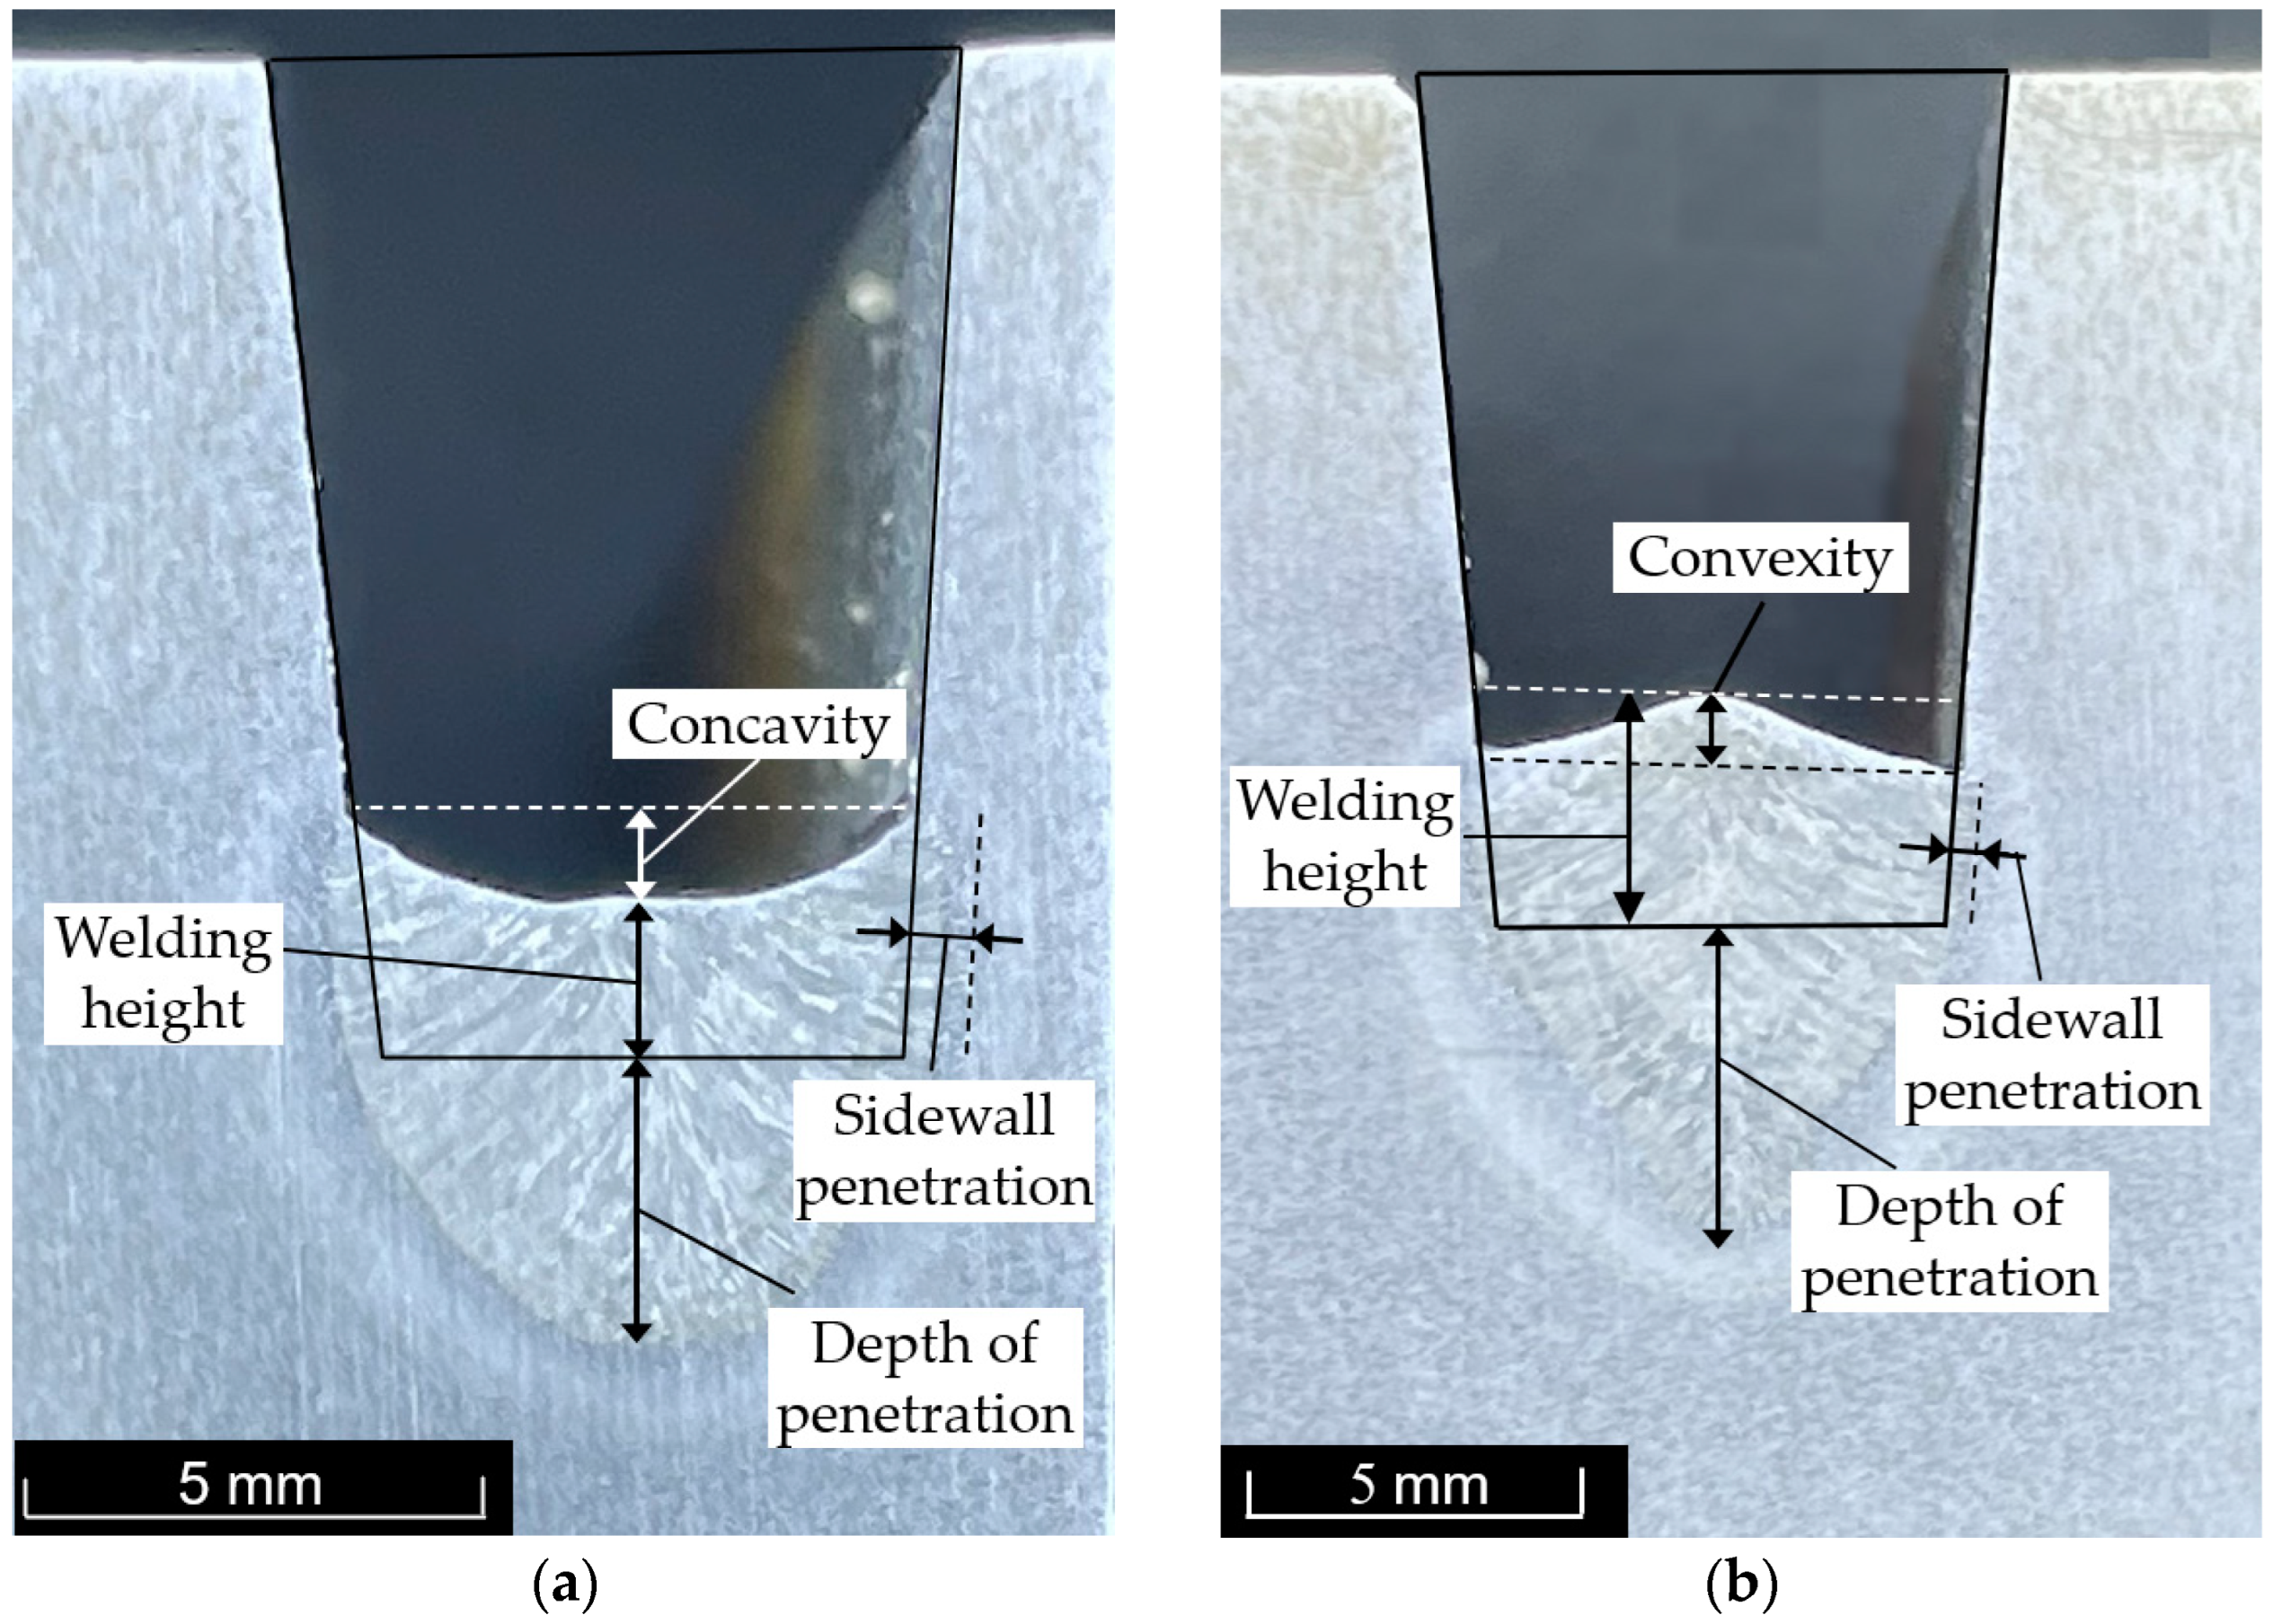
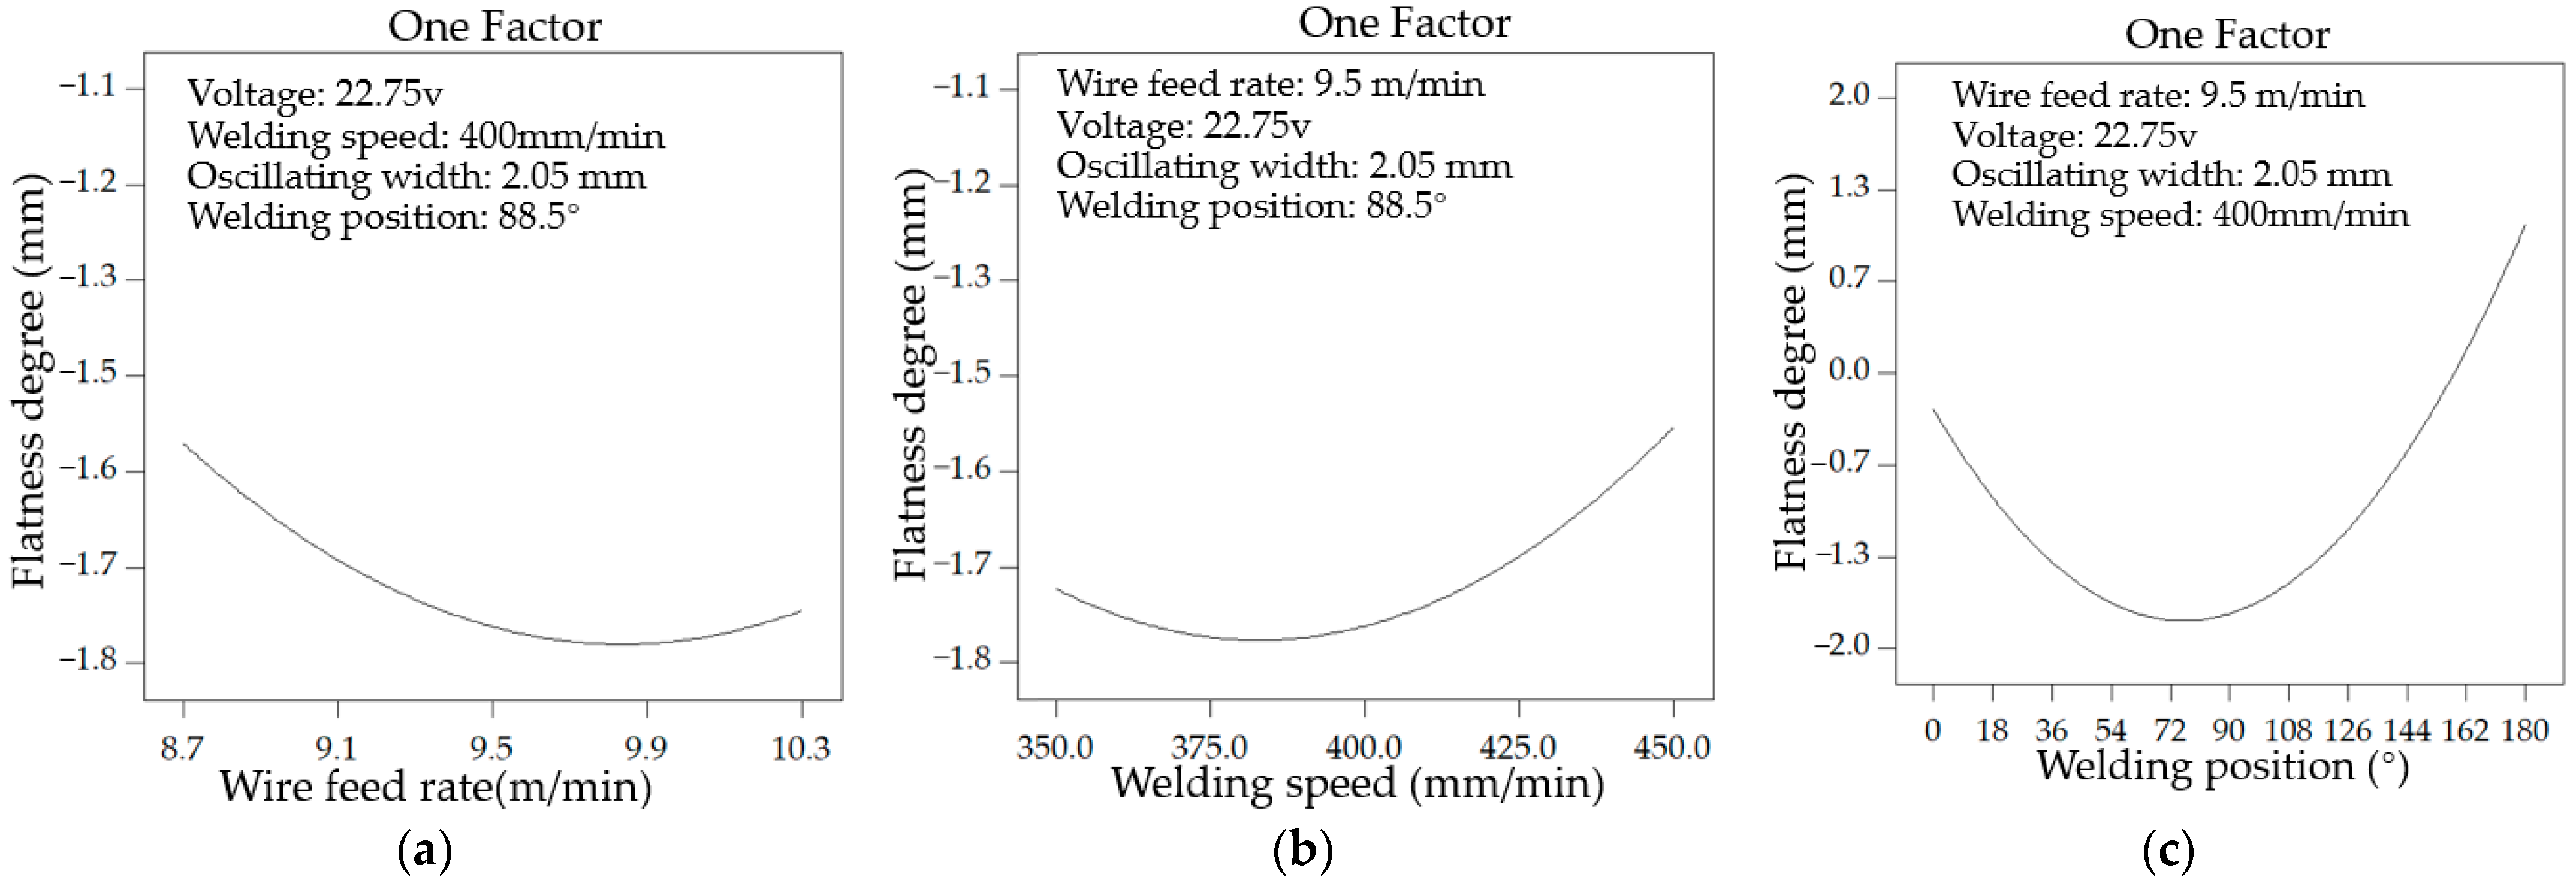
3.4. Effects of the Input Parameter on the Flatness Degree of the Weld Bead

Figure 10a displays the effects of the wire feeding rate on the flatness degree of the weld bead surface. When the wire feeding rate is between 8.7 m/min and 9.9 m/min, the concave degree of the weld-bead surface increases with the increase of the wire feed rate. As the wire feed rate further increases, the concave degree of the weld-bead surface reduces significantly. This is mainly because the welding current has a direct correlation with the wire-feed rate and the electromagnetic force of the welding arc. Meanwhile, as the welding torch oscillates, more molten metal is squeezed into the groove and solidifies on both sides, making a concaved weld bead. As the wire feeding rate increases continuously, the welding height on the unit length increases continuously, and the concave degree of the weld-bead surface decreases.
Figure 10b shows the influence of the welding speed rate on the concave degree of the weld-bead surface. It is observed that as the welding speed increases, the concave degree increases first and then decreases. In actual welding processes, the gravity force surges the molten metal to the front of the arc, so the volume of the molten metal behind the arc reduces significantly, and the molten pool solidifies with a concave shape. As the welding speed increases, the speed of the molten metal flow does not change as fast as the welding speed, so the volume of the solidified molten pool behind the arc increases, and the concave degree of the weld-bead surface improves.
The influence of welding position α on the flatness degree of the surface is especially apparent. As shown in Figure 10c, before 80°, gravity promotes the weld pool to fit into the weld groove; with the increase of the welding position α , the gravity gradually makes the molten pool detach from the weld groove, which makes the weld bead surface change from concave to convex.

4. Discussion and Validation

Studies show that incomplete fusion in the sidewall and interlay are very prone to form in NG-GMAW [2,7]. This is even more pronounced in vertical and overhead positions, where the same defect appears in the vertical oscillation arc NG-GMAW. As the welding position α increases, the gravity force on the molten pool intensifies, so more molten filler metal flows to the rear of the weld pool and solidifies there. Subsequently, a convex shape forms in the middle of the weld bead. It is worth noting that the welding arc in the next layer cannot reach the lowest position of the convex weld, which results in incomplete fusion on the interlayer. Insufficient heat input on the sidewall of the groove will cause incomplete fusion on the sidewall. In this regard, the incomplete fusion in the sidewall and interlayer in NG-GMAW are shown in Figure 11a,b, respectively.
To ensure a qualified NG-GMAW weld bead, the flatness degree of the weld-bead surface and the depth of the sidewall penetration should be controlled precisely. To this end, the flatness degree of the weld bead and the penetration depth of the sidewall were taken as the target parameters to be optimized. The flatness degree of the weld bead was set to zero, which means the desired weld bead surface is flat, and the suitable bead geometry is more conducive to the control of the layer height so that the same layer of the weld in different welding positions can obtain the same layer height, which is meaningful for the later all-position automatic welding. It should be indicated that the deeper the sidewall penetration, the better the achieved results, which is necessary to ensure obtaining a high-quality weld at an arbitrary position. In the present study, the flat position (0°), vertical position (90°), and overhead position (180°) are selected as the optimized target positions. The goal of each input factor and the importance of the input factor for each response are listed in Table 8.
In step with the numerical optimization of optimization choices in software, after setting the optimization goal and the welding angle α, a list of the recommended welding parameter generated in the solution. When α = 0°, there are 24 sets of welding parameters in the solution, and the suggested selection are a wire feeding speed of 9.24 m/min, welding voltage of 22.12 V, welding speed of 362.2 mm/min, and oscillating width of 1.7 mm. However, in order to improve welding efficiency, the maximum wire feeding speed should be considered. The welding speed of group 4 and group 11 was 350 mm/min and 450 mm/min, respectively, and the oscillating width was 1.5 mm. In order to ensure better welding efficiency, a welding speed of 450 mm/min was selected for subsequent actual tests. In addition, in order to improve the penetration depth of the sidewall, an attempt was made to increase the oscillation width to 2.0 mm. The results show that the welding process is stable, and there is no fusion defect. Therefore, the final determined welding parameters at the flat welding position are shown in Table 9 with α = 0. In the vertical welding position, among the recommended parameters, considering the highest welding efficiency and the largest sidewall penetration, the 38th group of data is selected, which includes the 10.3 m/min for wire feeding speed, 24 v for welding voltage, and 450 mm/min and 2.07 mm respectively for welding speed and oscillating width. After the experimental test, the final determined parameters for the vertical welding position are shown in Table 9 with α = 90. In the overhead welding position, the recommended parameters are 8.7m/min for wire feeding speed, 24 V for welding voltage, 350 mm/min for welding speed, and 2.6 mm for oscillating width. After experiment verification, when the voltage is reduced to 21.4 V, the arc has a better effect on maintaining the stability of the molten pool. The final welding parameters of the elevation welding position are shown in Table 9 with α = 180. So far, with the help of mathematical, statistical methods, the welding parameters for the flat, vertical, and overhead positions were obtained in this study.
The macrograph of the weld bead transections for a single layer with optimal parameters in flat, vertical, and overhead positions are presented in Figure 12a,b and c, respectively. The Weld pool is uniformly solidified in the weld groove, and the surface of the weld bead is flat in each welding position.
The macrograph of the weld bead transections for multi-layers with optimal parameters in flat, vertical, and overhead positions are presented in Figure 13a–c, respectively. There is no lack of fusion in the interlayer and sidewall in weld bead on 0°, 90°, and 180° welding positions.

5. Conclusions

In the present study, a statistical model was proposed for all-position NG-GMAW with a vertical oscillation arc. The performed analyses revealed that the proposed model could be applied to optimize the transection morphology of weld beads. The main achievements of this article can be summarized as follows:
(1)
A statistical model was established to find the correlation between the welding parameters and the weld-bead geometry with the CCD-based RMS. The ANOVA was applied to evaluate the significance and accuracy of the model. The obtained results indicate that the model can be applied to optimize the all-position narrow gap weld-bead geometry.
(2)
Welding voltage and oscillation width significantly positively affect the sidewall penetration, while the welding speed has the opposite effect. Therefore, it is necessary to reduce the welding speed and increase the oscillation width to ensure sidewall penetration after vertical welding. In addition, due to the influence of gravity, the groove surface gradually changes from concave to convex. The groove surface convexity can be suppressed by decreasing the welding speed and increasing the wire feeding speed. Moreover, the oscillation width and the wire feeding rate significantly affect the weld height. In order to ensure consistency of the weld height at all positions, the oscillation width should be appropriately reduced before vertical welding, while the oscillation width should be appropriately increased after vertical welding. Meanwhile, it is necessary to optimize the welding speed to ensure the penetration depth of the sidewall.
(3)
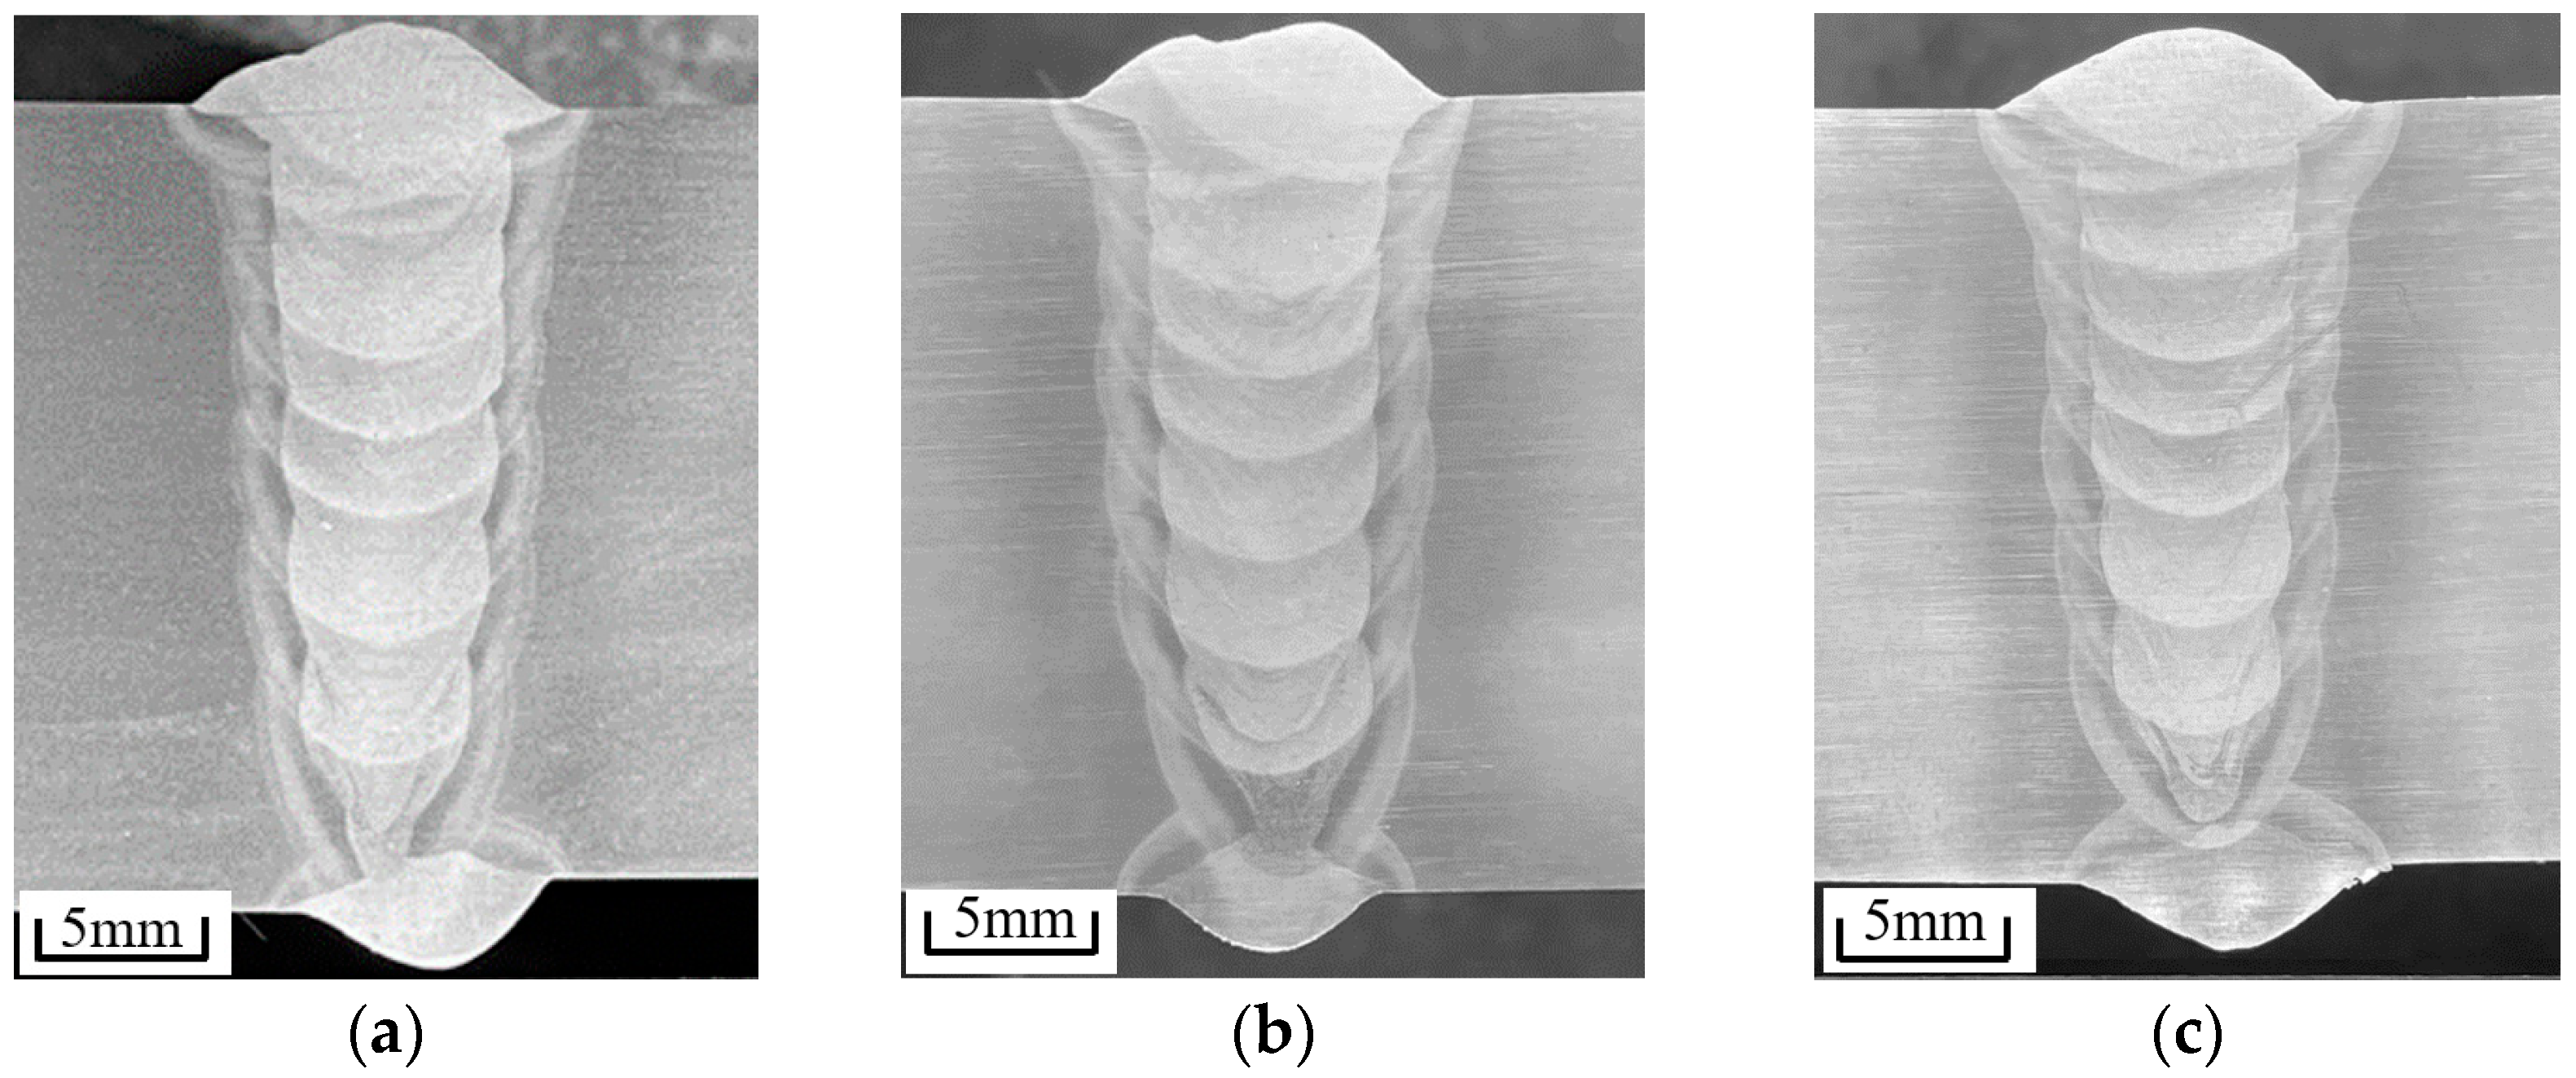
When the optimized parameters were used in automatic all-position NG-GMAW in pipeline welding, the macroscopic metallography of the weld bead in flat, vertical, and overhead positions shows that there is no incomplete fusion in sidewall and interlayers, demonstrating that the weld bead has deep sidewall penetration.

Author Contributions

Conceptualization, H.L. and J.Z.; methodology, R.X.; software, H.L.; validation, H.L., J.Z. and Y.B.; formal analysis, Y.B.; investigation, H.L. and R.X.; resources, H.L. and R.X.; data curation, Y.B.; writing—original draft preparation, H.L.; writing—review and editing, H.L. and Y.B.; visualization, H.L. supervision, J.Z. and Y.X.; project administration, R.X.; funding acquisition, J.Z., R.X. and Y.B. All authors have read and agreed to the published version of the manuscript.

Funding

This research was funded by the National Natural Science Foundation of Xinjiang, grant number 2022D01C391, the Science and Technology Innovations Project of the Outstanding Doctor of Xinjiang University grant number XJUBSCX-201906, and the Technology Innovation Team for Robots and Intelligent Equipment, grant number 2022D14002.

Institutional Review Board Statement

Not applicable.

Informed Consent Statement

Not applicable.

Data Availability Statement

Not applicable.

Acknowledgments

We sincerely thank York Technology Co., Ltd. (Shenzhen, China) for providing the high-speed cameras and laser light source equipment for this study free of charge.

Conflicts of Interest

The authors declare no conflict of interest.

References

  1. Wang, J.; Ren, Y.; Yang, F.; Guo, H. Novel rotation arc system for narrow gap mag welding. Sci. Technol. Weld. Joining 2007, 12, 505–507. [Google Scholar] [CrossRef]
  2. Xu, W.; Lin, S.; Fan, C.; Yang, C. Prediction and optimization of weld bead geometry in oscillating arc narrow gap all-position GMA welding. Int. J. Adv. Manuf. Technol. 2015, 79, 183–196. [Google Scholar] [CrossRef]
  3. Ding, M.; Tang, X.; Lu, F.; Yao, S. Welding of quenched and tempered steels with high-spin arc narrow gap MAG system. Int. J. Adv. Manuf. Technol. 2011, 55, 527–533. [Google Scholar] [CrossRef]
  4. Moon, H.; Ko, S.; Kim, J. Automatic seam tracking in pipeline welding with narrow groove. Int. J. Adv. Manuf. Technol. 2009, 41, 234–241. [Google Scholar] [CrossRef]
  5. Feng, J.; Rathod, D.; Roy, M.; Francis, J.; Guo, W.; Irvine, N.; Vasileiou, A.; Sun, Y.; Smith, M.; Li, L. An evaluation of multi-pass narrow gap laser welding as a candidate process for the manufacture of nuclear pressure vessels. Int. J. Press. Vessel. Pip. 2017, 157, 43–50. [Google Scholar] [CrossRef] [Green Version]
  6. Yang, Z.; Chen, Y.; Zhang, Z.; Fang, C.; Xu, K.; He, P.; Zhang, Z. Research on the sidewall penetration mechanisms of cable-type welding wire narrow gap GMAW process. Int. J. Adv. Manuf. Technol. 2022, 120, 2443–2455. [Google Scholar] [CrossRef]
  7. Shi, H.; Zhang, K.; Xu, Z.; Huang, T.; Fan, L.; Bao, W. Applying statistical models optimize the process of multi-pass narrow-gap laser welding with filler wire. Int. J. Adv. Manuf. Technol. 2014, 75, 279–291. [Google Scholar] [CrossRef]
  8. Wang, J.; Zhu, J.; Fu, P.; Su, R.; Han, W.; Yang, F. A swing arc system for narrow gap GMA welding. ISIJ Int. 2012, 52, 110–114. [Google Scholar] [CrossRef] [Green Version]
  9. Wang, J.; Zhu, J.; Zhang, C.; Xu, G.; Li, W. Effect of Arc Swing Parameters on Narrow Gap Vertical GMA Weld Formation. ISIJ Int. 2016, 56, 844–850. [Google Scholar] [CrossRef] [Green Version]
  10. Li, F.; Sun, Q.; Jin, P.; Liu, Y.; Chen, M.; Li, J.; Hou, S.; Wang, M.; Ji, Y. Wetting behavior of melt and its effect on lack of fusion in arc oscillating NG-GTAW. J. Mater. Process. Technol. 2021, 296, 117176. [Google Scholar] [CrossRef]
  11. Jia, C.; Yan, Q.; Wei, B.; Wu, C. Rotating-Tungsten Narrow-Groove GTAW for Thick Plates. Weld. Joining 2018, 97, 273s–285s. [Google Scholar] [CrossRef]
  12. Silva, R.; Schwedersky, M.; Santos, A.; Okuyama, M. Effects of the Rotating Arc Technique on the GMA Welding Process. Soldag. Inspeção 2020, 25, e2519. [Google Scholar] [CrossRef]
  13. Liratzis, T. Tandem Gas Metal Arc Pipeline Welding. Ph.D. Thesis, University of Cranfield, Cranfield, UK, 2007. [Google Scholar]
  14. Ni, Z.; Hu, F.; Li, Y.; Lin, S.; Cai, X. Microstructure and Mechanical Properties of the Ternary Gas Shielded Narrow-Gap GMA Welded Joint of High-Strength Steel. Crystals 2022, 12, 1566. [Google Scholar] [CrossRef]
  15. Pu, J.; Wu, S.; Hu, Q.; Wang, Y. Effect of welding current on arc behavior in tandem GMAW. Int. J. Mod. Phys. B 2019, 33, 1940036. [Google Scholar] [CrossRef]
  16. Zhang, X.; Ashida, E.; Tarasawa, S.; Anma, Y.; Okada, M.; Katayama, S.; Mizutani, M. Welding of thick stainless steel plates up to 50 mm with high brightness lasers. J. Laser Appl. 2011, 23, 22002–22007. [Google Scholar] [CrossRef]
  17. Yamazaki, Y.; Abe, Y.; Hioki, Y.; Nakatani, M.; Kitagawa, A.; Nakata, K. Fundamental study of narrow-gap welding with oscillation laser beam. Weld. Int. 2016, 30, 699–707. [Google Scholar] [CrossRef]
  18. Wang, C.; Mi, G.; Zhang, X. Welding stability and fatigue performance of laser welded low alloy high strength steel with 20 mm thickness. Opt. Laser Technol. 2021, 139, 106941. [Google Scholar] [CrossRef]
  19. Zhang, C.; Li, G.; Gao, M.; Zeng, X. Microstructure and mechanical properties of narrow gap laser-arc hybrid welded 40 mm thick mild steel. Materials 2017, 10, 106. [Google Scholar] [CrossRef] [Green Version]
  20. Zhang, X.; Mi, G.; Wang, C. Study of microstructure and mechanical properties of narrow-gap multi-layer hybrid laser-arc welded 316L austenitic stainless steel. J. Laser Appl. 2018, 30, 3. [Google Scholar] [CrossRef]
  21. Wu, Y.; Li, Z.; Wang, X.; Feng, Y.; Wang, M.; Shan, J. Narrow Groove Laser-Arc Hybrid Welding of Thick-Sectioned HSLA Steel U sing Laser Beam Oscillation. Mater. Sci. Eng. A 2011, 528, 4761–4773. [Google Scholar] [CrossRef] [Green Version]
  22. Yang, Z.; Chen, Y.; Zhang, Y.; Fang, C.; Chen, S.; Gu, X. Arc behavior and deposition characteristics of assisted wire filling cable-type welding wire GMAW. World Sci. 2022, 36, 2240041. [Google Scholar] [CrossRef]
  23. Yang, Z.D.; Fang, C.F.; Chen, Y.; Liu, B.; Hu, Q.X.; Gu, X.Y. Effect of forces on dynamic metal transfer behavior of cable-type welding wire gas metal arc welding. Int. J. Adv. Manuf. Technol. 2022, 97, 81–90. [Google Scholar] [CrossRef]
  24. Modenesi, P. Statistical Modelling of the Narrow Gap Gas Metal Arc Welding Process. Ph.D. Thesis, University of Cranfield, Cranfield, UK, 1990. [Google Scholar]
  25. Reji, M.; Kumar, R. Response surface methodology (RSM): An overview to analyze multivariate data. Indian J. Microbiol. Res. 2022, 9, 241–248. [Google Scholar] [CrossRef]
  26. Xu, W.; Lin, S.; Fan, C.; Zhuo, X.; Yang, C. Statistical modelling of weld bead geometry in oscillating arc narrow gap all-position GMA welding. Int. J. Adv. Manuf. Technol. 2014, 72, 1705–1716. [Google Scholar] [CrossRef]
  27. Chang, Y.; Yue, J.; Guo, R.; Liu, W.; Li, L. Penetration quality prediction of asymmetrical fillet root welding based on optimized bp neural network. J. Manuf. Process 2020, 50, 247–254. [Google Scholar] [CrossRef]
  28. Padmanaban, G.; Balasubramanian, V. Optimization of laser beam welding process parameters to attain maximum tensile strength in AZ31B magnesium alloy. Opt. Laser Technol. 2010, 42, 1253–1260. [Google Scholar] [CrossRef]
  29. Li, W.; Gao, K.; Wu, J.; Wang, J.; Ji, Y. Groove sidewall penetration modeling for rotating arc narrow gap MAG welding. Int. J. Adv. Manuf. Technol. 2015, 78, 573–581. [Google Scholar] [CrossRef]
  30. Wang, H.; Li, J.; Liu, L. Process optimization and weld forming control based on GA-BP algorithm for riveting-welding hybrid bonding between magnesium and CFRP. J. Manuf. Process. 2021, 70, 97–107. [Google Scholar] [CrossRef]
  31. Li, Y.; Lee, T.; Banu, M.; Hu, S. An integrated process-performance model of ultrasonic composite welding based on finite element and artificial neural network. J. Manuf. Process. 2020, 56, 1374–1380. [Google Scholar] [CrossRef]
  32. Pan, L.; Wang, C.; Hsiao, Y.; Ho, K. Optimization of Nd:YAG laser welding onto magnesium alloy via Taguchi analysis. Opt. Laser Technol. 2005, 37, 33–42. [Google Scholar] [CrossRef]
  33. Pan, L.; Wang, C.; Wei, S.; Sher, H. Optimizing multiple quality characteristics via Taguchi method-based Grey analysis. J. Mater. Process. Technol. 2007, 182, 107–116. [Google Scholar] [CrossRef]
  34. Asit, B. Optimization of process parameters in laser welding of dis-similar materials. Mater. Today Proc. 2020, 33, 5765–5769. [Google Scholar] [CrossRef]
  35. Bao, Y.; Xue, R.; Zhou, J.; Liu, H.; Xu, Y. The Influence of Oscillation Parameters on the Formation of Overhead Welding Seams in the Narrow-Gap GMAW Process. Appl. Sci. 2023, 13, 5519. [Google Scholar] [CrossRef]
  36. Zhang, G.; Shi, Y.; Zhu, M.; Fan, D. Arc characteristics and metal transfer behavior in narrow gap gas metal arc welding process. J. Mater. Process Technol. 2017, 245, 15–23. [Google Scholar] [CrossRef]
Figure 1. Schematic diagram of vertical oscillation arc welding torch.
Applsci 13 06801 g001
Figure 2. Geometry of the narrow gap with double-V type.
Applsci 13 06801 g002
Figure 3. Overall process flowchart.
Applsci 13 06801 g003
Figure 4. Schematic of NG-GMAW in different positions.
Applsci 13 06801 g004
Figure 5. Transection of typical weld-bead morphology at (a) Flat position (0°), (b) Vertical position (90°), and (c) Overhead position (180°).
Applsci 13 06801 g005
Figure 6. Definition measurement metrics of (a) Concave weld bead and (b) Convex weld bead.
Applsci 13 06801 g006
Figure 7. Effect of (a) Voltage, (b) Welding speed, and (c) Oscillation width on sidewall penetration.
Applsci 13 06801 g007
Figure 8. Effect of (a)Wire feed rate, (b)Welding speed, and (c,d) Oscillation width and welding position on the depth of penetration.
Applsci 13 06801 g008aApplsci 13 06801 g008b
Figure 9. Effect of (a) Welding speed, (b) Oscillation width, and (c,d) welding position and Oscillation width on welding height.
Applsci 13 06801 g009aApplsci 13 06801 g009b
Figure 10. Effect of (a) Wire feed rate, (b) Welding speed, and (c) Welding position on the flatness degree.
Applsci 13 06801 g010
Figure 11. Typical incomplete fusion in NG-GMAW. (a) Incomplete fusion in sidewall. (b) Lack of fusion in interlayer.
Applsci 13 06801 g011
Figure 12. Transection macrographs of a single-layer with optimized parameters. (a) Flat position (0°). (b) Vertical position (90°). (c) Overhead position (180°).
Applsci 13 06801 g012
Figure 13. Transection macrograph of multi-layer with optimized parameters. (a) Flat position (0°). (b) Vertical position (90°). (c) Overhead position (180°).
Applsci 13 06801 g013
Table 1. Chemical compositions of specimen and filler wire (wt-%).
CMnSiSPNiCuCrFe
Specimen0.081.370.590.0120.0120.0110.100.021Bal.
Filler wire0.0631.830.280.00060.0110.030.040.03Bal.
Table 2. Code value of the input parameters.
FactorsUnitCode Value
−2.38−10+1+2.38
W f m · min−17.68.79.510.311.4
V V19.721.52422.7525.7
W s mm · min−1281350400450518
α °1.695288.5125175
O W mm0.741.52.052.63.36
Table 3. Designed experiment matrix and measured responses.
StdRunCode VariablesResponse Parameters
W f V W s O W α S p
(mm)
D p
(mm)
W h
(mm)
C
(mm)
131−1−1−1−1−10.31 2.03 2.60 −0.97
2471−1−1−1−10.42 1.92 3.46 −1.21
342−11−1−1−10.43 1.90 3.13 −1.01
4411−1−1−10.59 2.30 3.28 −1.42
512−1−11−1−10.28 1.85 2.15 −0.77
6401−11−1−10.25 2.44 2.53 −1.00
710−111−1−10.34 2.38 2.00 −1.11
815111−1−10.37 2.23 2.60 −1.32
939−1−1−11−10.43 1.73 2.84 −1.09
10201−1−11−10.40 1.93 3.31 −1.42
111−11−11−10.53 2.63 2.10 −1.48
12511−11−10.51 2.55 2.63 −1.33
1346−1−111−10.35 2.19 1.72 −0.99
14441−111−10.26 2.92 1.94 −1.07
158−1111−10.43 2.73 1.45 −0.99
16361111−10.40 3.06 1.69 −1.40
1730−1−1−1−110.32 2.93 2.28 −0.62
18271−1−1−110.26 3.31 3.05 −0.72
1924−11−1−110.40 3.33 2.56 −0.98
20211−1−110.36 3.42 3.15 −0.95
2141−1−11−110.26 2.67 1.95 −0.39
22231−11−110.27 3.22 2.50 −0.57
2319−111−110.34 2.56 1.88 −0.77
2438111−110.38 3.68 2.07 −0.70
2518−1−1−1110.43 2.08 2.76 −0.89
2671−1−1110.38 3.10 3.31 −0.67
2748−11−1110.60 2.38 2.72 −0.89
282211−1110.58 2.90 3.48 −0.85
2928−1−11110.31 2.22 2.14 0.58
30131−11110.36 2.85 2.67 −0.84
3125−111110.47 2.65 5.96 −0.85
3250111110.49 2.95 2.60 −0.89
3321−2.3700000.33 2.06 2.10 −1.06
34352.3700000.32 2.66 2.60 −1.58
35290−2.370000.28 2.52 2.28 −1.11
364302.370000.49 2.54 2.44 −1.52
374500−2.37000.38 1.92 3.29 −1.37
3837002.37000.42 2.23 1.97 −1.01
3933000−2.3700.20 3.31 1.78 −1.04
4090002.3700.53 2.83 1.70 −2.17
41170000−2.370.51 2.51 3.08 −0.62
423200002.370.32 2.87 3.35 0.62
4334000000.312.612.16−1.14
4426000000.42 2.34 2.39 −1.21
4511000000.53 2.16 3.56 −2.76
466000000.49 3.75 3.13 −2.16
4749000000.39 3.29 2.98 −1.85
483000000.35 2.87 2.64 −1.66
4916000000.43 2.98 3.03 −2.46
5014000000.51 2.46 2.62 −1.95
Table 4. ANOVA test results for the sidewall penetration model.
SourceSum of SquaresdfMean SquareF Valuep-Value (Prob > F)
Model1.9830.6625.77<0.0001Significant
V 0.9310.9336.18<0.0001
W s 0.2510.259.690.0032
O W 0.8010.8031.43<0.0001
Residual1.18460.026
Lack of Fit0.93390.0240.680.7966Not significant
Pure Error0.2570.035
Cor Total3.1649
Table 5. ANOVA test results for the welding penetration model.
SourceSum of SquaresdfMean SquareF Valuep-Value (Prob > F)
Model1.0570.158.59<0.0001Significant
W f 0.2210.2212.590.0010
V 0.07410.0744.250.0455
W s 0.04410.0442.510.1203
O W 0.01110.0110.650.4233
α 0.3710.3721.30<0.0001
O W × α 0.1910.1911.000.0019
W s 2 0.1410.147.850.0076
Residual0.73420.017
Lack of Fit0.50350.0140.420.9573Not significant
Pure Error0.2470.034
Cor Total1.7849
Table 6. ANOVA test results for the welding-height model.
SourceSum of SquaresdfMean SquareF Valuep-Value (Prob > F)
Model1.6960.288.14<0.0001Significant
W f 0.1510.154.470.0403
W s 0.6510.6518.79<0.0001
O W 2.543 × 10−512.543 × 10−57.08 × 10−40.9789
α 0.1110.113.210.0803
O W × α 0.4510.4512.900.0008
O w 2 0.3310.339.490.0036
Residual1.49430.035
Lack of Fit1.31360.0361.410.3361Not significant
Pure Error0.1870.026
Cor Total3.1849
Table 7. ANOVA test result for the model of flatness degree of the weld bead.
SourceSquaresdfMean SquareF Valuep-Value (Prob > F)
Model12.3181.5411.81<0.0001Significant
W f 0.4410.443.410.0719
V 0.6310.634.870.0330
W s 0.4310.433.280.0776
α 2.5712.5719.68<0.0001
W f 2 0.8310.836.400.0153
V 2 0.8510.856.550.0143
W s 2 1.1811.189.040.0045
α 2 7.1117.1154.54<0.0001
Residual5.34410.13
Lack of Fit3.12340.090.290.9934Not significant
Pure Error2.2370.32
Cor Total17.6549
Table 8. Criteria settings for numerical optimization.
NameGoalLowerUpperImportance
W f is in range 8.710.33
V is in range 21.5243
W s is in range 3504503
O W is in range 1.52.63
α is equal to 01803
S p maximize 0.30.6014
C is in range−1.50.15
Table 9. Optimal welding parameters.
W f
(mm/min)
V
(v)
W s
(mm/min)
O W
(mm)
α
(°)
10.424.04242.00
10.223.74482.190
8.721.43532.6180
Disclaimer/Publisher’s Note: The statements, opinions and data contained in all publications are solely those of the individual author(s) and contributor(s) and not of MDPI and/or the editor(s). MDPI and/or the editor(s) disclaim responsibility for any injury to people or property resulting from any ideas, methods, instructions or products referred to in the content.

