1. Introduction
The prevalence of Unmanned Aerial Vehicles (UAVs) or drones used for such applications as delivery of goods, remote sensing, surveying, inspection, and recreation has been increasing over the past decade [
1]. Like most technologies, UAVs can be misused. The motivation for such malicious use may be to cause annoyance, invade privacy, cause physical harm or even to shutdown airspace with its associated economic impact [
2,
3].
Once a malicious UAV is detected, there are various countermeasures that can be considered, including capturing or destroying the UAV, jamming its wireless link so it cannot be controlled or report data back, and identifying and fining the owner [
4]. Depending upon the exact scenario, the detection may depend upon a person reporting the malicious UAV to authorities, perhaps with a photo of the UAV included as part of the report. It would be very useful to be able to automatically predict the manufacturer and specific product identification of the malicious UAV from the photo using a trained image classification model, even if the UAV is relatively far away from the person taking the photo.
The research problem this paper addresses is whether it is possible to train a deep learning image classification model to accurately classify images of UAVs in flight in terms of the manufacturer and specific product identification. This is a difficult image classification problem because the UAVs are in flight and so may be quite distant from the camera, thereby appearing relatively small in an image. In addition, different types of UAVs appear visually similar, so it is not straightforward to distinguish between them.
In this paper, we discuss the acquisition of an image dataset of three popular UAVs in flight:
The first two of these are visually similar, so much so that a person would be challenged to distinguish between them. Images are taken at various UAV elevations and distances using different zoom levels on the camera.
We then train various deep learning image classification models based upon Convolutional Neural Networks (CNNs) using the labelled image dataset. In this paper, we are most interested in Resnet-18 because it is relatively lightweight and has such a good reputation in a large variety of image classification tasks. We compare the performance of Resnet-18 against other popular and high performing models; these are AlexNet, VGG-16, and MobileNet v2 [
5]. Rather than start the model training from the beginning, we employ the established technique of transfer learning, in which we start with a pre-trained model for a different image dataset and optimize the parameters for the UAV image dataset [
6]. This reduces the time required to train the model and makes robust training possible with a smaller dataset.
Research into detecting and possibly identifying UAVs, both non-malicious and malicious, using machine learning techniques has been undertaken by several projects over the past decade as the prevalence of industrial and consumer UAVs has increased [
7]. The raw data on which these machine learning techniques are trained can be based on audio, images, video, and radar signatures. In this section, we concentrate on the research related to image classification of malicious UAVs since this is the subject matter of the present paper.
In [
8], the authors used a vision transformer (ViT) framework to model a dataset comprising 776 images of aeroplanes, helicopters, birds, non-malicious UAVs and malicious UAVs. The distinction between non-malicious and malicious UAVs was made primarily based upon whether the UAV was carrying a payload, which was assumed to be harmful and/or illegal. The model achieved an impressive accuracy of 98.3%. Our paper addresses a different problem, whereby a person reports a UAV as malicious based upon its location or behaviour rather than its visual characteristics or whether it is carrying a load, and the problem is to try to identify the type of UAV from the image provided in the report. However, our paper does not address UAVs carrying loads, and a future direction of our research will be to complement the image dataset with images of UAVs carrying loads.
In [
9], the authors trained a You Only Look Once (YOLO) model to detect and track UAVs in video streams. They used the DJI Mavic Pro and DJI Phantom III for validation purposes and achieved a mean average precision (mAP) of 74.36%, which was superior to previous studies. However, they did not distinguish whether the UAV in the video stream was a DJI Mavic Pro or DJI Phantom III, identifying it only as a generic UAV. The objective of our research is different, to be able to distinguish between different UAV types (e.g., by manufacturer and specific model) based upon an image provided.
The study in [
10] employed a dataset of 506 images and 217 audio samples to train and test a deep-learning model for the detection of UAVs based upon combined visual and audio characteristics. The best accuracy obtained was 98.5%. However, the aim was not to differentiate between different types of UAVs as in our research; rather, it was to distinguish between UAVs as a general class of object and other objects such as airplanes, birds, kites, and balloons. The combined video/audio approach was also adopted in [
11], but despite using different types of UAV such as a DJI Phantom 4 and DJI Mavic in the training and testing of the model, they did not attempt to distinguish the exact UAV type in the vicinity of the observer; instead, the objective was simply to detect that a UAV of some type was present.
The research presented in this paper is different from that reviewed above and novel in that it attempts to classify the manufacturer and specific product identification of a UAV in an image, with the UAV being at various elevations and distances from the observer, and with the observer using various zoom levels when taking the photo. The task is challenging both because we are attempting to distinguish between UAVs which may look similar, especially from a distance, and because the image may be taken at different distance and viewing angles with respect to the target UAV.
Before we captured our own dataset, we investigated whether any other public domain-specific datasets [
12,
13] existed in this area. In terms of other image and/or video datasets that could potentially be employed as part of this study, most public datasets are of images and/or videos taken by drones/UAVs rather than images and/or videos of drones/UAVs. One notable exception is a dataset of 1359 UAV images on Kaggle [
14]. However, this dataset cannot be meaningfully used in our study for a variety of reasons (1) many of the images are not of UAVs in flight, rather they are images of people holding a UAV or the UAV on the ground, (2) there is no information on the manufacturer or model of the UAV in the metadata, (3) the dataset is not balanced in terms of an equal number of images of each UAV type, and (4) for those images representing UAVs in flight, there is no information on elevation or horizontal distance from the camera.
The novel contributions of the paper are as follows:
Development of a methodology to capture a balanced and structured image dataset of different UAVs in flight. The dataset is balanced in terms of the number of images of each UAV and structured in that images are captured at specified elevations, horizontal distances and zoom levels. There is no similar (public) image dataset available.
Training, testing and cross validation of various deep learning image classification models to be able to distinguish the manufacturer and specific product identification of a UAV in an image.
An analysis of the ability of the image classification models to distinguish between UAVs which are extremely similar in visual appearance, and to classify UAVs which are distant from the observer. Specifically, the average testing accuracy of the trained Resnet-18 model on the dataset is greater than 80% even though two of the three UAVs, the DJI Mavic 2 Enterprise and the DJI Mavic Air, are very similar in appearance, and even though the UAVs may be at an elevation of 30 m and a horizontal distance of 30 m from the observer.
2. Materials and Methods
2.1. UAV Selection
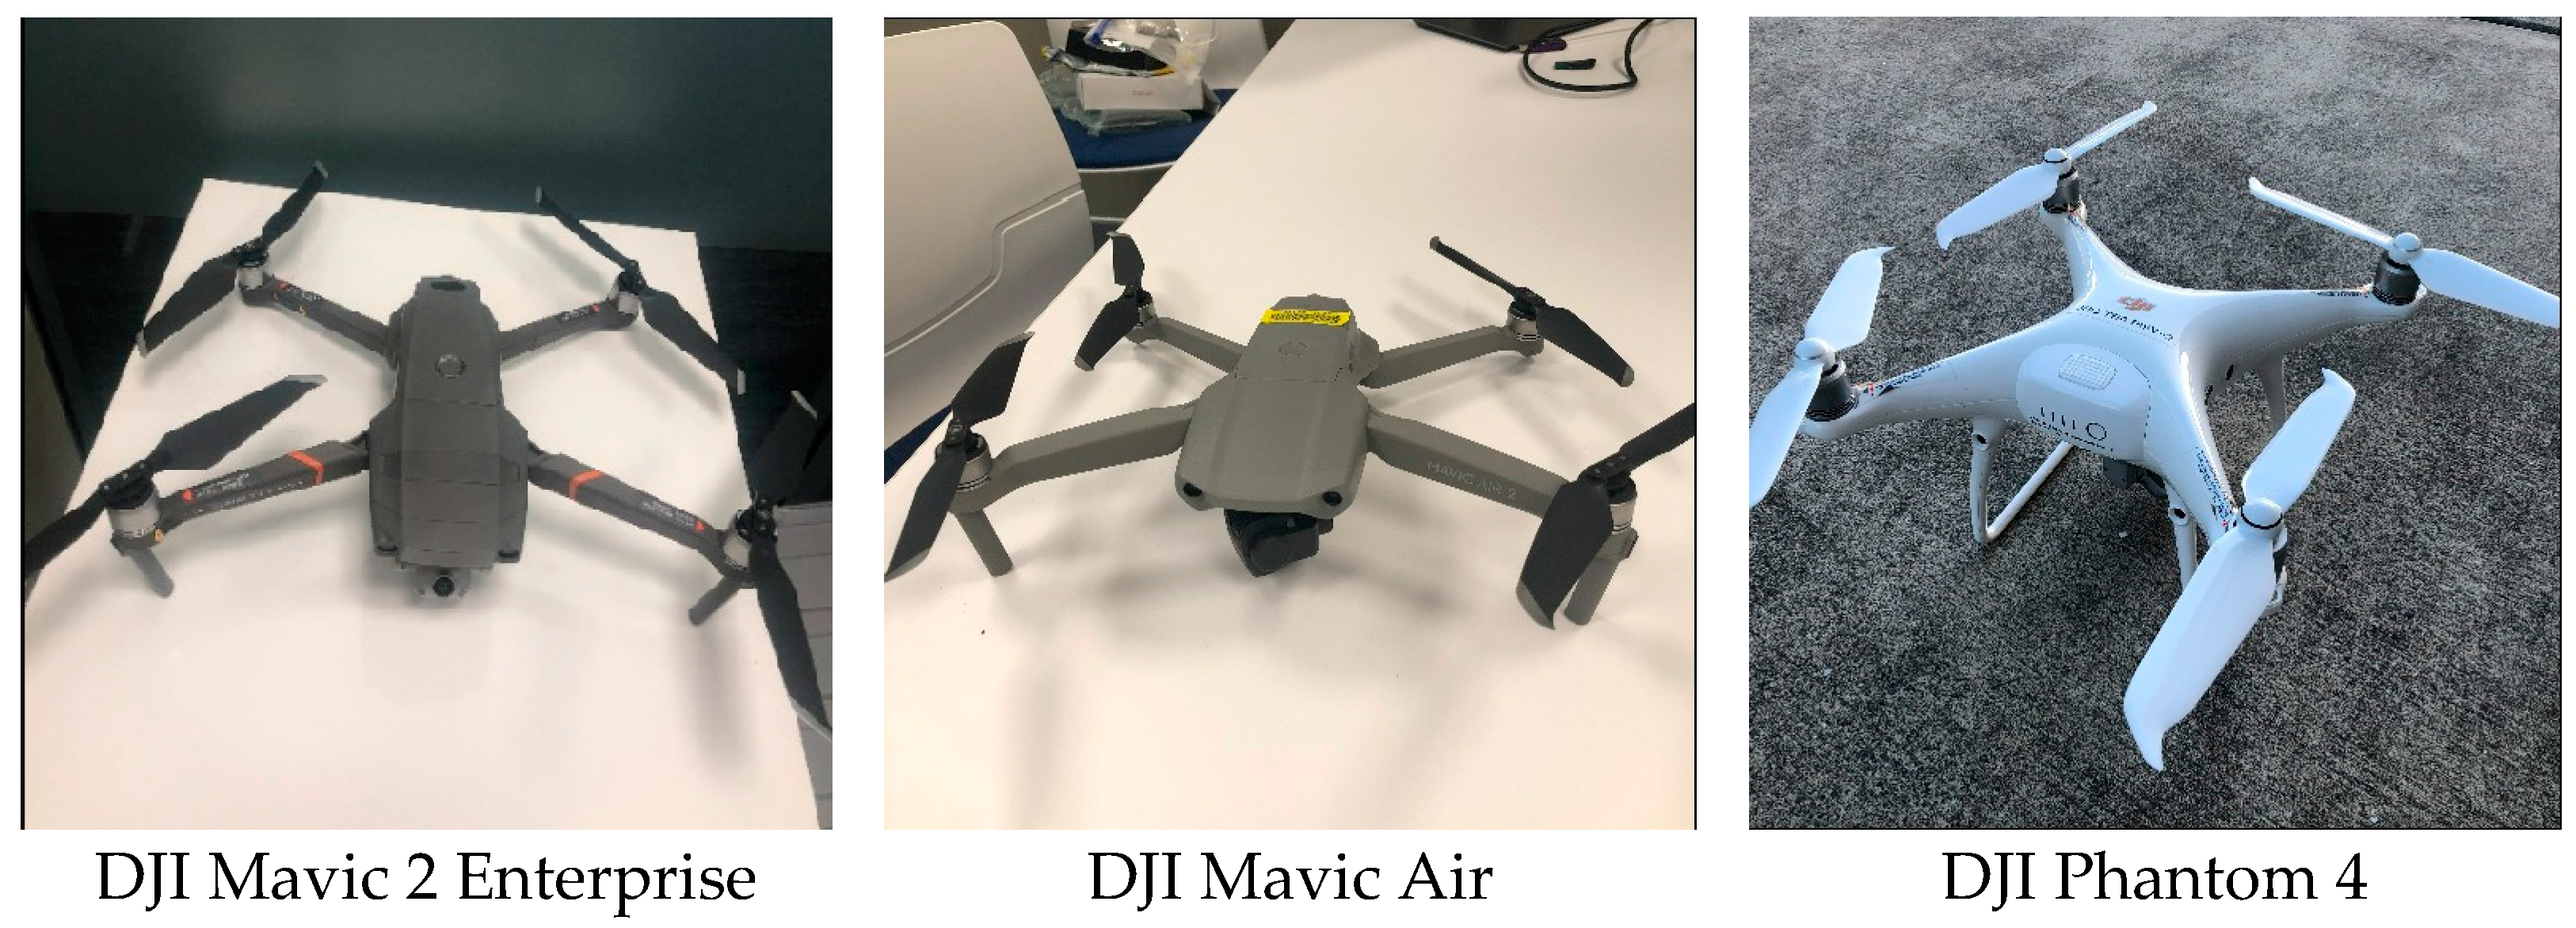
It was decided to restrict the number of distinct UAVs employed in the current study to three to understand whether existing state-of-the-art deep-learning image classification models could distinguish between them even when the UAVs are quite far from the observer. The UAVs employed are illustrated in
Figure 1.
Clearly, the DJI Mavic 2 Enterprise and DJI Mavic Air are visually similar, so we would intuitively expect an image classification model to struggle to distinguish between them. In contrast, the visual appearance of the DJI Phantom 4 is strikingly different in color and shape, so we would intuitively expect an image classification model to be able to easily distinguish between this UAV and the other two.
2.2. Image Capture
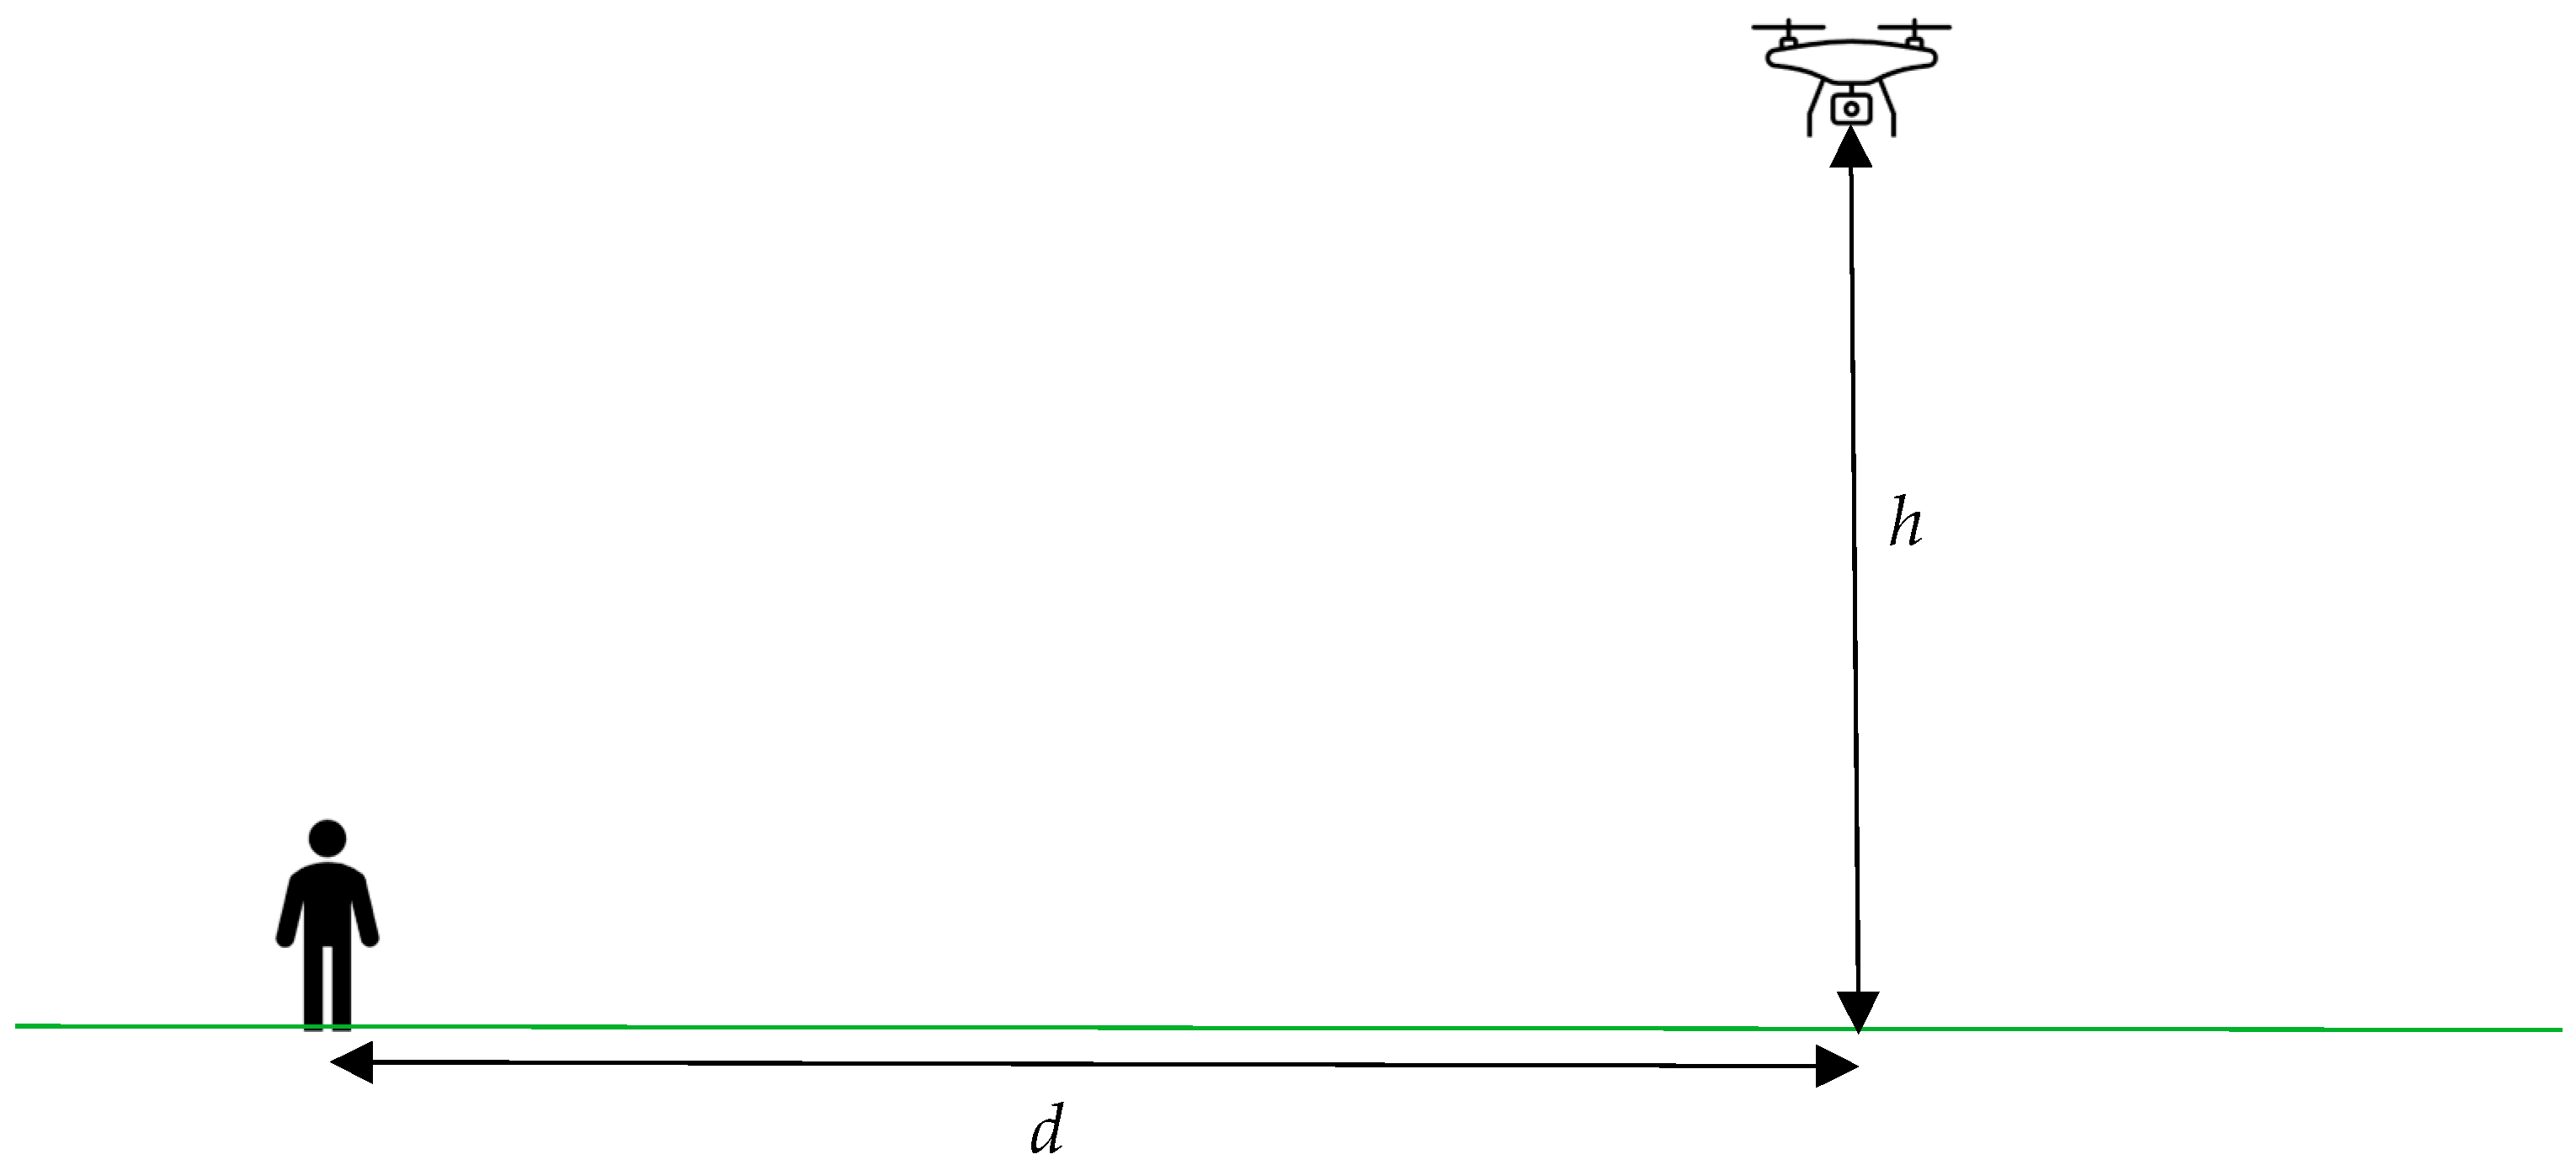
The methodology for capturing images of UAVs to form a trial dataset was designed to mirror how people are likely to take photos of malicious UAVs for reporting purposes in the field. Specifically, people are likely to use a smartphone for image capture, possibly with optical and/or digital zoom, and the target UAV may be at a different elevation
h and a different horizontal distance from the person taking the photo
d (see
Figure 2).
The images were all captured with an iPhone X which supports a 12 MP (3024 × 4032 pixels) autofocus camera with 2× optical zoom and 10× digital zoom. For each UAV position in terms of a distinct pair of h and d values, images were captured with 1×, 2×, 3×, 5× and 10× zoom. It should be stressed that a distinct photo was taken for each zoom level as opposed to a single image being taken and that image subsequently processed with different zoom levels.
Elevation values h of 5 m, 10 m, 15 m, 20 m, 25 m and 30 m were employed. These were measured from the UAV controller display.
Horizontal distances d of 0 m (i.e., observer directly below the UAV), 10 m, 20 m and 30 m were employed. These were measured with a standard measuring wheel.
With an image taken of each UAV for each of 5 camera zoom levels, 6 elevation levels and 4 horizontal distances, the dataset was expected to comprise 5 × 6 × 4 = 120 images of each UAV. In fact, some additional images were captured for the largest values of h and d because a clear image could not always be captured in these cases. A total of 127 images were captured for each of the three UAVs. Therefore, the dataset is balanced in that there are the same number of images taken under similar circumstances for each of the three UAVs. Balanced datasets are preferred for machine learning to prevent a model being trained with a bias for one or more objects of interest.
It should be noted that there are some other advantages of this methodology for image capture other than simply mirroring what a typical person trying to report a malicious UAV in the field might do. Firstly, the use of different camera zoom levels and different values of h and d values changes:
the size of the UAV in the image.
the view angle at which the UAV is captured, thereby exposing different visual characteristics of the UAV.
the background of the image.
This increases the diversity of the image dataset, which is known to be very important when the objective is to develop a robust image classification model which can make accurate predictions when exposed to new previously unseen images. For example,
Figure 3 illustrates the effect of using different zoom levels (in successive shots) on the size of the UAV in the image and the image background.
Figure 4 illustrates the effect of different UAV elevations on the size of the UAV in the image, the view angle of the UAV in the image and the image background (note: these images were taken some time apart which explains why the backgrounds are different).
Another advantage of the image capture methodology in terms of formally indexing each image by zoom level, elevation h and horizontal distance d, is that it opens the possibility of not just image classification (i.e., predicting the type of UAV in the image), but also elevation prediction and distance prediction. This topic is not covered in this paper, primarily because it would require a much larger dataset, but it is an interesting possibility for the future, particularly as such predictions may facilitate evidence that a UAV was flying illegally (e.g., too close to people).
2.3. Model Theoretical Background
The deep-learning CNN image classification models employed as part of this study are compared and summarized in
Table 1. These are all well-known and high performing image classification models. Some of them are part of families, e.g., there are Resnet-18, Resnet-34, Resnet-50 and Resnet-101 models. For this investigation, we generally employed the least complex model in a family (e.g., Resnet-18 in the case of Resnet) because it has the fewest number of parameters to train and therefore is less likely to be overfit when using a dataset that is not particularly large.
As discussed in the Introduction, we are primarily interested in Resnet-18 because it is relatively lightweight and has such a good reputation in a large variety of image classification tasks. Resnet-18 is a Convolutional Neural Network model which has 18 convolutional and/or fully connected layers in its architecture [
15] as illustrated in
Figure 5. To understand the structure of a typical convolution layer, consider the convolutional layer with designation “3 × 3, Conv, 128,/2”. This uses 128 filters with window size 3 × 3 and a stride of 2. The curved arrows represent skip connections which provide some protection against overfitting.
AlexNet was proposed by Alex Krizhevesky [
16] in 2012 and is a deep and wide CNN model. This was considered as a significant step in the field of machine learning and computer vision for visual recognition and classification. The AlexNet architecture has 3 convolution layers and 2 fully connected layers. The recognition accuracy was found to be better against all traditional machine learning and computer vision approaches.
VGG-16 is a Convolutional Neural Network (CNN) model which was proposed by Karen Simonyan and Andrew Zisserman [
17]. The use of uniform 3 × 3 filters is the standout feature of the VGG technique which reduces the number of weight parameters when compared to a 7 × 7 filters.
MobileNetv2 is a CNN that is based on an inverted residual structure whereby the residual connections are between the thin bottleneck layers [
18]. As a source of non-linearity, the intermediate layer utilizes the lightweight depth wise convolutions to filter features. The architecture has a fully convolution layer with 32 filters and 19 residual bottleneck layers.
2.4. Image Pre-Processing and Management
As discussed previously, a total of 127 images were captured for each of the three UAVs. All images were down-sampled from 3024 × 4032 pixel resolution to 256 × 256 pixel resolution since this is a common intermediate resolution prior to training [
5]. This also involved some cropping of the image, since the source raw image is rectangular (i.e., non-square) while the output processed image is square. The down-sampling/cropping was performed manually for all images to ensure the UAV was still in the frame of the output processed image.
The processed image data was then pseudo-randomly split into 101 training images and 26 test images for each UAV using the Python split-folders module [
19] with a specific seed (2002). This corresponds to approximately an 80/20 split of train/test data, which is quite common when training image classification models.
2.5. Model Training and Validation
The 3 × 101 training images were then used to train each of the deep-learning CNN image classification models specified in
Table 1. This number of training samples is not sufficient to train the model from an initial (random) state. Instead, the models were pretrained with the ImageNet database, i.e., pre-loaded with weights corresponding to the result of training on ImageNet [
20], then the last model layer was replaced so as to classify just three objects (i.e., the three UAVs use in this study), and the 3 × 101 training images were employed to further optimize all the weights to apply to the UAV images under consideration. This is known as
transfer learning [
6] and it is a standard technique employed in image classification for relatively small image datasets. As part of the training, we employed data augmentations of a random horizontal flip and a random resized crop to the model input image resolution (see
Table 1). Such data augmentations are useful for generalizing the applicability of the trained model to new and previously unseen data.
Table 2 shows the hyperparameters used in the training for all models. The number of epochs (25) was sufficient to train the model to a converged final accuracy in all cases.
When training is complete, the accuracy of the model in correctly predicting the UAV type in each image of the test set is given by:
is the number of test images for which the trained model correctly predicted the UAV type, and is the total number of test images.
2.6. Cross Validation
The previous sections discuss model training and validation for one specific pseudo-random 80/20 training/test split of the processed image data. This is useful to obtain an initial idea about the relative accuracies of the different models, but ultimately the process should be repeated with multiple different training/test splits of the processed image data to fully characterize the model performance and remove any bias that using just one specific training/test split may result in.
For this paper, we used repeated random sub-sampling cross validation (sometimes known as Monte Carlo cross-validation). The processed image data was partitioned 30 times into different 80/20 training/test splits using 30 different random seeds of the Python split-folders module [
19]. Note that each such split was balanced in that it contained 101 training images and 26 test images for each UAV, i.e., there were the same number of training images for each UAV and the same number of test images for each UAV. Each model was trained across all 30 training/test splits, and the model accuracy figures averaged.
4. Conclusions and Further Work
In this paper, we have described the collection of an image dataset for 3 popular UAVs at different elevations, different distances from the observer, and using different camera zoom levels. This UAV image dataset has been modelled using four CNN image classification algorithms, comprising AlexNet, VGG-16, Resnet-18 and MobileNet v2. The accuracy of the trained models on previously unseen test images is up to approximately 81% (for Resnet-18). This is encouraging given that two of the UAVs, the DJI Mavic 2 Enterprise and the DJI Mavic Air, are visually similar, and given that some of the photos of UAVs were taken at relatively large distances from the observer. The main anticipated application of this work is the automatic identification of the manufacturer and specific product identification of a UAV contained in an image which is part of a malicious UAV report. However, it could equally be employed in real time by security cameras (e.g., on buildings or other infrastructure) which identify an unwanted or even illegal UAV in the vicinity.
The main limitations of this image classification based technique for UAV identification are (1) it can be difficult to distinguish between UAVs which are of similar appearance and/or have similar flight characteristics, and (2) UAVs which are far from the observer/camera will appear small in the image, thus complicating identification via image classification. Therefore, it may be useful to combine this technique with other methods of UAV identification (such as radar or acoustic signature), although this may not always be feasible depending upon the scenario.
Given the encouraging results to date, we plan to expand the image dataset to include more UAV types, and more UAV usage scenarios, e.g., UAVs carrying loads, UAVs in motion and UAVs that are part of swarms. In addition, all the images collected to date were taken from below the UAV, because the main application for the work is an observer manually observing a (malicious) UAV from the ground. However, there is also the possibility that the images can be captured from above the UAV, e.g., by security cameras on tall buildings or even by another UAV. Therefore, we also plan to take photos of UAVs from above. The set of candidate image classification models may also be expanded; given the anticipated increased size of the image database, more complex models such as Resnet-34 may be considered. Finally, we would also like to expand the work to include object detection of UAV type in video streams using a YOLO variant as the object detection algorithm.


