Abstract
Aerodynamic drag reduction is required with new stringent constraints on pollutant emissions and fuel efficiency of ground vehicles. In this context, active flow control is a promising approach to achieve this target. This study focuses on applying different flow control strategies on the square-back Ahmed model to reduce aerodynamic drag. A steady blowing jet, a synthetic jet and an unsteady jet are located at the back edges of the model as flow control devices. A numerical study based on the 3D WMLES simulation was performed to evaluate the drag reduction capabilities of these devices at different operating conditions. The results showed that a maximum aerodynamic drag reduction of 26.51% was achieved when using a steady blowing jet, and 17.27% with an unsteady jet. In contrast, the effect of the synthetic jet on the aerodynamic drag of the model is solely at high control frequencies.
1. Introduction
Governments’ demands for pollutant emissions and fuel efficiency have led to many studies on reducing automotive aerodynamic drag, which is responsible for most fuel consumption for high speeds above 80 km/h [1].
However, assessing the aerodynamic characteristics of realistic automotive vehicles is a challenge due to the complexities of flow around the vehicles, associated with the instability and unsteady phenomena. To solve this problem, simplified automotive models are designed in place of actual vehicle geometries to study important flow characteristics while reducing the impact of the complex vehicle design. The Ahmed body, originally proposed to explore the influences of the rear slant angle on the near-wake flow structure is a widely studied model [2]. In more recent studies, because of the increase in interest in commercial minivans, trucks, and buses, the Ahmed square-back model has been focused on investigation. Both numerical and experimental studies have been conducted on the flow physics of this model.
The aerodynamic drag of the bluff body, such as the square-back Ahmed model, is dominated by pressure deficiency due to flow separation, and unsteady vortex formation in the wake region at the rear surface of the vehicle. This leads to the development of control flow methods that can modify the flow at the rear end of the model to delay the separated flow and thereby reduce the aerodynamic drag. These techniques vary from passive control device to active control device usage. Passive devices localized on the rear surface of the vehicle, such as boat tailing, splitter plates, and vortex generators have shown an ability of significant aerodynamic drag reduction [3,4,5,6,7]. However, the application of passive methods requires a substantial modification of the vehicle shape, leading to conflicts with constraints of the length and the exterior aesthetics.
The drawbacks of the passive methods put more focus on the active control strategy. The active control devices require additional energy to modify the flow around the model without considerable interference in its shape. Various active flow control studies have been conducted both on the simplified model and realistic vehicles, and promising results in drag reduction have been obtained. For instance, dielectric barrier discharge plasma actuators have been used as a flow control device on the Ahmed model [8,9,10]. Englar et al. used a tangential blowing jet on the rear end of a tractor-trailer to reduce aerodynamic drag by more than 30 percent [11]. Numerical studies were performed by Wassen et al. [12] and Rouméas et al. [13], in which a steady blowing jet was used to change the wake structure of the square-back Ahmed model. The numerical results showed that the aerodynamic drag reduction was approximately 17–29%, depending on the jet angle and velocity. McNally et al. [14] performed experimental and computational studies to evaluate the ability of a microjet device to control flow on a simple vehicle geometry. They showed a drag reduction of 3%. Another study conducted by Littlewood et al. [15] pointed out that a drag reduction of 12% was achieved when using a steady jet on the rear edges of a simple truck model. According to the above studies, the active flow control method using the steady blowing jet has shown promising results in reducing aerodynamic drag with various operating conditions, especially when considering simple vehicle geometries. However, they often require vast energy input, even greater than the energy saved due to reduced drag. Therefore, the control energy efficiency of this method is still not clear.
Recently, another promising active flow control technique, i.e., a synthetic jet, that generates the periodic blowing and suction in a jet cycle has been vastly studied. The average mass flow rate in a cycle (blowing and suction) is zero; thus such a device is called a zero-net-mass-flux actuator [16]. For instance, Park et al. [17] and Aloui et al. [18] applied this device at the top edge of the slant surface of the 25° Ahmed model, and experimental results pointed out that a drag reduction of 10% can be achieved at optimal control condition. A LES model was performed to evaluate the effect of a synthetic jet on near-wake region and aerodynamic drag obtained on a bluff-body model [19]. In particular, El-Alti et al. [20,21,22] performed experimental and numerical studies, using the loudspeakers as synthetic jet actuators located at the rear surface of the vehicle, to investigate its ability of aerodynamic drag reduction on a simple truck. The results showed that the aerodynamic drag coefficient is reduced by 3.1% when a synthetic jet is activated compared with the reference case. Although there is no requirement for large input energy as the steady blowing jet method, the above studies pointed out that the capability of the synthetic jet to reduce the aerodynamic drag is insufficient. This can be explained by the deficiency of the output jet velocity and hence the interaction with flow field around the vehicle is limited. In addition, a study conducted by Wang et al. [23] also showed that the solely blowing or suction phase of the synthetic jet contributes to the aerodynamic drag reduction. It means that only half-cycle of the synthetic jet can be used for the purpose of reducing aerodynamic drag.
To overcome the limitations of the steady blowing jet and synthetic jet methods mentioned above, Wang et al. [24] proposed a new control device, which requires a smaller amount of power input while maintaining an acceptable ability of the aerodynamic drag reduction. This device generates an unsteady jet, derived from a synthetic jet, in which only a blowing or suction jet is produced in a control cycle. The numerical results performed on the 25° Ahmed model have demonstrated the effectiveness of this new control method. An unsteady jet with different jet angles and control frequencies, applied sequentially at the edges of the back surface of the model has displayed a maximum aerodynamic drag reduction of 13.6%.
The above literature study has pointed out the advantages and weaknesses of different active flow control techniques, and their potential in the aerodynamic drag reduction in vehicles. However, these flow control methods were applied to different vehicle models with various operating conditions. In particular, studies on the application of synthetic and unsteady jets to the square-back Ahmed model, both numerically and experimentally, have not been carried out yet. Hence, a systematic evaluation of the effectiveness of different flow control methods in reducing aerodynamic drag on this model has not yet been performed. Therefore, the main purpose of this article is to provide a comparative study on a range of flow control strategies for a square-back Ahmed model to choose the best techniques for aerodynamic drag reduction. The control methods applied in this study are steady blowing, synthetic and unsteady jets placed on the four edges of the rear surface of the model. The effect of the control jet at various jet angles and control frequencies on the near-wake structure behind the model was analyzed, and the ability of drag reduction with different flow control strategies was then clearly compared.
2. Computational Setup
2.1. Computational Mesh
The geometry and dimension of the square-back Ahmed model are determined from the work of Ahmed et al. [2], where L = 1044 mm, H = 288 mm and W = 389 mm are the length, height, and width of the model, respectively (Figure 1).

Figure 1.
The square-back Ahmed model and dimensions in mm.
The computational domain is a rectangular box with dimensions of the length, height, and width of 26H, 5H and 3H, respectively. The domain extends to seven body heights upstream of the front surface of the model and eighteen body heights behind the rear surface of the model as shown in Figure 2. Such domain size ensures that the outflow does not interact and affect the development of the near-wake region.
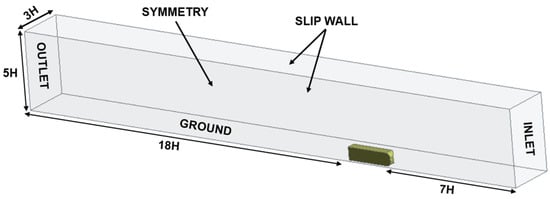
Figure 2.
Computational domain and boundary conditions.
The flow is displaced from right to left, and a uniform velocity inlet boundary condition U0 = 30 m/s is applied at the right-hand surface of the computational domain, resulting in a Reynolds number Re of 2.1 × 10⁶ associated with the model length. At the left-hand surface of the computational domain, a pressure outlet boundary condition is used. The XZ plane (y = 0) is known as the ground of the computational domain, and a no-slip boundary condition is applied. A similar boundary condition is also specified for the square-back Ahmed model. The XY plane (z = 0) is used as a symmetry plane, and a symmetry condition is imposed on it. Finally, a slip boundary condition is applied to the side walls of the computational domain.
In this study, the numerical simulation was performed using the ANSYS 2021 package [25]. A CAD model was designed with the Design Modeler module. A hexagonal mesh was then generated using ANSYS ICEM from imported CAD geometry. The multi-block technique manually divided the computational domain was into numerous block regions (Figure 3a). A mesh refinement was performed in the normal direction to the wall near the model and the near-wake region. In the actuated cases, more refinement was applied in the vicinity of the continuous slots at the rear surface of the body where the control devices are installed. These settings resulted in a hexa mesh with an O-grid structure around the model (Figure 3b). A first layer thickness of 0.03 mm was used on the model and obtained a y+ ≤ 3 (Figure 4). A maximum size of 3 mm × 3 mm is specified for surface mesh on the model. The mesh resolutions of Δx+ ≤ 127 and Δz+ ≤ 136 obtained. Such resolution is suitable to perform a Wall-Modeled LES.

Figure 3.
Computational mesh. (a) Block structure; (b) mesh.
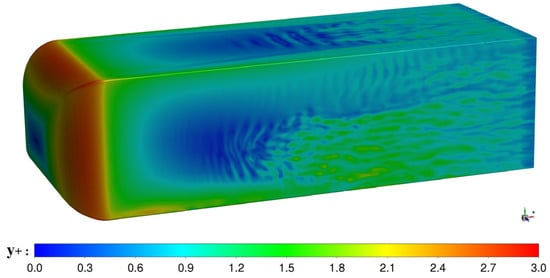
Figure 4.
Y plus distribution on the square-back Ahmed model.
A mesh independence test with five mesh levels, i.e., 6.4, 12.6, 19.5, 25.3, and 28.6 million elements, was conducted to demonstrate numerical accuracy. Figure 5 shows that the drag coefficient in the unactuated case is irrelevant to the mesh size when the element number exceeds 19.5 million. In this case, the drag coefficient CD0 = 0.249 is achieved with a deviation of 0.4% compared with the experimental result from the study of Ahmed et al. [2] and the numerical result of Rouméas et al. [13].
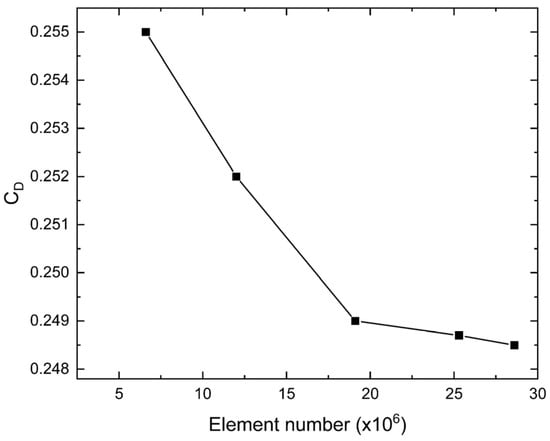
Figure 5.
Mesh dependent test.
2.2. Computational Solver
The Large Eddy Simulation was used to resolve the flow field around the square-back Ahmed model with and without control. The governing equations in the LES method are the incompressible Navier–Stokes equation and the continuity equation, which are expressed as follows:
where and stand for spatial filtered fields, is the density of the air, and μ denotes the dynamic viscosity.
represents the subgrid-scale (SGS) turbulent stresses:
where is the SGS turbulent viscosity. represents the filtered rate-of-strain tensor:
Although the rapid development of high-performance computing systems and advanced algorithms in recent years, the application of LES in the academic community is still limited, especially in industrial research. One of the restrictions when applying LES in automotive aerodynamics is the requirement of a vast computational resource to resolve the flow field in the near-wall region. The flow in this region significantly influences the development of the near-wake structure and the aerodynamic forces on the model. At high Reynolds numbers Re, the size of vortices decreases rapidly as the flow approaches the solid boundaries. Thus, a fine mesh and a very small time step are required at the near-wall region, and LES turns unaffordable. One promising approach to overcome this limitation of the LES is the use of Wall-Modeled LES (WMLES) [26]. In WMLES, large eddies of flow far from the solid boundary are resolved, while the flow in the near-wall region is modeled. In this study, WMLES was used to calculate the flow fields around the square-back Ahmed model.
The finite volume based ANSYS Fluent 2021 solver was used to solve the WMLES equations. The SIMPLEC algorithm was applied for pressure-velocity coupling, and Least Square Cell Based approach was used to discretize the gradient terms. Furthermore, the momentum terms were calculated with the Bounded Central Differencing method. Finally, the Bounded Second Order Implicit scheme was imposed for the time discretization. A time step of Δt = 1 × 10⁻⁵ s was specified to numerically solve for the flows around the model in the unactuated and actuated cases, at various operating conditions. In all simulated cases, the CFL < 1.5 condition was satisfied, as shown in Figure 6. 30,000 time steps, corresponding to 0.3 s of iteration time were run, and solution convergence was obtained within the first 12,000 time steps. The last 18,000 time steps were used to determine the flow topology, aerodynamic forces on the body, and to perform the spectral analysis in the following section.

Figure 6.
CFL distribution on the symmetry plane (z = 0).
2.3. Characterization of a Flow Control Device
Flow control devices were applied to the numerical simulation using four continuous slots located at the back surface of the model (Figure 7). The width of these slots is b = 4 mm, and the angle between the control jet and the rear surface of the vehicle is defined as the jet angle β (Figure 7). An input velocity boundary condition was imposed on the slots for modeling the flow control devices.
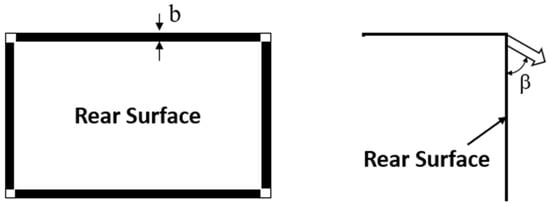
Figure 7.
Schematic of a control device setup.
In this study, the flow control methods are steady blowing, synthetic and unsteady jets. A uniform velocity input boundary condition Uj = U0 is applied to the continuous slots to define a steady blowing jet. Similarly, a sinusoidal velocity profile Uj = U0sin(2πfct) was used with the synthetic jet, thereby performing the cyclic blowing and suction. In order to produce a jet that solely blows or sucks in a control cycle for an unsteady jet technique, a semi-sinusoid profile Uj = ±|U0sin(2πfct) was specified on slot exit, where + stands for the blowing jet and – represents the suction jet. Numerical results from the work of Wang et al. [24] using an unsteady jet to the edges at the back wall of the 25° Ahmed model showed that, in most cases, the use of a blowing jet is more effective in reducing aerodynamic drag. Therefore, only a blowing jet was used in this study. The control frequency fc is identical to the one in the numerical study of Wang et al. [24], in which they range from [34, 68, 272] Hz. Figure 8 illustrates the output signals from a synthetic and an unsteady jet device with the control frequency of 34 Hz.
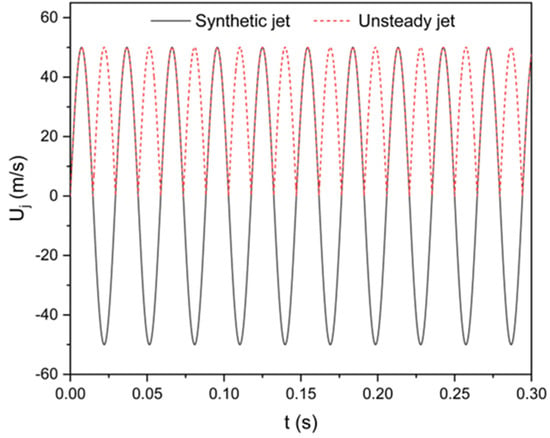
Figure 8.
Output signals of synthetic and unsteady jet devices.
3. Results and Discussions
3.1. Baseline Flow
The initial numerical study was carried out to investigate the characteristics of baseline flow around the Ahmed model without a control device. Figure 9 presents a time-averaged normalized streamwise velocity contour and streamlines in the near wake region in the symmetry plane (z = 0). The flow from the roof, underbody and side walls of the body are separated at the rear edges, forming a pair of counter-rotating recirculation zones. These two zones are quasi-symmetrical; however, the center of the lower zone is closer to the rear surface of the model than the top recirculation region. Such a phenomenon has also been observed in an experimental study on a similar geometry [14]. Further downstream, a saddle point S is identified at x = 0.38 m (x/H = 1.32) (Figure 9).
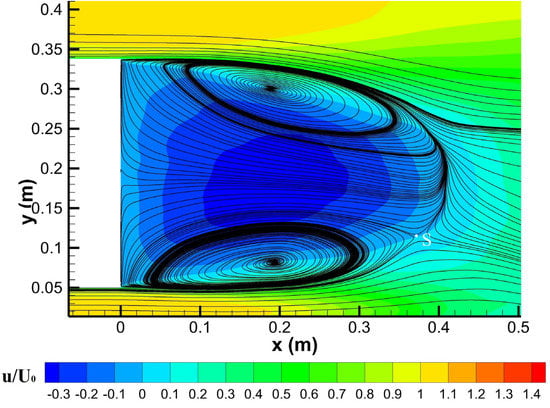
Figure 9.
Time-averaged streamlines in the behind of the model, on symmetry plane of baseline flow.
The normalized streamwise velocity profiles in the symmetry plane (z = 0) at different x/H are determined. They are plotted in Figure 10 in comparison to the numerical results of Rouméas et al. [13] at the same location. No significant difference in obtained velocity profiles is found between the two works. A backward flow is observed at all measured positions in the near-wake region, especially at x/H = 0.5 and x/H = 1, with a minimum negative backward velocity approximately equal to 0.4U0. Moving towards the rear surface of the model (x/H = 0.1), the wall effect causes a reduction in the backward flow, and umin is around 0.1U0 over the entire height of the back surface of the body (0.2 < y/H < 1).
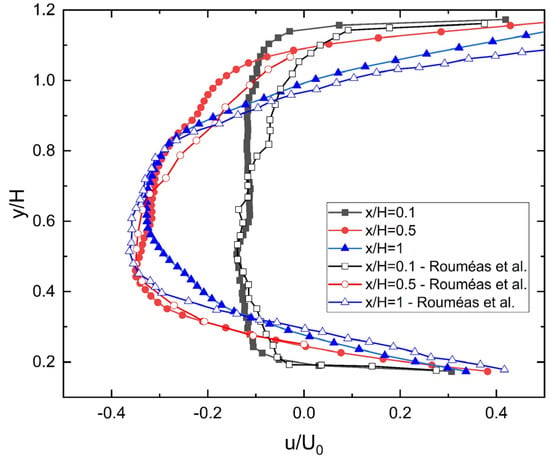
Figure 10.
Vertical normalized streamwise velocity profiles, determined at different x/H positions in the symmetry plane.
The flow visualization using the Q-criterion at a value of Q = 300,000 s−2 also reveals that the flow field around the body is dominated by small-scale vortices [27]. A laminar boundary layer is created at the front of the model, which subsequently separates and reattaches to form a separation bubble as the flow moves towards downstream, as illustrated in Figure 11. Consequently, a low pressure region is formed on the surface at the front portion of the model. Further downstream, the turbulent boundary layer develops, and the formation of small-scale vortices is highlighted. These vortices are separated at the rear edges of the model and enter the wake region. A turbulent shear layer is formed behind the body, in which the small-scale vortices interact and merge to develop large-scale vortical structures, as shown in Figure 10. In addition, the interaction of the wake region with the underbody flow is also a main reason for the complex flow structures behind the model.
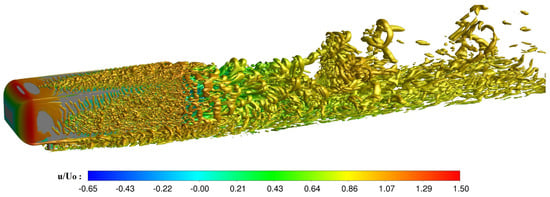
Figure 11.
The normalized streamwise contour of baseline flow at iso-surface of Q = 300,000 s−2.
3.2. Active Flow Control
3.2.1. Effect of the Different Active Flow Control Types
The first computational attempt of actuated flow around the model focused on evaluating the influence of different control techniques on the flow structures and the obtained aerodynamic forces. Three flow control devices, i.e., steady blowing, synthetic and unsteady jets, with a jet velocity of Uj = U0 and jet angle of β = 45° were used. The control frequency of fc = 34 Hz was applied for the synthetic and unsteady jets.
The time-averaged normalized streamwise velocity contour and streamlines in the symmetry plane (z = 0) of the three actuated flows are presented in Figure 12. Compared with the baseline flow, the streamlines in the actuated cases deviate from the horizontal plane, which is clearly observed with the steady blowing jet (Figure 12a) and the unsteady jet (Figure 12c). In contrast, the streamlines in the synthetic jet case are not significantly inclined (Figure 12b). The deviation of the streamlines in the actuated cases is explained by the introduction of momentum from the control jets, which then interact with the separated flow from all rear edges of the model and deviate the streamlines. This introduced momentum also affects the recirculation zones in the near-wake region, in which the lower recirculation is displaced away from the rear surface of the model, leading to an asymmetrical near-wake structure (Figure 12a,c). The more intensive influence of the control jet on the lower vortex than on the upper vortex seems to be due to the interaction with the complex flow derived from the underbody of the model. On the contrary, the structure of the recirculation zones in the case using a synthetic jet displayed an insignificant difference compared to baseline flow without a control device (Figure 12b). In addition, Figure 12a also shows that the recirculations become smaller when a steady blowing jet is used, which leads to a considerable reduction in the aerodynamic drag force obtained on the Ahmed model.
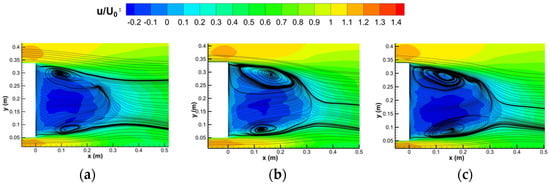
Figure 12.
Time-averaged streamlines behind of model, on the symmetry plane with different actuator types. (a) A steady blowing jet; (b) a synthetic jet; (c) an unsteady jet.
The numerical results shown in Figure 12 reveal that the application of the control jets has significantly modified the near-wake structure behind the model, especially in the cases with the steady blowing and unsteady jets. This seems to be the main source that leads to a reduction in vehicle aerodynamic drag.
The effect of active flow control devices on the turbulent kinetic energy (TKE) is presented in Figure 13. A maximum TKE value of 50 m2/s2 is obtained in the near-wake region in all cases, with and without a control flow device. The high value of TKE cor-responds to the recirculation zones behind the model. For all control cases, the maximum value of TKE is still located in the recirculation zones (Figure 13b–d), but the values of TKE are strongly reduced compared to the baseline flow case (Figure 13a). In particular, the high value of TKE completely disappeared at the upper part of the wake region when using a steady jet (Figure 13b). The high reduction in TKE value by applying the control flow devices demonstrates the effect of stabilization and the restriction of fluctuations in the flow field of these control methods.
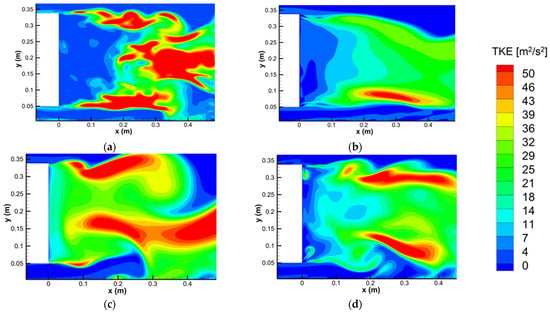
Figure 13.
Contour of TKE behind of model, on the symmetry plane with different actuator types. (a) Baseline flow; (b) a steady blowing jet; (c) a synthetic jet; (d) an unsteady jet.
The time-averaged drag coefficients obtained on the model with three distinct flow control techniques are presented in Table 1. The maximum drag coefficient reduction of ΔCD = 26.51% is achieved when using a steady blowing jet, while it is 8.03% and 1.2% for an unsteady and a synthetic jet, respectively.

Table 1.
Drag coefficient reduction with different actuator types.
Although the evolution of the aerodynamic drag coefficient obtained in Table 1 is relatively consistent with the analysis of the near-wake structure in Figure 12, the origin of the aerodynamic drag reduction has not been clearly explained. Onorato et al. [28] proposed another way for aerodynamic drag analysis, which is determined based on the parameters measured in the near-wake region. These parameters include total pressure loss, size of the wake section, and streamwise backward flow behind the model. Accordingly, the aerodynamic drag reduction involves decreasing the size of the wake section, reducing pressure loss and limiting streamwise backward flow.
Figure 12 shows that the streamlines with flow control devices deviated with respect to the separated lines, which results in a reduction in wake region size. This phenomenon can be clearly observed in the actuated case with a steady blowing jet (Figure 12a), and an unsteady jet (Figure 12c). The total pressure loss is investigated using the pressure coefficient Cp in the vicinity of the rear surface of the model. The vertical pressure coefficient distributions at position x/H = 0.1 in the symmetry plane (z = 0) of flow around the model with and without a control device are shown in Figure 14. In all actuated flows, the pressure coefficient Cp is increased compared with unactuated flow (Cpmin = −0.215 for baseline flow, Cpmin = −0.189 with a synthetic jet, Cpmin = −0.159 with a steady blowing jet, and Cpmin = −0.15 using an unsteady jet) which demonstrates that the application of control jets increases the static pressure directly behind the model, and reduces pressure loss. The pressure coefficients Cp obtained by using a steady blowing jet and an unsteady jet are quite similar, and larger than that when using the synthetic jet.
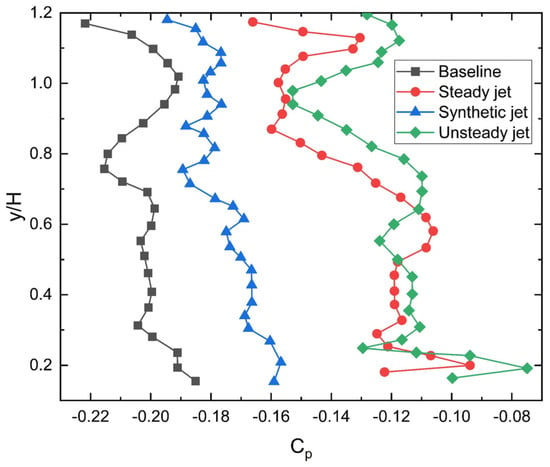
Figure 14.
Vertical pressure coefficient profiles measured at x/H = 0.1 in the symmetry plane, with different actuator types.
The backward flow in the near-wake region, another parameter affecting aerodynamic drag on the model, is evaluated based on the vertical streamwise velocity profiles with and without the control device at position x/H = 0.5 in the symmetry plane, as shown in Figure 15. The numerical results indicated that a decrease in the negative streamwise velocity is observed with a steady blowing jet (umin = 0.2U0) and with an unsteady jet (umin = 0.3U0). On the contrary, the vertical streamwise velocity distributions of the baseline flow and the flow using a synthetic jet are quite similar, in which the backward velocity has no significant change over the entire rear height of the model. This seems to be due to the existence of large recirculation zones in the wake region in both cases.
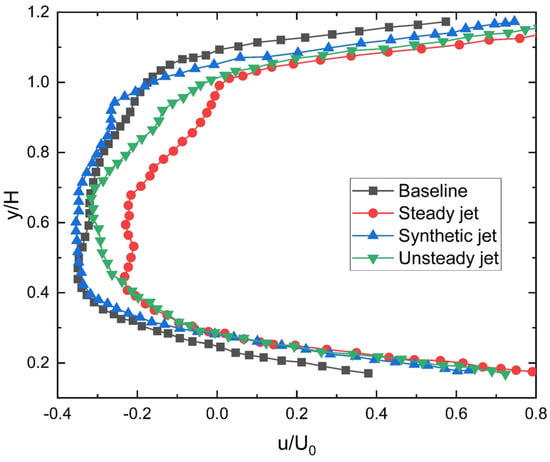
Figure 15.
Vertical normalized streamwise velocity profiles measured at x/H = 0.5 in the symmetry plane, with different actuator types.
The analysis of the streamlines, pressure coefficient distributions and backward velocity profiles in the wake region, as shown in Figure 12, Figure 13, Figure 14 and Figure 15, explained the evolution of drag coefficient CD on the model with different flow control techniques (Table 1). A maximum coefficient drag reduction is achieved when a steady blowing jet is applied, based on the reduction in the wake section area due to deviation of the streamlines, the recovery of static pressure, and the limitation of the backward flow behind the model. There is a considerable drag coefficient reduction when using an unsteady jet; however, the momentum introduced into the wake region is not as much as when using a steady blowing jet, leading to a restrained modification of the wake structure. Thus, an aerodynamic drag reduction is limited. In contrast, a negligible decrease in drag coefficient in the synthetic jet case demonstrated that the output momentum of this device is insufficient to modify the near-wake section behind the model. Experimental [29] and LES simulation results [19] on a simplified bus model also showed that no aerodynamic drag reduction was achieved with a synthetic jet actuator at low control frequencies.
The control effect is also visualized with small-scale vortices by Q-criterion with an iso surface of Q = 300,000 s−2 (Figure 16). Clearly, the control jets interact with the shear layer and significantly affect on the wake section. The vortices in the shear layer move further downstream and merge to form larger vortices. However, when control jets are applied, a delay in forming small-scale vortices occurs. Figure 16a shows that the steady blowing jets pushed the vortices on the shear layer away from the rear edges of the model, and the number of vortices is also significantly reduced. These vortices move into the wake region and enhance the mixing, thereby reducing the backward flow as observed in Figure 15. In addition, Figure 16a also reveals that a reduction in wake section size is obviously observed with the steady blowing jet. No evidence of the above phenomena is clearly shown when using the synthetic jet (Figure 16b) and the unsteady jet (Figure 16c); however, a displacement of the small-scale vortices on the shear layer away from the rear surface of the model remains to be determined.
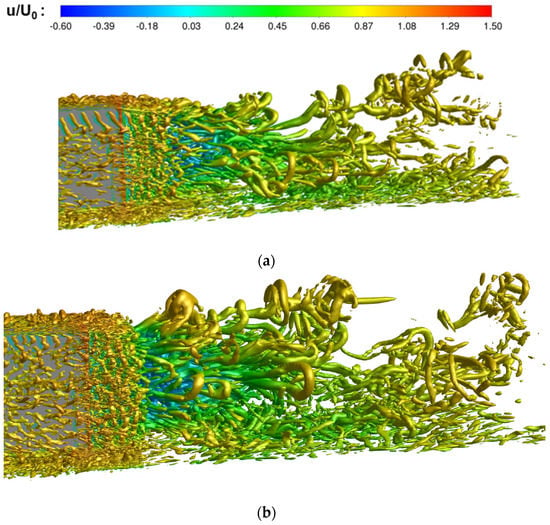
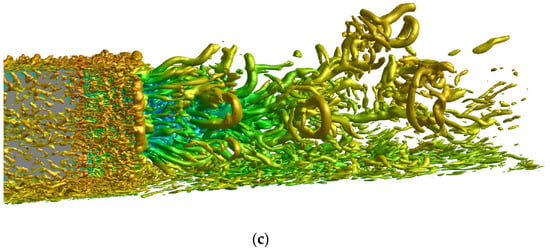
Figure 16.
The normalized streamwise contour at the iso-surface Q = 300,000 s−2 with different actuator types. (a) A steady blowing jet; (b) a synthetic jet; (c) an unsteady jet.
3.2.2. Influence of Jet Angle
The second computational effort was carried out to investigate the evolution of the aerodynamic drag coefficient as a function of jet angle with different flow control techniques. The jet angles are changed as β = 30°, 45°, 60° and 90°, respectively. The control frequency is kept at fc = 34 Hz for the synthetic and unsteady jets. The results obtained with jet angle of β = 45° have been presented in Section 3.2.1. The time-averaged drag coefficients at different jet angles are displayed in Table 2.

Table 2.
Drag coefficient reduction with different actuator types at various jet angles.
The results in Table 2 show that, in all actuated flow, the drag coefficient reduction achieved with jet angle of β = 90° is the smallest. The optimal jet angle of β = 45° is determined when steady blowing and unsteady jets are applied. This is consistent with the numerical results obtained from the work of Wassen [12] and Rouméas et al. [13]. In contrast, β = 60° is recognized as the optimal jet angle with a synthetic jet, and a drag reduction of 2.81% is achieved.
The time-averaged normalized velocity contours and the streamlines at various jet angles with all actuated cases are shown in Figure 17, Figure 18 and Figure 19. Figure 17a displays the presence of secondary small vortices located close to the rear surface of the model when a steady blowing jet with jet angle of β = 30° is applied, formed by the wall effect. The formation of these vortices seems to increase the drag coefficient obtained on the model. This phenomenon is not observed when using a synthetic jet (Figure 18a) and an unsteady jet (Figure 19a) at β = 30°, because of the weak interaction between the control jet and the rear surface of the model. In the cases of steady blowing and unsteady jets at the angle of β = 60°, the recirculation zones in the near-wake region are reduced (Figure 17b and Figure 19b), but their size is still larger than the one in the cases with jet angle β = 45° (Figure 12a,c). Meanwhile, the application of a synthetic jet with a jet angle β = 60° contributed to a significant reduction in the size of the recirculation zones and displaced them away from the rear surface of the model (Figure 18b), resulting in the largest drag reduction compared with the cases of the jet angle of 45° and 30°. In addition, for all actuated cases, the control jet at an angle of β = 90° insignificantly deviated the streamlines, leading a wide transversal wake section. Hence, the aerodynamic drag reduction is minimum compared to the one with different jet angles of a control device (Figure 17c, Figure 18c and Figure 19c).
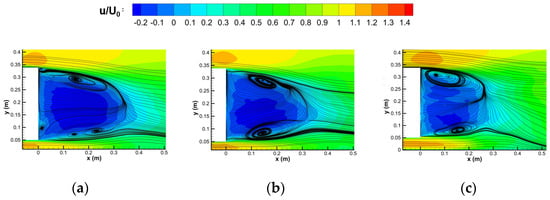
Figure 17.
Time-averaged streamlines in the behind of the model, on the symmetry plane with a steady blowing jet at different jet angles. (a) β = 30°; (b) β = 60°; (c) β = 90°.
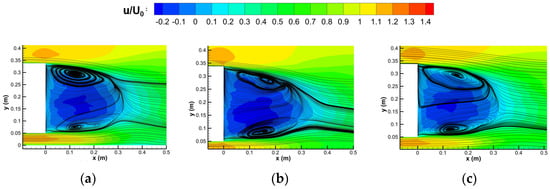
Figure 18.
Time-averaged streamlines in the behind of the model, on the symmetry plane with a synthetic jet at different jet angles. (a) β = 30°; (b) β = 60°; (c) β = 90°.
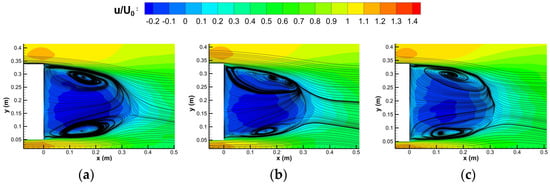
Figure 19.
Time-averaged streamlines in the behind of model, on symmetry plane with an unsteady jet at different jet angles. (a) β = 30°; (b) β = 60°; (c) β = 90°.
The normalized streamwise velocity profiles at the position x/H = 0.5 on the symmetry plane (z = 0) for various jet angles of actuated flows are plotted in Figure 20. The evolution of the negative streamwise velocities concerning the jet angles with different control techniques is consistent with the drag coefficients obtained in Table 2 and the streamlines analysis in Figure 17, Figure 18 and Figure 19. The most significant limitation of backward flow occurs at a jet angle of 45° with steady blowing and unsteady jets, whereas this happens at 60° when the synthetic jet is used.

Figure 20.
Vertical normalized streamwise velocity profiles measured at x/H = 0.5 in the symmetry plane with different actuator types at various jet angles. (a) A steady blowing jet; (b) a synthetic jet; (c) an unsteady jet.
3.2.3. Influence of Control Frequency
The final study was performed to evaluate the effect of the control frequency on the drag coefficient reduction in the actuated cases with synthetic and unsteady jets. The influence of the control frequency of fc = 68 Hz and 272 Hz on the flow structure was considered, while the flow characteristics with a control frequency of fc = 34 Hz have been presented in Section 3.2.1.
The evolution of the drag coefficient on the model concerning the control frequencies is shown in Table 3. It is clear that, in both flow control techniques, the drag coefficient reduction increases when high control frequency is applied (ΔCDmax = 5.62% with a synthetic jet at fc = 272 Hz and (ΔCDmax = 17.27% with an unsteady jet at fc = 272 Hz). A significant drag reduction of 8.73% was also found with the synthetic jet at the high control frequency of 400 Hz and jet velocity 75 m/s on the small-scale square-back Ahmed model [30]. This result can be explained through the analysis of the time-averaged streamlines (Figure 21 and Figure 22) and the normalized streamwise velocity profiles at position x/H = 0.5 on the symmetry plane (z = 0) (Figure 23). When a high control frequency is applied, the control jet deviated the streamlines, reducing the size of the near-wake region. In addition, the high introduced momentum decreased the size of the recirculation zones, while pushing them away from the rear surface of the model (Figure 21 and Figure 22). This leads to a limitation of negative streamwise velocity, with umin = −0.2U0 for the synthetic jet and umin = −0.19U0 for the unsteady jet at control frequency of fc = 272 Hz, as shown in Figure 23.

Table 3.
Drag coefficient reduction with different actuator types at various control frequencies.
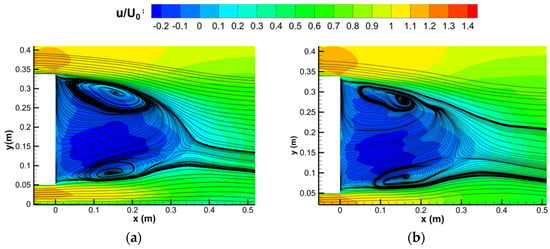
Figure 21.
Time-averaged streamlines in the behind of the model, on the symmetry plane with a synthetic jet at different control frequencies. (a) fc = 68 Hz; (b) fc = 272 Hz.
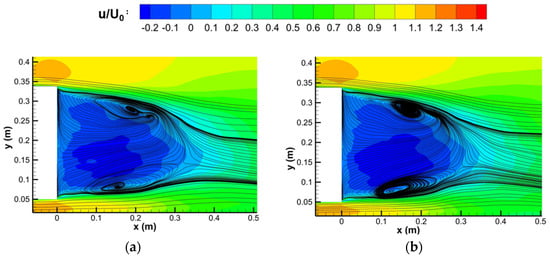
Figure 22.
Time-averaged streamlines in the behind of the model, on the symmetry plane with an unsteady jet at different control frequencies. (a) fc = 34 Hz; (b) fc = 68 Hz; fc = 272 Hz.
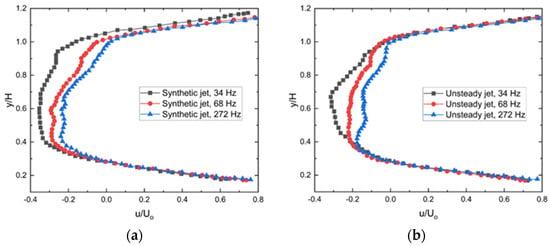
Figure 23.
Vertical normalized streamwise velocity profiles measured at x/H = 0.5 in the symmetry plane with different actuator types at various control frequencies. (a) A synthetic jet; (b) an unsteady jet.
A spectral analysis was performed to better investigate the control frequency effect when using the synthetic and unsteady jet actuators. Figure 24a and Figure 25a show the evolution of the drag coefficient as function of flow unit t* (t*= t.Uo/L) with different control frequencies for synthetic and unsteady jets, respectively. The power density spectra (PSD) of the drag coefficient signal in these cases are calculated and plotted in Figure 24b and Figure 25b. The drag coefficient signal in Figure 24a and Figure 25a shows that the high control frequency leads to a significant fluctuation in the drag coefficient; however, the time-averaged drag coefficient still decreases as the control frequency increases. When the synthetic jet is applied, analysis of PSD at fc = 34 Hz and fc = 68 Hz (Figure 24b) reveals that the dominant frequency coincides with the control frequency; however, there is also the existence of a secondary peak frequency. In contrast, at high frequency (fc = 272 Hz), only a distinct peak at the control frequency was observed. In the case of the unsteady jet, there is no secondary frequency peak at all control frequencies, as shown in Figure 25b. Since the unsteady jet oscillates only for a half-cycle, and thus the dominant frequency defined in Figure 25b is twice the control frequency.
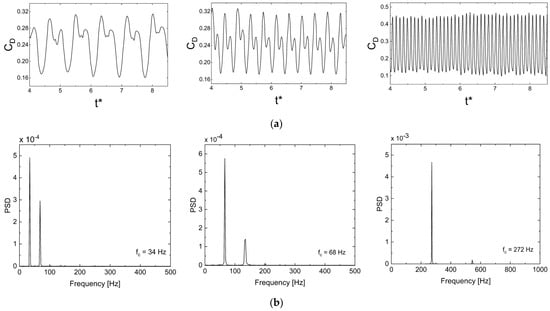
Figure 24.
Spectral analysis of drag coefficient with a synthetic jet at different control frequencies. (a) CD signal; (b) PSD of CD.


Figure 25.
Spectral analysis of drag coefficient with an unsteady jet at different control frequencies. (a) CD signal; (b) PSD of CD.
Finally, the development of small-scale vortices behind the vehicle at different control frequencies is analyzed based on the visualization using the Q-criterion at a level of 300,000 s−2. Figure 26 shows that the synthetic jet with a high control frequency tends to push the vortices in the shear layer away from the rear edges of the vehicle when compared to the control frequency fc = 34 Hz in Figure 16b. In particular, at the highest control frequency fc = 272 Hz, a significant reduction in both the size and number of vortices in the shear layer occurred (Figure 26b), leading to their merge to form larger-scale vortices being limited, and thus the size of rear-wake section is reduced. Similar phenomena are also pointed out when using an unsteady jet with high control frequencies (Figure 27).
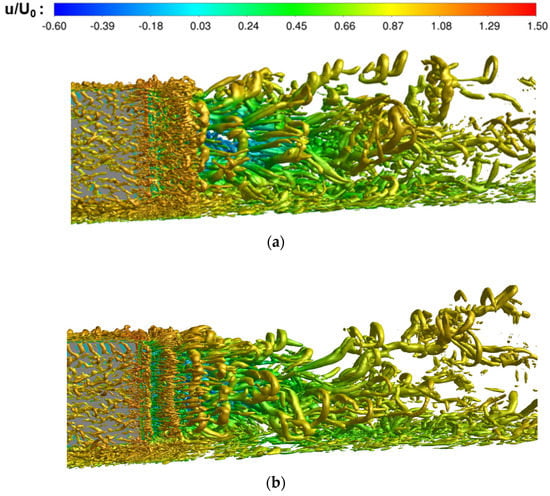
Figure 26.
The normalized streamwise contour at the iso-surface Q = 300,000 s−2 with the synthetic jet at different control frequencies. (a) fc = 68 Hz; (b) fc = 272 Hz.
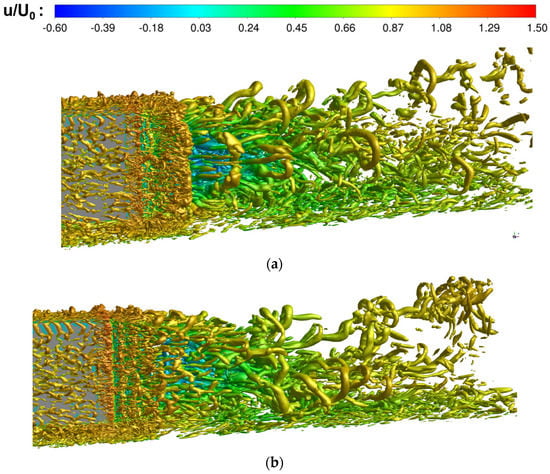
Figure 27.
The normalized streamwise contour at the iso-surface Q = 300,000 s−2 with the unsteady jet at different control frequencies. (a) fc = 68 Hz; (b) fc = 272 Hz.
4. Control Efficiency
The results in the above section have shown that both the steady blowing and unsteady jet methods are promising methods for reducing aerodynamic drag on the square-back Ahmed model. The maximum drag reduction of 26.51% is achieved with a steady blowing jet at an angle of 45°, while the unsteady jet at an angle of 45° and a control frequency of 272 Hz results in a drag reduction of 17.27%. However, both of these methods require an additional energy to produce the control jets. Therefore, a simple formula is proposed to evaluate the energy efficiency of flow control methods. The powers required to overcome the aerodynamic drag of the model in unactuated and actuated cases are given by Equations (5) and (6), respectively.
The power required for the control devices is described as:
where with the steady blowing jet and with the unsteady jet.
The control energy efficiency is defined as follows:
From Equation (8), the energy efficiency of the steady jet method at a jet angle of 45° and an unsteady jet at control frequency of 272 Hz are 12.94% and 13.77%, respectively. This demonstrates that the unsteady jet method is more energy efficient, as it requires less external energy.
5. Conclusions
WMLES simulations based on a 3D finite element solver were performed on a square-back Ahmed model with and without flow control devices. Three active flow control techniques were applied: steady blowing, synthetic, and unsteady jets. The influence of jet angle and control frequency was also considered. A detailed analysis of the near-wake structure was performed. Some conclusions are summarized as follows:
- The application of control jets deviates the streamlines behind the model, and thus reduces the size of the near-wake section. In addition, the momentum from the control jets introduces the wake region, shrinks the recirculation zones, and then pushes them away from the surface rear of the model. This leads to a limitation of backward flow and static pressure recovery on the back surface of the model.
- The largest drag coefficient reduction of ΔCD = 26.51% is achieved using a steady blowing jet at jet angle of β = 45°. When using a synthetic jet, the drag reduction is negligible with all operating conditions, except for the high control frequency case (ΔCD = 5.62% at fc = 272 Hz). Meanwhile, a significant drag reduction is observed with an unsteady jet (ΔCD = 8.03% at low control frequency fc = 34 Hz and ΔCD = 17.27% at high control frequency fc = 272 Hz, with optimal jet angle β = 45°). The application of a steady blowing jet helps to achieve an impressive drag reduction; however, a large energy input is also required. Therefore, the unsteady jet can be considered as a promising candidate for active flow control method when considering the control energy efficiency.
- The optimal jet angle β = 45° is determined for steady blowing and unsteady jets, while jet angle β = 60° is the optimal case with synthetic jets. Due to the influence of the interaction between the control jet and the rear surface of the model, the drag coefficient reduction at jet angle β = 30° in all control cases is the smallest.
- The aerodynamic drag coefficient of the model is most reduced when synthetic and unsteady jets with high control frequencies are used. These control jets interact with the shear layer and delay the formation of small-scale vortices in this layer. The number and size of vortices in the shear layer are also significantly reduced when a high-frequency control jet is applied.
Author Contributions
Conceptualization, T.-L.P.; methodology, T.-L.P. and Q.T.P.; software, T.-L.P. and T.T.N.; validation, T.-L.P.; formal analysis, T.-L.P. and T.T.N.; investigation, T.-L.P.; resources, T.-L.P. and Q.T.P.; data curation, T.-L.P. and T.K.L.N.; writing—original draft preparation, T.-L.P.; writing—review and editing, Q.T.P., T.T.N. and T.K.L.N.; visualization, T.-L.P. and T.K.L.N.; supervision, T.-L.P.; project administration, T.-L.P.; funding acquisition, T.-L.P. All authors have read and agreed to the published version of the manuscript.
Funding
This research was funded by the Ministry of Education and Training, grant number B2020-DNA-03.
Institutional Review Board Statement
Not applicable.
Informed Consent Statement
Not applicable.
Data Availability Statement
Not applicable.
Conflicts of Interest
The authors declare no conflict of interest. The funders had no role in the design of the study; in the collection, analyses, or interpretation of data; in the writing of the manuscript; or in the decision to publish the results.
References
- Hucho, W.H.; Sovran, G. Aerodynamics of road vehicles. Annu. Rev. Fluid Mech. 1993, 25, 485–537. [Google Scholar] [CrossRef]
- Ahmed, S.R.; Ramm, G.; Faltin, G. Some Salient Features of The Time-Averaged Ground Vehicle Wake. SAE Tech. Pap. 1984, 3, 473–503. [Google Scholar] [CrossRef]
- Beaudoin, J.F.; Aider, J.L. Drag and lift reduction of a 3D bluff body using flaps. Exp. Fluids 2008, 44, 491–501. [Google Scholar] [CrossRef]
- Pujals, G.; Depardon, S.; Cossu, C. Drag reduction of a 3D bluff body using coherent streamwise streaks. Exp. Fluids 2010, 49, 1085–1094. [Google Scholar] [CrossRef]
- Krajnović, S. Large eddy simulation exploration of passive flow control around an Ahmed body. J. Fluids Eng. Trans. ASME 2014, 136, 121103. [Google Scholar] [CrossRef]
- Gilliéron, P.; Kourta, A. Aerodynamic drag reduction by vertical splitter plates. Exp. Fluids 2009, 48, 1–16. [Google Scholar] [CrossRef]
- Salati, L.; Cheli, F.; Schito, P. Heavy Truck Drag Reduction Obtained from Devices Installed on the Trailer. SAE Int. J. Commer. Veh. 2015, 8, 747–760. [Google Scholar] [CrossRef]
- Karimi, S.; Zargar, A.; Mani, M.; Hemmati, A. The Effect of Single Dielectric Barrier Discharge Actuators in Reducing Drag on an Ahmed Body. Fluids 2020, 5, 244. [Google Scholar] [CrossRef]
- Kazemi, M.; Ghanooni, P.; Mani, M.; Saeedi, M. Drag reduction of 3D bluff body using SDBD plasma actuators. Proc IMechE. Part D J. Automob. Eng. 2020, 235, 1461–1480. [Google Scholar] [CrossRef]
- Shadmani, S.; Nainiyan, S.M.; Mirzaei, M.; Ghasemiasl, R.; Pouryoussefi, S.G. Experimental Investigation of Flow Control over an Ahmed Body using DBD Plasma Actuator. J. Appl. Fluid Mech. 2018, 11, 1267–1276. [Google Scholar] [CrossRef]
- Englar, R.J. Improved pneumatic aerodynamics for drag reduction, fuel economy, safety and stability increase for heavy vehicles. In Proceedings of the SAE 2005 Commercial Vehicle Engineering, Congress and Exhibition, SAE Paper 2005-01-3627, Chicago, IL, USA, 1 November 2005. [Google Scholar] [CrossRef]
- Wassen, E.; Eichinger, S.; Thiele, F. Simulation of active drag reduction for a square-back vehicle. Notes Numer. Fluid Mech. Multidiscip. 2010, 108, 241–255. [Google Scholar] [CrossRef]
- Rouméas, M.; Gilliéron, P.; Kourta, A. Analysis and control of the near-wake flow over a square-back geometry. Comput. Fluids 2009, 38, 60–70. [Google Scholar] [CrossRef]
- McNally, J.; Fernandez, E.; Robertson, G.; Kumar, R.; Taira, K.; Alvi, F.; Yamaguchi, Y.; Murayama, K. Drag reduction on a flat-back ground vehicle with active flow control. J. Wind Eng. Ind. Aerodyn. 2015, 145, 292–303. [Google Scholar] [CrossRef]
- Littlewood, R.P.; Passmore, M.A. Aerodynamic drag reduction of a simplified squareback vehicle using steady blowing. Exp. Fluids 2012, 53, 519–529. [Google Scholar] [CrossRef]
- Collis, S.S.; Joslin, R.D.; Seifert, A.; Theofilis, V. Issues in active flow control: Theory, control, simulation, and experiment. Prog. Aerosp. Sci. 2004, 40, 237–289. [Google Scholar] [CrossRef]
- Park, H.; Cho, J.H.; Lee, J.D.; Lee, H.; Kim, K.H. Experimental study on synthetic jet array for aerodynamic drag reduction of a simplified car. J. Mech. Sci. Technol. 2013, 27, 3721–3731. [Google Scholar] [CrossRef]
- Tounsi, N.; Mestiri, R.; Keirsbulck, L.; Oualli, H.; Hanchi, S.; Aloui, F. Experimental Study of Flow Control on Bluff Body using Piezolectric Actuators. J. Appl. Fluid Mech. 2016, 9, 1735–3645. [Google Scholar] [CrossRef]
- Krajnović, S.; Fernandes, J. Numerical simulation of the flow around a simplified vehicle model with active flow control. Int. J. Heat Fluid Flow 2011, 32, 192–200. [Google Scholar] [CrossRef]
- El-Alti, M.; Kjellgren, P.; Davidson, L. On the numerical modeling of active flow control for aerodynamics applications and its impact on the pressure field. ERCOFTAC Ser. 2015, 20, 695–700. [Google Scholar] [CrossRef]
- El-Alti, M.; Kjellgren, P.; Davidson, L. Drag Reduction for Trucks by Active Flow Control of the Wake Behind the Trailer. In Proceedings of the 6th International Symposium on Turbulence, Heat and Mass Transfer, Rome, Italy, 14 September 2009. [Google Scholar] [CrossRef]
- El-Alti, M.; Kjellgren, P.; Davidson, L. Shape optimization and active flow control of truck-trailers for improved aerodynamics using large-eddy simulation and response surfaces. ERCOFTAC Ser. 2015, 20, 405–410. [Google Scholar] [CrossRef]
- Wang, B.; Yang, Z.; Zhu, H. Drag reduction on the 25 Ahmed body using a new zero-net-mass-flux flow control method. Theor. Comput. Fluid Dyn. 2019, 33, 411–431. [Google Scholar] [CrossRef]
- Wang, B.; Yang, Z.; Zhu, H. Active flow control on the 25 Ahmed body using a new unsteady jet. Int. J. Heat Fluid Flow 2019, 79, 108459–108472. [Google Scholar] [CrossRef]
- Ansys. Engineering Simulation Software. Available online: https://www.ansys.com/ (accessed on 11 November 2022).
- Shur, M.L.; Spalart, P.R.; Strelets, M.K.; Travin, A.K. A hybrid RANS-LES approach with delayed-DES and wall-modelled LES capabilities. Int. J. Heat Fluid Flow 2008, 29, 1638–1649. [Google Scholar] [CrossRef]
- Hunt, J.C.R.; Wray, A.A.; Moin, P.; Wray, A.A.; Moin, P. Eddies, streams, and convergence zones in turbulent flows. Stud. Turbul. Using Numer. Simul. Databases 1988, 1, 193–208. [Google Scholar]
- Onorato, M.; Costelli, A.F.; Garrone, A. Drag Measurement Through Wake Analysis. In Proceedings of the SAE SP-569, International congress and exposition, Detroit, MI, USA, 27 February 1984. [Google Scholar] [CrossRef]
- Henning, L.; Pastoor, M.; King, R.; Noack, B.R.; Tadmor, G. Feedback Control Applied to the Bluff Body Wake. Notes Numer. Fluid Mech. Multidiscip 2006, 95, 369–390. [Google Scholar] [CrossRef]
- Eulalie, Y.; Gilotte, P.; Mortazavi, I. Numerical study of flow control strategies for a simplified square back ground vehicle. Fluid Dyn. Res. 2017, 49, 35502–35527. [Google Scholar] [CrossRef]
Disclaimer/Publisher’s Note: The statements, opinions and data contained in all publications are solely those of the individual author(s) and contributor(s) and not of MDPI and/or the editor(s). MDPI and/or the editor(s) disclaim responsibility for any injury to people or property resulting from any ideas, methods, instructions or products referred to in the content. |
© 2022 by the authors. Licensee MDPI, Basel, Switzerland. This article is an open access article distributed under the terms and conditions of the Creative Commons Attribution (CC BY) license (https://creativecommons.org/licenses/by/4.0/).