Abstract
Background: Few studies have focused on predicting the overall survival (OS) of patients affected by SARS-CoV-2 (i.e., COVID-19) using radiomic features (RFs) extracted from computer tomography (CT) images. Reconstruction of CT scans might potentially affect the values of RFs. Methods: Out of 435 patients, 239 had the scans reconstructed with a single modality, and hence, were used for training/testing, and 196 were reconstructed with two modalities were used as validation to evaluate RFs robustness to reconstruction. During training, the dataset was split into train/test using a 70/30 proportion, randomizing the procedure 100 times to obtain 100 different models. In all cases, RFs were normalized using the z-score and then given as input into a Cox proportional-hazards model regularized with the Least Absolute Shrinkage and Selection Operator (LASSO-Cox), used for feature selection and developing a robust model. The RFs retained multiple times in the models were also included in a final LASSO-Cox for developing the predictive model. Thus, we conducted sensitivity analysis increasing the number of retained RFs with an occurrence cut-off from 11% to 60%. The Bayesian information criterion (BIC) was used to identify the cut-off to build the optimal model. Results: The best BIC value indicated 45% as the optimal occurrence cut-off, resulting in five RFs used for generating the final LASSO-Cox. All the Kaplan-Meier curves of training and validation datasets were statistically significant in identifying patients with good and poor prognoses, irrespective of CT reconstruction. Conclusions: The final LASSO-Cox model maintained its predictive ability for predicting the OS in COVID-19 patients irrespective of CT reconstruction algorithms.
1. Introduction
The world has been battling SARS-CoV-2 (severe acute respiratory syndrome-corona virus) for the past couple of years. The reverse transcription-polymerase chain reaction (rt-PCR) provides the most reliable way to verify patient infection, though it cannot assess the severity of its condition. Being a pulmonary condition, the use of chest X-ray or CT imaging to perform damage evaluation and illness diagnosis has been established as standard practice. One of the advantages of radiological imaging is its ability to quantify healthy lung parenchyma compared to emphysema, ground-glass opacity, and consolidation [1]. Moreover, CT imaging enables extracting a broader range of qualitative and quantitative information, potentially improving the development of predictive models.
However, the use of qualitative findings obtained upon radiological inspection of the images has been proven inefficient and disappointing in the prediction of patient prognosis, thus leading to a consensus of scientific societies (e.g., SIRM) on supporting research through the use of artificial intelligence (AI) as a predictive and prognostic decision support system, especially in hospitalized patients and those admitted to intensive care [2].
AI-based solutions have been implemented in several medical sectors, including image analysis [3,4]. In this landscape, widespread interest has developed towards using radiomics, which is the extraction of quantitative measurements from radiological images [5]. Indeed, radiomic feature (RF) analysis has proved that its application can provide an objective insight into the pathophysiology of tissues, such as inhomogeneities in the gray level distribution within lesions, otherwise not quantifiable when relying exclusively on human perception [6].
In patients affected by SARS-CoV-2, radiomic-based tools have been developed to address different clinical objectives and predict various endpoints of interest, including the identification of patients in severe and critical conditions [7], the prediction of mortality disregarding the time to event [8] and, more rarely, the prediction of high-/low-risk subgroups obtained from multivariate survival analysis methods [9,10]. In this context, a recent meta-analysis showed that CT-based RF models could successfully differentiate COVID-19 from other viral pneumonia, with a pooled sensitivity of 0.885 (95% CI: 0.818–0.929) and a pooled specificity of 0.811 (95% CI: 0.667–0.902) [11]. These analyses have been carried out relying primarily on clinical variables (i.e., comorbidities and laboratory findings) alone or in conjunction with radiomic variables extracted from CT scans or X-ray projections. In most studies, the investigated cohort comprises a small number of patients, often of a specific ethnic group, and with a relatively short follow-up.
A critical point is that the use of RFs in the analysis pipeline works best when focusing on the texture of the specific VOIs. However, manual delineation represents one of the most limiting factors in a busy clinical department, being a complex, time-consuming, and labor-intensive task [12]. For this reason, this work employed semi-automatic segmentation methods by relying on SOPHiA DDM for lung segmentation and radiomic extraction [8]. A layer of resistance to the application of radiomic analysis into clinical practice is added by the limited reproducibility of RFs due to acquisition and reconstruction parameters that must be considered to obtain stable and reliable features [13].
For the reasons mentioned above, this study investigates the prognostic role of a model based on RFs extracted from semi-automatic segmented VOIs using CT images and a dedicated COVID-19 tool in a large cohort of patients. The secondary aim was to assess the robustness of the model on a CT dataset reconstructed using two different slice thicknesses and ad-hoc kernels, clinically adopted in our institute for improving the visualization of mediastinum and parenchyma.
2. Materials and Methods
2.1. Patient Cohort
The patient cohort included 435 COVID-19 positive patients hospitalized between February 2020 and May 2021. After a positive RT-PCR swab, all patients underwent a chest CT scan during the first two days of hospitalization with at least one reconstruction optimized for visualization of the parenchyma (Par-CT) with a slice thickness of 1 mm. In addition, 196 out of 435 CTs were reconstructed by radiologist physicians with a different reconstruction protocol optimized for mediastinum (Med-CT), which had a 2 mm slice thickness.
From a practical standpoint, parenchyma reconstruction is used to look for small nodules with very high contrast, and, to do so, the reconstruction allows some noise to achieve the best resolution possible. Mediastinum reconstruction is used in the lung, as well as other regions, to look for large lesions, but with low contrast. As such, the mediastinum reconstruction compromises a worse spatial resolution for a better display of contrast; qualitatively, “parenchyma” images are coarser and noisier, while “mediastinum” images appear smoother.
The CT scans were obtained using different CT scanners: Ingenuity CT (Philips Medical Systems, Cleveland, OH, USA) for 56% of patients; a Lightspeed VCT (General Electric Healthcare, Chicago, IL, USA) for 41% of patients; and an ICT SP (Philips Medical Systems, Cleveland, OH, USA) for 3% of patients. Among the datasets, high homogeneity was observed in terms of kilo-Volt Peak (kVp): most of the CTs (91% of patients) were acquired with 120 kV values, while only 15 patients (3%) were acquired with 140 kV and 5% were acquired with 100 kV, according to patient characteristics. Notably, our institute set and harmonized the acquisition protocols to obtain comparable results in terms of image quality and dose to patients (i.e., computed tomography dose index—CTDI).
2.2. Image Segmentation and Feature Extraction
The whole set of 435 scans was uploaded to the CE/FDA-marked software SOPHiA DDM for radiomics, which contains a COVID-dedicated tool which allows semi-automatic segmentation of lungs and damaged volume, as well as RFs extraction from the segmented VOI. The segmentation algorithms implemented in SOPHiA DDM are based on region-gro techniques and thresholding methods, and require manual seed selection to start the lung segmentation process. Inside SOPHiA software, the damaged volume was quantified by counting voxels with values in the range [−740, −400] Hounsfield Units (HU). At the same time, the vascular component was identified by voxel in the range [−400, 1000] HU. These ranges are the standard values for software segmentation operations. The number of RFs initially extracted was 180 per scan, reduced to 175 by removing the features inherent to the discretization process, which resulted in constant variables across images. The RFs have been extracted with the software as a black box, but it has been shown [14] that SOPHiA DDM has good IBSI compliance compared with other commercially available or free software. Similarly, the 196 available Med-CT scans were imported into SOPHiA DDM for damaged lung VOIs segmentation and RFs extraction. The RFs were separately extracted from the two identified volumes (i.e., damaged volumes and lungs), but only those obtained from the lungs were used for model building.
2.3. Predictive Model Building
The study design for constructing a predictive model based on RFs is reported in Figure 1 and detailed in the following sections.
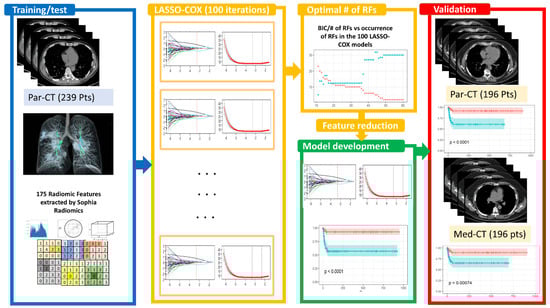
Figure 1.
Study design relies on the following steps: [1] identification of a dataset of 239 patients with high-resolution CT (Par-CT), grouped into training and test sets following a stratified 70/30 split, iterating the process 100 times. These datasets were used for the 100 LASSO-Cox feature selection. The optimal number of RFs for inclusion in developing the LASSO-Cox model was determined using the BIC values. The final model was validated using a dataset of 196 having high and standard CT reconstruction (Par-CT and Med-CT, respectively). In all the datasets, 175 RFs were extracted using SOPHiA DDM.
2.3.1. Feature Selection
The training/test dataset was composed of 239 patients having only parenchyma reconstructed CT scans. The 175 RFs obtained from each Par-CT scan were first scaled using the z-score and then given as input into a Cox proportional-hazards model regularized using the Least Absolute Shrinkage and Selection Operator (LASSO-Cox).
The Cox proportional-hazards model is widely used in survival analysis to study time-to-event data presenting censored occurrences and covariates that may change over time. The LASSO-Cox was chosen to predict the patient’s OS. The Par-CT dataset was split into training and test sets following a stratified 70/30 split. The best hyperparameter, in particular, the penalty parameter, (λ) choice were obtained with glmnet cross-validation function to solve the minimization problem of the partial likelihood. The final feature selection was performed with the glmnet function specifying the previously estimated λ value.
The Lasso regularization method was chosen because it shrinks to exactly zero the coefficients relative to the superfluous features compared to other approaches (e.g., Ridge or elasticNet) which make the parameters small but never zero. Hence, this regularization phase also works as a feature selection step. These operations were repeated 100 times by changing the seed of the random process leading the training and test sets while keeping the stratified nature of the groups. A score of frequency was calculated for the LASSO-Cox selected features, evaluating the number of times that each feature appeared in the built models to guarantee the robustness of the feature selection phase (named occurrence rate). Sensitivity analysis was conducted by increasing the cut-off of the number of retained features which resulted from each of the 100 developed models. The occurrence cut-off of each variable was regularly increased in steps from 10% to 60%. The number of RFs versus the occurrence cut-offs were determined, while the Bayesian information criterion (BIC) versus the occurrence cut-offs was used to identify the optimal model. The significance of the prediction was assessed through the p-value associated with the Kaplan-Meier survival curves obtained from the scores given as output by the optimal model determined following the procedure mentioned above. The Hazard Ratio (HR) was computed by taking the exponential of the coefficients associated with each RF. Values greater than one indicate that higher values in the feature are associated with increases in the risk of death, whereas values smaller than one indicate that higher values tend to indicate lower risks.
The analysis was performed in R Studio version 4.0.2.
2.3.2. Bayesian Information Criterion (BIC)
The Bayesian information criterion is a well-known general approach to model selection that favors more parsimonious models (i.e., with fewer features) over more complex models. This is obtained by adding a penalty based on the number of parameters being estimated in the model [15,16]. Operatively, the Bayesian information criterion, also known as Schwarz’s Bayesian criterion (SBC), can be computed for one or several fitted model objects, for which a log-likelihood value is calculated using the following formula:
where represents the number of RFs, is the likelihood of the model, and is the number of observations in the fitted model. In our case, using the best lambda obtained from cross validation, the best BIC value (i.e., the minimum) was obtained with = 5 and = 239, corresponding to the number of features in the fitted model trained on the entire Par-CT dataset, respectively.
BIC is a variant of AIC with a stronger penalty for including additional variables to the model, it tries to find a parsimonious model that is more likely to be the “truth”. The smaller the value that is considered, the better the BIC. According to [16] guidelines, if the differences in BICs between compared models are 0–2, 2–6, 6–10, or greater than 10, then the evidence in favor of the model with the smallest BIC can be considered ‘weak’, ‘positive’, ‘strong’, or ‘very strong’, respectively.
2.3.3. ICC Analysis
Intraclass Correlation Coefficient (ICC) two-way mixed-effects single-rater model approach (shortly ICC3) was used to determine if identified RFs—by using the LASSO-Cox-based pipeline described in Section 2.3.1—were stable (in terms of concordance and robustness) in both the Par-CT and Med-CT datasets, for the investigated patients. Calculation of the ICC metric was performed using the irr package. Conventionally, it is considered the agreement has been divided into four levels: poor for ICC3 < 0.5, moderate for 0.5 ≤ ICC3 ≤ 0.75, good for 0.75 < ICC3 < 0.90 and excellent for ICC > 0.9 [17].
2.3.4. Model Evaluation through Survival Curves
The RFs and the coefficients obtained via LASSO-Cox-based feature selection were used to predict the patients’ OS in both the Par-CT and Med-CT validation databases (including only patients having both the available clinical reconstructions). Thus, it was possible to test the impact of the OS model versus the CT reconstruction approach. The models’ ability to divide patients with good and poor prognosis was assessed using Kaplan-Meyer curves and long-rank tests. The level for statistical significance after a Bonferroni correction for multiple testing was chosen as p-value < 0.001 (i.e., 0.05/50) conducted on the 50 compared models based on an occurrence rate from 10% to 60%.
2.3.5. Area under Curve (AUC)
To evaluate the performance of the LASSO-Cox approach, receiver operating characteristic (ROC) curves were calculated using the predicted values by the model determined on the validation databases (i.e., Par-CT and Med-CT) with respect to the patient death.
3. Results
3.1. Patient Cohort
The surviving patients (357 of out 435, corresponding to 82% of the cohort) were later re-evaluated, and the median [range] follow-up for the cohort was 45 days [1, 948].
In this study, the subset of patients with only parenchyma reconstruction (239 patients) was used to train/test the model based only on radiomic features. The training/test population comprehended a total of 154 out of 239 (64%) males and had a median age [range] of 69 years [21, 99], while the validation population was composed of a total of 130 out of 196 (66%) males and a median age [range] of 68 years [23, 98].
A comparison of the survival for the training and test population was conducted to assess whether there were statistical differences in population survival. The Kaplan-Meyer curve indicated no statistical difference between the two groups (p-value = 0.49).
3.2. Image Reconstruction and VOI Delineation Results
The comparison between Par-CT and Med-CT images for a representative patient of the validation dataset from the SOPHIA segmentation process, as can be seen in the respective Figure 2a,b, were highly influenced by the type of reconstruction, leading to differences in volumes of the estimated VOIs.
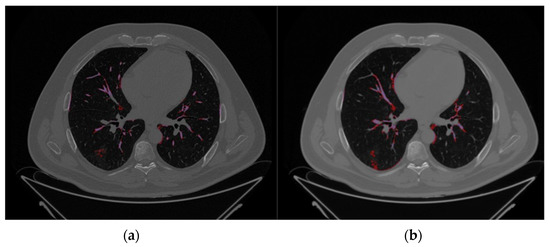
Figure 2.
Axial CT images of the same representative patient using the same slice height, extracted from the validation databases, i.e., (a) Par-CT and (b) Med-CT. The purple and red zones are those identified by SOPHiA DDM as COVID-19 damage (hazy) and high density (Vascular tree), respectively.
3.3. LASSO-Cox for Feature Selection
The features with non-zero coefficients in the 100 LASSO-Cox-based models predicting the OS, i.e., non-trivially contributing to the models, are reported in Supplementary Material, Table S1. Sensitivity analysis of the occurrence cut-off, conducted on the training dataset, revealed that the p-values obtained from the long-rank test comparing patients with the predicted score higher or lower than the median predicted value (mtraining) increased with the occurrence cut-off. At the same time, as expected, the number of RFs decreased, as reported in Figure 3a.
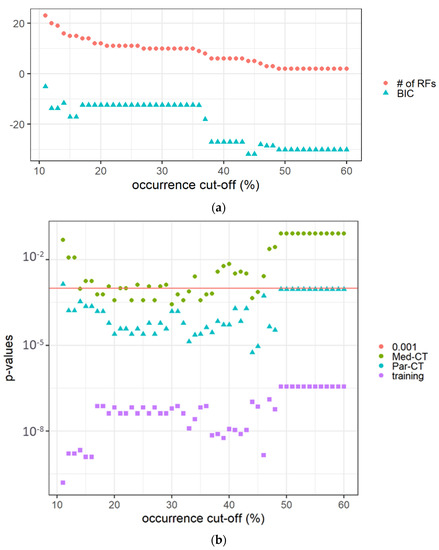
Figure 3.
(a) The number of RFs and the BIC value versus the occurrence cut-off (expressed in %) in the 100 calculated LASSO-Cox models. (b) The p-values of Kaplan-Meier curves comparing patients in the training and verification datasets (i.e., Med-CT and Par-CT) with a score higher or lower than the cut-off determined on the training dataset (mtraining). The red horizontal line indicates p = 0.001.
The difference in BICs between the adjacent models to the one with the smallest BIC was between two and six, indicating ‘positive’ evidence in favor of the identified optimal model. The calculated LASSO-Cox-based model using the high occurrence RFs was able to predict the OS of the validation datasets using the mtraining as cut-off and the same RFs, but extracted from Par-CT and Med-CT images. The best BIC value was associated with an occurrence rate of 44–45% selecting five prognostic RFs (i.e., area density enclosing ellipsoid, cluster shade, intensity histogram quartile coefficient of dispersion, minimum value, normalized zone distance non-uniformity).
The Kaplan-Meyer curves generated from the LASSO-Cox model were obtained with an occurrence rate higher than 45% in all the datasets and using mtraining as the cut-off are shown in Figure 4a–c for the training, Par-CT, and Med-CT validation sets, respectively. The behavior reported in Figure 4a–c was observed in the models obtained with all the cut-offs, except for those with an occurrence cut-off higher than 49%, since they retained only two RFs to be included in the LASSO-Cox models.
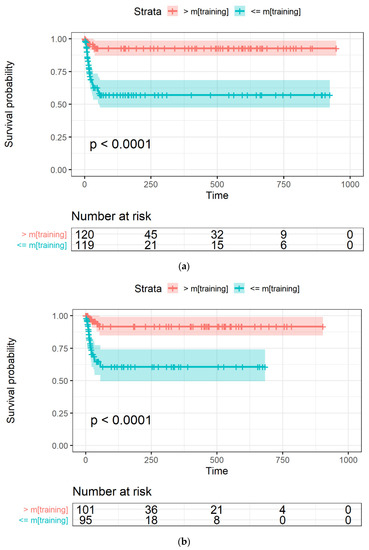
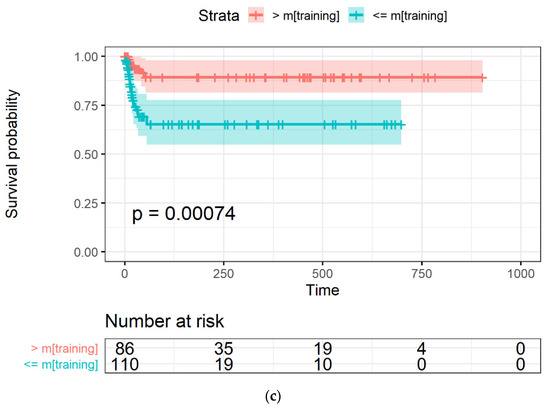
Figure 4.
The Kaplan-Meier curves of OS versus time, expressed in days, in (a) training, and the two validation datasets, i.e., (b) Par-CT and (c) Med-CT. Patients are grouped using the LASSO-Cox-based score higher or lower that the median value calculated using the training dataset.
Table 1 reports the values of the coefficients associated to each of the RFs indentified in the final LASSO-Cox model.

Table 1.
Features included in the final Cox proportional-hazards model with their respective coefficients, hazard ratios, and ICCs computed by comparing the values in Med-CT with those in Par-CT.
In addition, Table 1 reports the ICCs obtained from the consistency analysis.
Based on Hazard Ratio values (Table 1), higher values of “intensity histogram quartile coefficient of dispersion” and “normalized zone distance non-uniformity” were associated with a higher risk of death. In contrast, “area density enclosing ellipsoid”, “cluster shade”, and “min value” were associated with reduced risk.
To confirm the prognostic capability of the five LASSO-Cox-identified prognostic RFs, Figure 5 reports the box plots of RFs values extracted from the Par-CT and Med-CT subsets, as well as the risk score obtained by the final model, divided into dead and alive patients.
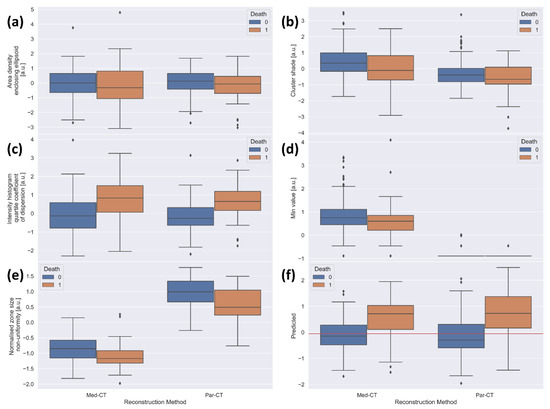
Figure 5.
Boxplots of the standardized values of the features included in the final model for the 196 patients used as validation, divided by reconstruction type (left side of each plot: Med-CT, right side of each plot: Par-CT) and by final outcome (blue: alive, orange: death). The plots are relative to (a) area density aligned ellipsoid, (b) cluster shade, (c) intensity histogram quartile coefficient of dispersion, (d) min value, (e) normalized size non-uniformity, and (f) value predicted by the model in the validation datasets. The red horizontal line corresponds to the median obtained using the training dataset.
Figure 5a–c reports the box plots of “area density enclosing ellipsoid”, “cluster shade” and “intensity histogram quartile coefficient of dispersion”, respectively. These figures show similar behaviors of RFs in alive and dead patients, irrespective of the two reconstruction approaches.
Moreover, for Med-CT, the feature “min value” (Figure 5d) collapsed to almost the single value of −1020 HU, likely due to the voxel dimension in the reconstructed images. This justifies the very low agreement found in the ICC analysis. Notably, the predictive value of the LASSO-Cox-based model was statistically significant among groups (i.e., remains informative). Since there is only a single value in the model for Med-CT, this amounts to adding a constant for all patients. While not improving the ability to separate the population, this does not create any confusion either, providing an overall null effect for Med-CT and a net positive effect for Par-CT. The values of “normalized zone distance non-uniformity” extracted from Par-CT are overall higher than those obtained from Med-CT (Figure 5e), likely explaining the moderate agreement found with ICC analysis (Table 1). However, the relative behavior of the RFs extracted from CT images using the two reconstructions is very similar, except for the RF “min value”. Thus, the model maintains its predictive ability in both validation datasets.
The ROC curves were calculated, and the respective AUC values were 0.764 (0.663–0.866) and 0.748 (0.637–0.858), using the predicted values by the LASSO-Cox model in the Par-CT and Med-CT datasets, confirming the good performance of our classifier.
4. Discussion
In this work, CT images acquired on a population of 435 patients affected by SARS-CoV-2 were analyzed to assess the robustness in the ability of a radiomic-based LASSO-Cox model in the prediction of patient OS when faced with different reconstruction algorithms.
In the literature, similar models have rarely been validated on large datasets obtained in different conditions from those employed during the acquisition of the training set (e.g., Med-CT vs. Par-CT or training images). Despite these unfavorable conditions, our validation datasets represent a real-world setting representative of clinical practice during the SARS-CoV-2 pandemic.
To the best of our knowledge, this represents the largest patient cohort analyzed with this methodology and the only one where a comparison between different reconstruction methods is made. Table 2 summarizes similar studies reported in literature [7,9,18,19] compared to this study.
Table 2.
Comparison of similar studies.
In previous studies [7,8,19,20], multiple attempts have been made to predict poor prognosis in patients, be it by predicting the outcome of death, the need for artificial ventilation, or admission to the Intensive Care Unit (ICU). In all these previous cases, the studies did not perform a time-to-event analysis like the one shown in the present study. Table 2 summarizes studies [7,8,19,20] investigating RFs extracted from CT images as predictors of death, OS, or poor outcomes. The AUC values of the developed models ranged from 0.71 to 0.976. This variability can be explained by the fact that the ROC curves are related to a binary classification of patients based on survival without taking time into account. The model developed in the present study is optimized to separate patients according to survival rates, whereas binary classification models, such as those developed in [7,19,20], are optimized to predict only the event of mortality.
Compared with [9], which followed a similar approach to our own, the AUCs are in concordance when only considering the use of RFs as input variables. Furthermore, Ke et al. [9] implemented a combined approach with clinical laboratory tests, as well as comorbidities and demographic information. The abovementioned approach resulted in improvements in the predictive ability of their model developed on the exclusive use RFs.
Compared to [9,10], which had almost 80/90 total patients, the number of subjects analyzed in our study is between three and four times larger. Both studies [9,10] used a Lung Intelligence kit (General Electric Healthcare, Milwaukee, WI, USA) and required the expertise of a radiologist. Furthermore, both studies limited analysis to a single CT image reconstruction, which is not necessarily representative of standard hospital procedures where the diagnostic question may lead to different types of reconstruction. The AUC values reported in our study refer to RFs extracted from two validation datasets (i.e., Par-CT and Med-CT) generated using the same raw data with two different reconstruction approaches applied by radiologists in a real-world setting. In this context, our model results were predictive of OS, although without the use of additional clinical information, which could be missing in a busy department during a pandemic.
The findings of this study, obtained from chest CT scans and analyzed with a multivariate approach, are based on more comprehensive and nuanced information than what can be found with multiple univariate analyses of chest XRs, as conducted in [7,21]. Another substantial difference with [21] is that the segmentation was automatically performed with a manual validation through a dice coefficient, which could not be done in the present work due to the semi-automatic nature of the segmentation. Despite looking at different endpoints (i.e., survival instead of onset of severe/critical illness), our results move in the direction suggested in [22], using radiomics as a fundamental step of the analysis. Finally, both [9,18] used an approach similar to the one reported in this study. Wu et al. [18] analyzed a similarly sized cohort with the additional distinction of early/late CT scan acquisition with respect to symptom onset as declared by the patient. Dividing these two populations, they reported testing AUCs of 0.862 and 0.977. However, in their study they also had access to demographic information, as well as comorbidities of the patients, which improved the predictive ability of their model. The same considerations hold for [9] which also had available laboratory findings to describe each patient. In both [9,18], the reported maximum follow-up was shorter than the one reported in this study.
This study also presents some limitations, the first of which is the reliance on the application of a semi-automatic segmentation tool obtained with commercial CE market software, which does not allow much versatility.
The second limitation is that we used RFs extracted from the lungs. This approach agrees with the observation by Xiao et al. [10], who reported that analyzing the lesion with radiomic features instead of the entire lung does not improve their model predictive abilities.
Hence, semi-automatic segmentation may have introduced some biases in the VOIs, potentially affecting the quality of RFs. A fully manual segmentation of the volume at risk can provide a more accurate delineation of VOI, although such tasks are rarely feasible in daily clinical practice. For this reason, AI-based approaches are in use for automatic or semi-automatic segmentation of VOIs in order to develop predictive models of the outcome, e.g., for external beam radiotherapy [23].
The features extracted with the software SOPHIA DDM have been shown to be largely IBSI compliant [14]. However, the extraction only produced the category of original features without allowing the use of filters (i.e., wavelet filters), which proved largely informative in [10] and may explain the reduced, although statistically significant, separation in the Kaplan-Meyer curves presented in this study.
Unfortunately, not having access to radiomic analysis after filtering makes the comparison of the features building the multivariate models quite difficult due to the lack of overlap between the findings.
Regarding the prognostic features, one of the prognostic features was the “minimum value”, which can be directly obtained after segmentation of the image and corresponds to the lowest intensity of HU within the VOI. Another prognostic feature was the “intensity histogram quartile dispersion coefficient” which measures the dispersion of the discretized intensity distribution and represents a more robust alternative to the intensity histogram coefficient of variance.
Another feature retained in the final LASSO-Cox model was the “area density enclosing ellipsoid”, listed as a morphological feature that represents the ratio between the area of VOI and of the enclosing ellipsoid. The model retained the RF “cluster shade”, which quantifies the skewness and uniformity in the gray-level co-occurrence matrix (GLCM)-based features. By design, the higher the computed cluster shade, the greater the asymmetry of the gray-level distribution.
The last prognostic feature was the “normalized zone distance non-uniformity”, listed in the gray-level distance zone-based features. This feature is a normalized version of the zone distance non-uniformity feature, which measures the distribution of zone counts over the different zone distances. This parameter is low when zone counts are equally distributed along zone distances.
Finally, this study did not use clinical information, laboratory findings, or patient comorbidities which, as has been shown in the literature, might lead to further improvements in the performances of the predictive models [8,9,10]. This is because we would then focus analysis on image-extracted RFs, since our objective was to assess the predictive value of RFs extracted from high-resolution CT and look at differences in the model application due to image two types of image reconstruction, in which clinical information may only have an indirect effect.
Overall, our method seems to be robust and able in identifying COVID-19 patients with good and poor prognosis, irrespective of reconstructions adopted in the clinical practice in our institute.
Supplementary Materials
The following supporting information can be downloaded at: https://www.mdpi.com/article/10.3390/app122312065/s1, Table S1: Occurrence rate of RFs (>=10%) generated out of 100 LASSO-Cox models using the training datasets.
Author Contributions
Conceptualization, L.S. (Lidia Strigari); Methodology, M.F.M. and S.S.; Validation, L.S. (Lidia Strigari); Formal analysis, G.P., M.S. and L.S. (Lidia Strigari); Investigation, G.P., M.S. and F.C.; Data curation, L.S. (Lorenzo Spagnoli) and S.S.; Writing—original draft, G.P., L.S. (Lorenzo Spagnoli), M.F.M. and S.S.; Writing—review & editing, F.C. and L.S. (Lidia Strigari); Visualization, F.C. and R.G.; Supervision, R.G. and L.S. (Lidia Strigari). All authors have read and agreed to the published version of the manuscript.
Funding
The SOPHiA DDM software licence was funded by the S. Orsola Polyclinic Foundation (Fondazione Policlinico S. Orsola) of Bologna, Italy.
Institutional Review Board Statement
This study regarding the prognostic value of radiomic features was conducted and included all the patients suitable for analysis, according to the guidelines of the Declaration of Helsinki. The study was approved by the Institutional Review Board (or Ethics Committee) of IRCCS University Hospital of Bologna (protocol code no. EM949-2020_507/2020/Oss/AOUBo, approved on: 16 September 2020).
Informed Consent Statement
Written informed consent was obtained from all patients before publishing this paper.
Data Availability Statement
Data will be available after reasonable request to the corresponding author.
Acknowledgments
We would like acknowledge Eng. Stefano Vezzani from the S. Orsola Polyclinic Foundation of Bologna, Italy and all the benefactors participating to the fund-raising on COVID-19.
Conflicts of Interest
The authors declare no conflict of interest.
References
- Grassi, R.; Belfiore, M.P.; Montanelli, A.; Patelli, G.; Urraro, F.; Giacobbe, G.; Fusco, R.; Granata, V.; Petrillo, A.; Sacco, P.; et al. COVID-19 pneumonia: Computer-aided quantification of healthy lung parenchyma, emphysema, ground glass and consolidation on chest computed tomography (CT). La Radiol. Med. 2020, 126, 553–560. [Google Scholar] [CrossRef] [PubMed]
- Neri, E.; Miele, V.; Coppola, F.; Grassi, R. Use of CT and artificial intelligence in suspected or COVID-19 positive patients: Statement of the Italian Society of Medical and Interventional Radiology. La Radiol. Med. 2020, 125, 505–508. [Google Scholar] [CrossRef] [PubMed]
- Manco, L.; Maffei, N.; Strolin, S.; Vichi, S.; Bottazzi, L.; Strigari, L. Basic of machine learning and deep learning in imaging for medical physicists. Phys. Medica 2021, 83, 194–205. [Google Scholar] [CrossRef] [PubMed]
- Avanzo, M.; Stancanello, J.; El Naqa, I. Beyond imaging: The promise of radiomics. Phys. Medica 2017, 38, 122–139. [Google Scholar] [CrossRef]
- van Timmeren, J.E.; Cester, D.; Tanadini-Lang, S.; Alkadhi, H.; Baessler, B. Radiomics in medical imaging-“how-to” guide and critical reflection. Insights Imaging. Insights Imaging 2020, 11, 91. [Google Scholar] [CrossRef]
- Lee, G.; Lee, H.Y.; Park, H.; Schiebler, M.L.; van Beek, E.J.; Ohno, Y.; Seo, J.B.; Leung, A. Radiomics and its emerging role in lung cancer research, imaging biomarkers and clinical management: State of the art. Eur. J. Radiol. 2017, 86, 297–307. [Google Scholar] [CrossRef]
- Varghese, B.A.; Shin, H.; Desai, B.; Gholamrezanezhad, A.; Lei, X.; Perkins, M.; Oberai, A.; Nanda, N.; Cen, S.; Duddalwar, V. Predicting clinical outcomes in COVID-19 using radiomics on chest radiographs. Br. J. Radiol. 2021, 94, 20210221. [Google Scholar] [CrossRef]
- Spagnoli, L.; Morrone, M.F.; Giampieri, E.; Paolani, G.; Santoro, M.; Curti, N.; Coppola, F.; Ciccarese, F.; Vara, G.; Brandi, N.; et al. Outcome Prediction for SARS-CoV-2 Patients Using Machine Learning Modeling of Clinical, Radiological, and Radiomic Features Derived from Chest CT Images. Appl. Sci. 2022, 12, 4493. [Google Scholar] [CrossRef]
- Ke, Z.; Li, L.; Wang, L.; Liu, H.; Lu, X.; Zeng, F.; Zha, Y. Radiomics analysis enables fatal outcome prediction for hospitalized patients with coronavirus disease 2019 (COVID-19). Acta Radiol. 2021, 63, 319–327. [Google Scholar] [CrossRef]
- Xiao, F.; Sun, R.; Sun, W.; Xu, D.; Lan, L.; Li, H.; Xu, H. Radiomics analysis of chest CT to predict the overall survival for the severe patients of COVID-19 pneumonia. Phys. Med. Biol. 2021, 66, 105008. [Google Scholar] [CrossRef]
- Kao, Y.-S.; Lin, K.-T. A Meta-Analysis of Computerized Tomography-Based Radiomics for the Diagnosis of COVID-19 and Viral Pneumonia. Diagnostics 2021, 11, 991. [Google Scholar] [CrossRef] [PubMed]
- Cattabriga, A.; Cocozza, M.A.; Vara, G.; Coppola, F.; Golfieri, R. Lung CT Segmentation to Identify Consolidations and Ground Glass Areas for Quantitative Assesment of SARS-CoV Pneumonia. JoVE (J. Vis. Exp.) 2020, 166, e61737. [Google Scholar] [CrossRef] [PubMed]
- Jha, A.K.; Mithun, S.; Jaiswar, V.; Sherkhane, U.B.; Purandare, N.C.; Prabhash, K.; Rangarajan, V.; Dekker, A.; Wee, L.; Traverso, A. Repeatability and reproducibility study of radiomic features on a phantom and human cohort. Sci. Rep. 2021, 11, 2055. [Google Scholar] [CrossRef]
- Bettinelli, A.; Marturano, F.; Avanzo, M.; Loi, E.; Menghi, E.; Mezzenga, E.; Pirrone, G.; Sarnelli, A.; Strigari, L.; Strolin, S.; et al. A Novel Benchmarking Approach to Assess the Agreement among Radiomic Tools. Radiology 2022, 303, 533–541. [Google Scholar] [CrossRef]
- Gideon, S. Estimating the Dimension of a Model. Ann. Stat. 1978, 6, 461–464. [Google Scholar]
- Kass, R.E.E. Bayes Factors. J. Am. Stat. Assoc. 1995, 90, 773–795. [Google Scholar] [CrossRef]
- Koo, T.K.; Li, M.Y. A Guideline of Selecting and Reporting Intraclass Correlation Coefficients for Reliability Research. J. Chiropr. Med. 2016, 15, 155–163. [Google Scholar] [CrossRef]
- Wu, Q.; Wang, S.; Li, L.; Qian, W.; Hu, Y.; Li, L.; Zhou, X.; Ma, H.; Li, H.; Wang, M.; et al. Radiomics Analysis of Computed Tomography helps predict poor prognostic outcome in COVID-19. Theranostics 2020, 10, 7231–7244. [Google Scholar] [CrossRef]
- Shiri, I.; Sorouri, M.; Geramifar, P.; Nazari, M.; Abdollahi, M.; Salimi, Y.; Khosravi, B.; Askari, D.; Aghaghazvini, L.; Hajianfar, G.; et al. Machine learning-based prognostic modeling using clinical data and quantitative radiomic features from chest CT images in COVID-19 patients. Comput. Biol. Med. 2021, 132, 104304. [Google Scholar] [CrossRef]
- Li, C.; Dong, D.; Li, L.; Gong, W.; Li, X.; Bai, Y.; Wang, M.; Hu, Z.; Zha, Y.; Tian, J. Classification of Severe and Critical Covid-19 Using Deep Learning and Radiomics. IEEE J. Biomed. Health Inform. 2020, 24, 3585–3594. [Google Scholar] [CrossRef]
- Ferreira Junior, J.R.; Cardona Cardenas, D.A.; Moreno, R.A.; de Sá Rebelo, M.F.; Krieger, J.E.; Gutierrez, M.A. Novel Chest Radiographic Biomarkers for COVID-19 Using Radiomic Features Associated with Diagnostics and Outcomes. J. Digit. Imaging 2021, 34, 297–307. [Google Scholar] [CrossRef] [PubMed]
- Wu, G.; Yang, P.; Xie, Y.; Woodruff, H.C.; Rao, X.; Guiot, J.; Frix, A.-N.; Louis, R.; Moutschen, M.; Li, J.; et al. Development of a clinical decision support system for severity risk prediction and triage of COVID-19 patients at hospital admission: An international multicentre study. Eur. Respir. J. 2020, 56, 2001104. [Google Scholar] [CrossRef] [PubMed]
- Santoro, M.; Strolin, S.; Paolani, G.; Della Gala, G.; Bartoloni, A.; Giacometti, C.; Ammendolia, I.; Morganti, A.G.; Strigari, L. Recent Applications of Artificial Intelligence in Radiotherapy: Where We Are and Beyond. Appl. Sci. 2022, 12, 3223. [Google Scholar] [CrossRef]


Publisher’s Note: MDPI stays neutral with regard to jurisdictional claims in published maps and institutional affiliations. |
© 2022 by the authors. Licensee MDPI, Basel, Switzerland. This article is an open access article distributed under the terms and conditions of the Creative Commons Attribution (CC BY) license (https://creativecommons.org/licenses/by/4.0/).