1. Introduction
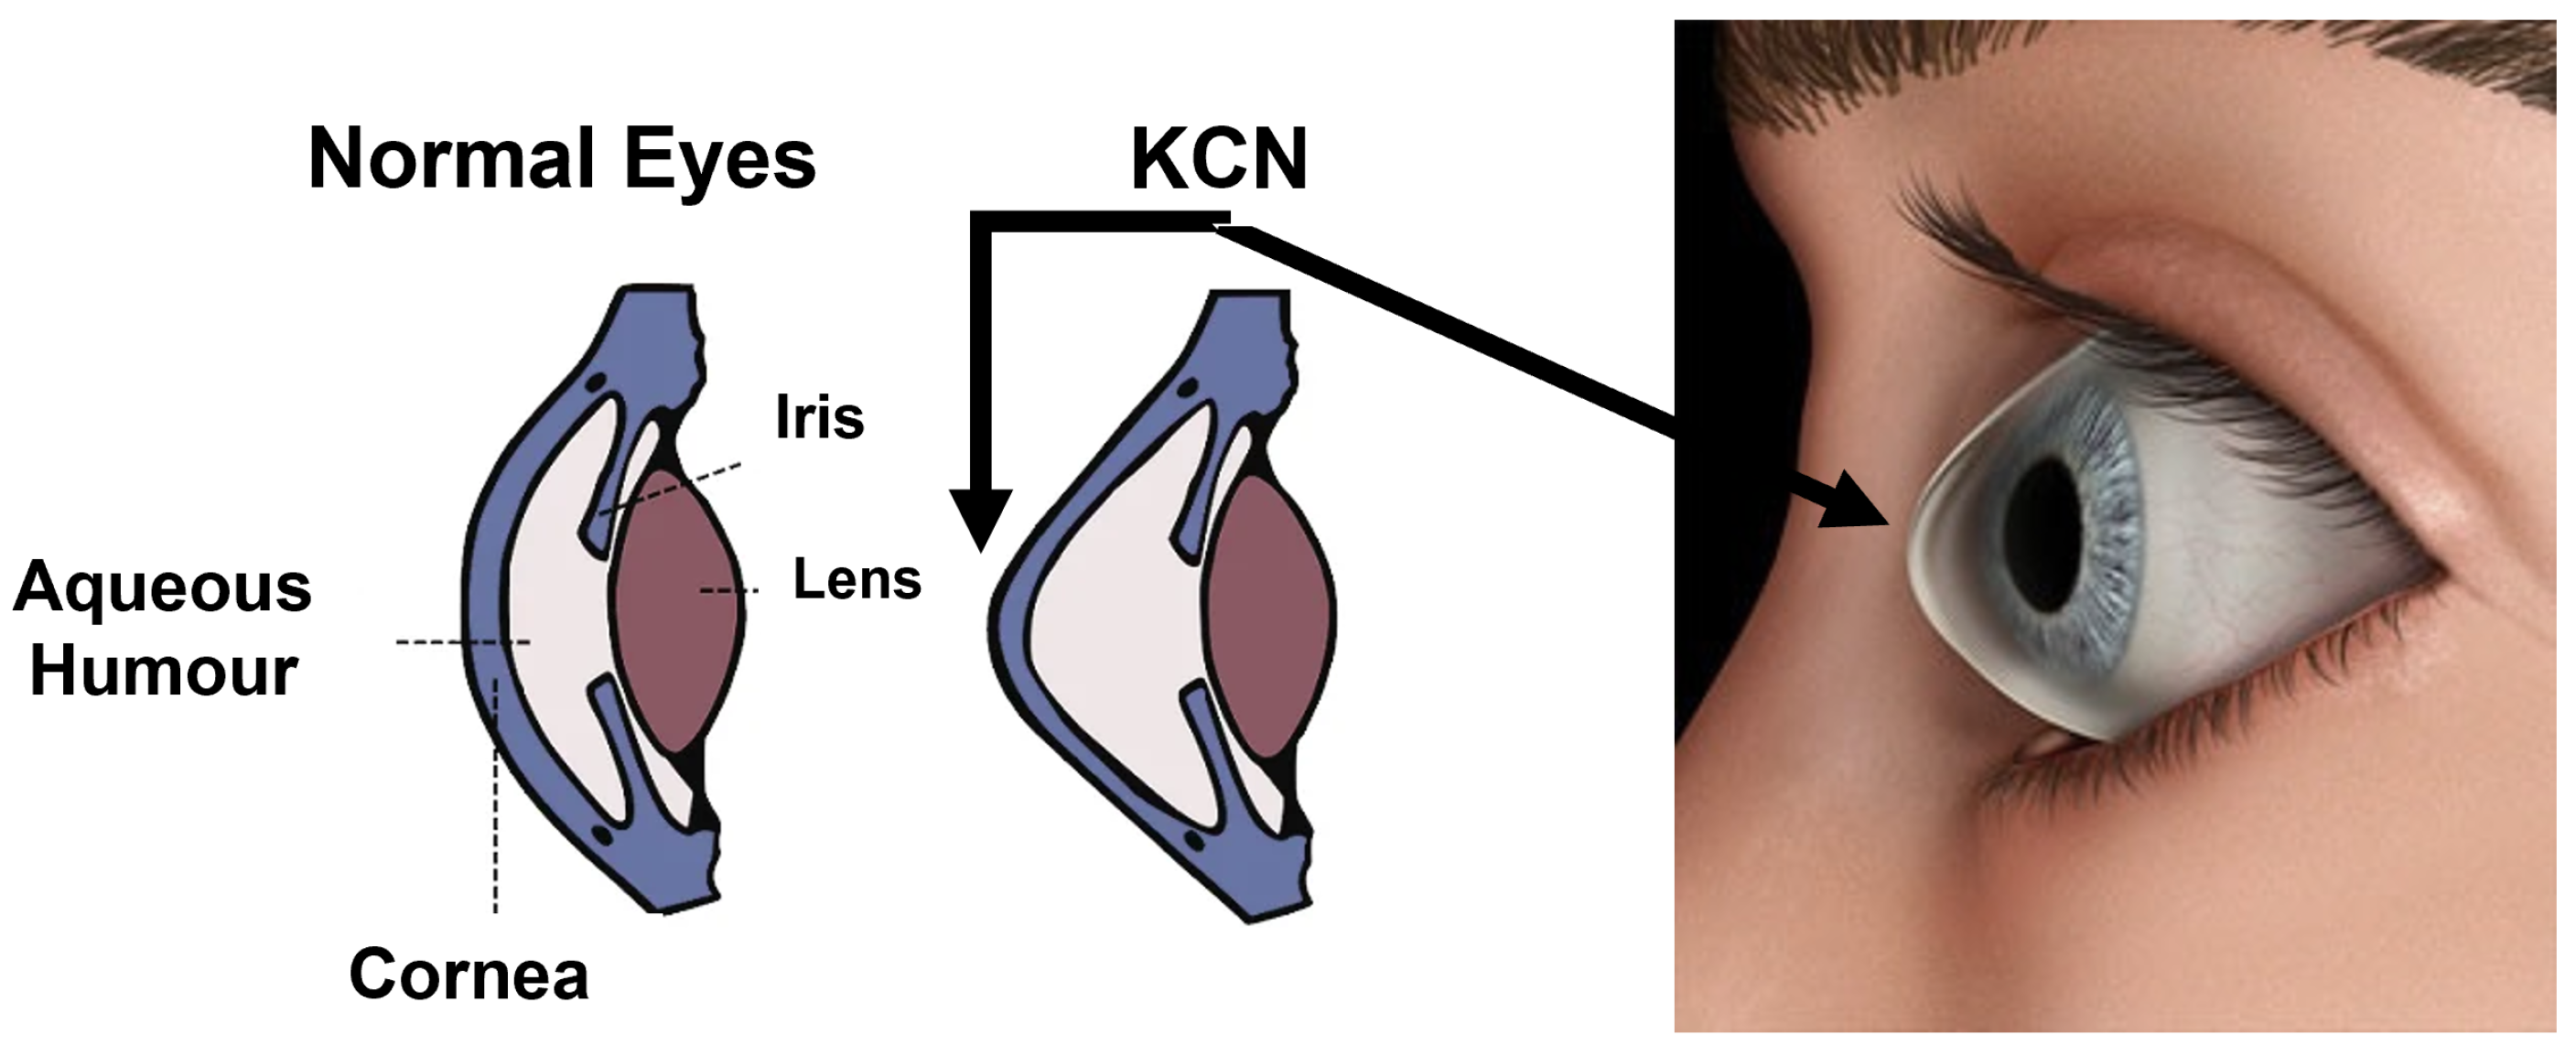
Keratoconus (KCN) is a non-inflammatory disease typically affecting both eyes [
1]. Early detection of KCN and monitoring its progression are challenging tasks that require subjective evaluation of refractive corneal maps as well as other corneal parameters [
2]. While the shape of a normal cornea looks like a dome, the shape of a cornea with KCN looks like a cone.
Figure 1 shows the overall structure of a normal and KCN cornea.
Artificial intelligence (AI) techniques have shown promise for addressing several ocular conditions and have achieved accuracy that equals or esceeds expert ophthalmologist [
3,
4,
5,
6,
7,
8,
9,
10,
11]. Various machine learning techniques have been developed for KCN detection and refractive surgery screening [
12,
13,
14,
15] and are becoming a crucial tool to aid ophthalmologists in making a better KCN diagnosis. Machine learning has been applied to discriminate normal from KCN eyes based on corneal imaging parameters [
12,
15]. Most of these methods for KCN diagnosis rely on subjective evaluation of topographical maps [
16]. However, automated models may provide a more accurate and objective evaluation of KCN. Conventional machine learning models such as neural networks, binary decision trees, and Zernike polynomial have been applied to corneal topography indices for KCN diagnosis [
12,
17,
18,
19]. Maeda et al. [
20] applied one of the first supervised ML models to corneal topographic maps to classify KCN. Eleven topographic indices extracted from the topographic maps were fed to neural network to classify different grades of KCN. Mosa et al. [
21] applied ML to extract sixteen features from the four topographic maps including five indices from Pentacam measurements. The features were then fed to Support Vector Machine (SVM) and decision tree classifiers, where accuracies of 90% and 87.5% were achieved for both classifiers, respectively. Different ML techniques have been applied to corneal images collected based on OCT-based instrument (CASIA, Tomey, Japan) [
18]. A support vector machine (SVM) was applied on eight corneal parameters that provided a 94% accuracy on discriminating KCN from healthy eyes. Corneal parameters from 88 patients were analyzed with machine learning to detect subclinical KCN from healthy eyes [
17]. Using five parameters, the random forest method was able to achieve an area under the receiver operator characteristics curve (AUC) of 0.97 for detecting subclinical KCN. Most of these models have however used sole features from the anterior topography of corneal. Several follow up models have used features from the posterior of the cornea to evaluate KCN [
22,
23,
24]. However, from the machine learning perspective, it is ideal to evaluate a comprehensive set of features and select features that are most promising in classification.
Most of the current methods for automatic detection of KCN are supervised [
18,
22,
23,
24,
25,
26,
27]. Some models have achieved AUC up to 0.97 using Pentacam indices only and some have combined Pentacam indices with OCT parameters and have obtained AUROCs up to 1.0 [
26,
27]. Rare unsupervised models have been developed to identify KCN. Such an unsupervised approach requires no pre-labeled data avoiding expert annotation biases [
28,
29,
30]. For instance, an unsupervised machine learning model was developed to identify KCN stages [
28]. Principal component analysis (PCA), manifold learning, and stochastic embedding was used to cluster 4 classes of KCN for CASIA OCT imaging system. The unsupervised methods for KCN detection may address of big data labeling challenge, as medical data labeling by a human expert, is one of the challenges of applying ML for the medical field [
31].
The main contributions of this study are: (i) to introduce a hybrid algorithm for an unsupervised learning model and optimization techniques for KCN detection; (ii) to evaluate the performance of the algorithm for KCN detection, and (iii) to assess the model based on two independent real-world datasets from different populations. The performance of the proposed model is evaluated based on five different metrics: precision, recall, F-Score, purity, and accuracy. Furthermore, we evaluated the model based on two large dataset collected from two independent centers (Brazil and Japan).
2. Features Extraction
Pentacam data comprises topography/tomography, pachymetry, anterior chamber angle, volume, height, corneal and lens densitometry, and other ocular indices. Central Corneal Thickness (CCT) is a fundamental pachymetric index that is the basis for identifying corneal thinning disorders. Furthermore, the thinnest corneal thickness (TCT) is a valuable diagnostic parameter in detecting primary ectatic disease, including Volume Parameters and pupil position. The conic shape parameters also describe corneal shape. Conic shape parameters are the minimum curvature radius of the cornea (MCR in mm) and corneal eccentricity (ECC), indicating the corneal threshold of the peripheral curvature from the apical radius defines the degree of asphericity. The corneal parameters obtained are considered the most discriminative ones when it comes to KCN severity level identification. The largest dataset corresponds to Topometric (corneal shape) and topographic (corneal superficial landscape) indices that Pentacam captures and evaluates objectively. In addition to topometric and topographic data, Pentacam also generates anterior elevation and Central Keratoconus Index (CKI, which includes KCN index, index of height asymmetry, index of height decentration, index of surface variance, index of vertical asymmetry). Other features calculated by the difference between observed parameters and ideal shapes are the Posterior Elevation (PE) of the cornea, representing the maximum PE in a zone above the standardized reference shape, which is typically a best fit sphere (BFS) or best fit torric ellipsoid (BFTE) [
22,
23,
24,
32,
33,
34].
3. Background
In this section, we will describe the Flower Pollination algorithm (FPA), k-means, k-medoid, and Spectral Clustering algorithm briefly.
3.1. Flower Pollination Algorithm (FPA)
In the optimization context, metaheuristic algorithms are classified into three main categories: evolutionary-based algorithms (EA), trajectory-based algorithms (TAs), and swarm intelligence (SI) [
35]. In fact, all the metaheuristic types are nature-inspired such as the flower pollination algorithm (FPA). This algorithm was proposed by Yang in 2012 [
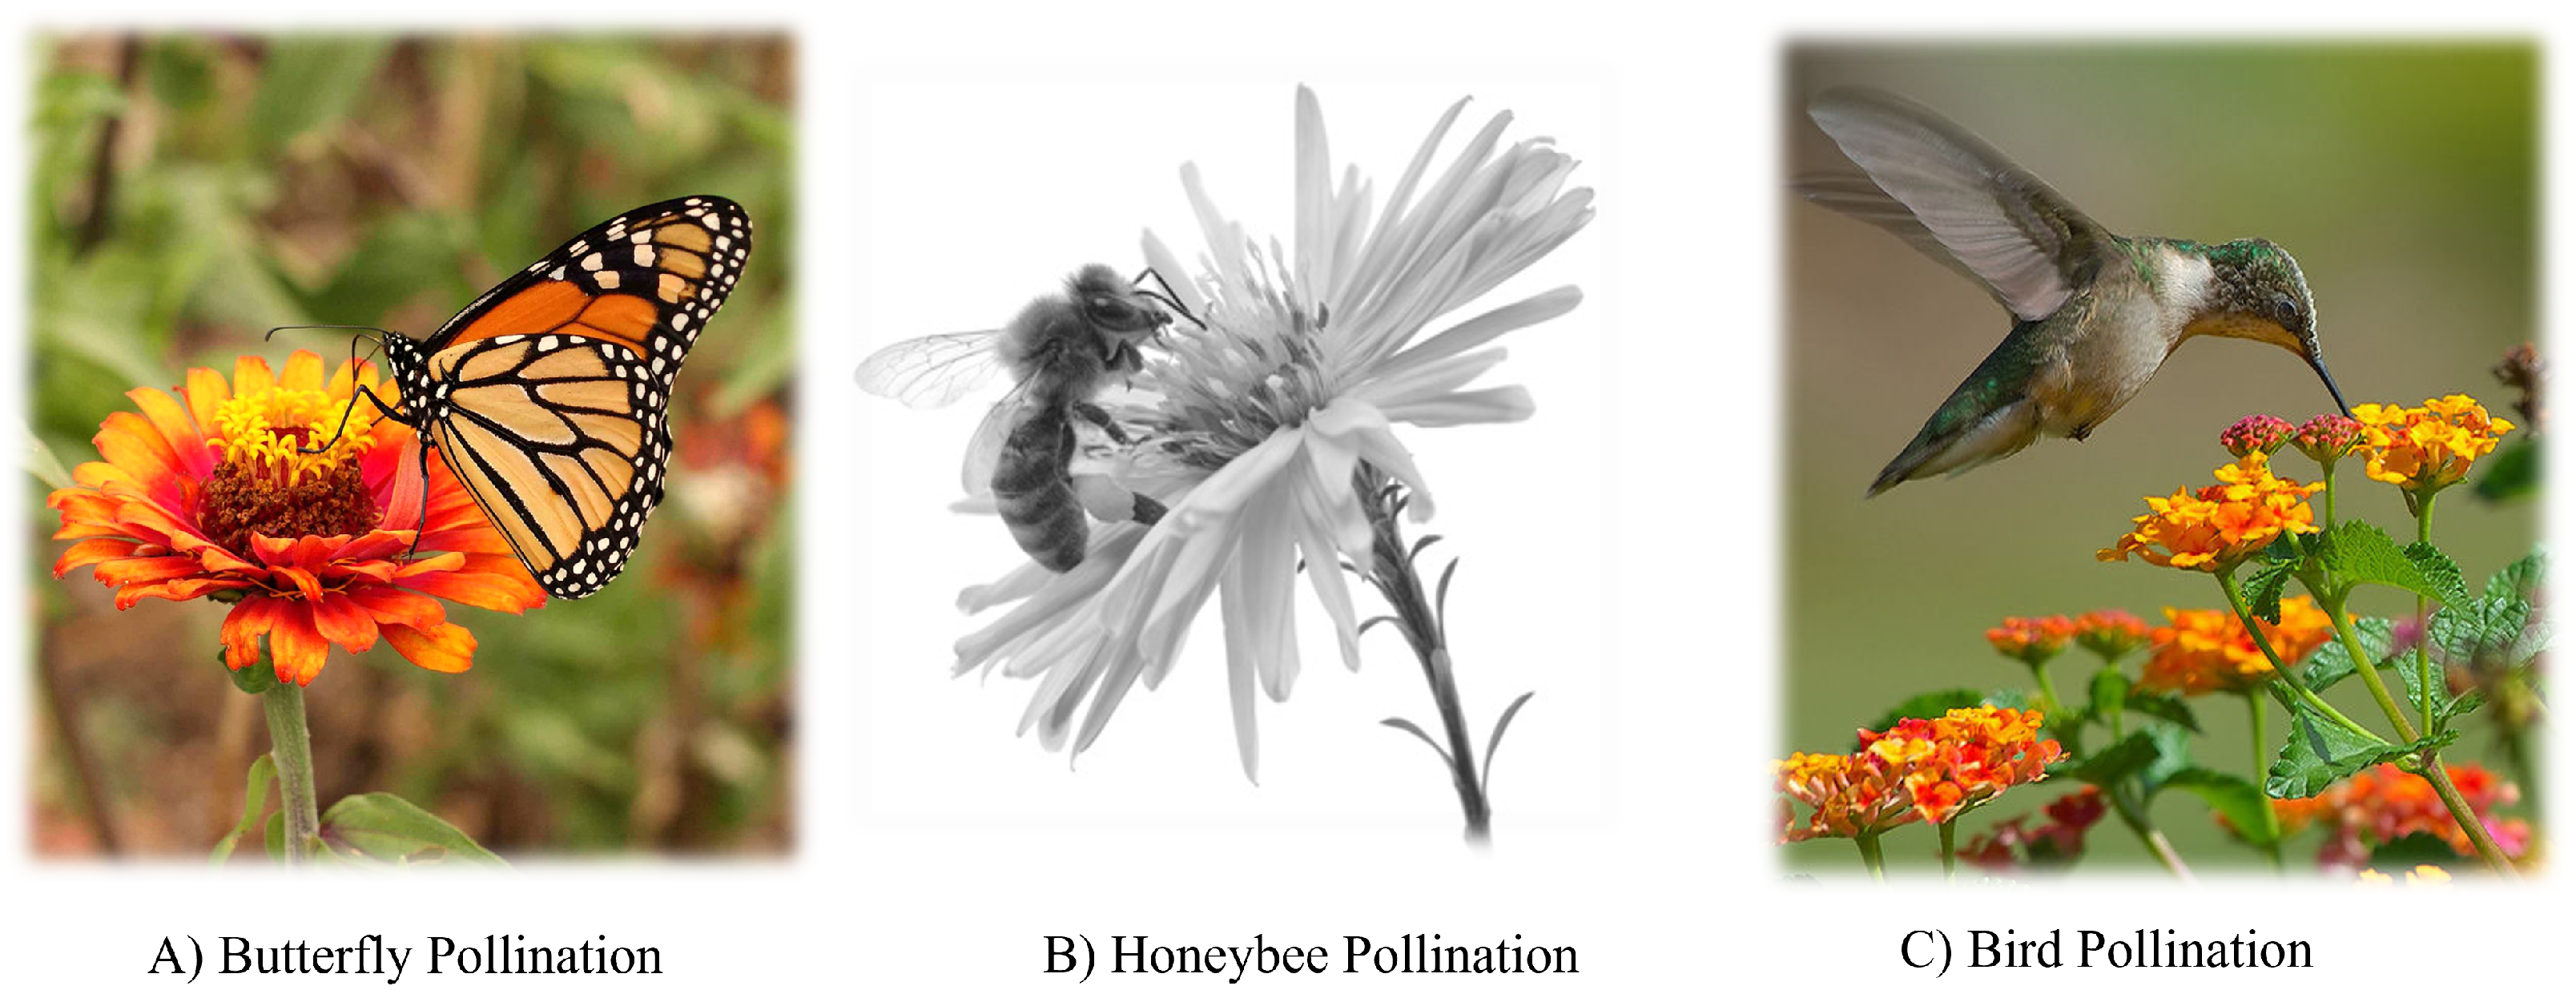
36] for global optimization. The main idea of the FPA is inspired from the flowering plants’ pollination behavior. Flowers are the main element in plant reproduction, which produce large quantities of pollen to attract pollinators (such as birds, butterflies, and bees). Through these pollinators, pollen grains will be transferred from one plant to another, and in this process, pollination takes place, and the plant continues to reproduce. This type of pollination is called global pollination, and it occurs between one plant and another. There is another type of pollination called local pollination, which takes place in the same plant, and the process of pollen transfer is carried out by wind or rain.
Figure 2 shows some examples of pollinators.
Yang [
36] considered such concepts to model the fundamentals of FPA in optimization-oriented problems.
Table 1 presents the equivalence or relationship between flower context and optimization terms.
The FPA has been applied to several real-world problems including medical, security and privacy, image and signal processing, feature selection, and electrical and power systems, with promising outcomes [
37,
38,
39]. In this study, we have integrated FPA with k-means to detect KCN from corneal imaging parameters.
3.2. K-Means
The
k-means is one of the well-known heuristic clustering algorithms [
40]. The primary aim of
k-means is identifying similar samples in the dataset based on their particular characteristics (i.e., features). There are many approaches to calculate the similarity among samples [
41]. The
k-means start with a random selection of sample as cluster center (i.e., cluster centroid) and then use similarity measures such as Euclidean distance to calculate the similarity or dissimilarity between the cluster center and the sample. After assigning the closest sample for each cluster, the centroids of the clusters are recalculated based on the average values for all sample features. The
k-means process is stopped once the predefined number of iterations is meet or until no more changing of the clusters centroids values. The main steps of
k-means process are implemented in Algorithm 1.
| Algorithm 1. Psudo code of k-means clustering heuristic algorithm. |
- 1:
Input: Number of clusters k, row data (samples) S. - 2:
Output: Matrix contains S assigned to K. - 3:
Select random from S as for each K. - 4:
while the number of iterations is not meet or no more changing of the clusters centroids values do - 5:
Calculate the similarity between the clusters centroids and S. - 6:
Assign S to the closest cluster centroid. - 7:
Calculate the clusters centroids. - 8:
end while
|
3.3. K-Medoid
k-medoid is another clustering algorithm based on partitions. It selects the actual dataset and identifies the clusters based on the medoids. A medoid reflects the samples in the data collection that is most centrally located. The primary objective of the k-medoid is to minimize the dissimilarity among the samples in the same cluster and maximize the dissimilarity among the rest of samples in others clusters based on the medoid.
The mechanism of the
k-medoid algorithm is like the
k-means algorithm. It also starts with a random selection of sample as initial medoids to from the clusters. The sample with the closest medoid are assigned to the same cluster. A new medoid then represents the cluster. The samples are iteratively allocated to the clusters with the closest medoid—the medoids’ positions changes with each iteration. The
k-medoid seeks to reduce the number of differences between each sample and its corresponding medoid [
42]. As the
k-means algorithm, the
k-medoid process is stopped once the predefined number of iterations is meet or until no more changing of the clusters medoids values. Ultimately,
K clusters are created with center on medoids, and all samples are placed into the fitting cluster on the basis of the nearest medoid. The main steps of
k-medoid process are implemented in Algorithm 2.
| Algorithm 2. Psudo code of k-medoid clustering heuristic algorithm. |
- 1:
Input: Number of clusters k, row data (samples) S. - 2:
Output: Matrix contains S assigned to K. - 3:
Select random from S as for each K. - 4:
while the number of iterations is not meet or no more changing of the clusters centroids values do - 5:
Calculate the similarity between the clusters medoids and S. - 6:
Assign S to the closest cluster medoids. - 7:
Calculate the clusters medoids. - 8:
end while
|
3.4. Spectral Clustering Algorithm
The Laplacian matrix (LM) eigenvectors that correspond to clustering the samples in the dataset are used in the spectral clustering [
43]. The first step in the spectral clustering algorithm is to build an undirected graph based on the data points (i.e., features). The weight on edge is the similarity among the data points, and each vertex on the graph corresponds to a data point. To construct the similarity matrix, the researchers usually use the Gaussian kernel function. We can then get a matrix with degrees, whose main diagonal element is equal to the total of the row elements that fit the identity matrix. The Laplacian matrix is typically constructed in three ways: (1) denormalized LM, (2) normalized symmetric LM, and (3) normalized asymmetric LM. The eigenvector is utilized to calculate the first k eigenvalues of the LM. Then, by normalizing the LM, a new feature matrix is created. A sample is presented in each row of the feature matrix, clustered to produce clusters in the next step. The main steps of the Spectral Clustering algorithm process are implemented in Algorithm 3.
| Algorithm 3. Psudo code of Spectral Clustering algorithm. |
- 1:
Input: Let W be the weighted matrix, the number of clusters K, Similarity Matrix. - 2:
Output: Matrix contains S assigned to K. - 3:
Using the Gaussian kernel function to create the similarity matrix. - 4:
Generate a symmetric normalized Laplacian matrix. - 5:
Create the feature matrix from the feature vector corresponding to the first k eigenvalues. - 6:
Normalized matrix, which includes n space points reduced to dimensions of k by normalize the feature matrix. - 7:
apply cluster algorithm to cluster the samples (rows of the matrix).
|
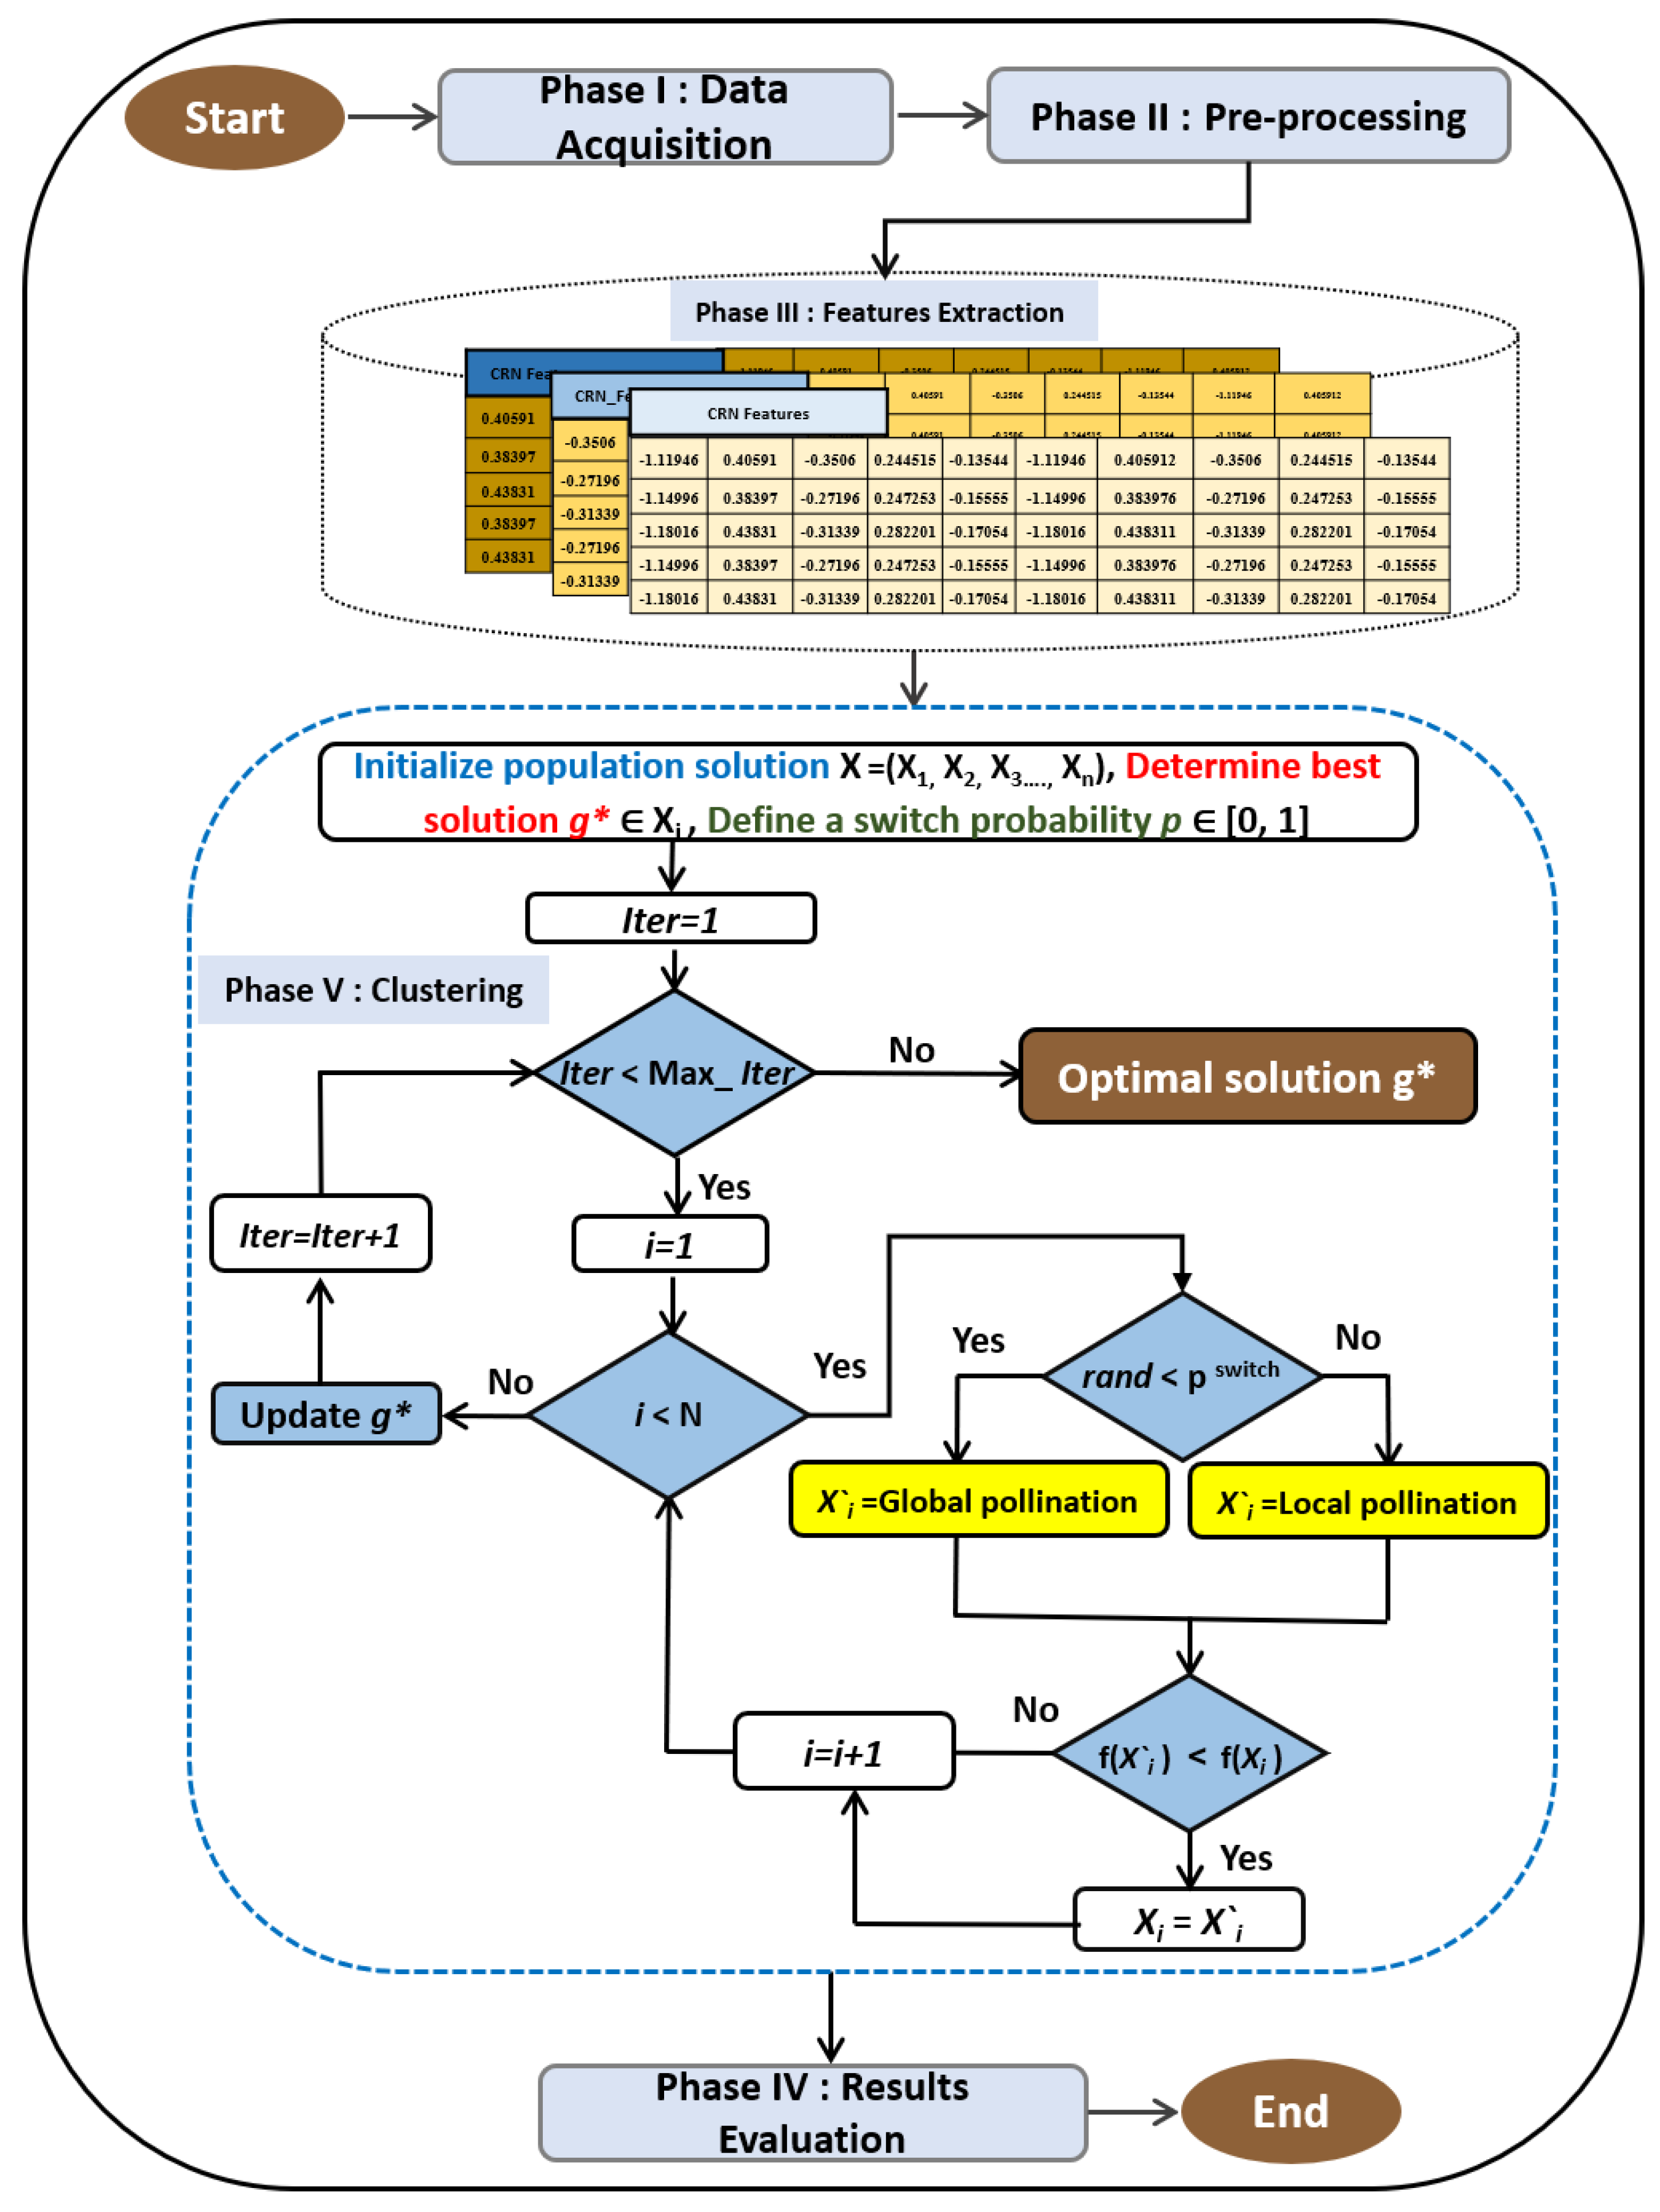
4. Proposed Method
In this study, we integrate flower pollination algorithm with k-means and evaluate the model based on real-world datasets. The proposed method includes five steps in which the output of each step is used as the input in the next step.
Figure 3 presents the diagram of the model that are described below.
4.1. Data Acquisition
The datasets utilized for this study consisted of Corneal parameters acquired with Pentacam device and OCT (CASIA, Tomey, Japan) instruments (Scheimpflug Imaging, Oculus, Germany) and OCT device from two independent cohorts in Brazil and Japan with different KCN severity levels. The severity levels were collected from the instrument without any expert intervention. The dataset from Brazil included 7339 corneal data collected from Department of Ophthalmology and Visual Sciences, Paulista Medical School, Federal University of São Paulo, São Paulo, Brazil hospital (3410 normal eyes and 3929 eyes at four different stages of KCN) in which the KCN severity level was obtained from To- pographical KCN Classification (TKC) of the Pentacam instruments without expert intervention. The dataset from Japan included 9544 corneal data collected from Department of Ophthalmology, Jichi Medical University, Tochigi hospital (8539 normal eyes and 1005 eyes at four different stages of KCN) in which the KCN severity level was obtained from Ectais Screening Index (ESI) of the CASIA instruments without expert intervention. Data use agreements were signed among institutes and study was conducted in accordance with ethical standards in the declaration of Helsinki and its later amendments [
44]. The details of the number of cases are illustrated in
Table 2.
4.2. Data Pre-Processing
Both datasets were examined and cases with examination error greater than zero were excluded from the study. Moreover, the cases of
progression according to
classification were considered with the highest grade (e.g.,
3–4 was assigned to the severity level of
). We included 50 raw Corneal Shape, Thickness, and Elevation Parameters and excluded all parameters that were generated by the Pentacam instrument. To assess
KCN, i.e.,
: Index of Surface Variance,
: index of vertical asymmetry,
: Keratoconus Index,
: Central Keratoconus Index,
: index of Height Asymmetry,
: index of Height Decentration and Rmin: (the minimum sagittal curvature). Five, three and two classes were investigated in this study where the 5-class problem refers to healthy versus 4 levels of
KCN severity (
Table 2). The 2-class problem included tackling the healthy cases versus all other abnormal cases of
KCN. Finally, we constructed a 3-class problem subset which was generated from the original Brazil dataset which includes 3410 normal cases, 1650 cases of moderate
KCN (
KC1 and
KC2) and 2278 cases of severe
KCN (
KC3 and
KC4). All parameters were exported from the Pentacam to CSV file format and they were changed to Mat files for further processing.
4.3. Feature Extraction
Although using a comprehensive set of features may seem ideal in machine learning applications, but irrelevant features may confuse the classifier and degrade the accuracy. As such, feature selection is a critical step in data mining pipelines.
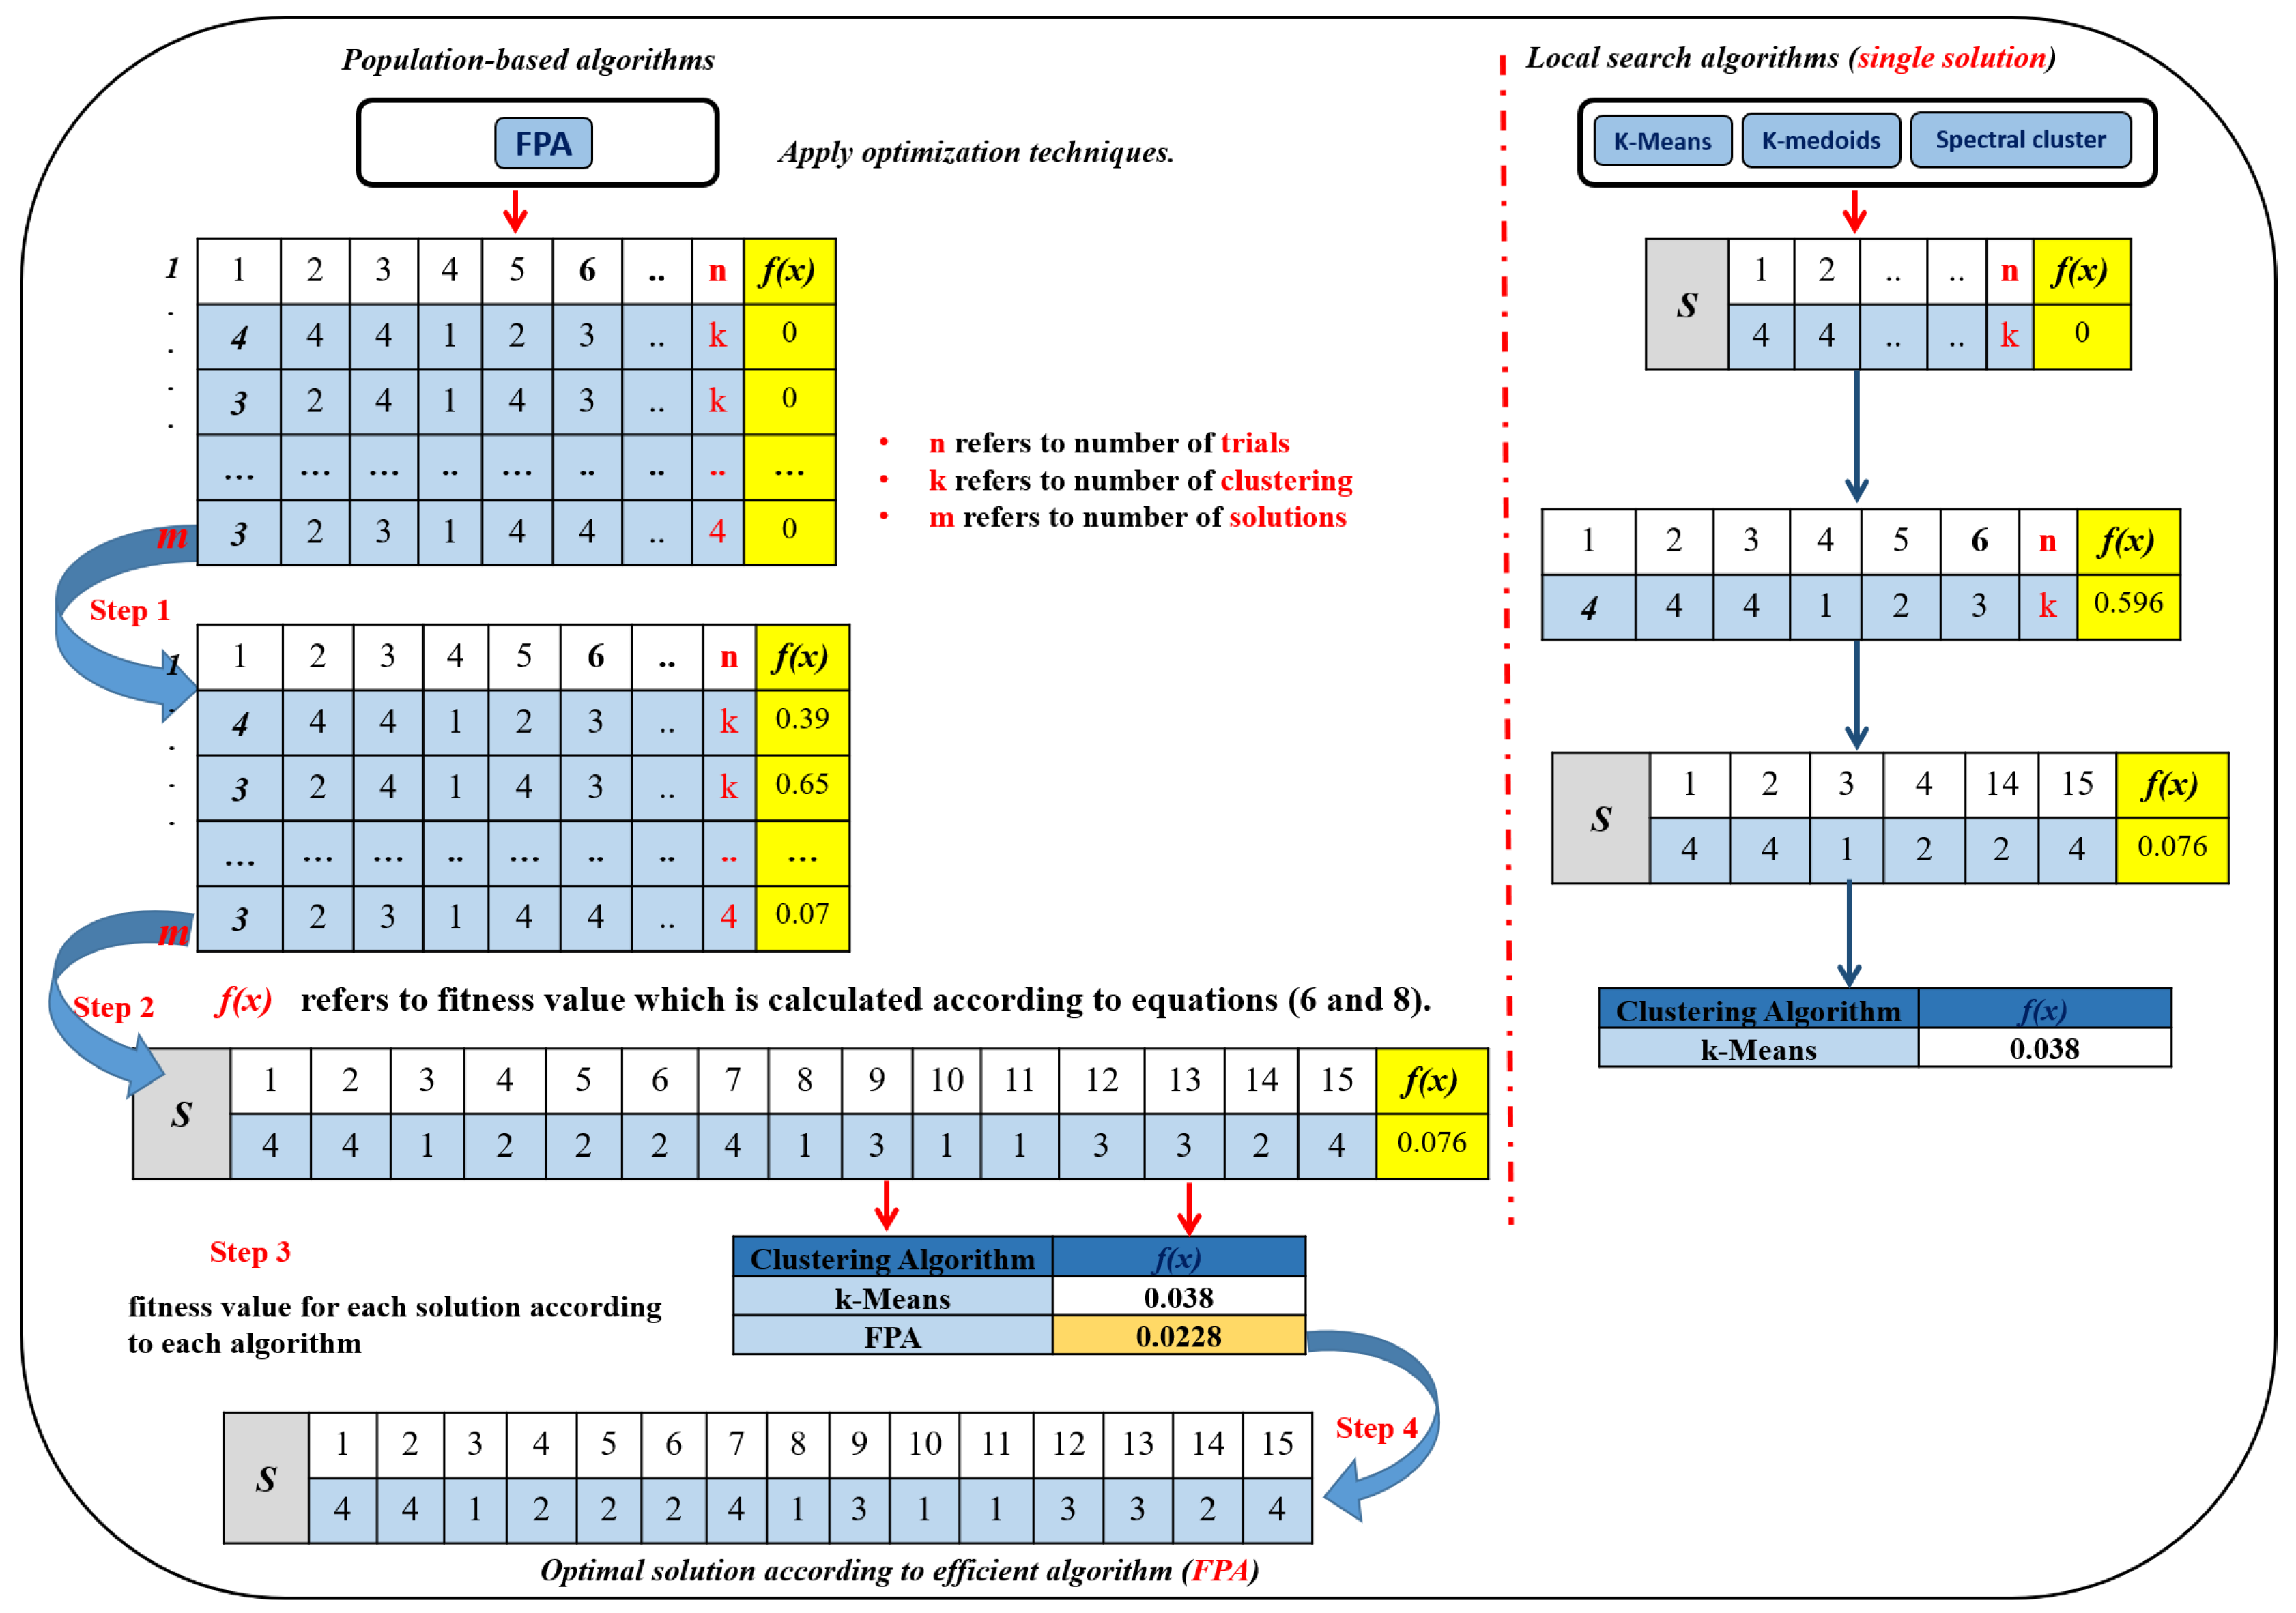
4.4. Clustering
Clustering algorithms try to group similar samples in the same cluster. As such, possible solution (to the problem) and a fitness function to evaluate the solution are two major components in the clustering process [
45,
46,
47]. The possible solution is the first step after pre-processing phase is providing feasible solutions for a particular problem while the fitness function evaluates these solutions in the clustering process. These components are discussed in the following subsections.
4.4.1. Representation of Solutions
Possible solution is presented by a vector indexing by number (n) of samples (s), where n is total number of features datasets. Each element of that vector is presented any cluster (k) number within the range .
4.4.2. Fitness Function
In this section, we explain the fitness function to evaluate features quality of each solutions. The fitness function which is used in this work is the similarity measures. Usually, a clustering algorithm is used a different technique to minimize the distance between the centroids of the clusters and samples [
48]. The main steps to evaluate solution quality of the proposed clustering method can be summarized as the following.
For each cluster:
- 1.
Find the cluster centroid;
- 2.
Find the distance between input feature sample and the cluster centroid.
We can calculate the cluster centroid of cluster
j. as shown in Equation (
1).
where
refers to a binary-valued vector,
n represents the total number of dataset, and
refers to the cluster
j centroid. The
defined as follows:
Finally, the average distance of input samples for all clusters must be calculated. In this work, the average distance of samples to the cluster centroid measure (
) is defined as shown in Equation (
3):
where
represents the total sample number for cluster
j.
refers to the total distance between the input sample and the cluster centroid
j with the cluster
j. The main objective of the proposed method is to find the best solution by minimize the
value for each solution. That means, the proposed method assigns the input data to the optimal cluster or near optimal.
Figure 4 shows the fitness process.
5. Experiments and Results
To evaluate the performance of the proposed method (FPAk-means) five quality assessment measures are calculated: namely recall, accuracy, purity, precision, f-measure. These measures are calculated using the following:
Accuracy:
where
,
,
, and
represent true acceptance, true reject, false acceptance, and false reject, respectively.
Precision:
where
is the number of tasks from class
i correctly identified in cluster
j, and
is the numbers of tasks (samples) in cluster
j.
Purity:
where
stands for the maximum number of correct label assignment (i.e., correct classification) from class
i in cluster
j.
Recall:
where
is the total number of tasks (samples) from class
i.
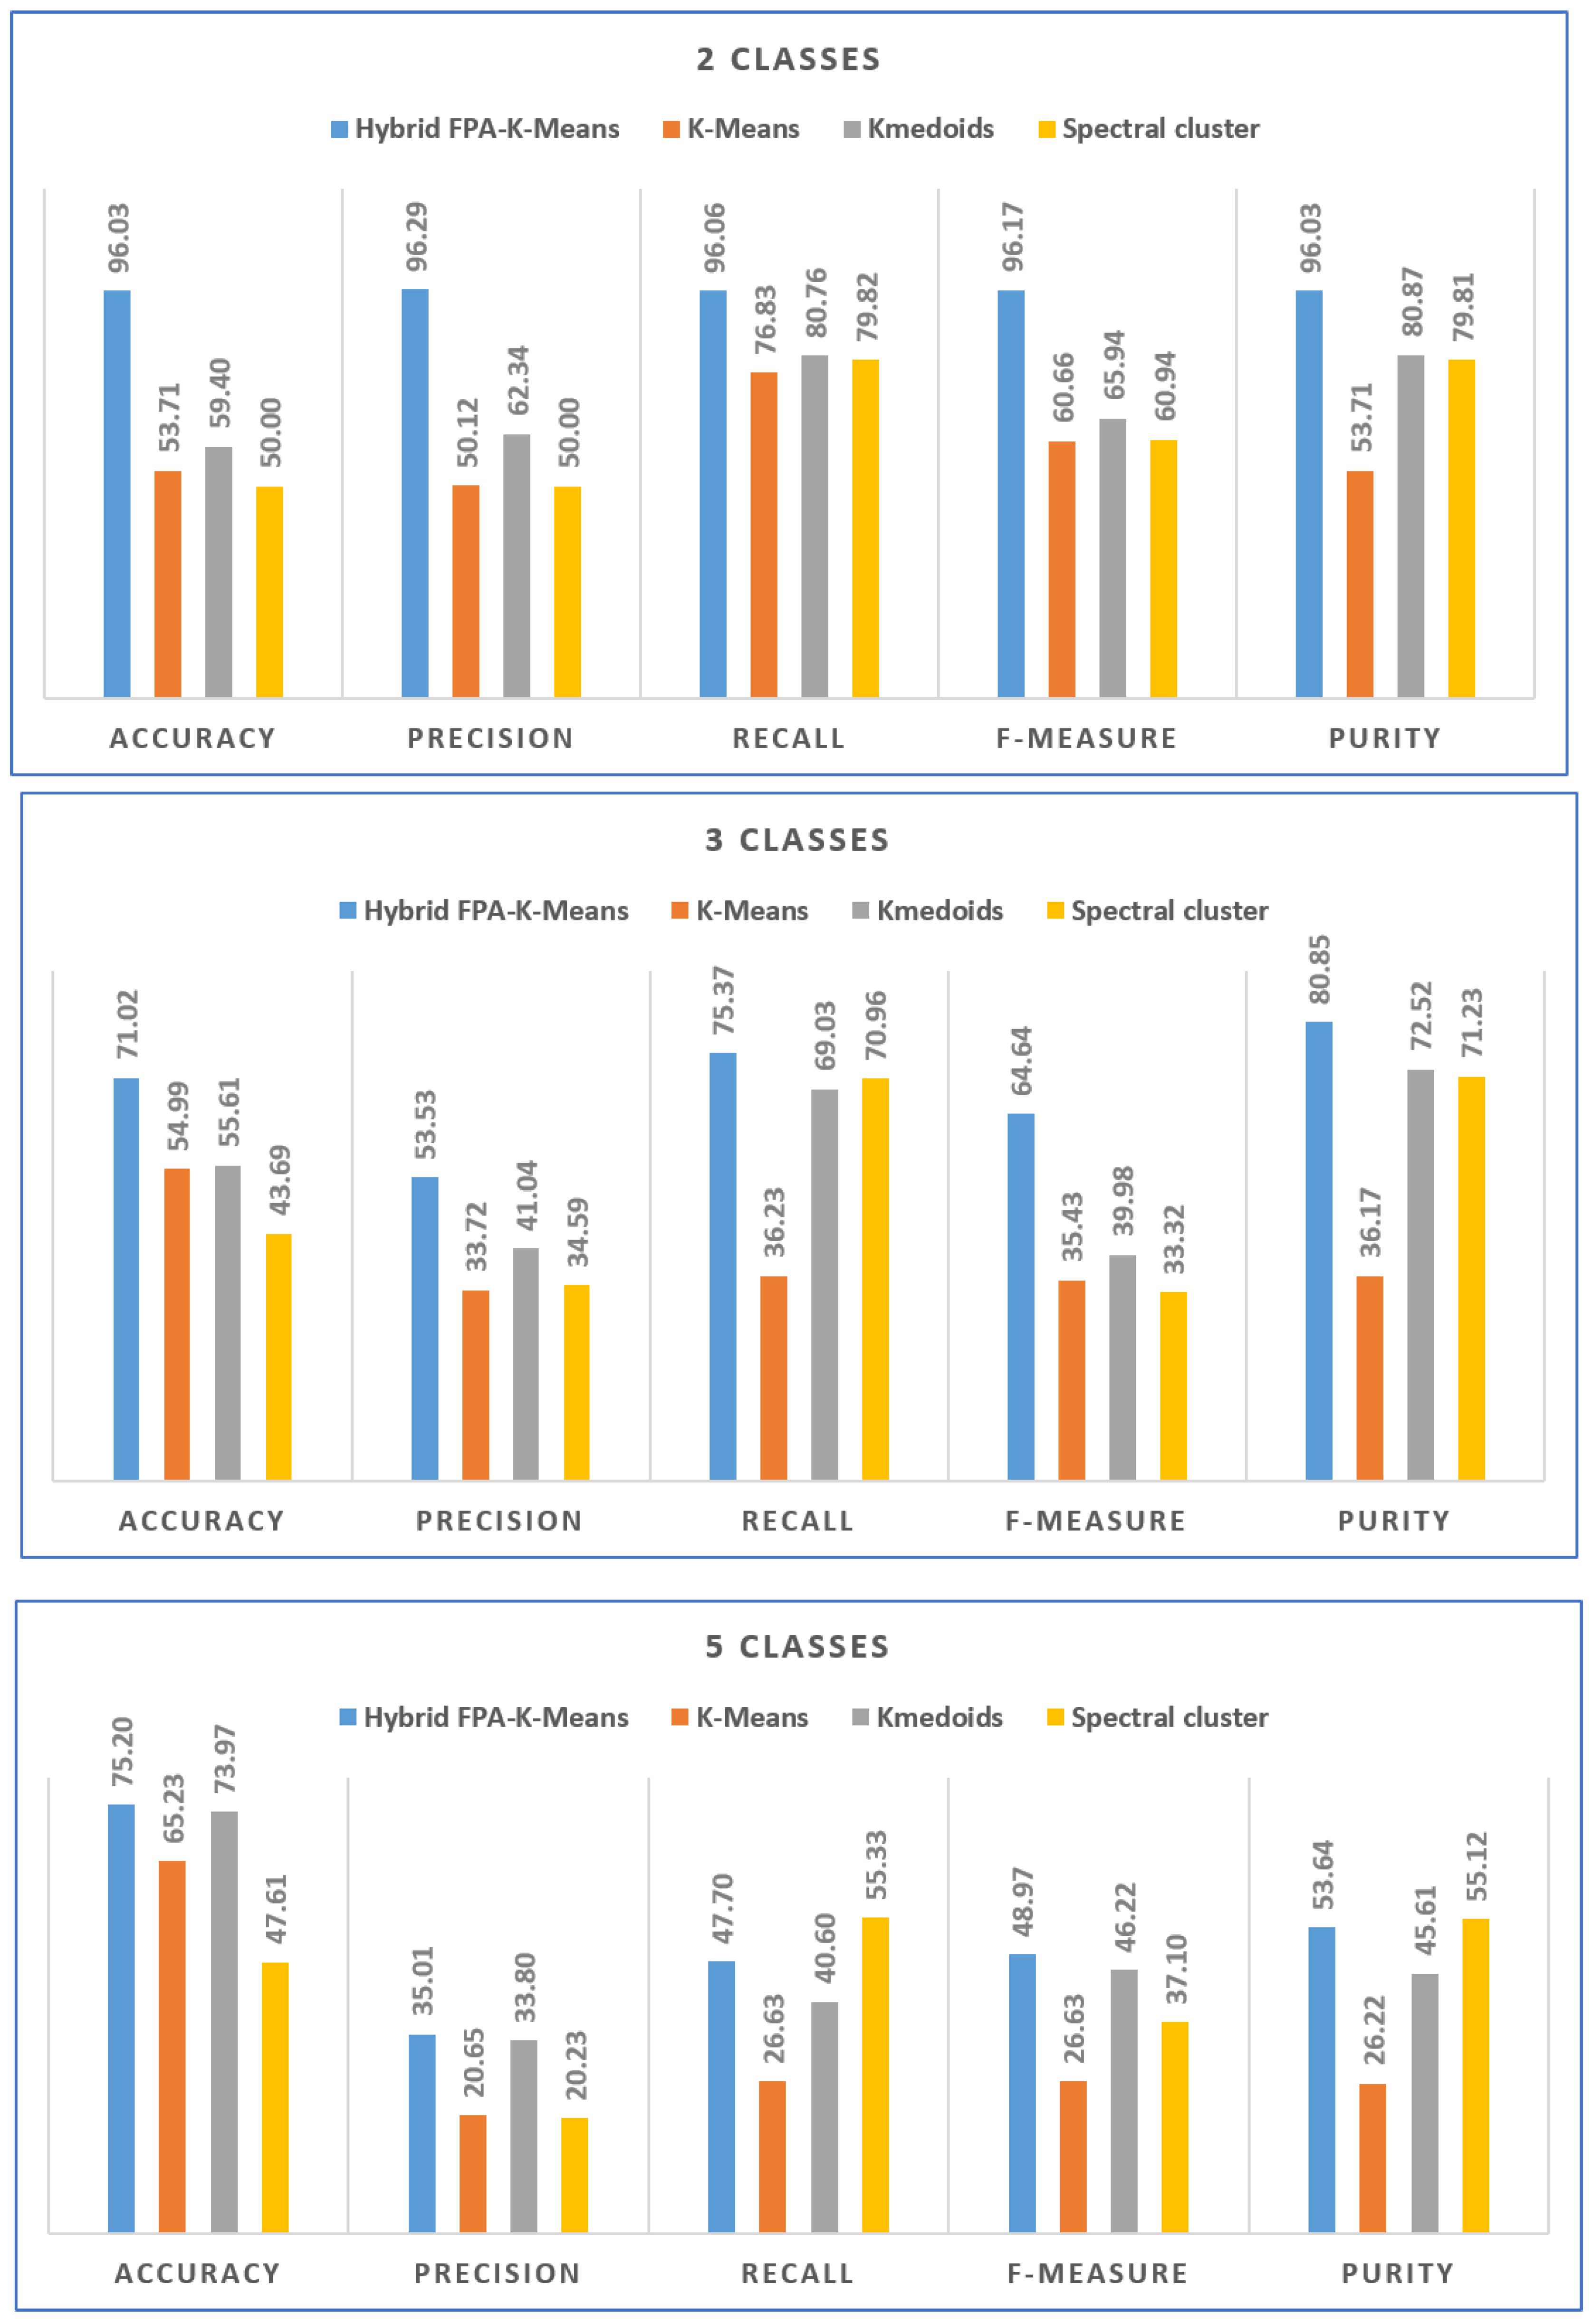
Figure 5 shows comparison of results between the proposed method (FPA
K-means) and standard K-means, Kmedoids, and Spectral clustering approaches.
Table 3 presents the experiment results with 25 runs concerning standard K-means, Kmedoids, and Spectral cluster. It is clear to notify that, the proposed hybrid method (FPA
K-means) achieves almost the best results overall measures for all dataset with 2, 3, and 5 classes. The best results obtained with 2 classes dataset where the FPA
K-means achieves 96.03, 96.29, 96.06, 96.17, and 96.03 for accuracy, Precision, Recall, F-measure, and Purity, respectively. Same scenario with 3 classes dataset the FPA
K-means achieves 71.02, 53.53, 75.37, 64.64, and 80.85 for accuracy, Precision, Recall, F-measure, and Purity, respectively. With 5 classes dataset the FPA
K-means almost achieves the best results except with Recall and Purity measures the proposed method obtained second ranked after the Spectral cluster. With such these results the FPA
K-means suitable for keratoconus detection and can be improved to get the best results.
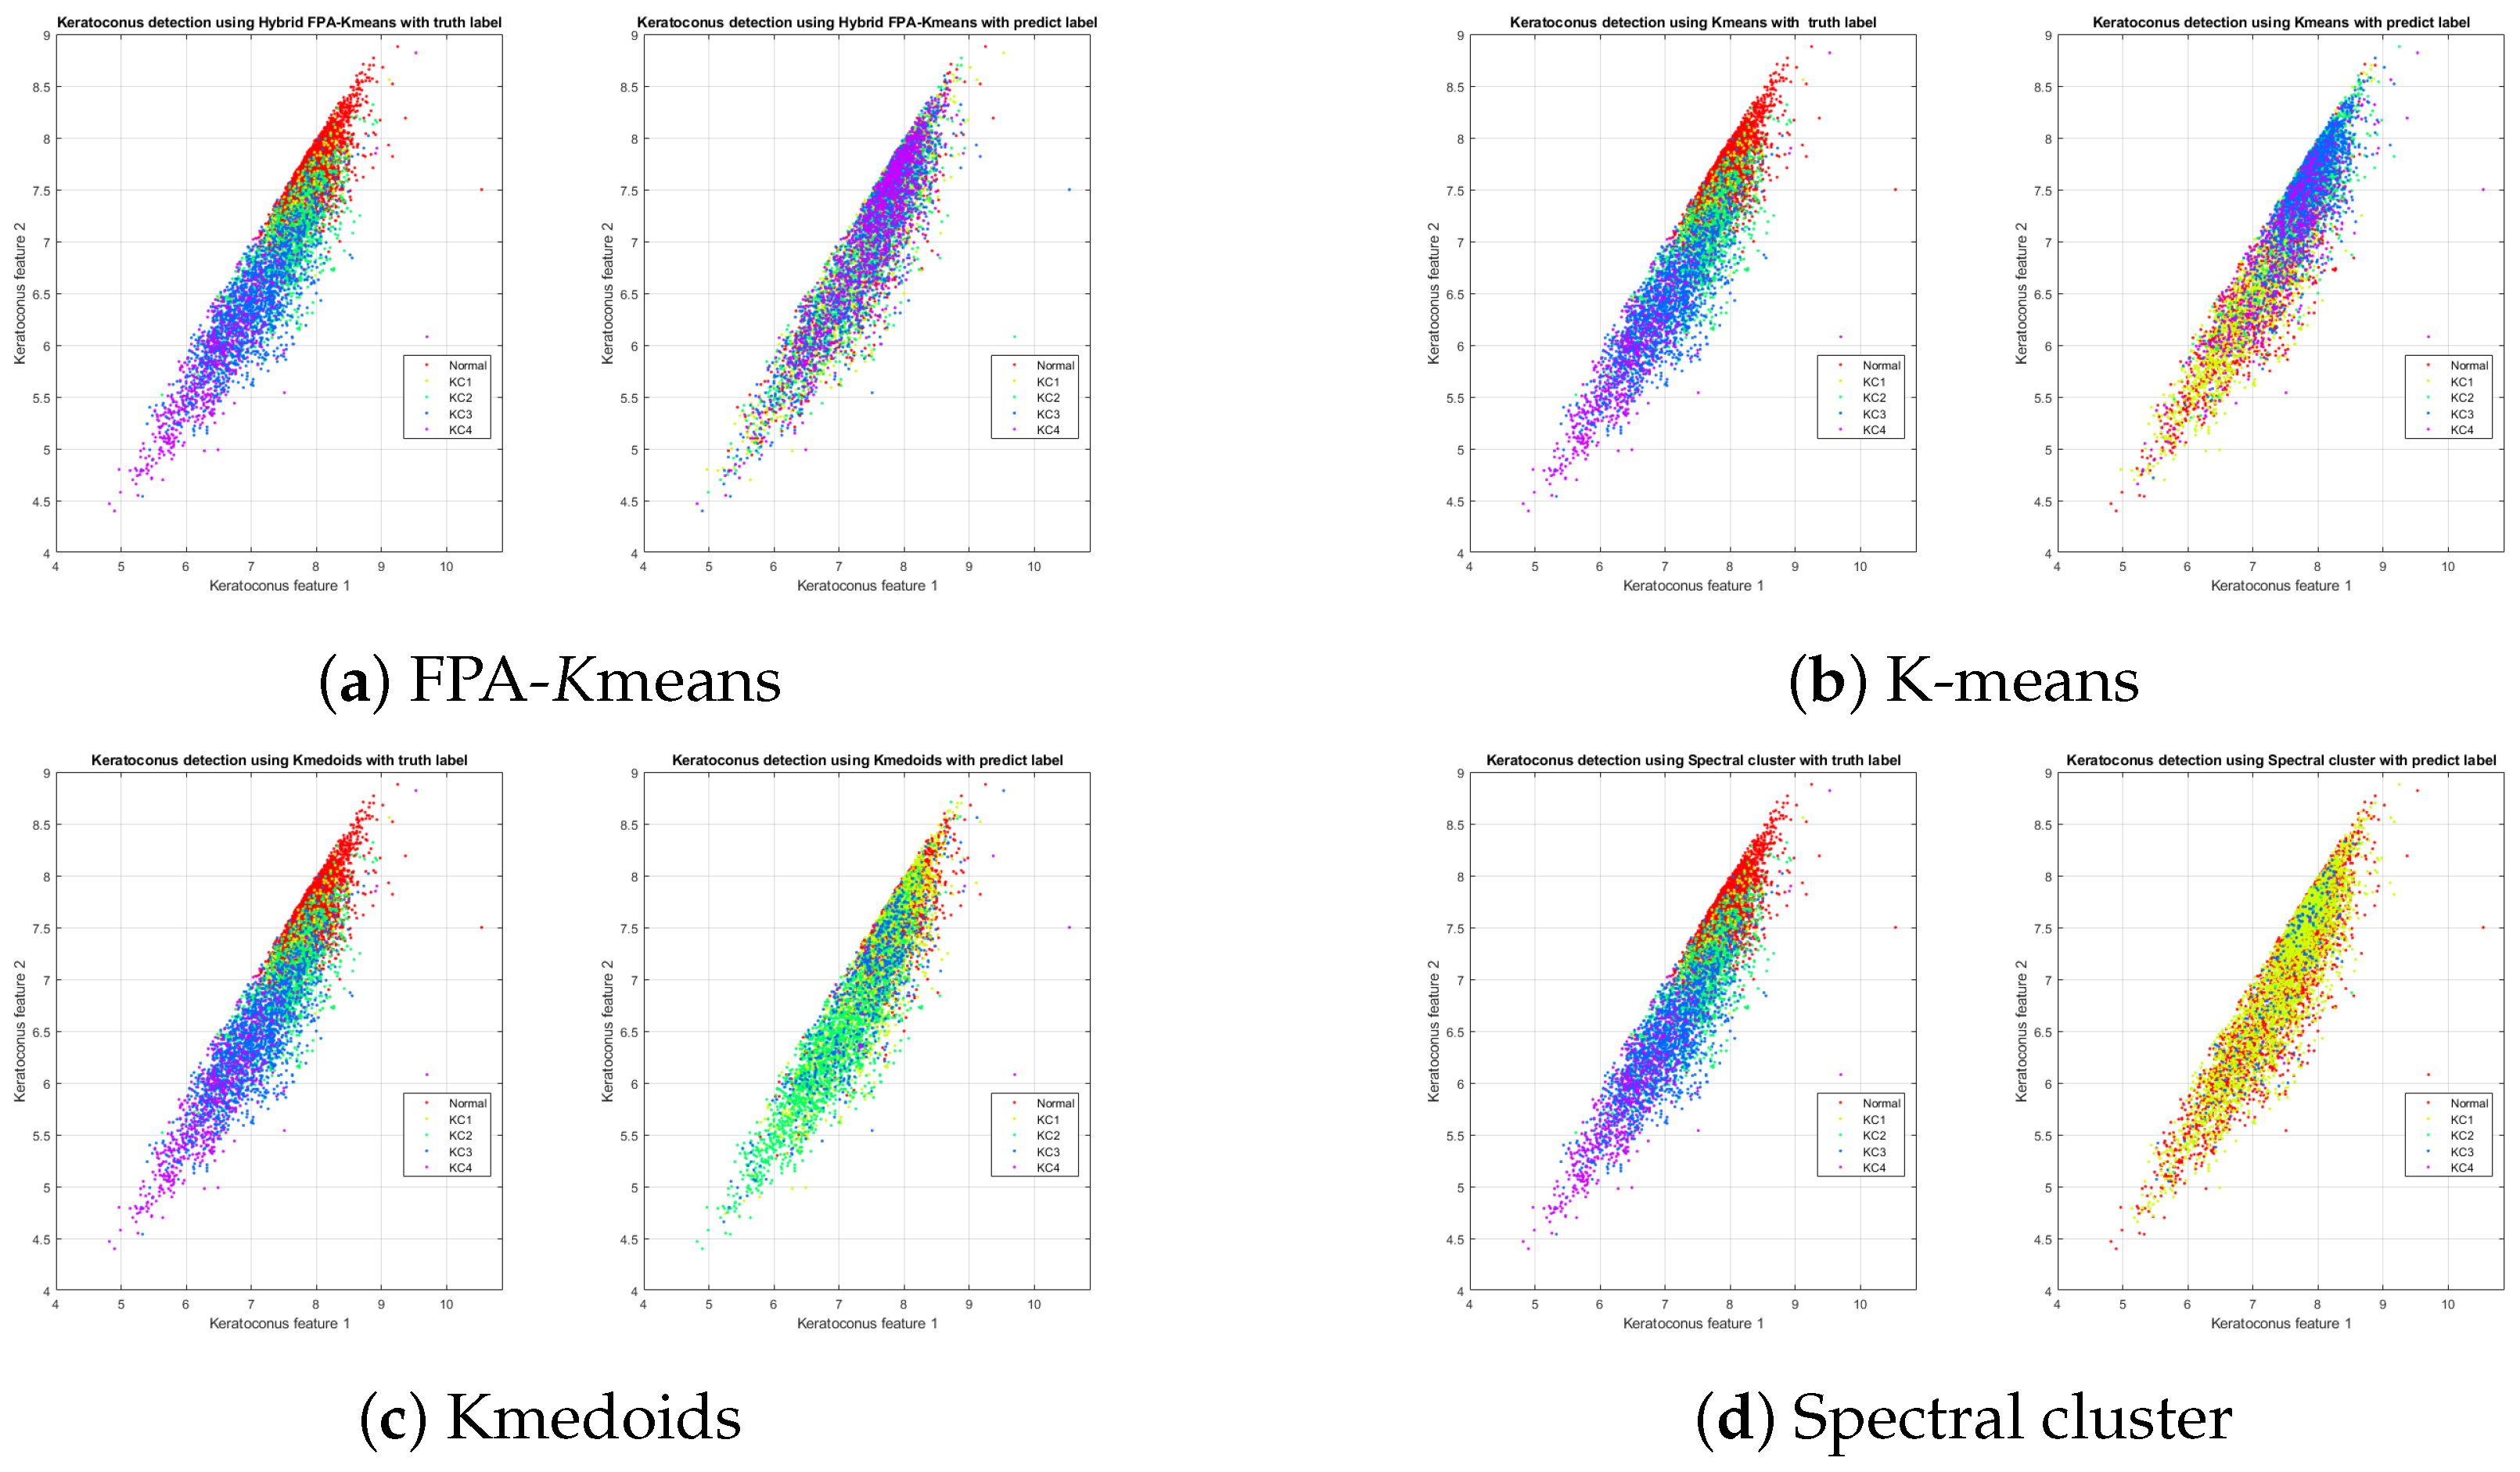
Another evaluation measure is the plotting final the clustring
Figure 6 shows a scattering plotting for the used datasets.
Table 4 shows the comparison with previous machine learning-based studies for KCN detection. It should be noted that most of the previous studies used supervised machine learning classifiers [
18,
20], apart from [
28], where unsupervised machine leaning was used. The unsupervised machine learning used in [
28], included PCA, manifold learning and t-SNE applied on 420 parameters obtained from CASIA corneal machine. Unlike [
28], our study flower pollination algorithm (FPA) and the k-means algorithm and applied it on 50 features of the corneal shape.
Although FPA-k-means outperforms competing methods, it takes longer to reach the optimal solution and is more difficult to predict its generalizability in dealing with novel datasets. Additionally, the computational complexity of the FPA-k-means algorithm was calculated without considering the computational complexity of the objective function here thus not reflecting the overall computational complexity of the problem that may vary based on different applications. The time complexity of FPA-k-means calculated here does not take into account the time complexity of calculating the object function, which varies depending on the complexity of the problem.
6. Conclusions and Future Work
In this paper a new unsupervised machine learning model based on k-means optimization through flower pollination algorithm for detecting KCN from corneal imaging data is proposed. We showed that this model outperforms other unsupervised models including simple k-means based on scenarios with two, three, and five clusters. As the clustering approach does not require pre-labeled data, the model is resistant to expert labeling bias. Validated model could be used in research and clinical practice to monitor the status of the eyes with KCN.
Two different datasets are used in this work consisted of Corneal parameters acquired with Pentacam device (Scheimpflug Imaging, Oculus, Germany) from two independent cohorts in Brazil and Japan with different keratoconus severity levels.
To evaluate the performance of the proposed method (FPAk-means) five measures are calculated: namely recall, accuracy, purity, precision, f-measure. Also, the performance of the proposed method is compared with three differnt clustering methods which are standard K-means, Kmedoids, and Spectral cluster. The proposed method achieved better results for all datasets used.
There are several aspects of this study that can be improved in future studies. First, other independent datasets are warranted to investigate the generalization of findings. Second, the proposed model may be compared against emerging deep learning models. Thirds, improving the computational aspects of the proposed model to work in near real-time situations.
Author Contributions
Conceptualization, S.Y., R.M.H. and H.T.; methodology, Z.A.A.A. and A.H.A.-T.; software, Z.A.A.A., and A.K.A.; validation, Z.A.A.A., R.M.H. and H.J.M.; formal analysis, Z.A.A.A., A.H.A.-T. and A.K.A.; investigation, Z.A.A.A. and S.Y.; resources, S.Y., R.M.H., H.T., J.A.M.F. and M.C.; data curation, R.M.H., H.T., J.A.M.F. and M.C.; writing—original draft preparation, Z.A.A.A., A.H.A.-T. and A.K.A.; writing—review and editing, S.Y., A.H.A.-T., A.L. and R.M.H.; visualization, H.J.M. and A.K.A.; supervision, S.Y.; project administration, S.Y.; funding acquisition, S.Y. All authors have read and agreed to the published version of the manuscript.
Funding
The APC was funded by the Department of Ophthalmology of the University of Tennessee Health Science Center (UTHSC) in Memphis through Siamak Yousefi’s laboratory.
Institutional Review Board Statement
The study was conducted according to the guidelines of the Declaration of Helsinki, and approved by the Ethic Committee: CEP-UNIFESP of Federal University of São Paulo (Protocol code CAAE: 28091019.3.0000.5505 20/08/2021).
Informed Consent Statement
Informed consent was obtained from all subjects involved in the study.
Data Availability Statement
The first dataset used in this study from Brazil was collected from the Department of Ophthalmology and Visual Sciences, Paulista Medical School, Federal University of São Paulo, São Paulo, Brazil. The second dataset from Japan was collected from the Department of Ophthalmology, Jichi Medical University, Tochigi hospital.
Acknowledgments
The authors would like to acknowledge University of Tennessee for supporting research under grant number TS1234.
Conflicts of Interest
The authors declare that they have no conflicts of interests.
References
- Rabinowitz, Y.S. Keratoconus. Surv. Ophthalmol. 1998, 42, 297–319. [Google Scholar] [CrossRef] [PubMed]
- Lavric, A.; Anchidin, L.; Popa, V.; Al-Timemy, A.H.; Alyasseri, Z.; Takahashi, H.; Yousefi, S.; Hazarbassanov, R.M. Keratoconus severity detection from elevation, topography and pachymetry raw data using a machine learning approach. IEEE Access 2021, 9, 84344–84355. [Google Scholar] [CrossRef]
- Zarbin, M.A. Artificial intelligence: Quo vadis? Transl. Vis. Sci. Technol. 2020, 9, 1. [Google Scholar] [CrossRef] [PubMed]
- Gulshan, V.; Peng, L.; Coram, M.; Stumpe, M.C.; Wu, D.; Narayanaswamy, A.; Venugopalan, S.; Widner, K.; Madams, T.; Cuadros, J.; et al. Development and validation of a deep learning algorithm for detection of diabetic retinopathy in retinal fundus photographs. JAMA 2016, 316, 2402–2410. [Google Scholar] [CrossRef] [PubMed]
- Ting, D.S.W.; Cheung, C.Y.L.; Lim, G.; Tan, G.S.W.; Quang, N.D.; Gan, A.; Hamzah, H.; Garcia-Franco, R.; San Yeo, I.Y.; Lee, S.Y.; et al. Development and validation of a deep learning system for diabetic retinopathy and related eye diseases using retinal images from multiethnic populations with diabetes. JAMA 2017, 318, 2211–2223. [Google Scholar] [CrossRef]
- Li, X.; Hu, X.; Yu, L.; Zhu, L.; Fu, C.W.; Heng, P.A. CANet: Cross-disease attention network for joint diabetic retinopathy and diabetic macular edema grading. IEEE Trans. Med. Imaging 2019, 39, 1483–1493. [Google Scholar] [CrossRef]
- Campbell, J.P.; Kim, S.J.; Brown, J.M.; Ostmo, S.; Chan, R.P.; Kalpathy-Cramer, J.; Chiang, M.F.; Sonmez, K.; Schelonka, R.; Jonas, K.; et al. Evaluation of a Deep Learning–Derived Quantitative Retinopathy of Prematurity Severity Scale. Ophthalmology 2021, 128, 1070–1076. [Google Scholar] [CrossRef]
- Burlina, P.; Freund, D.E.; Joshi, N.; Wolfson, Y.; Bressler, N.M. Detection of age-related macular degeneration via deep learning. In Proceedings of the 2016 IEEE 13th International Symposium on Biomedical Imaging (ISBI), Prague, Czech Republic, 13–16 April 2016; pp. 184–188. [Google Scholar]
- Thompson, A.C.; Jammal, A.A.; Berchuck, S.I.; Mariottoni, E.B.; Medeiros, F.A. Assessment of a segmentation-free deep learning algorithm for diagnosing glaucoma from optical coherence tomography scans. JAMA Ophthalmol. 2020, 138, 333–339. [Google Scholar] [CrossRef]
- Thakur, A.; Goldbaum, M.; Yousefi, S. Predicting glaucoma before onset using deep learning. Ophthalmol. Glaucoma 2020, 3, 262–268. [Google Scholar] [CrossRef]
- Sun, J.; Huang, X.; Egwuagu, C.; Badr, Y.; Dryden, S.C.; Fowler, B.T.; Yousefi, S. Identifying mouse autoimmune uveitis from fundus photographs using deep learning. Transl. Vis. Sci. Technol. 2020, 9, 59. [Google Scholar] [CrossRef]
- Lin, S.R.; Ladas, J.G.; Bahadur, G.G.; Al-Hashimi, S.; Pineda, R. A review of machine learning techniques for keratoconus detection and refractive surgery screening. In Seminars in Ophthalmology; Taylor & Francis: London, UK, 2019; Volume 34, pp. 317–326. [Google Scholar]
- Hazarbassanov, R.M.; Lavric, A.; Milhomens Filho, J.A.P.; Anchidin, L.; Popa, V.; Al-Timemy, A.H.; Alyasseri, Z.; Takahashi, H.; Yousefi, S. Evaluation of keratoconus detection from elevation, topography and pachymetry raw data using machine learning. Investig. Ophthalmol. Vis. Sci. 2021, 62, 2154. [Google Scholar]
- Rim, T.H.; Lee, A.Y.; Ting, D.S.; Teo, K.; Betzler, B.K.; Teo, Z.L.; Yoo, T.K.; Lee, G.; Kim, Y.; Lin, A.C.; et al. Detection of features associated with neovascular age-related macular degeneration in ethnically distinct data sets by an optical coherence tomography: Trained deep learning algorithm. Br. J. Ophthalmol. 2021, 105, 1133–1139. [Google Scholar] [CrossRef] [PubMed]
- Takahashi, H.; Al-Timemy, A.H.; Mosa, Z.M.; Alyasseri, Z.; Lavric, A.; Milhomens Filho, J.A.P.; Yuda, K.; Hazarbassanov, R.M.; Yousefi, S. Detecting keratoconus severity from corneal data of different populations with machine learning. Investig. Ophthalmol. Vis. Sci. 2021, 62, 2145. [Google Scholar]
- World Medical Association. World Medical Association Declaration of Helsinki. Ethical principles for medical research involving human subjects. Bull. World Health Organ. 2001, 79, 373. [Google Scholar]
- Cao, K.; Verspoor, K.; Sahebjada, S.; Baird, P.N. Evaluating the performance of various machine learning algorithms to detect subclinical keratoconus. Transl. Vis. Sci. Technol. 2020, 9, 24. [Google Scholar] [CrossRef]
- Lavric, A.; Popa, V.; Takahashi, H.; Yousefi, S. Detecting keratoconus from corneal imaging data using machine learning. IEEE Access 2020, 8, 149113–149121. [Google Scholar] [CrossRef]
- Marsolo, K.; Twa, M.; Bullimore, M.A.; Parthasarathy, S. Spatial modeling and classification of corneal shape. IEEE Trans. Inf. Technol. Biomed. 2007, 11, 203–212. [Google Scholar] [CrossRef]
- Maeda, N.; Klyce, S.D.; Smolek, M.K. Neural network classification of corneal topography. Preliminary demonstration. Investig. Ophthalmol. Vis. Sci. 1995, 36, 1327–1335. [Google Scholar]
- Mosa, Z.M.; Ghaeb, N.H.; Ali, A.H. Detecting Keratoconus by Using SVM and Decision Tree Classifiers with the Aid of Image Processing. Baghdad Sci. J. 2019, 16, 1022–1029. [Google Scholar]
- Ambrósio, R., Jr.; Alonso, R.S.; Luz, A.; Velarde, L.G.C. Corneal-thickness spatial profile and corneal-volume distribution: Tomographic indices to detect keratoconus. J. Cataract Refract. Surg. 2006, 32, 1851–1859. [Google Scholar] [CrossRef]
- Piñero, D.P.; Alió, J.L.; Alesón, A.; Vergara, M.E.; Miranda, M. Corneal volume, pachymetry, and correlation of anterior and posterior corneal shape in subclinical and different stages of clinical keratoconus. J. Cataract Refract. Surg. 2010, 36, 814–825. [Google Scholar] [CrossRef] [PubMed]
- Pérez, J.F.; Marcos, A.V.; Peña, F.J.M. Early diagnosis of keratoconus: What difference is it making? Br. J. Ophthalmol. 2014, 98, 1465–1466. [Google Scholar] [CrossRef]
- Hwang, E.S.; Perez-Straziota, C.E.; Kim, S.W.; Santhiago, M.R.; Randleman, J.B. Distinguishing highly asymmetric keratoconus eyes using combined Scheimpflug and spectral-domain OCT analysis. Ophthalmology 2018, 125, 1862–1871. [Google Scholar] [CrossRef] [PubMed]
- Lopes, B.T.; Ramos, I.C.; Salomão, M.Q.; Guerra, F.P.; Schallhorn, S.C.; Schallhorn, J.M.; Vinciguerra, R.; Vinciguerra, P.; Price, F.W., Jr.; Price, M.O.; et al. Enhanced tomographic assessment to detect corneal ectasia based on artificial intelligence. Am. J. Ophthalmol. 2018, 195, 223–232. [Google Scholar] [CrossRef] [PubMed]
- Saad, A.; Gatinel, D. Evaluation of total and corneal wavefront high order aberrations for the detection of forme fruste keratoconus. Investig. Ophthalmol. Vis. Sci. 2012, 53, 2978–2992. [Google Scholar] [CrossRef]
- Yousefi, S.; Yousefi, E.; Takahashi, H.; Hayashi, T.; Tampo, H.; Inoda, S.; Arai, Y.; Asbell, P. Keratoconus severity identification using unsupervised machine learning. PLoS ONE 2018, 13, e0205998. [Google Scholar] [CrossRef]
- Zéboulon, P.; Debellemanière, G.; Gatinel, D. Unsupervised learning for large-scale corneal topography clustering. Sci. Rep. 2020, 10, 1–8. [Google Scholar] [CrossRef]
- Yousefi, S.; Takahashi, H.; Hayashi, T.; Tampo, H.; Inoda, S.; Arai, Y.; Tabuchi, H.; Asbell, P. Predicting the likelihood of need for future keratoplasty intervention using artificial intelligence. Ocul. Surf. 2020, 18, 320–325. [Google Scholar] [CrossRef]
- Kanimozhi, R.; Gayathri, R. Keratoconus Detection using Hybrid Density Supervision model with Clustering and Classification Techniques. Des. Eng. 2021, 617–634. [Google Scholar]
- Smolek, M.K.; Klyce, S.D. Current keratoconus detection methods compared with a neural network approach. Investig. Ophthalmol. Vis. Sci. 1997, 38, 2290–2299. [Google Scholar]
- Chastang, P.J.; Borderie, V.M.; Carvajal-Gonzalez, S.; Rostène, W.; Laroche, L. Automated keratoconus detection using the EyeSys videokeratoscope. J. Cataract Refract. Surg. 2000, 26, 675–683. [Google Scholar] [CrossRef]
- Twa, M.D.; Parthasarathy, S.; Roberts, C.; Mahmoud, A.M.; Raasch, T.W.; Bullimore, M.A. Automated decision tree classification of corneal shape. Optom. Vis. Sci. Off. Publ. Am. Acad. Optom. 2005, 82, 1038. [Google Scholar] [CrossRef] [PubMed]
- Blum, C.; Roli, A. Metaheuristics in combinatorial optimization: Overview and conceptual comparison. ACM Comput. Surv. CSUR 2003, 35, 268–308. [Google Scholar] [CrossRef]
- Yang, X.S. Flower pollination algorithm for global optimization. In Proceedings of the International Conference on Unconventional Computing and Natural Computation, Orléans, France, 3–7 September 2012; pp. 240–249. [Google Scholar]
- Alyasseri, Z.A.A.; Khader, A.T.; Al-Betar, M.A.; Awadallah, M.A.; Yang, X.S. Variants of the Flower Pollination Algorithm: A Review. In Nature-Inspired Algorithms and Applied Optimization; Springer: Berlin/Heidelberg, Germany, 2018; pp. 91–118. [Google Scholar]
- Alyasseri, Z.A.A.; Khader, A.T.; Al-Betar, M.A.; Alomari, O.A. Person identification using EEG channel selection with hybrid flower pollination algorithm. Pattern Recognit. 2020, 105, 107393. [Google Scholar] [CrossRef]
- Alyasseri, Z.A.A.; Al-Betar, M.A.; Awadallah, M.A.; Makhadmeh, S.N.; Abasi, A.K.; Doush, I.A.; Alomari, O.A. A hybrid flower pollination with β-hill climbing algorithm for global optimization. J. King Saud Univ. Comput. Inf. Sci. 2021, 34, 4821–4835. [Google Scholar] [CrossRef]
- Abasi, A.K.; Khader, A.T.; Al-Betar, M.A.; Naim, S.; Alyasseri, Z.A.A.; Makhadmeh, S.N. A novel hybrid multi-verse optimizer with K-means for text documents clustering. Neural Comput. Appl. 2020, 32, 17703–17729. [Google Scholar] [CrossRef]
- Abasi, A.K.; Khader, A.T.; Al-Betar, M.A.; Naim, S.; Makhadmeh, S.N.; Alyasseri, Z.A.A. Link-based multi-verse optimizer for text documents clustering. Appl. Soft Comput. 2020, 87, 106002. [Google Scholar] [CrossRef]
- Abasi, A.K.; Khader, A.T.; Al-Betar, M.A.; Naim, S.; Makhadmeh, S.N.; Alyasseri, Z.A.A. A novel ensemble statistical topic extraction method for scientific publications based on optimization clustering. Multimed. Tools Appl. 2021, 80, 37–82. [Google Scholar] [CrossRef]
- Abasi, A.K.; Khader, A.T.; Al-Betar, M.A.; Naim, S.; Alyasseri, Z.A.A.; Makhadmeh, S.N. An ensemble topic extraction approach based on optimization clusters using hybrid multi-verse optimizer for scientific publications. J. Ambient Intell. Humaniz. Comput. 2021, 12, 2765–2801. [Google Scholar] [CrossRef]
- World Medical Association. World Medical Association Declaration of Helsinki: Ethical principles for medical research involving human subjects. JAMA 2013, 310, 2191–2194. [Google Scholar] [CrossRef]
- Abasi, A.K.; Khader, A.T.; Al-Betar, M.A.; Naim, S.; Awadallah, M.A.; Alomari, O.A. Text documents clustering using modified multi-verse optimizer. Int. J. Electr. Comput. Eng. 2020, 10, 6361–6369. [Google Scholar] [CrossRef]
- Hazarbassanov, R.M.; Alyasseri, Z.A.A.; Al-Timemy, A.; Lavric, A.; Abasi, A.K.; Takahashi, H.; Milhomens Filho, J.A.; Campos, M.; Yousefi, S. Detecting keratoconus on two different populations using an unsupervised hybrid artificial intelligence model. Investig. Ophthalmol. Vis. Sci. 2022, 63, 2088-F0077. [Google Scholar]
- Alyasseri, Z.A.A.; Abasi, A.K.; Al-Betar, M.A.; Makhadmeh, S.N.; Papa, J.P.; Abdullah, S.; Khader, A.T. EEG-Based Person Identification Using Multi-Verse Optimizer as Unsupervised Clustering Techniques. In Evolutionary Data Clustering: Algorithms and Applications; Springer: Singapore, 2021; p. 89. [Google Scholar]
- Abasi, A.K.; Khader, A.T.; Al-Betar, M.A.; Naim, S.; Makhadmeh, S.N.; Alyasseri, Z.A.A. A text feature selection technique based on binary multi-verse optimizer for text clustering. In Proceedings of the 2019 IEEE Jordan International Joint Conference on Electrical Engineering and Information Technology (JEEIT), Amman, Jordan, 9–11 April 2019; pp. 1–6. [Google Scholar]
| Publisher’s Note: MDPI stays neutral with regard to jurisdictional claims in published maps and institutional affiliations. |
© 2022 by the authors. Licensee MDPI, Basel, Switzerland. This article is an open access article distributed under the terms and conditions of the Creative Commons Attribution (CC BY) license (https://creativecommons.org/licenses/by/4.0/).


 ,
, 


