

Exploring Pandemics Events on Twitter by Using Sentiment Analysis and Topic Modelling


Abstract
1. Introduction
- RQ1
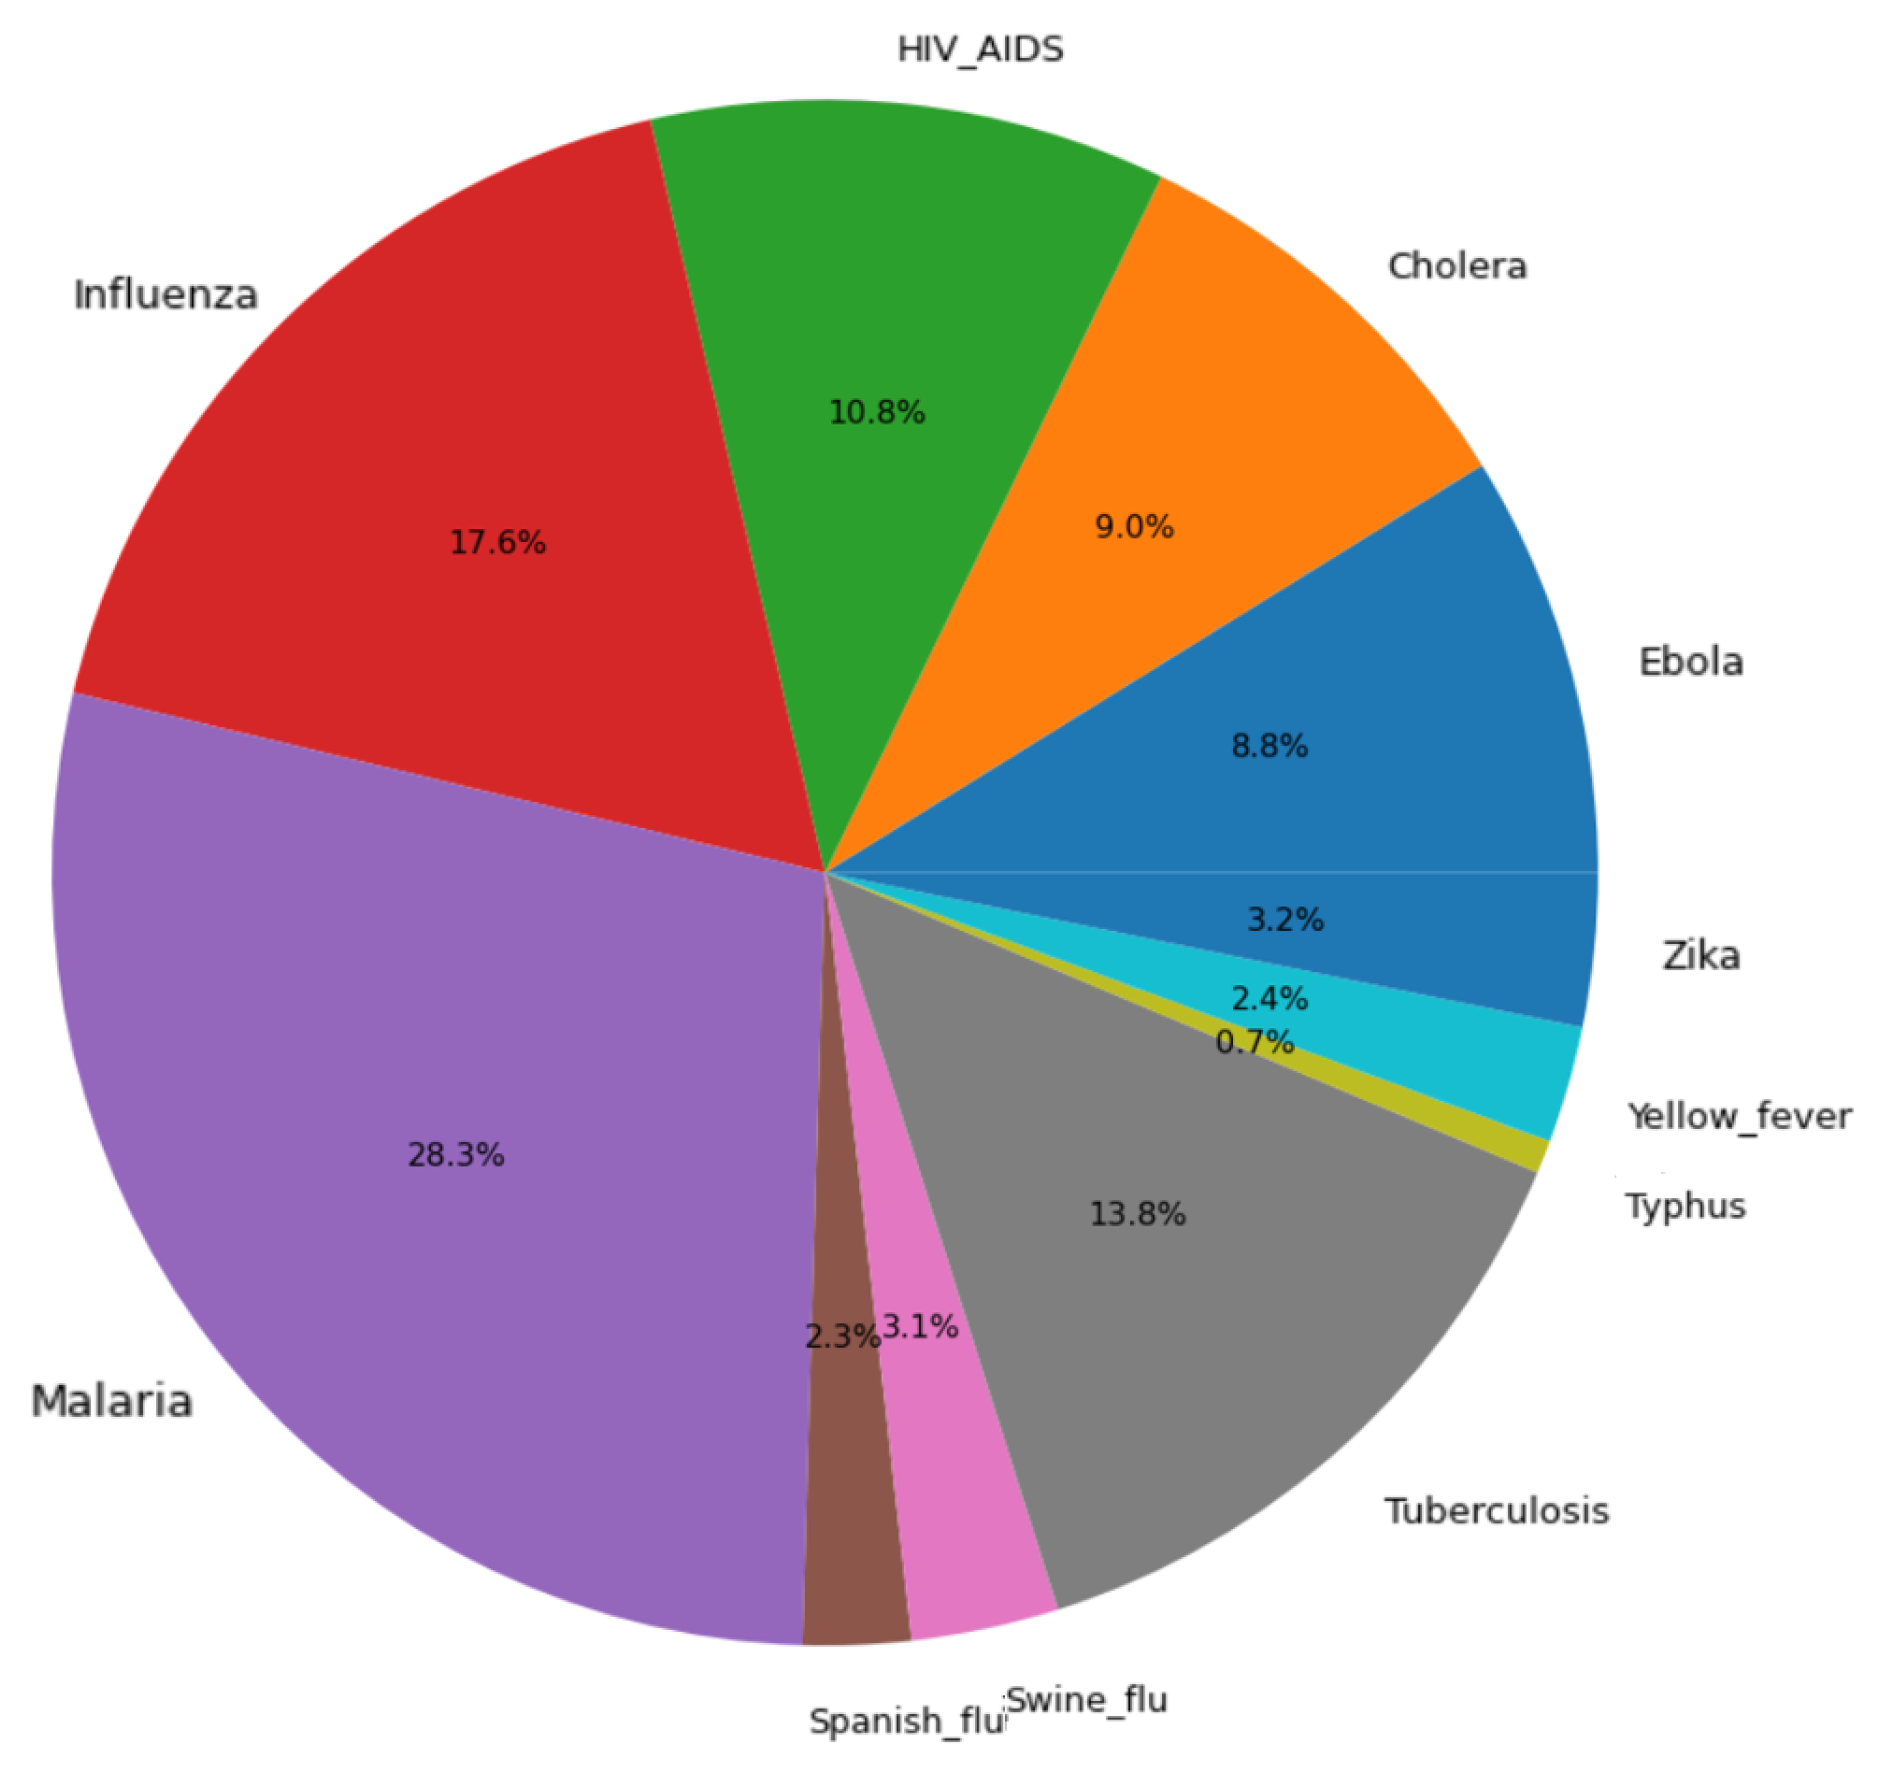
- Which pandemics have more discussion on social media? What is the trend of these discussions over time?
- RQ2
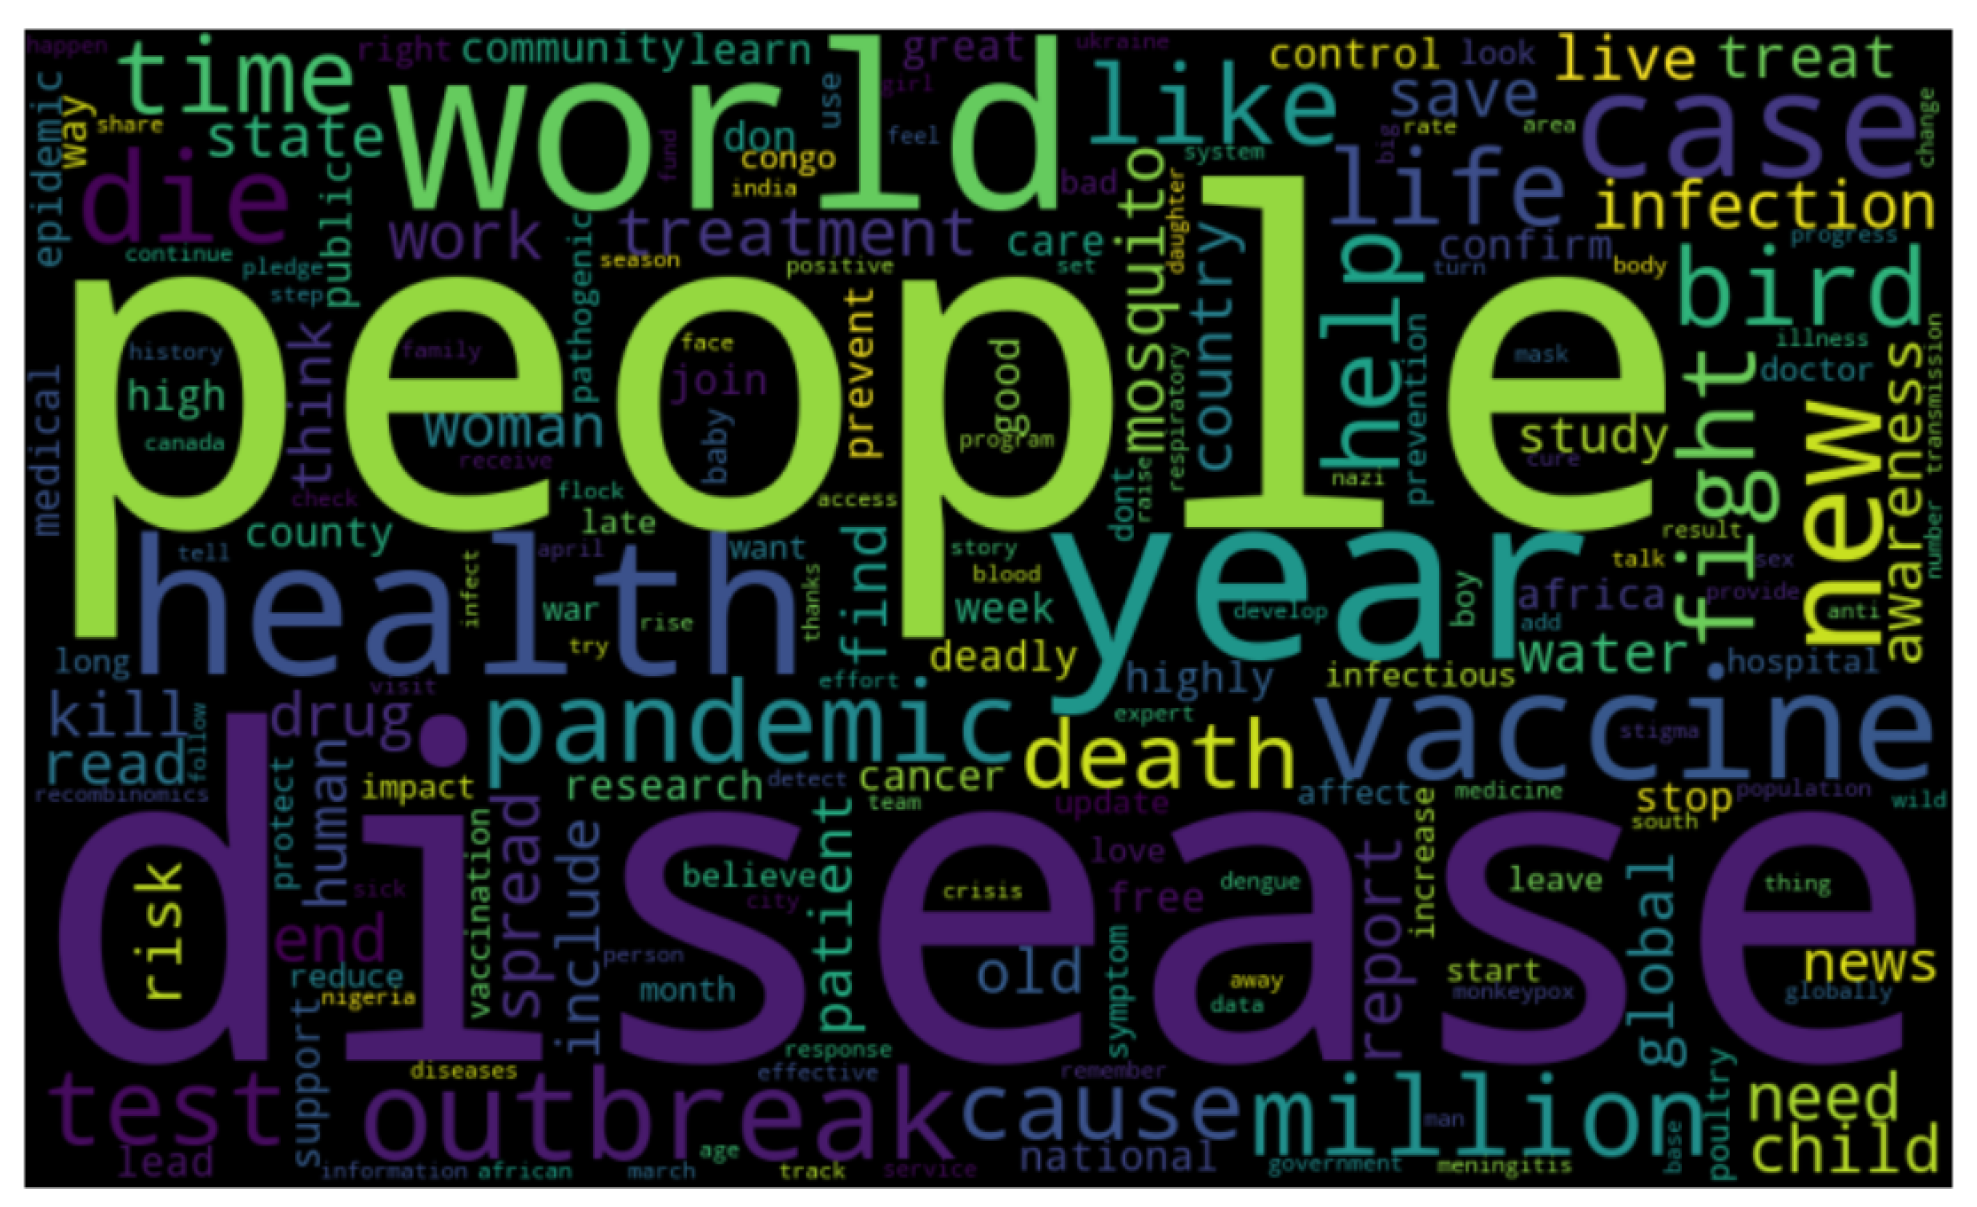
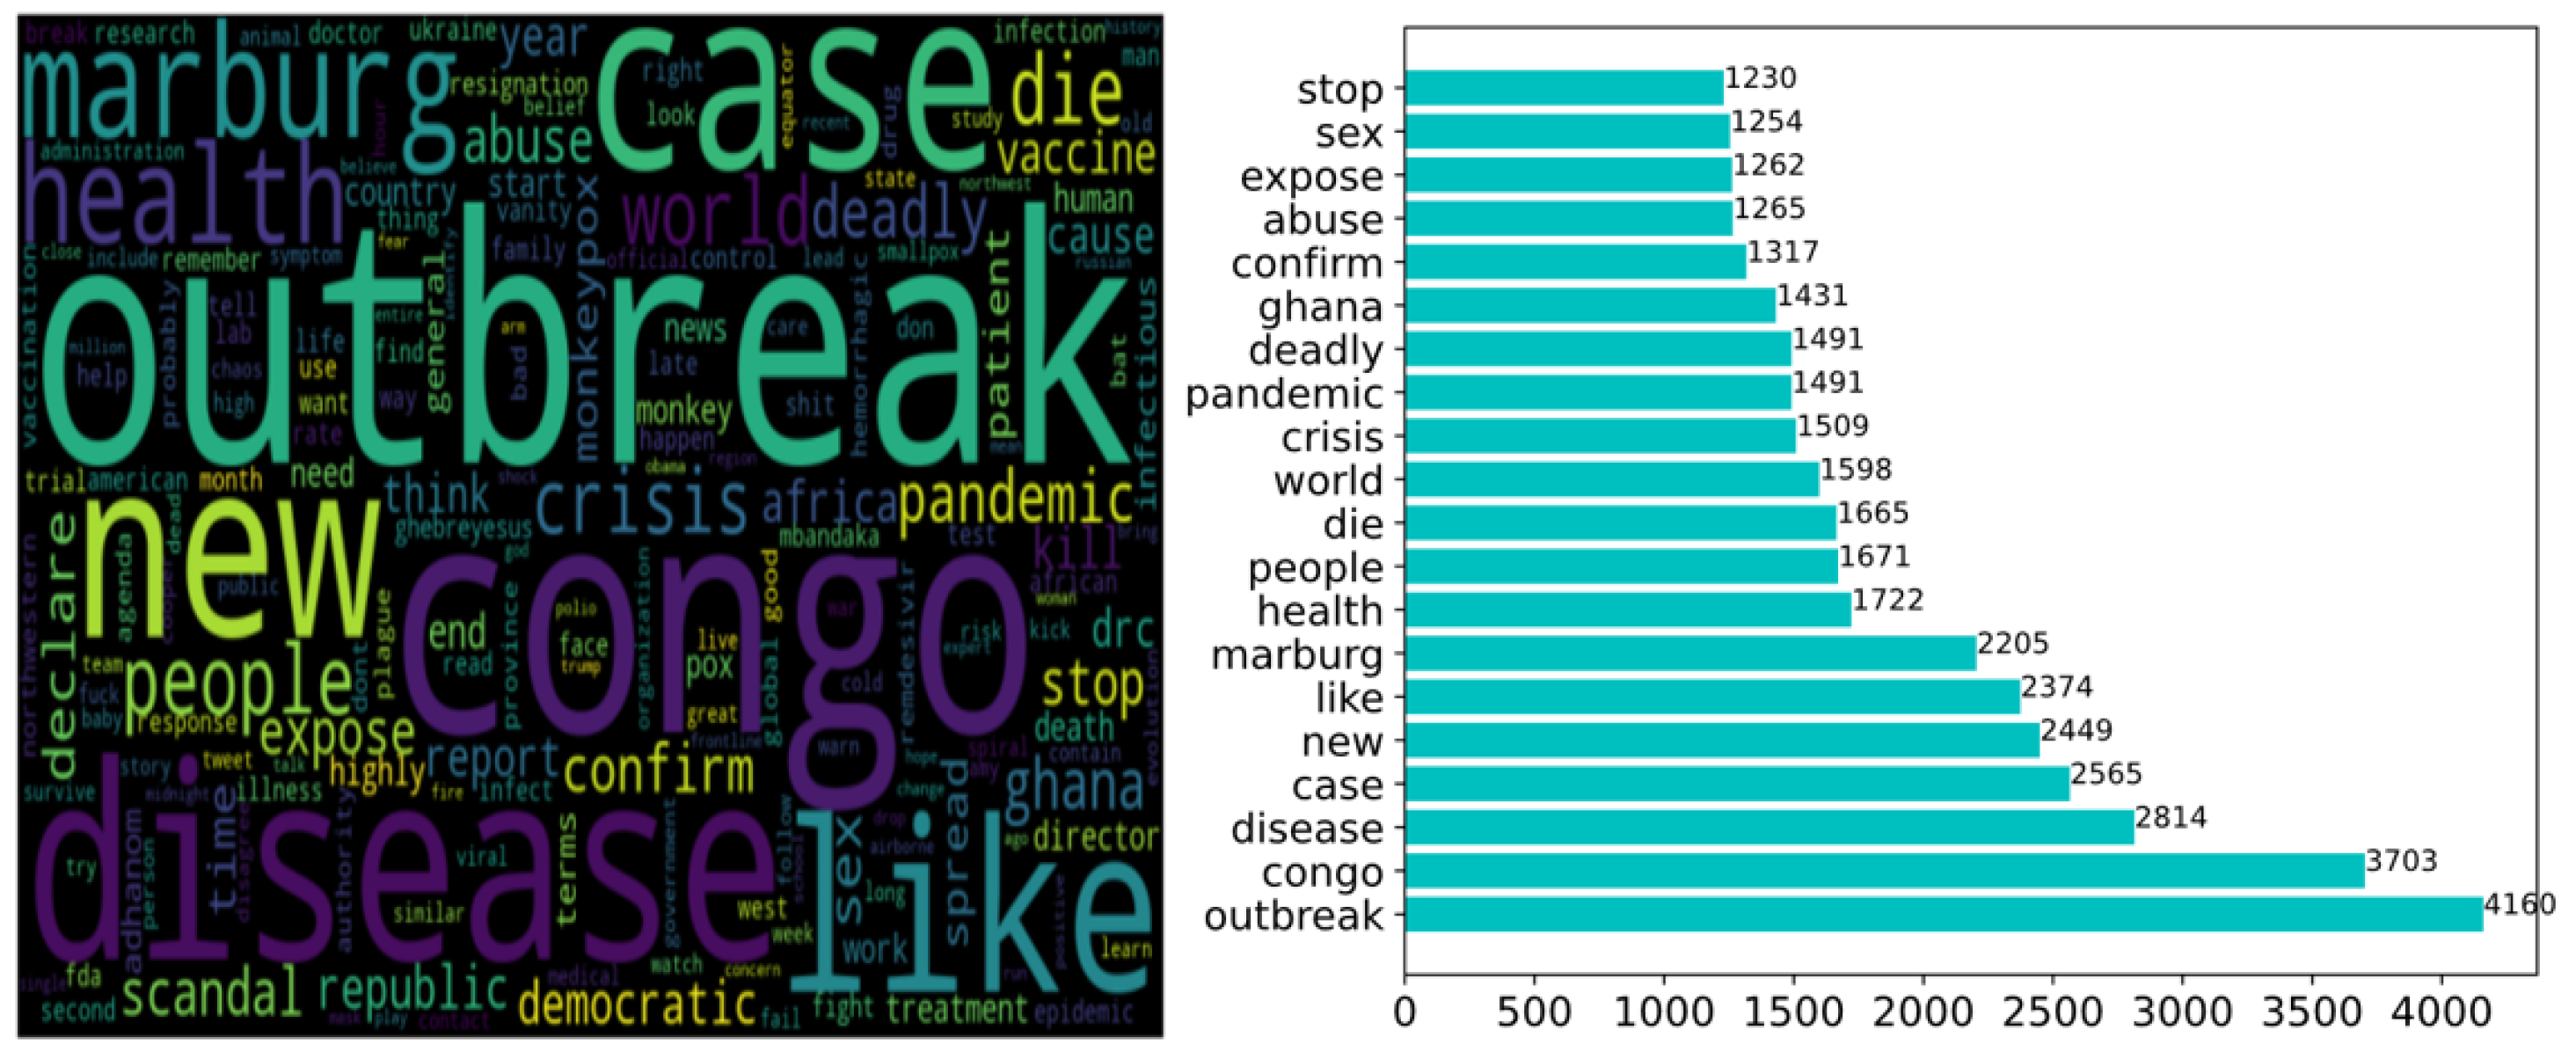
- What are people’s concerns related to these pandemics?
- RQ3
- What are people’s attitudes or emotions to these epidemics?
- RQ4
- How can the mined information help or guide us in real life?
2. Related Works
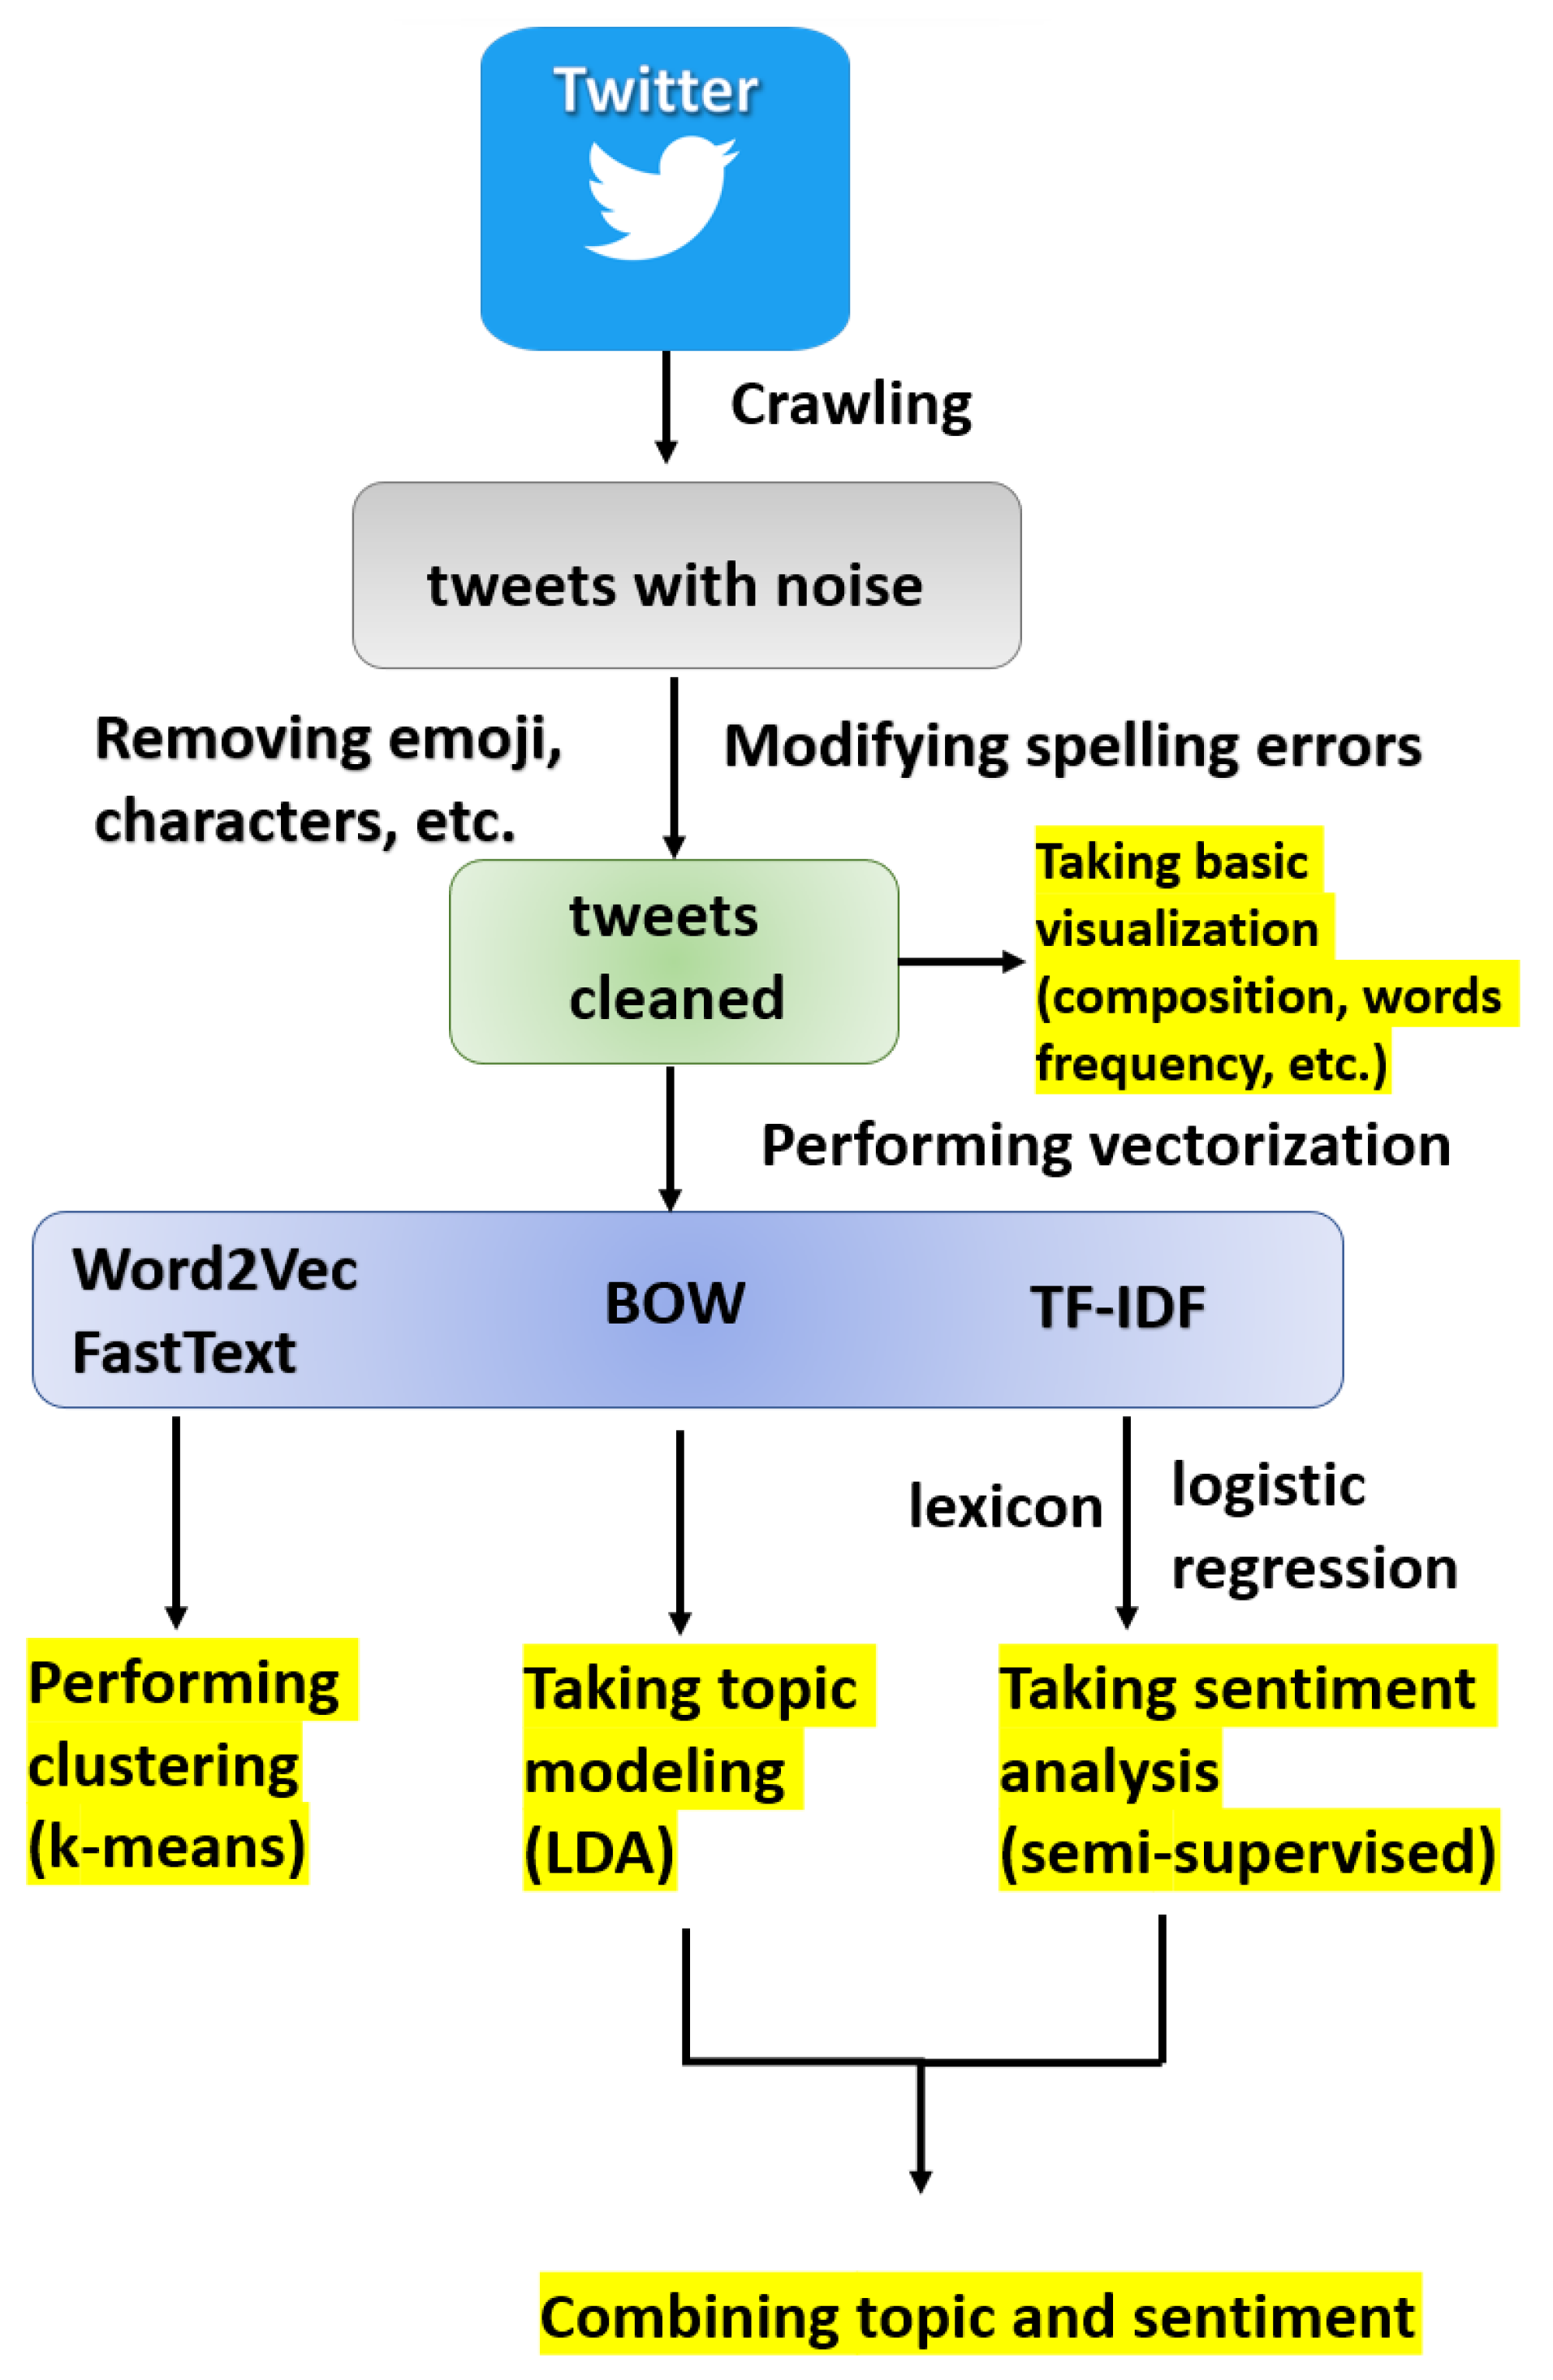
3. Methodology
- Removing user names, hashtags, URLs, non-ASCII characters, numbers, punctuation, and special characters by using regular expressions;
- Making lowercase;
- Removing stop words that are common words (such as the, is, at, which, and on) but have no real meaning by using the spacy package [26];
- Performing lemmatisation to recover a word to its original form (e.g., transforming ate into eat) by using WordNetLemmatizer package [27];
- Correcting spelling errors by using the autocorrect package [28].
4. Exploring Data
5. Vectorisation
6. Clustering
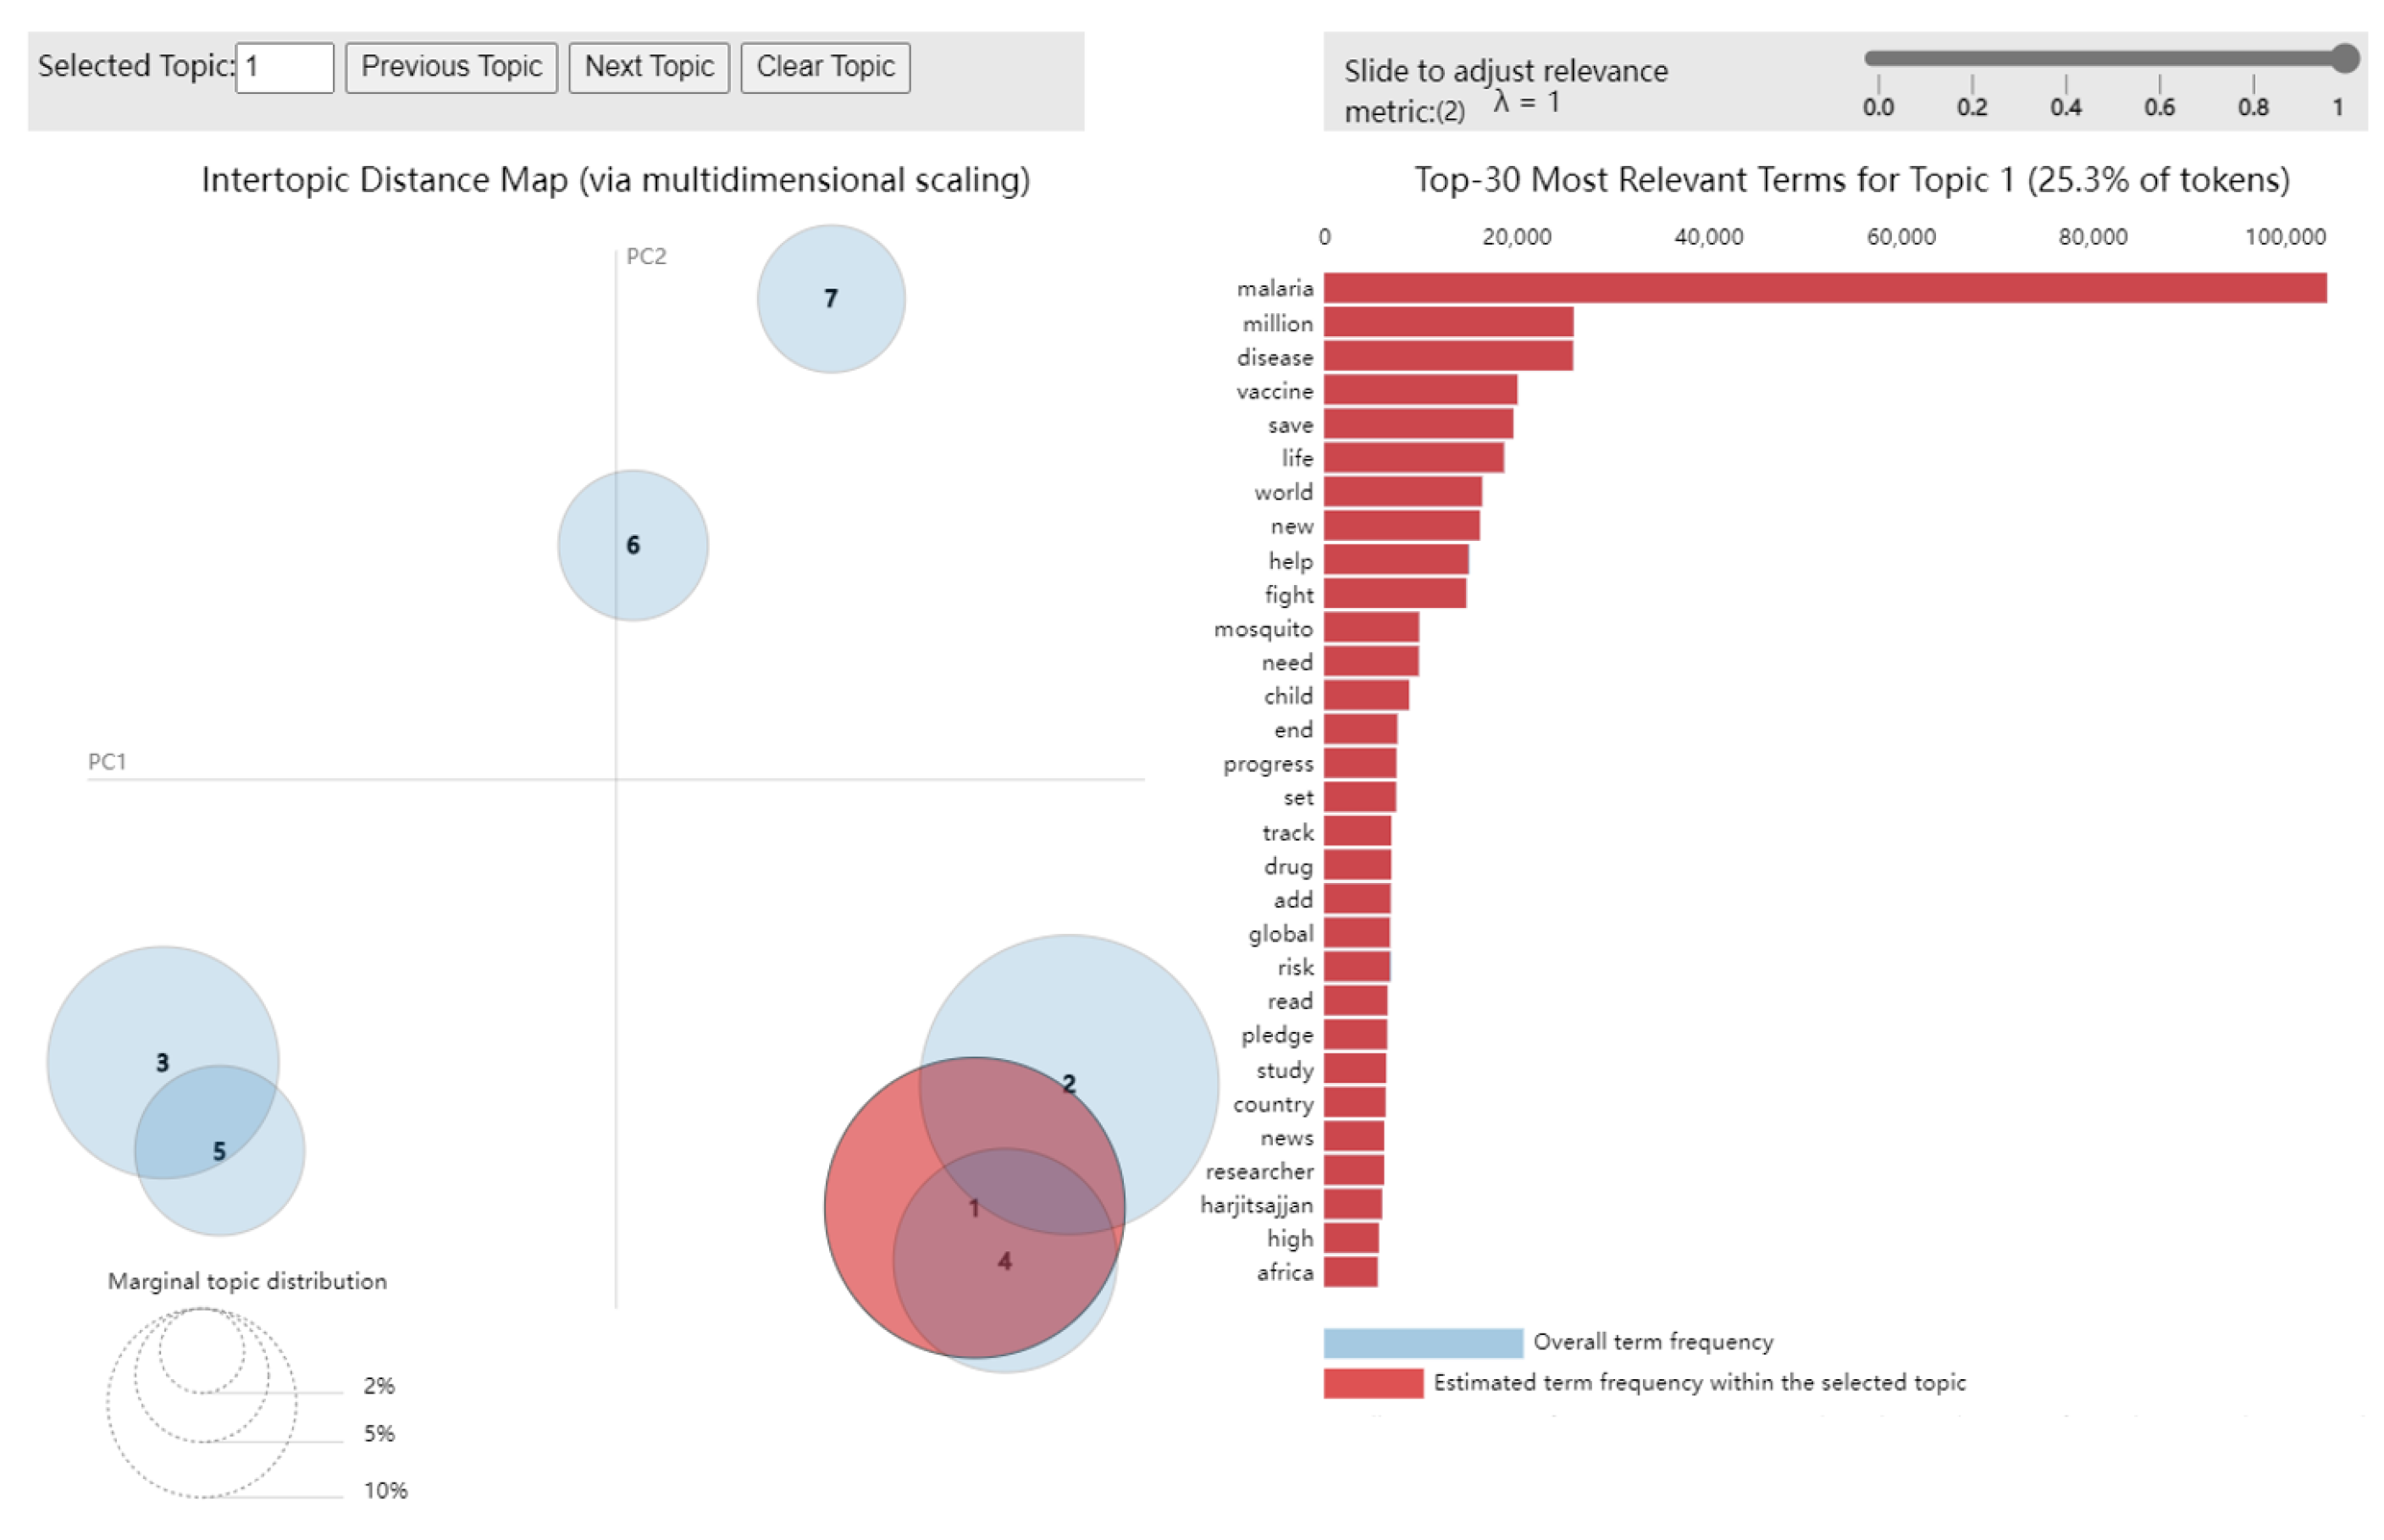
7. Topic Modelling
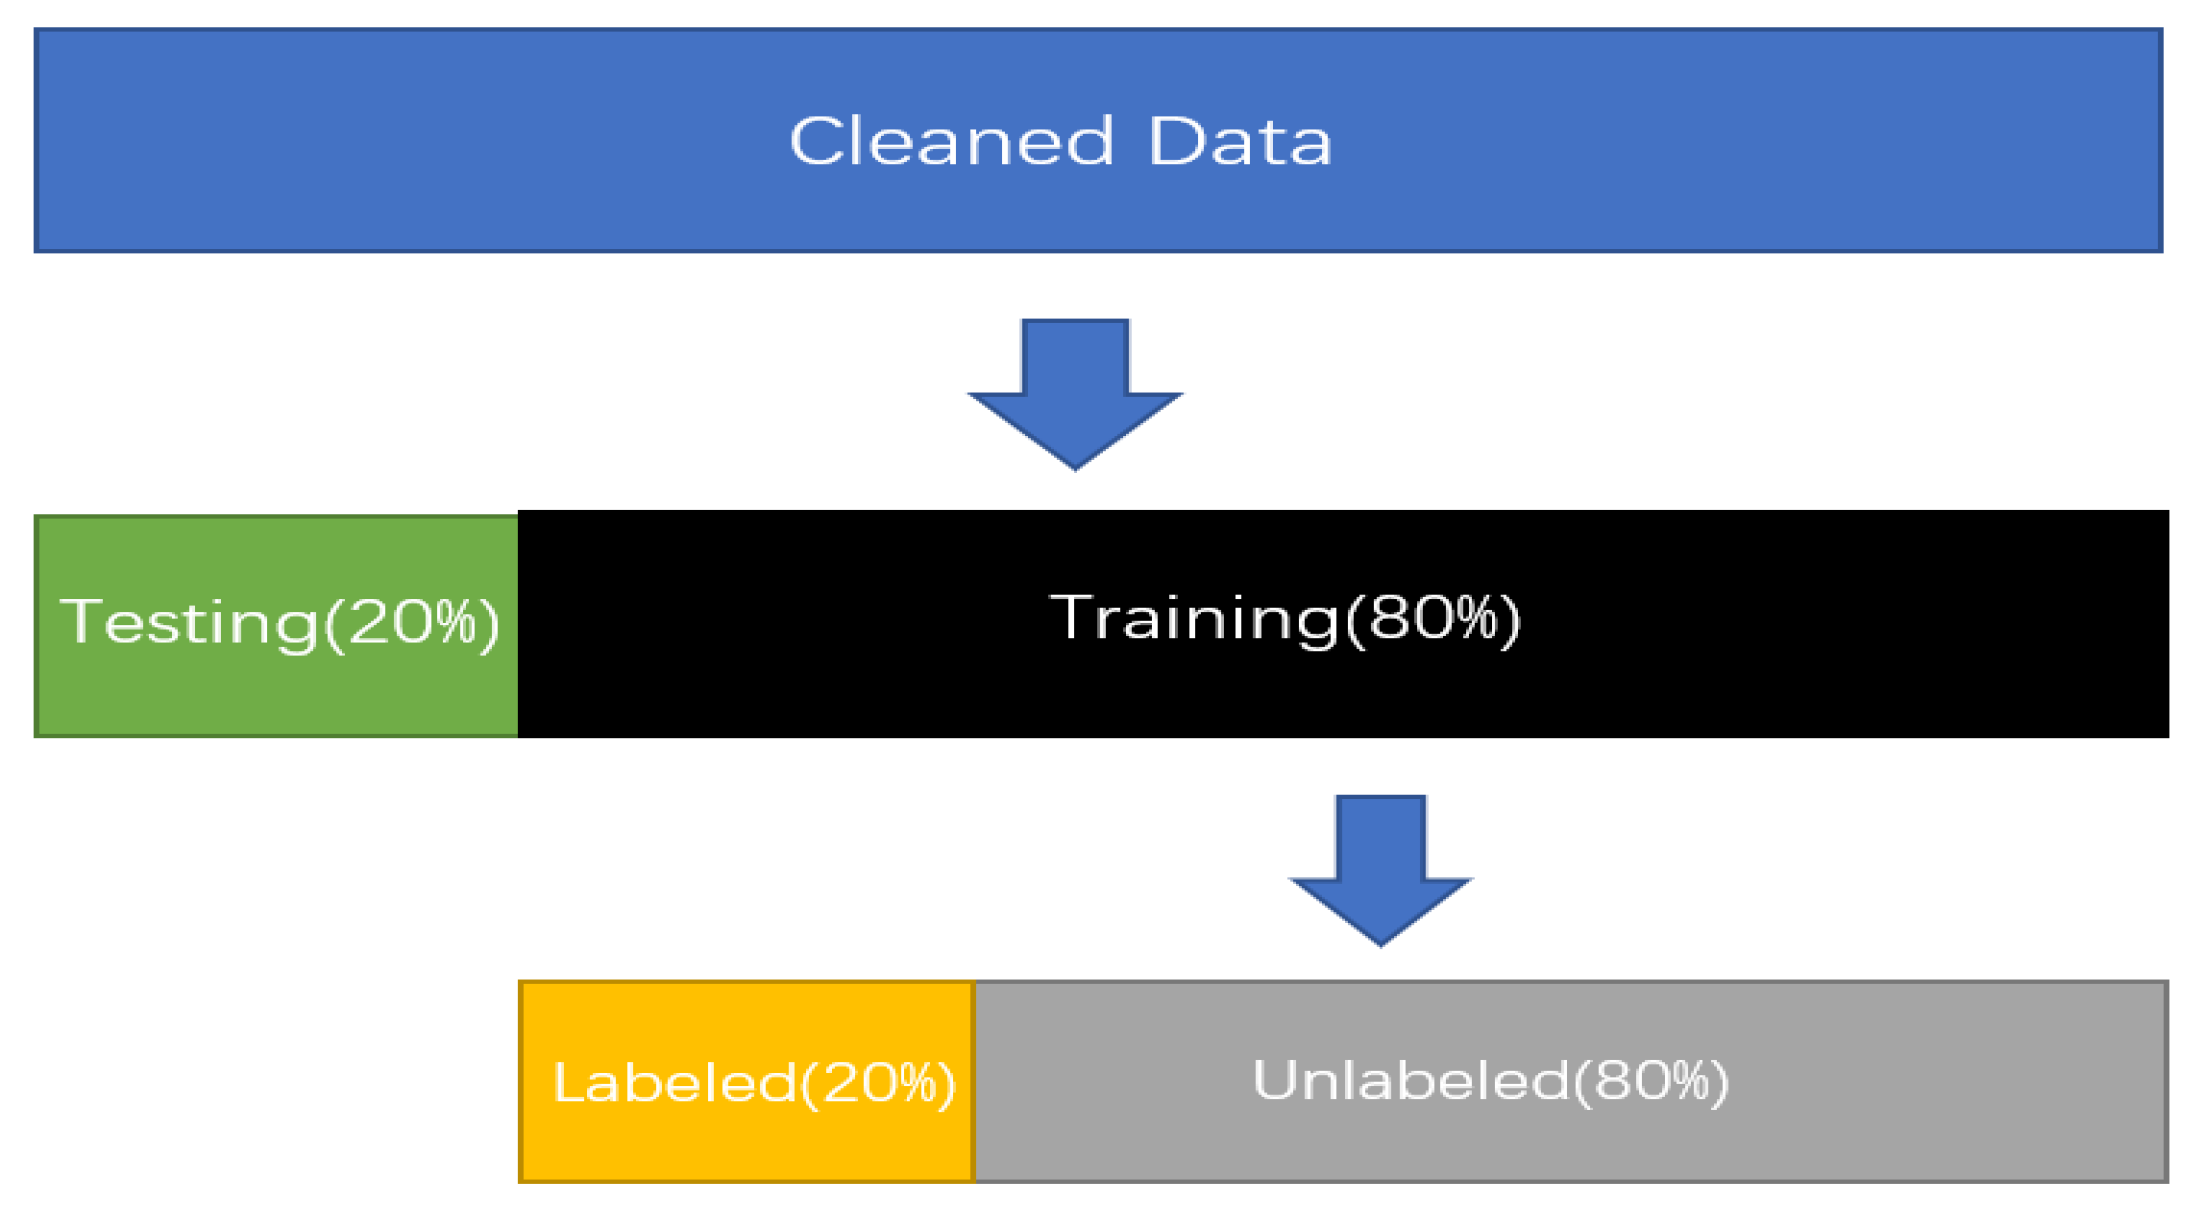
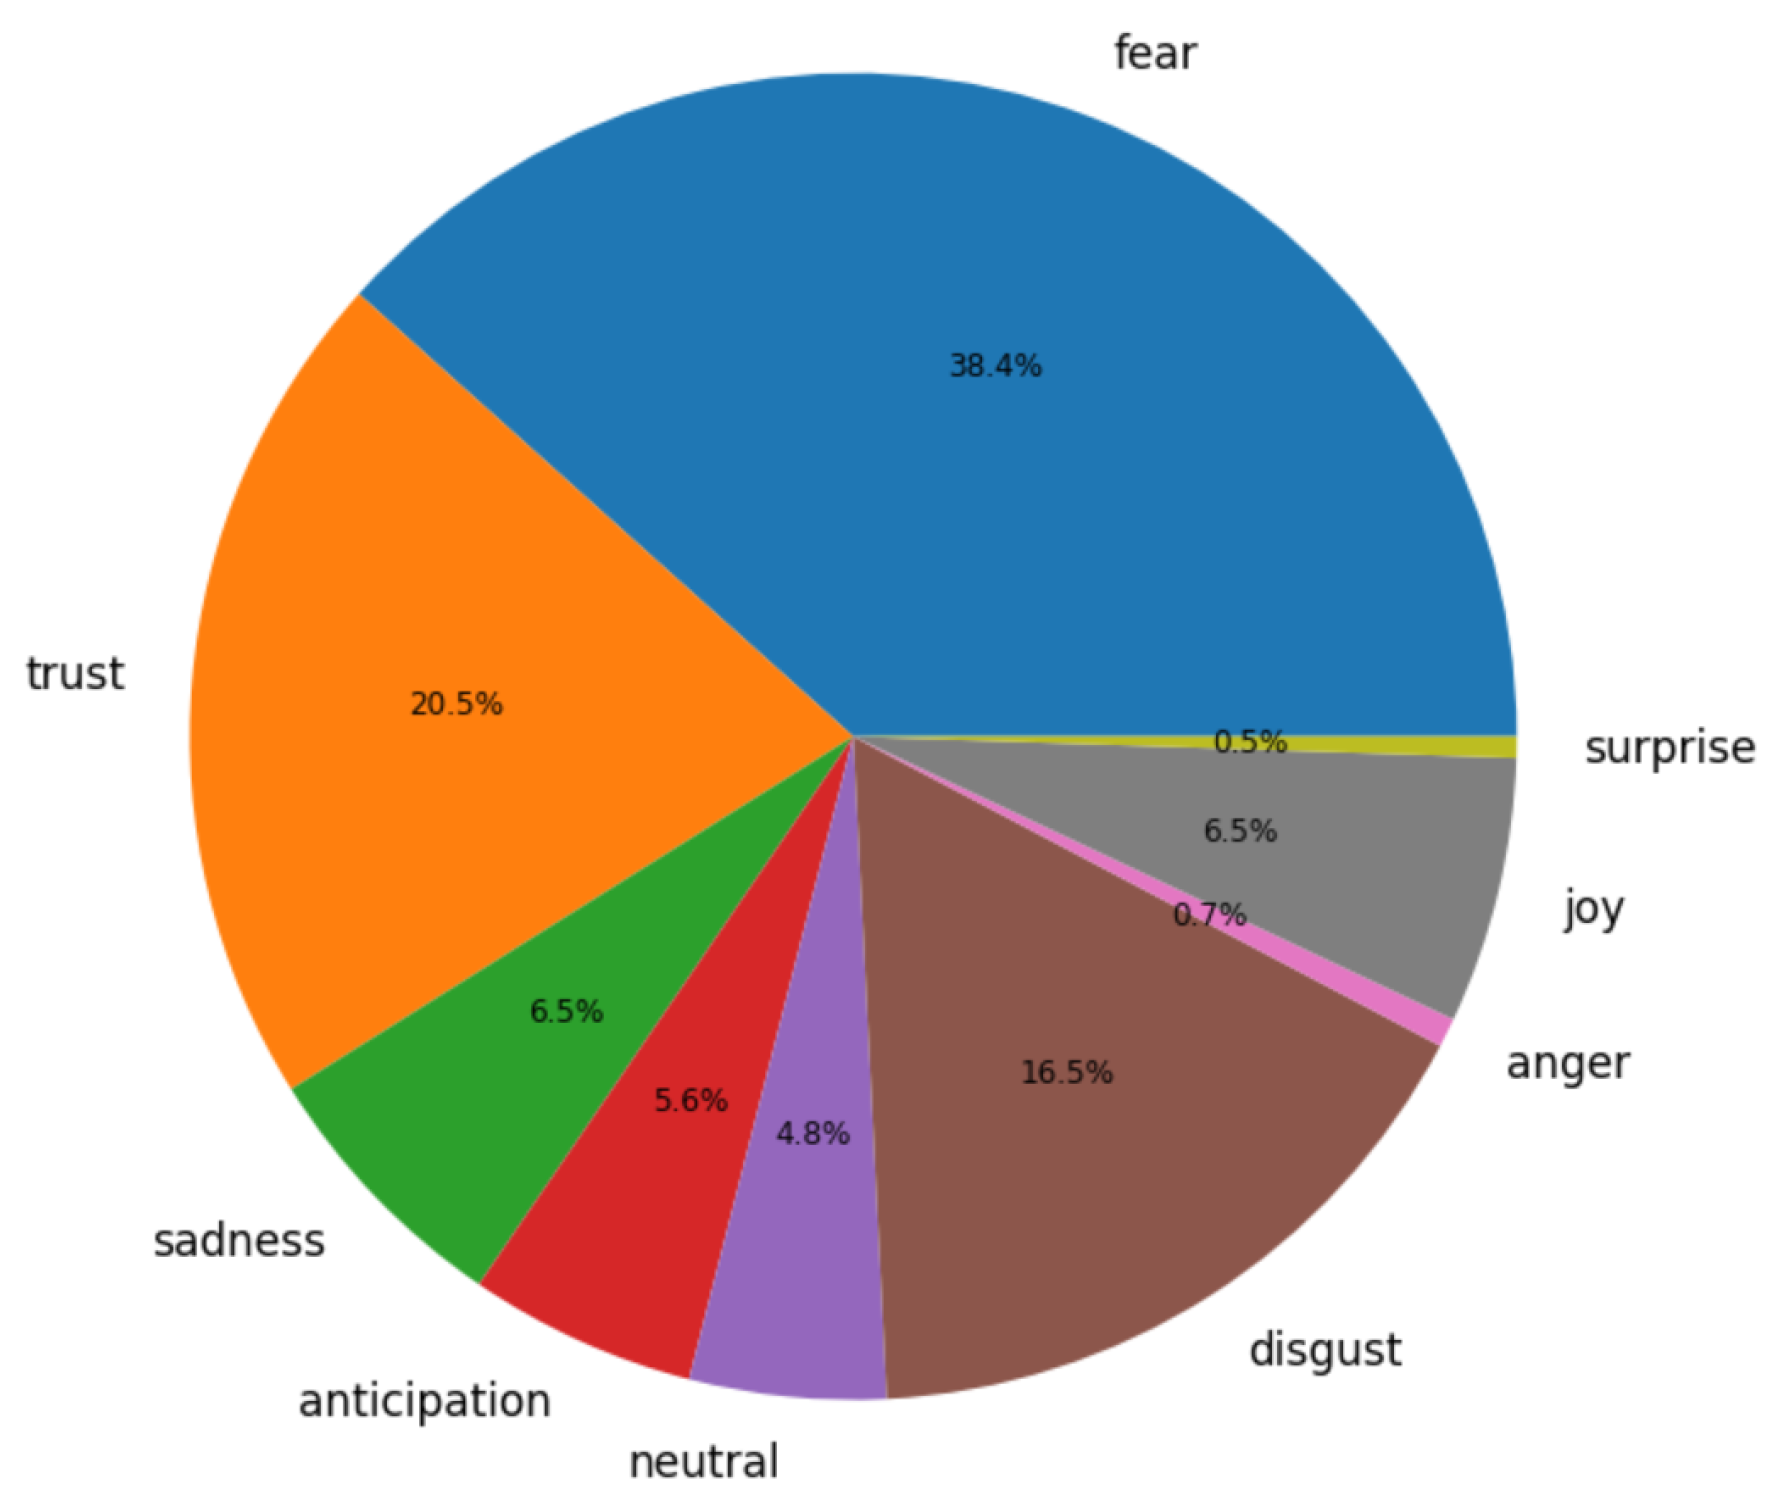
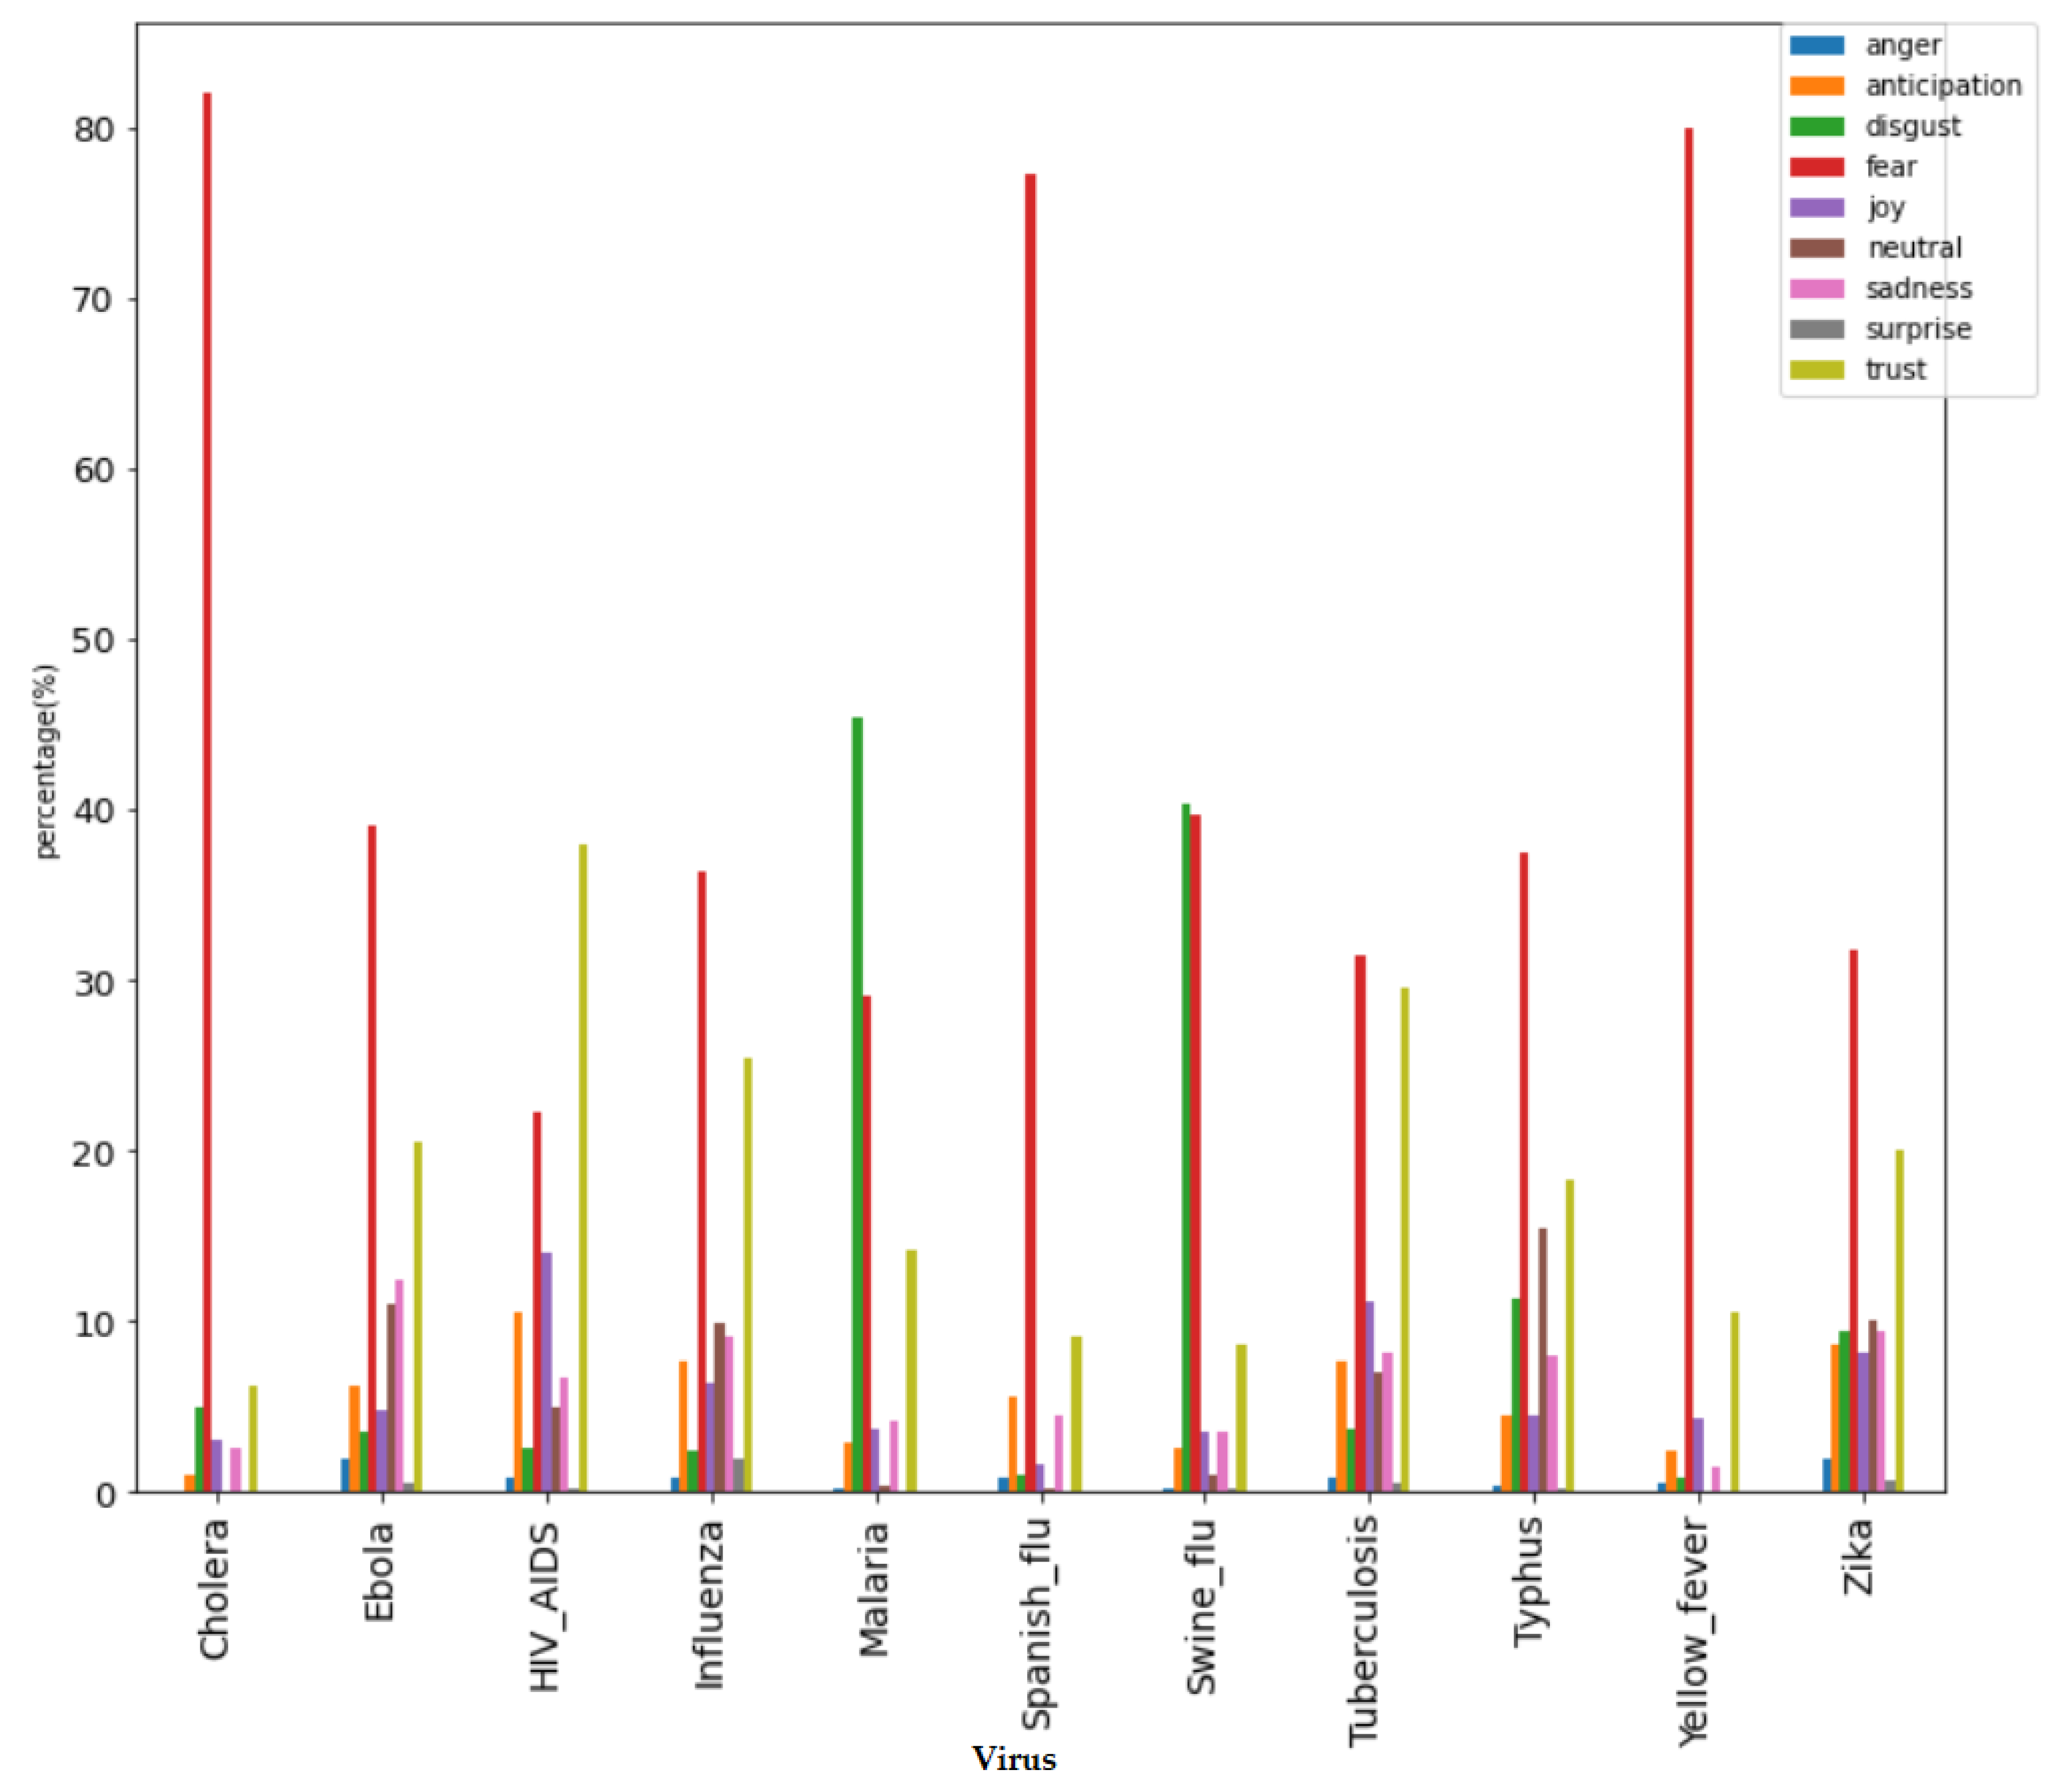
8. Sentiment Analysis
- Using the labelled data to train the first supervised model, such as the logistic regression one;
- Using the model to predict the class of the unlabelled data;
- Selecting the tweets that satisfy the predefined criteria (e.g., with a prediction probability of 96% or belonging to the top 10 observations with the highest prediction probability);
- Combining these pseudo-labels with the labelled data;
- Using the labels and pseudo-labels to train a new supervised model;
- Making predictions again and adding the new observations to the pseudo-labelled pool;
- Iterating these steps until no other unlabelled observations satisfy the pseudo-labelling criterion, or when the specified maximum number of iterations is reached;
- Finally, defining an adjusted or improved logistic regression classifier (whose accuracy is 80%) that labels the sentiment of all the observations.
9. Combining Topic Modelling and Sentiment Analysis
10. Discussion and Conclusions
Author Contributions
Funding
Institutional Review Board Statement
Informed Consent Statement
Data Availability Statement
Conflicts of Interest
Appendix A. Description of the Considered Pandemics
References
- Morens, D.M.; Folkers, G.K.; Fauci, A.S. The challenge of emerging and re-emerging infectious diseases. Nature 2004, 430, 242–249. [Google Scholar] [CrossRef] [PubMed]
- Fan, V.; Jamison, D.; Summers, L. The Inclusive Cost of Pandemic Influenza Risk; Technical Report; National Bureau of Economic Research: Cambridge, MA, USA, 2016. [Google Scholar] [CrossRef]
- III, F.J.G.; Sheps, S.; Ho, K.; Novak-Lauscher, H.; Eysenbach, G. Social Media: A Review and Tutorial of Applications in Medicine and Health Care. J. Med. Internet Res. 2014, 16, e13. [Google Scholar] [CrossRef]
- Paul, M.J.; Sarker, A.; Brownstein, J.S.; Nikfarjam, A.; Scotch, M.; Smith, K.L.; Gonzalez, G. Social Media Mining for Public Health Monitoring and Surveillance. Biocomputing 2016, 468–479. [Google Scholar] [CrossRef]
- Vilic, A.; Petersen, J.A.; Hoppe, K.; Sorensen, H.B.D. Visualizing patient journals by combining vital signs monitoring and natural language processing. In Proceedings of the 2016 38th Annual International Conference of the IEEE Engineering in Medicine and Biology Society (EMBC), Orlando, FL, USA, 16–20 August 2016. [Google Scholar] [CrossRef]
- Tissot, H.C.; Shah, A.D.; Brealey, D.; Harris, S.; Agbakoba, R.; Folarin, A.; Romao, L.; Roguski, L.; Dobson, R.; Asselbergs, F.W. Natural Language Processing for Mimicking Clinical Trial Recruitment in Critical Care: A Semi-Automated Simulation Based on the LeoPARDS Trial. IEEE J. Biomed. Health Inform. 2020, 24, 2950–2959. [Google Scholar] [CrossRef]
- Zhang, X.; Saleh, H.; Younis, E.M.G.; Sahal, R.; Ali, A.A. Predicting Coronavirus Pandemic in Real-Time Using Machine Learning and Big Data Streaming System. Complexity 2020, 2020, 6688912. [Google Scholar] [CrossRef]
- Sepúlveda, A.; Periñán-Pascual, C.; Muñoz, A.; Martínez-España, R.; Hernández-Orallo, E.; Cecilia, J.M. COVIDSensing: Social Sensing Strategy for the Management of the COVID-19 Crisis. Electronics 2021, 10, 3157. [Google Scholar] [CrossRef]
- Imran, M.; Qazi, U.; Ofli, F. TBCOV: Two Billion Multilingual COVID-19 Tweets with Sentiment, Entity, Geo, and Gender Labels. Data 2022, 7, 8. [Google Scholar] [CrossRef]
- Graff, M.; Moctezuma, D.; Miranda-Jiménez, S.; Tellez, E.S. A Python library for exploratory data analysis on twitter data based on tokens and aggregated origin–destination information. Comput. Geosci. 2022, 159, 105012. [Google Scholar] [CrossRef]
- Cornelius, J.; Ellendorff, T.; Furrer, L.; Rinaldi, F. COVID-19 Twitter Monitor: Aggregating and Visualizing COVID-19 Related Trends in Social Media. In Proceedings of the Fifth Social Media Mining for Health Applications Workshop & Shared Task, Barcelona, Spain, 12 December 2020; Association for Computational Linguistics: Barcelona, Spain, 2020; pp. 1–10. [Google Scholar]
- Andreadis, S.; Antzoulatos, G.; Mavropoulos, T.; Giannakeris, P.; Tzionis, G.; Pantelidis, N.; Ioannidis, K.; Karakostas, A.; Gialampoukidis, I.; Vrochidis, S.; et al. A social media analytics platform visualising the spread of COVID-19 in Italy via exploitation of automatically geotagged tweets. Online Soc. Netw. Media 2021, 23, 100134. [Google Scholar] [CrossRef]
- Cinelli, M.; Quattrociocchi, W.; Galeazzi, A.; Valensise, C.M.; Brugnoli, E.; Schmidt, A.L.; Zola, P.; Zollo, F.; Scala, A. The COVID-19 social media infodemic. Sci. Rep. 2020, 10, 16598. [Google Scholar] [CrossRef]
- Biancovilli, P.; Makszin, L.; Jurberg, C. Misinformation on social networks during the novel coronavirus pandemic: A quali-quantitative case study of Brazil. BMC Public Health 2021, 21, 1200. [Google Scholar] [CrossRef] [PubMed]
- Househ, M. Communicating Ebola through social media and electronic news media outlets: A cross-sectional study. Health Inform. J. 2016, 22, 470–478. [Google Scholar] [CrossRef]
- Yousefinaghani, S.; Dara, R.; Poljak, Z.; Bernardo, T.M.; Sharif, S. The Assessment of Twitter’s Potential for Outbreak Detection: Avian Influenza Case Study. Sci. Rep. 2019, 9, 18147. [Google Scholar] [CrossRef] [PubMed]
- Aramaki, E.; Maskawa, S.; Morita, M. Twitter Catches The Flu: Detecting Influenza Epidemics using Twitter. In Proceedings of the 2011 Conference on Empirical Methods in Natural Language Processing, Edinburgh, UK, 27–31 July 2011; Association for Computational Linguistics: Edinburgh, UK, 2011; pp. 1568–1576. [Google Scholar]
- Santillana, M.; Nguyen, A.T.; Dredze, M.; Paul, M.J.; Nsoesie, E.O.; Brownstein, J.S. Combining Search, Social Media, and Traditional Data Sources to Improve Influenza Surveillance. PLoS Comput. Biol. 2015, 11, e1004513. [Google Scholar] [CrossRef] [PubMed]
- Gori, D.; Reno, C.; Remondini, D.; Durazzi, F.; Fantini, M.P. Are We Ready for the Arrival of the New COVID-19 Vaccinations? Great Promises and Unknown Challenges Still to Come. Vaccines 2021, 9, 173. [Google Scholar] [CrossRef]
- Sicilia, R.; Giudice, S.L.; Pei, Y.; Pechenizkiy, M.; Soda, P. Twitter rumour detection in the health domain. Expert Syst. Appl. 2018, 110, 33–40. [Google Scholar] [CrossRef]
- Durazzi, F.; Müller, M.; Salathé, M.; Remondini, D. Clusters of science and health related Twitter users become more isolated during the COVID-19 pandemic. Sci. Rep. 2021, 11, 19655. [Google Scholar] [CrossRef]
- Mahdikhani, M. Predicting the popularity of tweets by analyzing public opinion and emotions in different stages of Covid-19 pandemic. Int. J. Inf. Manag. Data Insights 2022, 2, 100053. [Google Scholar] [CrossRef]
- Bellandi, V.; Ceravolo, P.; Maghool, S.; Siccardi, S. A Comparative Study of Clustering Techniques Applied on Covid-19 Scientific Literature. In Proceedings of the 2020 7th International Conference on Internet of Things: Systems, Management and Security (IOTSMS), Paris, France, 14–16 December 2020. [Google Scholar] [CrossRef]
- Alsudias, L.; Rayson, P. Social Media Monitoring of the COVID-19 Pandemic and Influenza Epidemic With Adaptation for Informal Language in Arabic Twitter Data: Qualitative Study. JMIR Med Inform. 2021, 9, e27670. [Google Scholar] [CrossRef]
- Tweepy. Tweepy Documentation. Available online: https://docs.tweepy.org/en/stable/ (accessed on 16 October 2022).
- Spacy. Industrial-Strength Natural Language Processing in Python. Available online: https://spacy.io/ (accessed on 16 October 2022).
- NLTK. NLTK Documentation. Available online: https://www.nltk.org/_modules/nltk/stem/wordnet.html (accessed on 16 October 2022).
- pypi. Autocorrect 2.6.1. Available online: https://pypi.org/project/autocorrect/ (accessed on 16 October 2022).
- Karthika, P.; Murugeswari, R.; Manoranjithem, R. Sentiment Analysis of Social Media Network Using Random Forest Algorithm. In Proceedings of the 2019 IEEE International Conference on Intelligent Techniques in Control, Optimization and Signal Processing (INCOS, Tamilnadu, India, 11–13 April 2019. [Google Scholar] [CrossRef]
- Alodadi, M.; Janeja, V.P. Similarity in Patient Support Forums Using TF-IDF and Cosine Similarity Metrics. In Proceedings of the 2015 International Conference on Healthcare Informatics, Dallas, TX, USA, 21–23 October 2015. [Google Scholar] [CrossRef]
- Jacobson, O.; Dalianis, H. Applying deep learning on electronic health records in Swedish to predict healthcare-associated infections. In Proceedings of the 15th Workshop on Biomedical Natural Language Processing, Berlin, Germany, 12 August 2016; Association for Computational Linguistics: Berlin, Germany, 2016. [Google Scholar] [CrossRef]
- Joulin, A.; Grave, E.; Bojanowski, P.; Douze, M.; Jégou, H.; Mikolov, T. FastText.zip: Compressing Text Classification Models. arXiv 2016, arXiv:cs.CL/1612.03651. [Google Scholar]
- Kappus, P.; Groß, P. Finding Clusters of Similar-minded People on Twitter Regarding the Covid-19 Pandemic. arXiv 2022, arXiv:cs.SI/2203.04764. [Google Scholar]
- Blei, D.M.; Ng, A.Y.; Jordan, M.I. Latent Dirichlet Allocation. J. Mach. Learn. Res. 2003, 3, 993–1022. [Google Scholar]
- Qorib, M.; Oladunni, T.; Denis, M.; Ososanya, E.; Cotae, P. Covid-19 vaccine hesitancy: Text mining, sentiment analysis and machine learning on COVID-19 vaccination Twitter dataset. Expert Syst. Appl. 2023, 212, 118715. [Google Scholar] [CrossRef] [PubMed]
- WHO. Ebola Virus Disease—Democratic Republic of the Congo. Available online: https://www.who.int/emergencies/disease-outbreak-news/item/2022-DON377 (accessed on 16 October 2022).
- BBC. Cholera in Mariupol: Ruined city at risk of major cholera outbreak - UK. Available online: https://www.bbc.com/news/world-europe-61762787 (accessed on 16 October 2022).
- Wikipidia. Queensland Tick Typhus. Available online: https://en.wikipedia.org/wiki/Queensland_tick_typhus (accessed on 16 October 2022).
- KMH. Yellow Fever—Kenya. Available online: https://www.who.int/emergencies/disease-outbreak-news/item/2022-DON361 (accessed on 16 October 2022).
- UN. Ethiopia: Essential Aid Reaches Tigray Region, but More Still Needed. Available online: https://news.un.org/en/story/2022/05/1117622 (accessed on 16 October 2022).
- Telegraph, T. Let’s Die at Home: 200 Patients Turned Away as Tigray’s Main Hospital Runs Out of Supplies. Available online: https://www.telegraph.co.uk/global-health/terror-and-security/die-home-200-patients-turned-away-tigrays-main-hospital-runs/ (accessed on 16 October 2022).
- Yin, Z.; Shen, Y. On the Dimensionality of Word Embedding. arXiv 2018. [Google Scholar] [CrossRef]
- Faruqui, M.; Dyer, C. Community evaluation and exchange of word vectors at wordvectors.org. In Proceedings of the 52nd Annual Meeting of the Association for Computational Linguistics: System Demonstrations, Baltimore, MD, USA, 23–24 June 2014; pp. 19–24. [Google Scholar]
- Tsvetkov, Y.; Faruqui, M.; Ling, W.; Lample, G.; Dyer, C. Evaluation of word vector representations by subspace alignment. In Proceedings of the 2015 Conference on Empirical Methods in Natural Language Processing, Lisbon, Portugal, 17–21 September 2015; pp. 2049–2054. [Google Scholar]
- Shahapure, K.R.; Nicholas, C. Cluster Quality Analysis Using Silhouette Score. In Proceedings of the 2020 IEEE 7th International Conference on Data Science and Advanced Analytics (DSAA), Sydney, NSW, Australia, 6–9 October 2020. [Google Scholar] [CrossRef]
- Hubert, L.; Arabie, P. Comparing partitions. J. Classif. 1985, 2, 193–218. [Google Scholar] [CrossRef]
- gensim. gensim 4.2.0. Available online: https://pypi.org/project/gensim/ (accessed on 16 October 2022).
- Sievert, C.; Shirley, K. LDAvis: A method for visualizing and interpreting topics. In Proceedings of the Workshop on Interactive Language Learning, Visualization, and Interfaces, Baltimore, MD, USA, 23–24 June 2014; Association for Computational Linguistics: Baltimore, MD, USA, 2014. [Google Scholar] [CrossRef]
- Mohammad, S.M. Word Affect Intensities. In Proceedings of the 11th Edition of the Language Resources and Evaluation Conference (LREC-2018), Miyazaki, Japan, 7–12 May 2018. [Google Scholar]
- NRC. Emotion-Nrc-Affect-Lex 0.0.3. Available online: https://pypi.org/project/emotion-nrc-affect-lex/ (accessed on 16 October 2022).
- CDC. Epidemic Typhus. Available online: https://www.cdc.gov/typhus/epidemic/index.html (accessed on 16 October 2022).


| Cluster Number | Interpretation | Top Words |
|---|---|---|
| cluster0 | medical treatment | vaccine, disease, case |
| cluster1 | people’s health situation | old, baby, people |
| cluster2 | cause of virus | mosquito, world |
| cluster3 | war and conflict | Ukraine, war, refugee |
| cluster4 | deaths | people, die, kill |
| cluster5 | avian | bird, county, flock |
| cluster6 | pandemic outbreak in Congo | Congo, outbreak, crisis |
| cluster7 | people’s activity such as National Women and Girls HIV/AIDS Awareness Day | awareness, world |
| Cluster Number | Interpretation | Top Words |
|---|---|---|
| cluster0 | people’s activity such as National Women and Girls HIV/AIDS Awareness Day | people, awareness, national |
| cluster1 | medical treatment | vaccine, people, mask |
| cluster2 | fight against viruses | world, health, fight |
| cluster3 | pandemic situation in a certain area | outbreak, Congo, city |
| cluster4 | avian | bird, county, flock |
| cluster5 | deaths | die, people, time |
| cluster6 | war and conflict | Ukraine, Russia, kill |
| cluster7 | cause of viruses | mosquito, world |
| Emotion | Support | LR | MNB | RF | ||||||
|---|---|---|---|---|---|---|---|---|---|---|
| Precision | Recall | f1-Score | Precision | Recall | f1-Score | Precision | Recall | f1-Score | ||
| anger | 1239 | 0.95 | 0.31 | 0.46 | 1.00 | 0.04 | 0.08 | 0.90 | 0.29 | 0.44 |
| anticipation | 4496 | 0.83 | 0.61 | 0.70 | 0.99 | 0.07 | 0.13 | 0.79 | 0.45 | 0.58 |
| disgust | 9659 | 0.81 | 0.86 | 0.84 | 0.93 | 0.29 | 0.45 | 0.76 | 0.83 | 0.80 |
| fear | 21,019 | 0.81 | 0.92 | 0.86 | 0.40 | 1.00 | 0.57 | 0.73 | 0.90 | 0.81 |
| joy | 5263 | 0.85 | 0.67 | 0.75 | 0.99 | 0.15 | 0.27 | 0.82 | 0.52 | 0.63 |
| neutral | 3115 | 0.77 | 0.74 | 0.76 | 1.00 | 0.07 | 0.14 | 0.59 | 0.93 | 0.72 |
| sadness | 5391 | 0.86 | 0.64 | 0.73 | 0.99 | 0.14 | 0.24 | 0.85 | 0.53 | 0.50 |
| surprise | 778 | 0.93 | 0.32 | 0.48 | 1.00 | 0.01 | 0.01 | 0.90 | 0.35 | 0.50 |
| trust | 11,303 | 0.73 | 0.84 | 0.78 | 0.83 | 0.33 | 0.48 | 0.72 | 0.69 | 0.70 |
| Index | Support | LR | MNB | RF | ||||||
| Precision | Recall | f1-Score | Precision | Recall | f1-Score | Precision | Recall | f1-Score | ||
| accuracy | 62,263 | 0.80 | 0.48 | 0.74 | ||||||
| macro avg | 62,263 | 0.84 | 0.66 | 0.71 | 0.90 | 0.23 | 0.26 | 0.78 | 0.61 | 0.65 |
| weighted avg | 62,263 | 0.81 | 0.80 | 0.79 | 0.75 | 0.48 | 0.41 | 0.75 | 0.74 | 0.73 |
| Pandemic | Dominant Emotion | Topics |
|---|---|---|
| Ebola | fear | Topic1—COVID-19 |
| Topic2—Information about the virus | ||
| Topic3—Ebola outbreak in Congo | ||
| Topic4—Political issues in Congo such as scandal | ||
| HIV/AIDS | trust | Topic1—Research findings |
| Topic2—National Women and Girls HIV/AIDS Awareness Day | ||
| Topic3—High-risk or susceptible groups | ||
| Topic4—Help and encourage from experts | ||
| Malaria | disgust | Topic1—Treatment such as vaccine |
| Topic2—People’s reaction | ||
| Topic3—The spreading of Malaria: the bite of mosquito | ||
| Topic4—Research about Malaria | ||
| Topic5—The cause of Malaria: the falciparum parasite | ||
| Topic6—Organisations or figures | ||
| Topic7—Usage of drug | ||
| Topic8—Medical treatment’s achievement | ||
| Cholera | fear | Topic1—Vaccine |
| Topic2—The risk of Cholera outbreak in Mariupol, Ukraine | ||
| Topic3—The cause of Cholera: water pollution | ||
| Influenza | fear | Topic1—COVID-19 |
| Topic2—Avian | ||
| Topic3—The risk of the virus | ||
| Topic4—New cases and deaths | ||
| Spanish flu | fear | Topic1—COVID-19 |
| Topic2—Avian | ||
| Topic3—Million deaths in the history | ||
| Topic4—Protective measures such as wearing masks | ||
| Swine flu | disgust | Topic1—COVID-19 |
| Topic2—The connection with avian influenza | ||
| Topic3—Influence on the world | ||
| Topic4—Animals such as swine, monkey, and so on |
| Pandemic | Dominant Emotion | Topics |
|---|---|---|
| Tuberculosis | fear | Topic1—COVID-19 |
| Topic2—Viral resistance to drugs | ||
| Topic3—Other diseases, such as cancer and diabetes | ||
| Topic4—Call to fight the virus | ||
| Topic5—Achievement of treatment | ||
| Topic6—Infection in the prison | ||
| trust | Topic1—World Tuberculosis Day to raise people’s awareness | |
| Topic2— New information from research | ||
| Topic3—Medical system | ||
| Topic4—Collaboration and campaign around the world | ||
| Typhus | fear | Topic1—Deaths |
| Topic2—The outbreak of disease and war | ||
| Topic3—Vaccine | ||
| Yellow fever | fear | Topic1—Vaccine |
| Topic2—Outbreak in Kenya | ||
| Topic3—Deaths | ||
| Zika | fear | Topic1—Infection caused by mosquito |
| Topic2—Dengue | ||
| Topic3—The outbreak of Zika |
Publisher’s Note: MDPI stays neutral with regard to jurisdictional claims in published maps and institutional affiliations. |
© 2022 by the authors. Licensee MDPI, Basel, Switzerland. This article is an open access article distributed under the terms and conditions of the Creative Commons Attribution (CC BY) license (https://creativecommons.org/licenses/by/4.0/).
Share and Cite
Qin, Z.; Ronchieri, E. Exploring Pandemics Events on Twitter by Using Sentiment Analysis and Topic Modelling. Appl. Sci. 2022, 12, 11924. https://doi.org/10.3390/app122311924
Qin Z, Ronchieri E. Exploring Pandemics Events on Twitter by Using Sentiment Analysis and Topic Modelling. Applied Sciences. 2022; 12(23):11924. https://doi.org/10.3390/app122311924
Chicago/Turabian StyleQin, Zhikang, and Elisabetta Ronchieri. 2022. "Exploring Pandemics Events on Twitter by Using Sentiment Analysis and Topic Modelling" Applied Sciences 12, no. 23: 11924. https://doi.org/10.3390/app122311924
APA StyleQin, Z., & Ronchieri, E. (2022). Exploring Pandemics Events on Twitter by Using Sentiment Analysis and Topic Modelling. Applied Sciences, 12(23), 11924. https://doi.org/10.3390/app122311924