Abstract
The data collection in the automated monitoring of landslides is often characterized by large amounts of data, periodic fluctuations, many outliers, and different collection intervals. The traditional method of calculating velocity and acceleration using the differential algorithm for landslide acceleration relies on experience to select thresholds and produces a large number of false early warnings. A hybrid early warning method for the landslide acceleration process based on automated monitoring data is proposed to solve this problem. The method combines the conventional warning method, based on cumulative displacement, velocity, and acceleration, and the critical sliding warning method based on normalized tangent angle according to different strategies. On the one hand, the least-squares fitting of monitoring data inside a given time window is used to calculate various early warning parameters, improving data usage and lowering calculation error. On the other hand, a dynamic semi-quantitative and semi-empirical method is provided for the determination of the thresholds, which is more reliable than the purely empirical method. The validation experiments at the Lishanyuan landslide in southern China show that the hybrid method can accurately identify the accelerating deformation of the landslide and gives very few false warnings. The proposed method is practical and effective for systems that require automated monitoring and warnings for a large number of landslides.
1. Introduction
The southern region of China has undulating terrain and abundant rainfall, so it suffers from many geological disasters. From 2014 to 2019, a total of 46,957 geological disasters occurred in China, of which 33,386 were landslides, accounting for more than 70% of total geological disasters [1]. Nearly 90% of these landslides occurred in southern China, causing huge casualties and economic and property losses. Compared with the high-cost landslide treatment, monitoring and giving early warning of landslides with potential sliding risks is more economical and effective [2,3,4,5]. For the early warning, we should obtain the deformation parameters (surface displacement, deep displacement, crack width), changes in rock and soil parameters (water content, earth pressure), and other factors (groundwater level, rainfall, etc.). A growing number of studies have focused on how to effectively and comprehensively use monitoring data to predict landslide failure in recent years [2,5,6].
A large number of landslide deformation monitoring results show that most soil slopes and some rock slopes experienced creep with different deformation characteristics before failure [7]. Such a creep feature is particularly useful for early warning because there is enough time for data collection and analysis. Many early warning and prediction methods are based on this feature [8,9,10,11]. The monitoring results of many rainfall-induced landslides and landslides close to reservoirs in recent years show that the displacement curves of such landslides show obvious “step-like” characteristics, with an acceleration process in the rainy season every year and then plateauing in the dry season, which makes the accurate prediction of landslide failure time more difficult. Despite this, the early warning can be obtained as long as each acceleration in the landslide deformation process is accurately grasped. This is the core of the method proposed in this article. Many studies are also based on this idea. Ref. [12] presented the application of an automatic procedure specifically developed to identify the onset of landslide acceleration by analyzing displacement monitoring data with a multi-criteria approach. Refs. [13,14] suggested a new method to carry out the phase division and to explore tangential angular features of the displacement–time curve of creep slopes, as well as the acceleration characteristics in the process of slope deformation and the pre-warning criteria for critical failure. Ref. [15] proposed a new method based on the inverse logistic function considering inverse distance weighting to predict the displacement of landslides, and the quantitative standards of dividing the deformation stages and determining the critical sliding time are put forward. All of these methods have been widely used in actual landslide cases and can accurately identify the landslide acceleration process.
With the rapid development of monitoring sensors and Internet of Things technology, landslide monitoring has gradually developed from manual to automated [16,17,18,19,20]. The automated monitoring system for landslides includes four parts: the perceptual layer used to sense the deformation, mechanics, water level, rainfall, and other physical conditions of the landslide site; the data layer used to receive and store the monitoring data and provide a data access interface; the service layer used to process and analyze monitoring data and provide application programming interfaces for the terminal layer; and the terminal layer used to provide human–computer interaction interfaces. The perceptual layer is the basis of the entire system. It is composed of various sensors, equipment for data acquisition and communication, and supporting systems including batteries and solar panels deployed on the landslide site. The sensors include global navigation satellite systems (GNSS), such as the Beidou global navigation satellite system and global positioning system [21,22], and in situ sensors, such as crack meters, moisture meters, and inclinometers [2,6,23]. Automated landslide monitoring has three characteristics: first, high collection frequency and large amounts of observation data; second, data fluctuations and outliers, as the sensors are easily affected by the environment; third, the automation of the data analysis process makes it difficult to conduct artificial early warnings, especially when the number of landslides under observation is very large.
Due to these features, many traditional methods are slightly insufficient when they are applied to these data. Firstly, some related studies focus on the critical sliding early warning [5,11,13,14] and ignore the acceleration process that often occurs in the evolution of landslides before reaching the critical sliding stage. But such early warning is also very important, because every acceleration may be the prelude to the failure of the landslide. Secondly, data fluctuations and outliers in traditional differential calculations often cause false early warnings. Finally, some early warning methods are based on prior parameters. For example, some early warning methods based on the normalized tangent angle require the average speed of the landslide in the constant deformation stage (CDS), which cannot be obtained at the beginning of the monitoring. Furthermore, obtaining these parameters needs experienced assistance and cannot be fully automated. Therefore, the problem of how to provide early warnings of landslide acceleration processes based on automated monitoring data characteristics remains unsolved.
This paper proposes a hybrid warning method that can both accurately identify the landslide acceleration process and reduce false warnings based on the characteristics of automated monitoring data from landslides. The method includes two parts: conventional early warning and critical sliding early warning. For conventional early warning, the deformation process is divided into the normal zone, initial attention zone, and key attention zone, according to the cumulative displacement. Then, the initial attention zone and key attention zone are divided into different warning levels based on the velocity and acceleration calculated by the least-squares method. When the displacement of the landslide enters the key attention zone, the average velocity since the beginning of deformation is calculated artificially, and the critical sliding early warning based on the normalized tangent angle is enabled. Then, the two early warning methods are combined according to different strategies to take into account the requirements of computing resources, the number of false warnings, and immediacy. The proposed hybrid warning method not only ensures a precise understanding of the landslide deformation acceleration process while reducing false alarms, but it also makes full use of monitoring data and requires almost no human intervention, making it suitable for automated landslide warning systems.
2. Methods
2.1. The Proposed Hybrid Early Warning Method
According to the monitoring results of many landslides with creep characteristics, the displacement evolution process before landslide failure is shown in Figure 1. The entire landslide creep process is divided into three parts according to the cumulative displacement: normal zone (F), initial attention zone (G), and key attention zone (H). Following the deployment of monitoring equipment, the monitoring data typically reaches a data plateau (A), after which the landslide accelerates and deforms (B) due to inducing factors such as rainfall and construction. It may then decelerate and stabilize, or it may be deformed at a constant velocity or continuously accelerated (C,D). This process may be repeated several times, until, at last, the landslide accelerates without deceleration (E) until failure. From this process, it can be found that accelerated deformation is the premise of landslide failure, so fast and accurate identification of each accelerated deformation process is the basis of landslide warning.
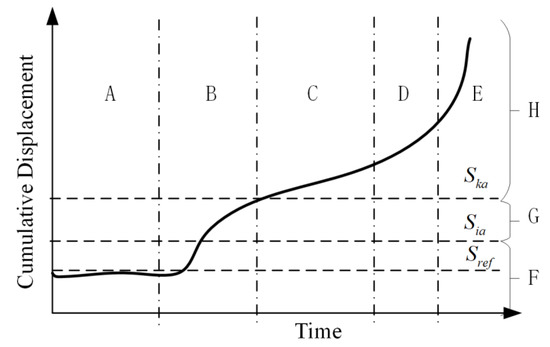
Figure 1.
Refined landslide failure process. (A): Plateau stage, (B): Initial deformation stage, (C): Constant deformation stage, (D): Accelerated deformation stage, (E): Critical sliding stage, (F): normal zone, (G): initial attention zone, (H): key attention zone.
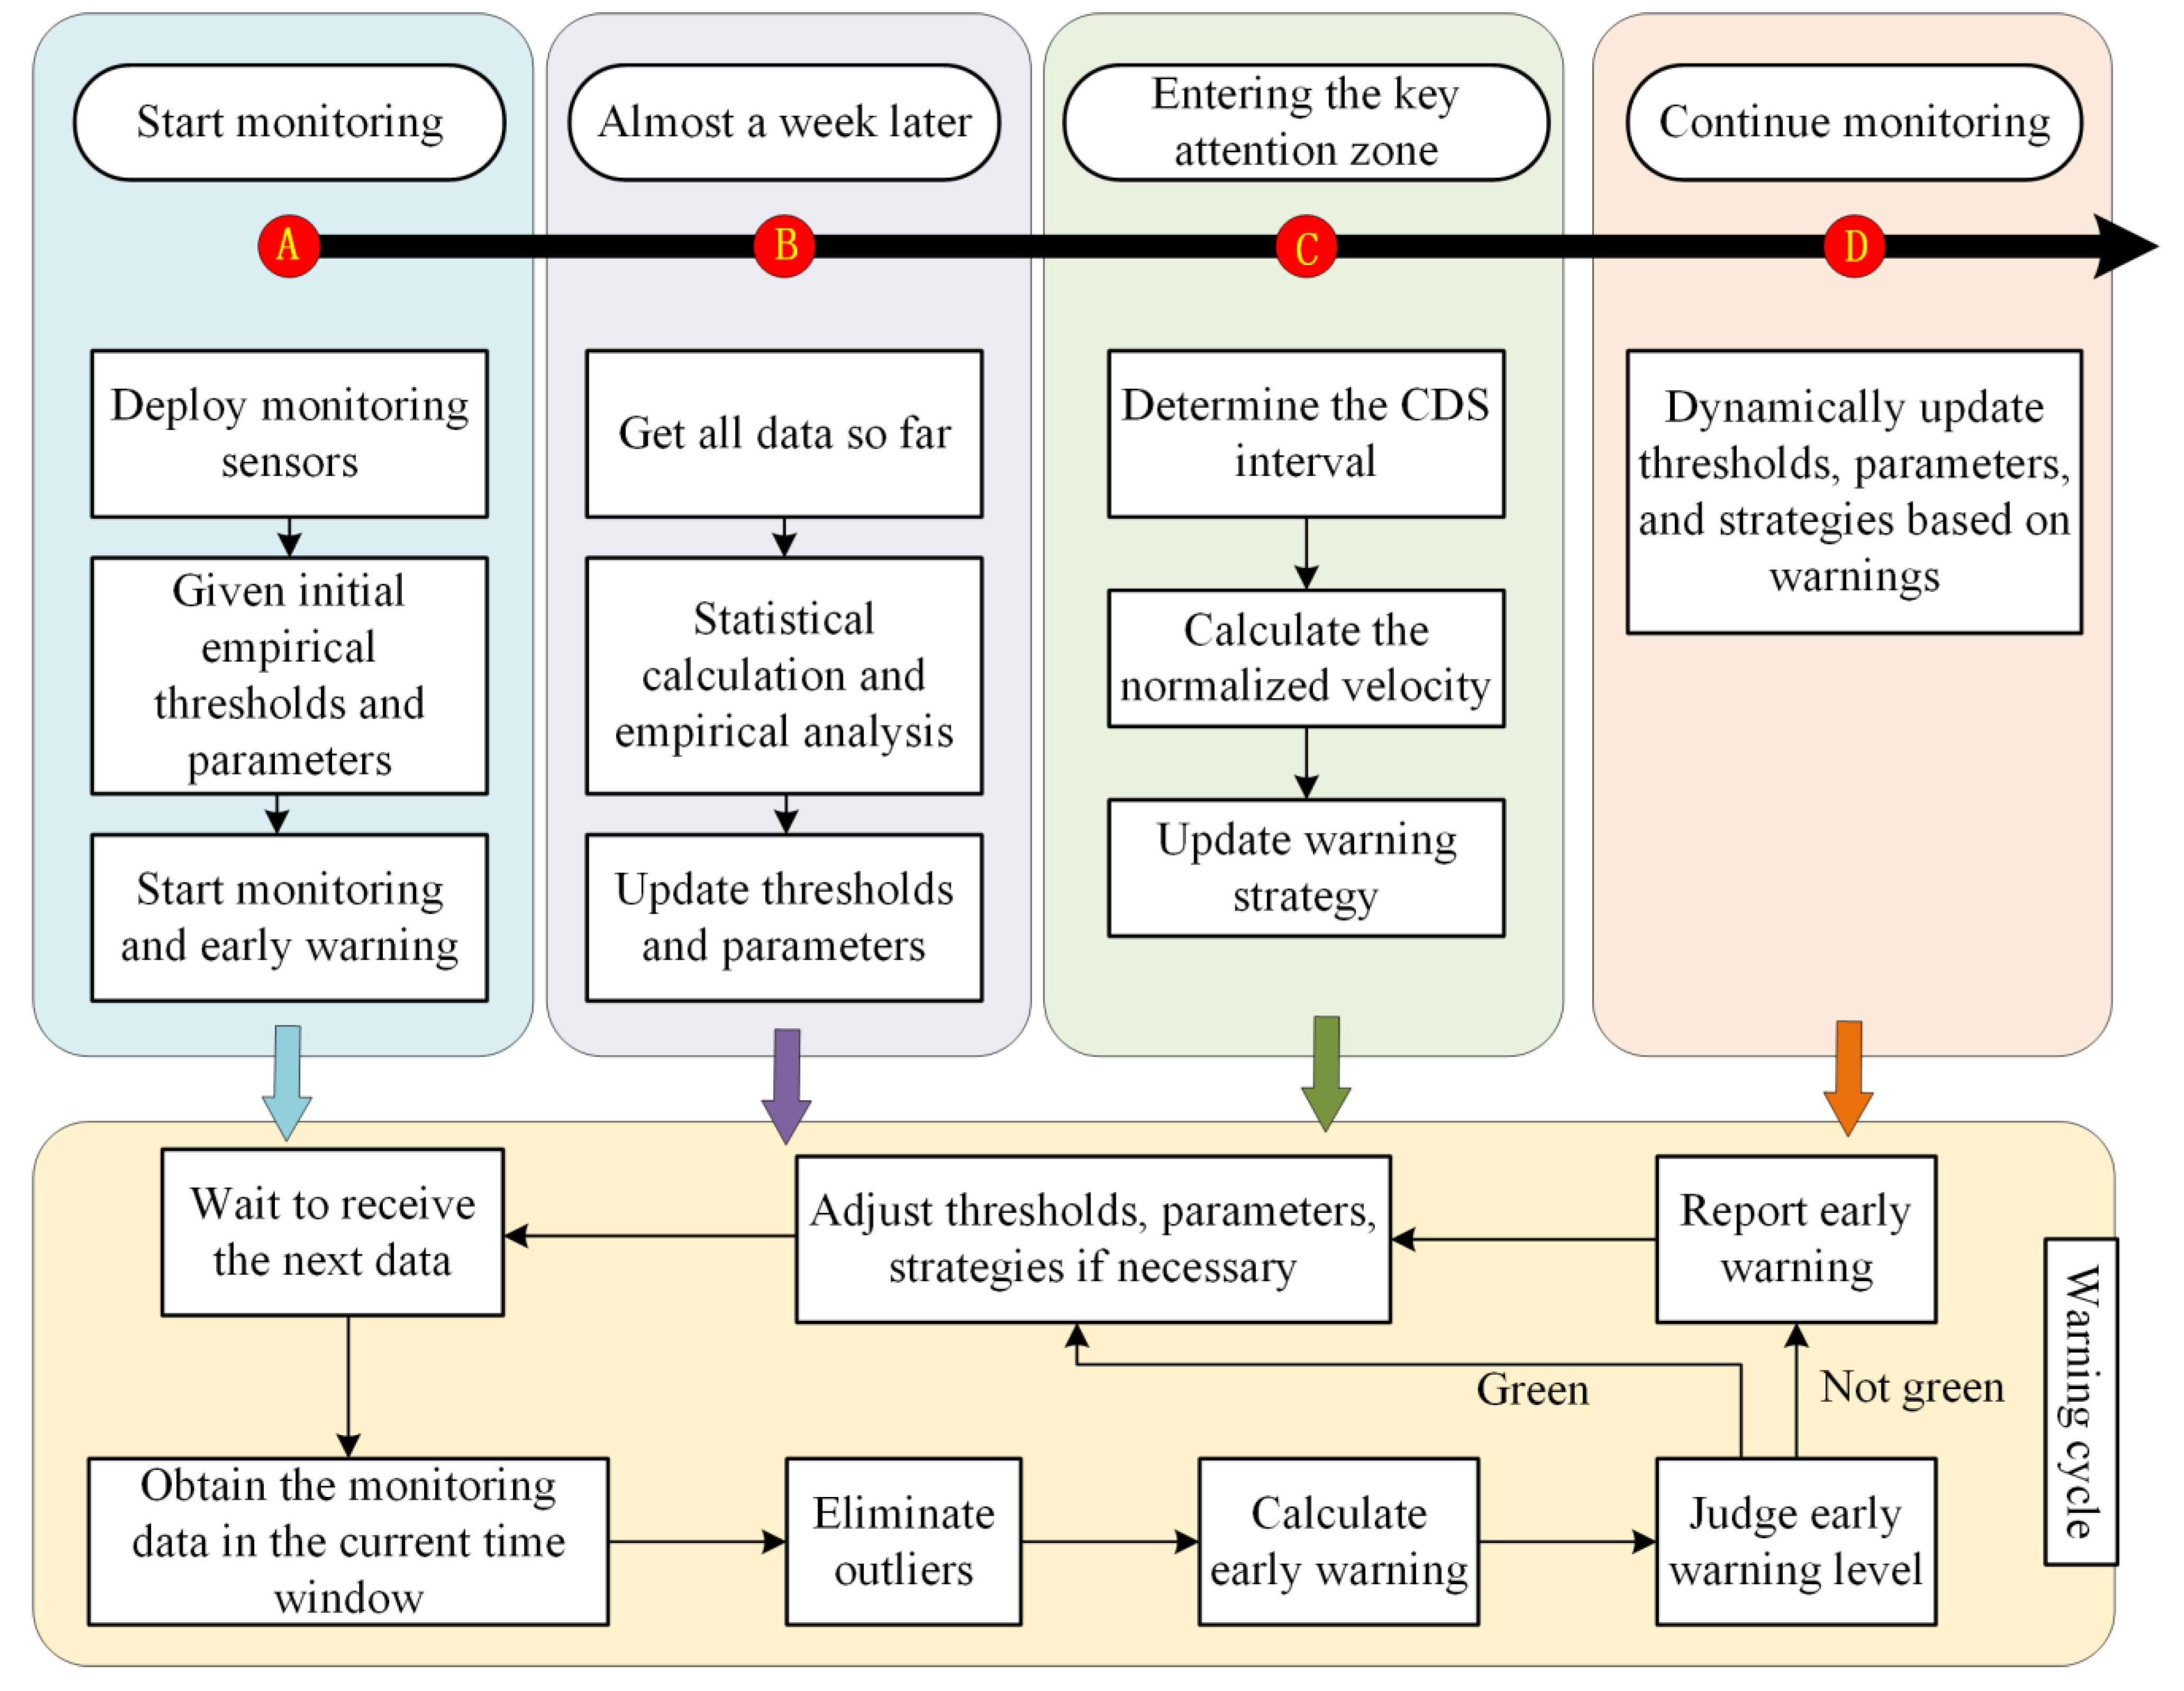
This paper proposes a hybrid warning method based on the above creep landslide deformation patterns and automated monitoring data features, which can not only accurately identify the landslide acceleration process, but can also effectively reduce the number of false warnings, as shown in Figure 2. The initial empirical thresholds and parameters are given after the monitoring sensors are deployed on the unstable landslide to be monitored and warned, and then the warning cycle (the “warning cycle” section in Figure 2) begins, formally starting the monitoring and warning of the landslide. In the “warning cycle” section, the warning service deployed on the servers goes through a continuous cycle of extracting monitoring data, preprocessing, warning judgment, and extracting new data, resulting in automated warnings. This cyclic process necessitates dynamic changes to various parameters and thresholds based on the monitoring situation and the need for early warning. Parts A–D in Figure 2 depict some key moments in the adjustment and processing processes. A particular quantity of monitoring data has been obtained after approximately a week of monitoring. To develop thresholds and parameters suited for the current landslide and update them in the early warning cycle, statistical calculations and empirical analysis of monitoring data are required. If the landslide’s cumulative displacement exceeds and it enters the key attention zone, the CDS can be determined initially, followed by the normalized velocity, which can be used to calculate the normalized tangent angle, and the early warning strategy in the early warning cycle can be adjusted to meet different needs. As the monitoring process continues, dynamically adjusting thresholds, parameters, and strategies in response to monitoring and warning conditions are required. For each warning cycle, the outliers for the monitoring data within the current warning time window must first be identified and rejected. The early warning calculation and level judgment are then carried out. The warning is reported if it is not a green warning. Then, as soon as the next data moment arrives, the warning services move on to the next cycle. The challenges that the hybrid warning method suggested in this research aims to tackle are how to calculate the warning, determine the warning level, and adjust the warning thresholds, parameters, and strategies.
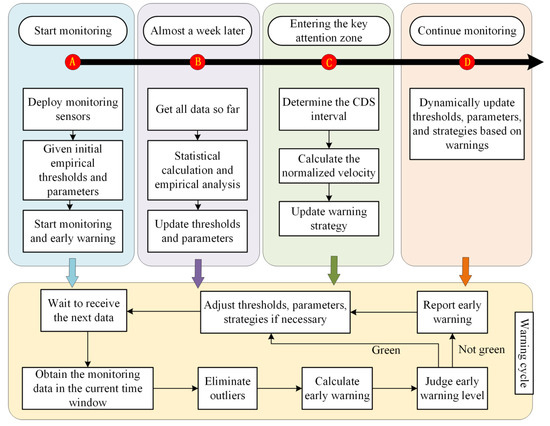
Figure 2.
The flowchart of the hybrid early warning method.
There are two parts to the hybrid early warning method: conventional early warning and critical sliding early warning. Conventional early warning is primarily based on cumulative displacement, velocity, and acceleration to determine the warning level, which is more empirical, requires a little prior information, and is consistent throughout the monitoring cycle. The critical sliding early warning is only activated after the cumulative displacement reaches and the normalized velocity is calculated, which gives the critical sliding judgment an advantage. The two algorithms are combined according to different strategies to balance the requirements of computational resources, the number of false warnings, and immediacy.
2.1.1. Conventional Early Warning
Since landslide failure must occur after a large deformation, the entire landslide process can be divided into three zones based on cumulative displacement, with the and division separating them. As shown in Figure 1, when the cumulative displacement is less than , the landslide will not slide. Therefore, it is considered safe in this zone regardless of the deformation velocity or acceleration. When the displacement is between and , the landslide has a certain displacement, but not a large amount, so the landslide deserves initial attention. This zone can be divided into three sections according to velocity and acceleration. As shown in Table 1, when the velocity is less than , the landslide is considered to be safe at present. When the velocity is between and , a blue warning is considered. When the velocity is greater than , a yellow warning is considered. This zone has no orange warning or red warning, as the cumulative displacement is smaller than . When the cumulative displacement is greater than , the landslide has relatively large deformation, and the failure may occur in any subsequent acceleration process, which needs key attention. This zone can be divided into five sections according to the velocity and acceleration, which are safe, blue warning, yellow warning, orange warning, and red warning. Because the acceleration process of landslides is the most dangerous, each section can be further divided according to the acceleration. If the acceleration is positive, the current warning level is maintained, and if the acceleration is negative, the level is lowered. Listing all the possible situations, we get the conventional early warning-level judgment method (see Table 1).

Table 1.
Early warning levels obtained by the conventional early warning method.
Since the automated monitoring data has large volume, periodic fluctuations, outliers, and unequal intervals of acquisition time, using the traditional differential method to calculate the velocity and acceleration will inevitably produce large errors. In order to solve this problem, this research proposes using the monitoring data acquired in a certain period, called a time window, to calculate the velocity and acceleration by regression. For the data within a time window before the present, the 3σ criterion is first used to roughly eliminate outliers, then the least-squares method is used for linear regression and quadratic polynomial regression, and finally the speed and acceleration are calculated according to the regression coefficients.
Assume the monitoring data series with unequal intervals as follows:
where is the collection time of the datapoint, and is the cumulative deformation of the datapoint.
In conventional early warning, the velocity and acceleration of the landslide displacement must be calculated, which is usually done using the differential calculation method of the following equation [12]:
However, due to the characteristics of automated monitoring data, such as large volume, periodic fluctuations, outliers, and no equal intervals, this differential calculation method encounters several new problems, such as large oscillations, resulting in many false warnings reported by the early warning system. In order to tackle this challenge, velocity and acceleration are recommended to be estimated using a time window and regression computation. The 3 criterion is first used for coarse rejection of outliers for data within a certain time period (called a time window) before the present, followed by linear and quadratic polynomial regression using the least-squares method, and finally, velocity and acceleration are calculated based on the regression coefficients.
Supposing the time window is , the data used for calculating the speed and acceleration at are
For the above data, first use the 3σ criterion to eliminate obvious outliers, and then use the following equation to perform regression analysis:
Substitute the sequence into Equation (5) and write Equation (5) in the matrix form as follows:
Then, the least-squares method can be used to obtain the optimal value of each coefficient:
Finally, let n = 1, Equation (5) is a linear regression:
Then, the deformation velocity in the current time window is .
Similarly, let n = 2, Equation (5) is a quadratic polynomial regression:
Then, the deformation acceleration in the current time window is . This calculation method utilizes all of the data in the monitoring data series, and the calculated acceleration and velocity have more consistency and less oscillation, which can be utilized to make early warning judgments and reduce false alarms.
2.1.2. Critical Sliding Early Warning
Refs. [13,14] proposed an improved tangent angle method for critical sliding warning. Tangential angles measured at the same time would be different if different coordinate scales are adopted to map the displacement–time curve, which leads to uncertainty in the early warning. In order to solve this uncertainty, they normalized the total deformation with the speed of the CDS, which is:
where is the cumulative displacement, and is the normalized value of . In the monitoring station of a landslide, the velocity at the CDS is a constant value. By Equation (10), the horizontal axis and the vertical axis can be transformed to the time dimension to eliminate the uncertainty in calculating the tangent angle. After the dimensional transformation, the normalized tangent angle can be calculated by the following equation:
where is the normalized tangent angle.
Due to the characteristics of the automated monitoring data, using Equation (11) to calculate the normalized tangent angle will cause a large number of errors, resulting in false early warnings. Similarly, the normalized tangent angle is calculated using the same combination of time windows and the least-squares method as in the previous problem. The following equation is fitted using the least-squares method for the normalized sequence of Equation (10):
The normalized tangent angle can then be determined using the equation below:
As Equation (13) shows, when the normalized tangent angle is smaller than 45°, the landslide is in the initial deformation stage; when is near 45°, it is in the CDS; and when is greater than 45°, it is in the accelerated deformation stage.
2.1.3. Strategies for Determining Early Warning Levels
The conventional warning method and critical sliding warning method have different warning levels. The final early warning level should be determined by different strategies according to different needs:
- Conservative Strategy: choose the higher warning level of the two methods’ results. This strategy is conservative and can ensure the immediacy of early warning, but there may be many false warnings;
- Real Early Warning Strategy: choose the lower warning level of the two methods’ results. This strategy has relatively fewer false warnings but poorer immediacy;
- Single-Method Strategy: use either the conventional early warning method or the critical sliding early warning method to determine the early warning level. Compared with the proposed hybrid early warning method, it obtains less information, so the real early warning rate and immediacy are lower.
The choice of these three strategies needs to be determined according to the actual situation of the specific landslide, and with consideration to the following four main aspects of analysis and decision making:
- Whether a genuine warning for the current landslide existed in the past. If a landslide warning has been issued previously, the conservative strategy should be taken to ensure the warning’s immediacy;
- The risk of landslide instability and the degree of disaster impact. Conservative strategy should be chosen if the risk of landslide instability is high and the impact of a disaster is severe;
- Computing resources for monitoring and early warning systems. If system computing resources are limited, the single-method strategy should be chosen to reduce the amount of calculation for most landslides with low instability risk;
- The quality of monitoring data of the current landslide. If the quality of monitoring data is poor, the real early warning strategy should be chosen to reduce false warnings.
2.2. Method for Determining Early Warning Parameter Values
2.2.1. Velocity Calculation in CDS
The accurate determination of is essential to the calculation of the normalized tangent angle, the core of which is the determination of CDS. Most related studies [5,10,14] depend on empirical determination, which is unreliable. We propose a quantitative calculation method to determine the CDS accurately, which is based on the characteristic that the acceleration in the CDS approaches 0. First, collect all the data acquired from the moment that the deformation of a landslide monitoring station breaks through until the current moment, and then divide the period into several sections evenly, and use Equation (8) to calculate the acceleration of each section to get an acceleration sequence. Finally, the longest sub-sequence that is less than the threshold (generally 1) is obtained. The start and end time of the sub-sequence is the start and end time of the CDS.
After determining the CDS, can be calculated by the following three methods:
Average value method (AVM): Divide the entire CDS into several parts and calculate the velocity of each part. The average value is taken as .
Regression fitting method (RFM): The least-squares method is used to fit Equation (6) to the entire CDS, and the fitting coefficient is .
Gaussian kernel density estimation method (GKDEM): Scan the entire CDS with a certain time window, and use the least-squares method to calculate the velocity in the time window to form a speed sequence . Then use the following formula to calculate the kernel density estimation function:
where is the kernel density estimation of the distribution subject to the variables; is the window width, and is the kernel density function. Generally, the Gaussian kernel function is used:
The velocity at which the kernel density estimate is the maximum is .
2.2.2. Determination of the Time Window
The time window is proposed to reduce the impacts of data fluctuations. A too-large time window will reduce the sensitivity of early warning, but under a too-small time window, the calculation of warning parameters will be greatly affected by fluctuations, and lead to large errors. In this study, the time window is determined by an empirical method as follows:
For the monitoring data with obvious fluctuations, twice the fluctuation period is used as the time window.
For the monitoring data with unobvious fluctuations, 15–30 times the data collection interval is used as the time window.
2.3. Threshold Setting
2.3.1. Thresholds in the Conventional Early Warning Method
The thresholds for , , and are calculated as follows:
After the monitoring equipment is deployed, the data acquired in the first week are collected for statistical analysis, and the upper whisker is taken as . and are about 1.5–2 times and 3–4 times that of , respectively. The data from one week after the monitoring begins was chosen for two main reasons: First, special thresholds and parameters for the current landslide must be established as soon as possible. If it is too late, the early warning’s timeliness and accuracy will be compromised. Second, a certain amount of data is required to analyze the characteristics of data fluctuations caused by monitoring sensor measurement errors, mainly extreme values and periodic characteristics, in order to avoid data fluctuations influencing thresholds and parameters.
The thresholds for , , , , , and are calculated as follows:
Use a time window to scan the data acquired in the first week to obtain the velocity series, and then take the upper whisker of the speed series as . Let = 4, = 8, = 2, = 4, = 6, and = 8.
As the amount of landslide displacement monitoring data increases, the thresholds should be dynamically adjusted. When the landslide has obvious CDS, the velocity of constant deformation can be used as , and then reset = 2, = 4, = 6, and = 8. It should be clarified here that the reason for using 2, 4, 6, and 8 as the boundaries separating the different warning levels is based on the study of Wang et al. [10]. This study proposes to use the displacement speed ratio (DSR), which is the ratio of current landslide deformation speed to the deformation speed of the CDS, as the evaluation index of landslide deformation state, after analyzing and summarizing several landslide deformation processes. This research also offers a DSR-based warning criterion: CDS for DSRs between 0 and 2, initial acceleration stage for DSRs between 2 and 6, medium-acceleration stage for DSRs between 6 and 8, and critical sliding stage for DSRs larger than 8. To meet the warning levels of five levels, the initial acceleration stage with a DSR of 2–6 was separated into two parts, 2–4 and 4–6, in this study.
2.3.2. Normalized Tangent Angle Threshold Criterion
Xu et al. [13,14] investigated and summarized the deformation process of several landslides with creep characteristics, and proposed the concept of the normalized tangent angle, and also provided a threshold criterion for early warning in a targeted manner. In this paper, a local modification was made to further divide two parts between 45° and 80° with 60° as the dividing line, in order to match the needs of five levels of warning-level classification. The criterion has been modified as follows:
, blue warning. The deformation speed is relatively small and requires attention to the subsequent deformation;
, yellow warning. There are some signs of deformation acceleration that should be considered seriously;
, orange warning. The deformation rate is large, so some necessary precautions are required; and
, red warning. The landslide may fail at any time.
3. Case Study: Lishanyuan Landslide
3.1. Landslide Overview
The Lishanyuan landslide is located in Xinhua County, Hunan Province, China (see Figure 3). The volume of the entire landslide is approximately 1.08 × 10⁵ m3, with a sliding length of 120 m and a width of approximately 300 m. It is a shallow landslide with an average thickness of the sliding surface of approximately 3 m. The main sliding direction of the landslide is 210°. There was a small road passing through the landslide. The landslide started deforming in 1996 due to the erosion at the slope toe and the variation of the water level of the Zhexi Reservoir. It deformed slowly from 1996 to 2012. In 2013, it slid, and the small road moved down. Heavy rainfall during the flood season causes landslides. In April 2018, the slope collapsed again and material with a volume of 600 m3 rushed into the houses at the hill foot, which caused a direct loss of about RMB 600,000. The on-site investigation showed that the landslide was a small composite gravel landslide.
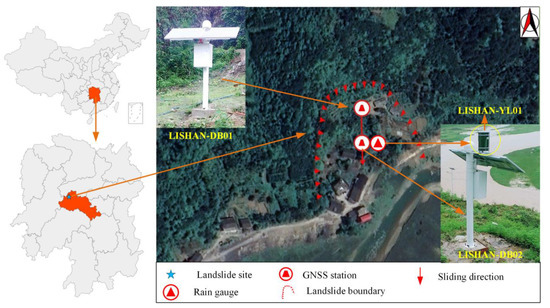
Figure 3.
Location of the Lishanyuan landslide and distribution of the monitoring stations.
3.2. Overview of Landslide Monitoring
The monitoring equipment was deployed on 15 April 2021 (Figure 3), and the automated monitoring of the landslide began. Two GNSS monitoring stations, named LISHAN-DB01 (DB01) and LISHAN-DB02 (DB02), were deployed on the main slip profile of the landslide, and one GNSS base station was deployed on the lower side of the road. The automated monitoring system received the first monitoring data at 17:00 on 15 April. The default collection interval of the GNSS monitoring station was 1 h, but this was adjusted to 30 min, due to the obvious acceleration of the landslide on 17 May. A rain gauge, LISHAN-YL01 (YL01), was deployed at the same location as DB02 and its collection interval was set to 20 min. Until 10 o’clock on 2 June 2021, a total of 6031 monitoring data have been collected, including 2814 GNSS monitoring data and 3217 rainfall monitoring data (Figure 4).
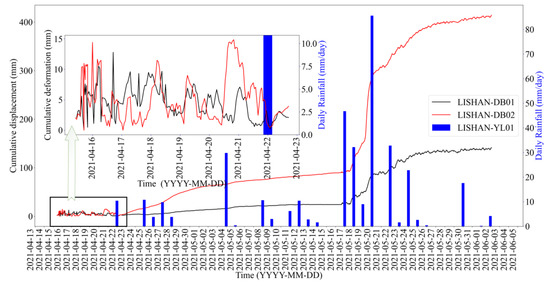
Figure 4.
Monitoring data of the Lishanyuan landslide.
As Figure 4 shows, the two monitoring stations have similar deformation trends, but the deformation amplitude of DB02 is significantly larger than that of DB01, which is consistent with the on-site investigation. We take DB02 as an example. The monitoring data first showed a fluctuation of 10 mm in the first week. Affected by the rainfall on 22 April, the landslide started an acceleration process from 4:00 a.m. on 23 April, and this acceleration process gradually slowed down at 11:00 a.m. on 24 April. A new round of constant deformation processes started at 18:00 a.m. on 25 April. On 17 May, affected by the continuous heavy rainfall, the landslide began a new round of deformation acceleration. This acceleration continued until 12 o’clock on the 20th, then it turned to deceleration, and entered a new round of constant deformation processes.
3.3. Thresholds Setting
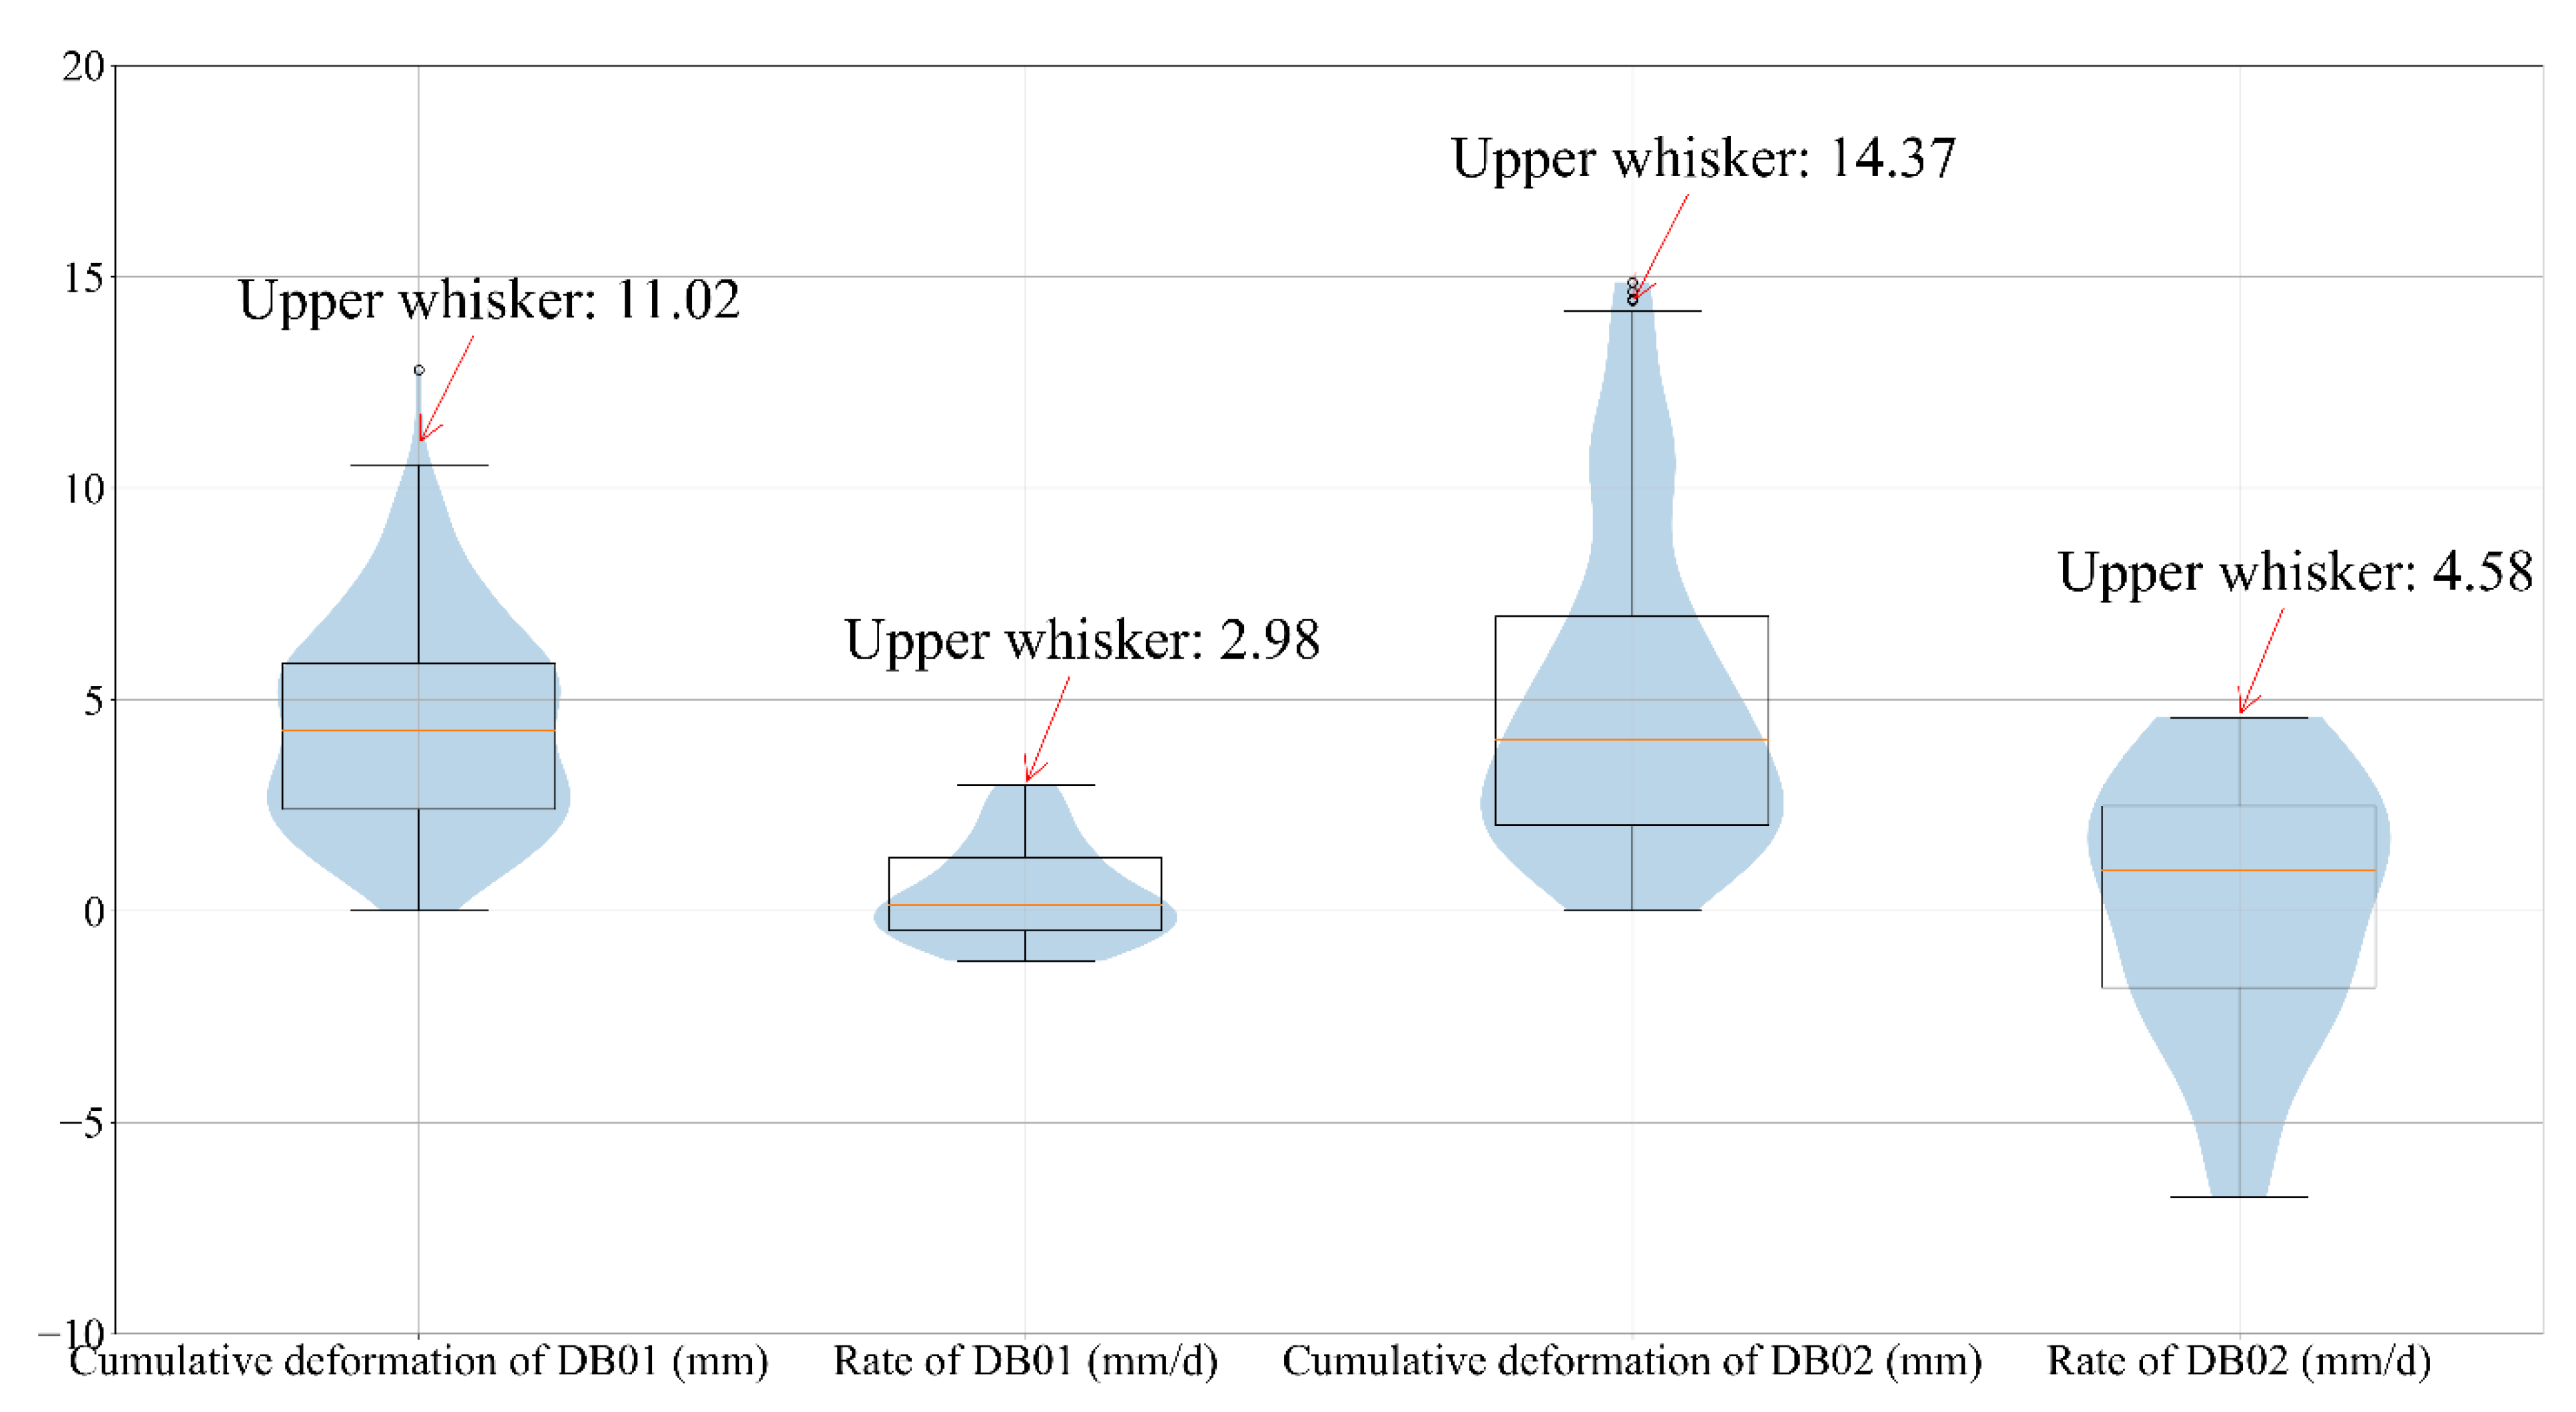
After deploying and debugging the Lishanyuan landslide monitoring system, we set the thresholds for the landslide early warning. After receiving the first data on 15 April, monitors need to artificially pay attention to data changes every day for the next week. After collecting data for one week, the initial monitoring threshold is determined by using the method in Section 2.3.1 for monitoring data. The statistical results are shown in Figure 5 and the nearest integer of the upper whisker is taken as the value of and . In order to ensure the immediacy of early warning, and are set as 1.5 times and 3 times , respectively. The initial warning strategy is the conventional warning in the single-method strategy, and the time window is still 48 h.

Figure 5.
Cumulative displacement and velocity distribution of each monitoring station of the Lishanyuan landslide from 15 April to 23 April.
On 13 May, the monitors observed that the data from both GNSS monitoring stations on the landslide showed CDS. The method described in Section 2.2.1 was used to automatically pick up the start and end time of the CDS of each GNSS monitoring station. Then, three different methods were used to calculate the velocity of the CDS (see Table 2), and the average of their results is taken as the final . Finally, , , , and of each GNSS monitoring station was updated. Table 3 summarizes the landslide’s threshold settings. Because the landslide has previously obtained real alarms, the risk of instability is very high, and once it collapses, it will cause serious damage to the road. The data quality is also good, and the monitoring and warning system has many computing resources, so the strategy has been switched to the conservative strategy at this time to ensure the immediacy of the warning.
Table 2.
The velocity of the two monitoring stations of the Lishanyuan landslide in the CDS.
Table 3.
The thresholds of the Lishanyuan landslide.
3.4. Early Warning Analysis
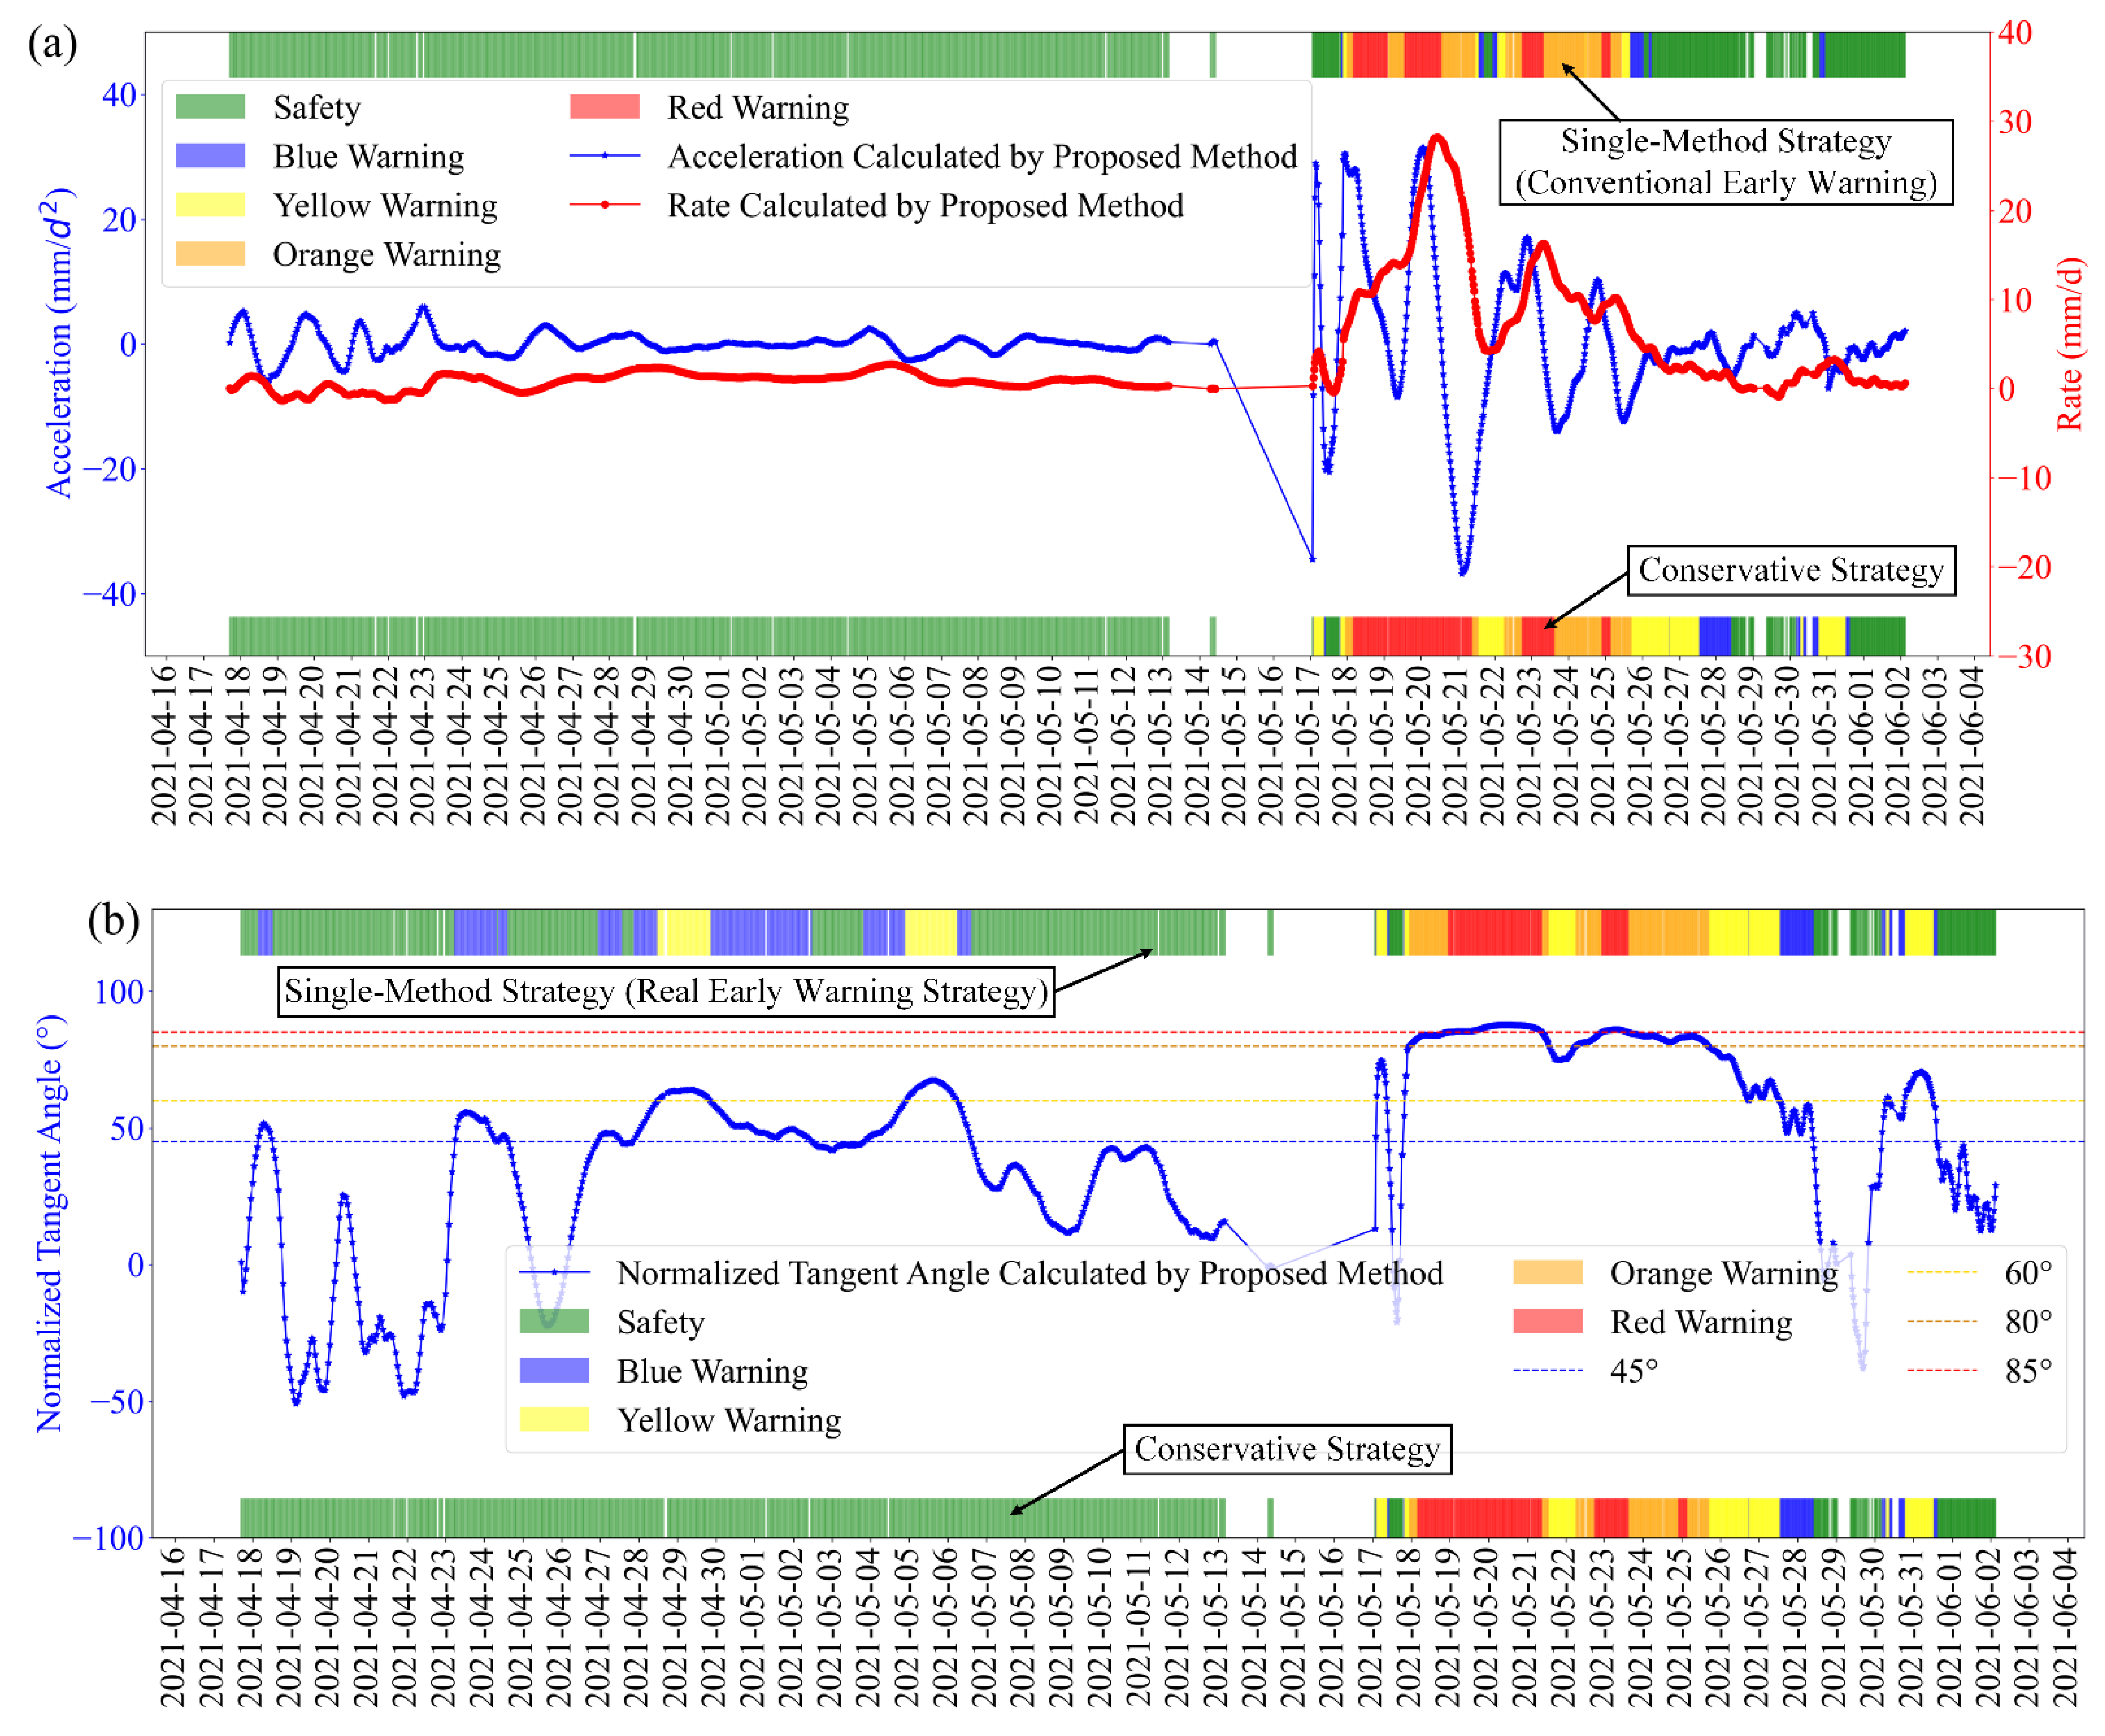
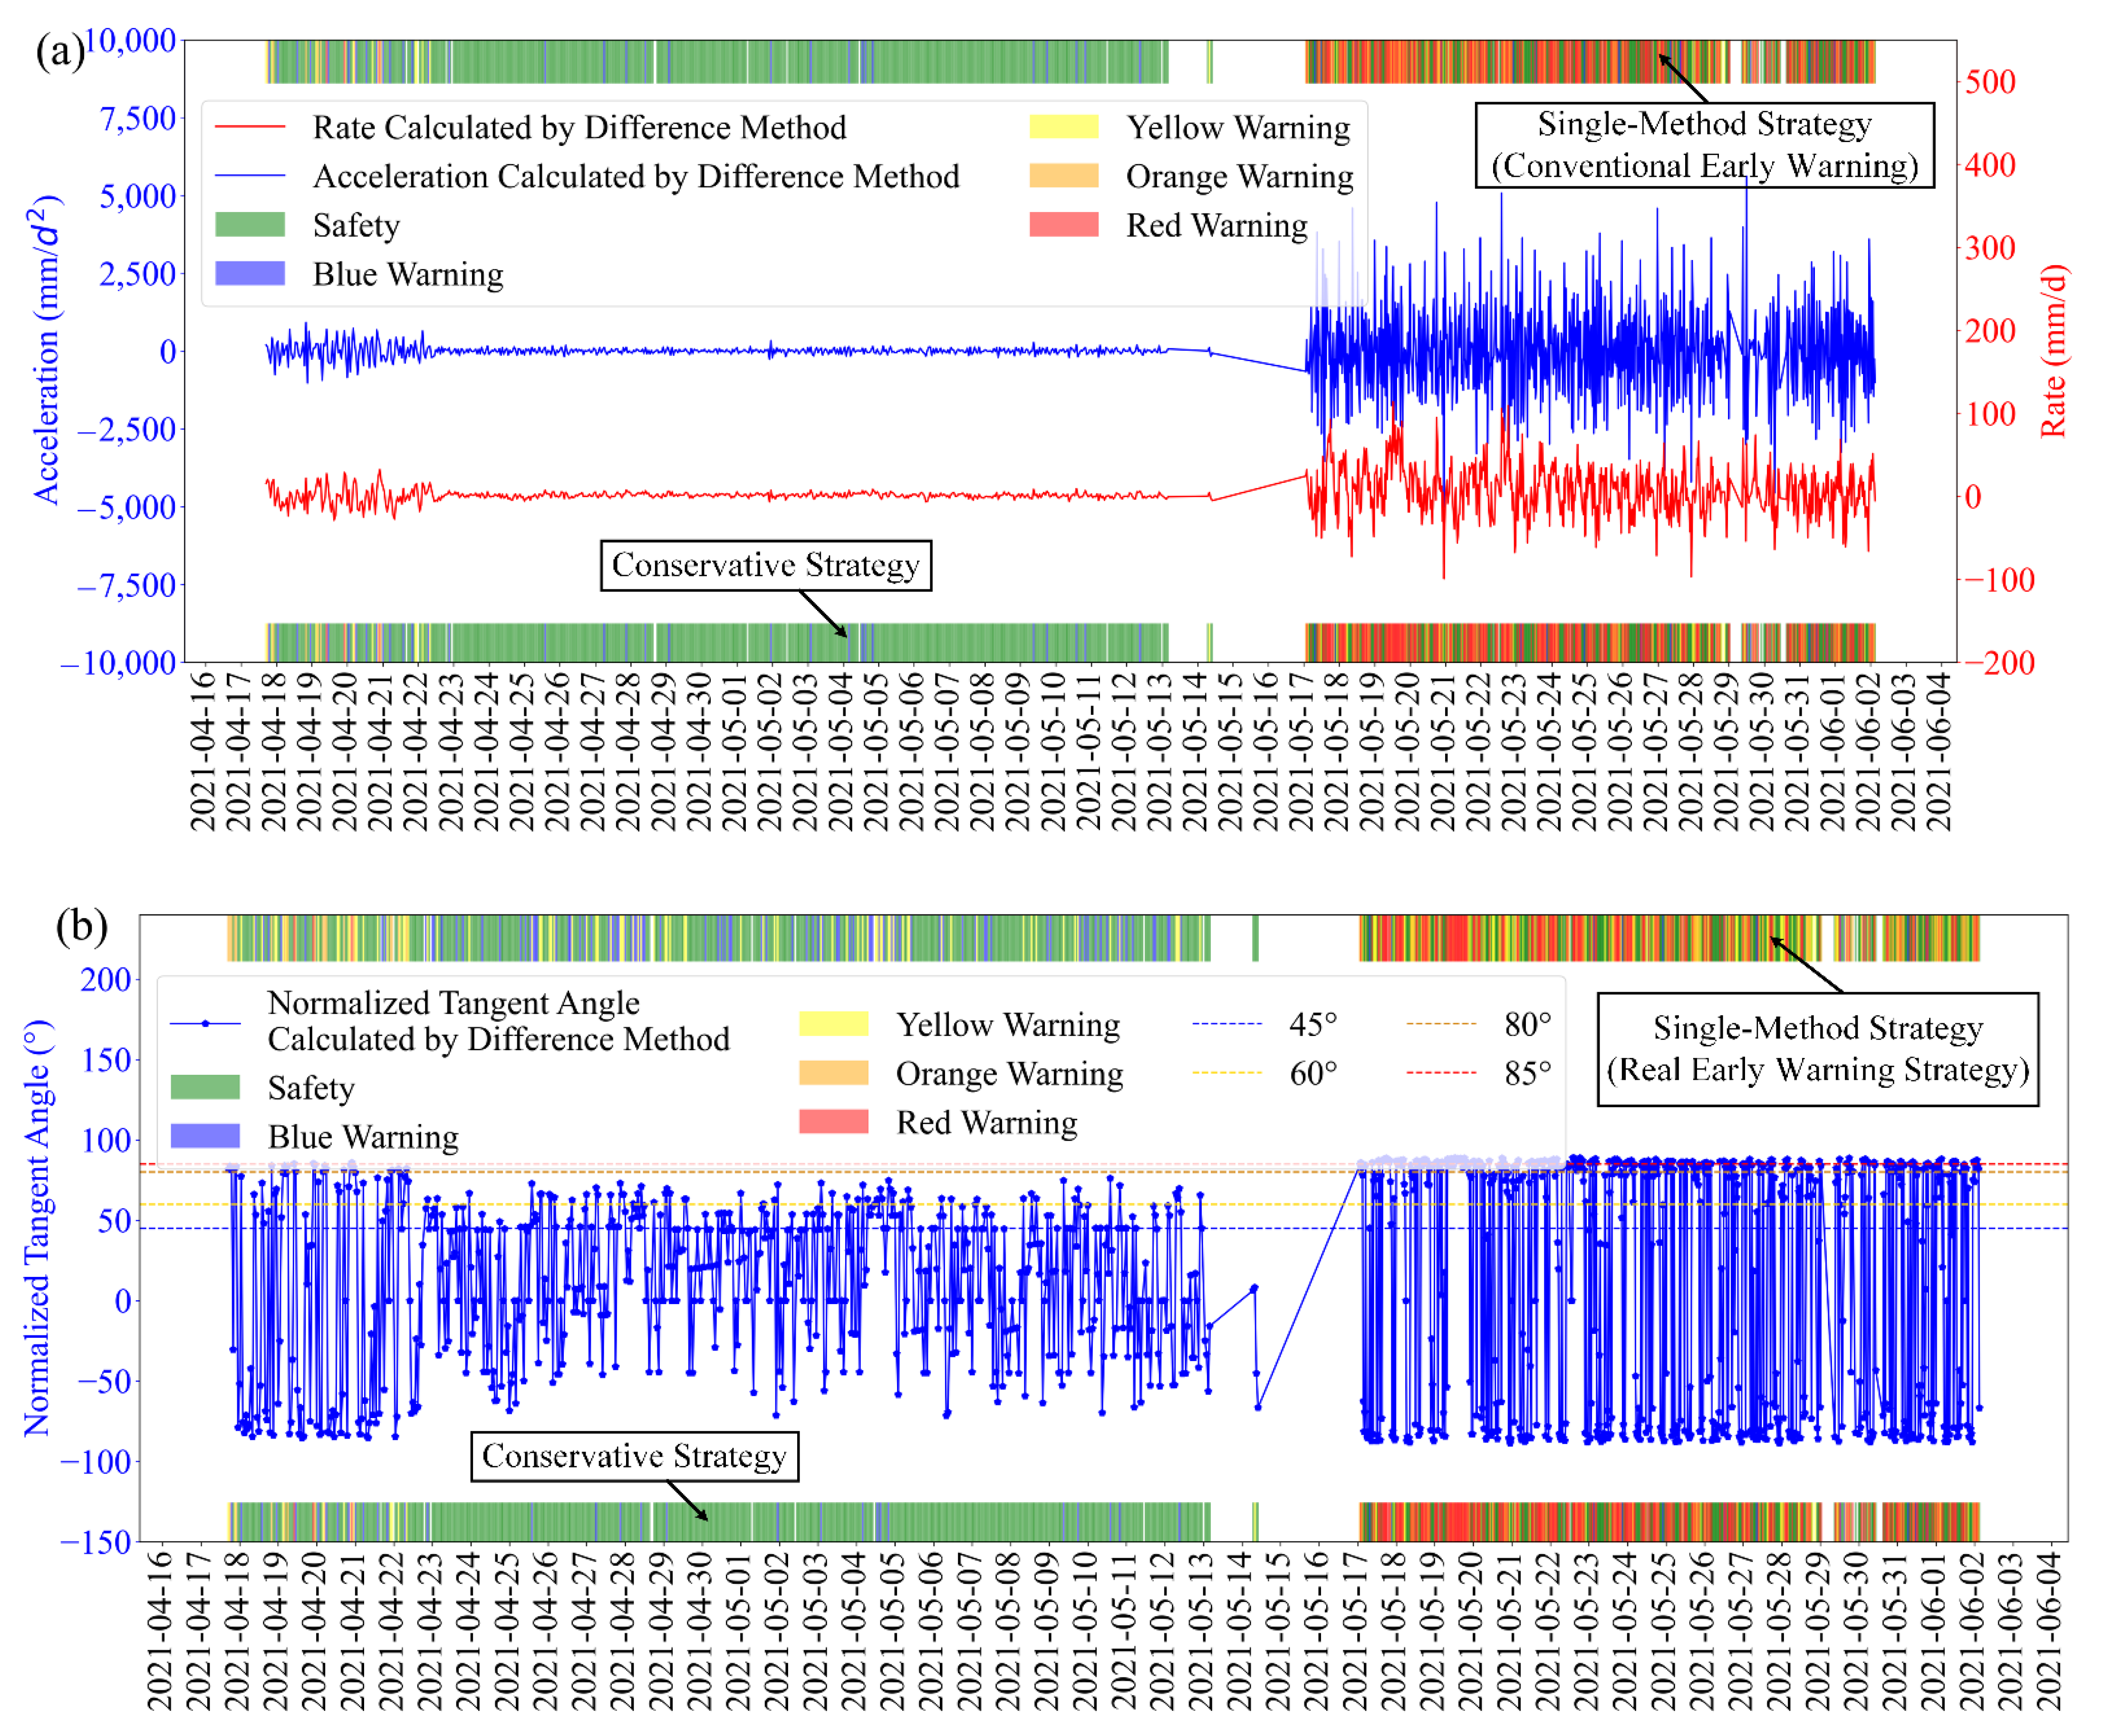
The data collected by the two GNSS monitoring stations are used for early warning calculations by the proposed hybrid method. The thresholds of different stages are listed in Table 3. The early warning results of the two stations are shown in Figure 6 and Figure 7. Subplots (a) in Figure 6 and Figure 7 show the velocity and acceleration calculated for the conventional warning, and the colored bars on the top side of the figure show the warning results obtained using the single-method strategy (conventional warning), while the colored bars on the bottom side show the warning results obtained using the conservative strategy. Subplots (b) in Figure 6 and Figure 7 show the calculated normalized tangent angles, and the colored bars on the upper side show the warning results obtained using the single-method strategy (critical sliding early warning), while the lower side shows the warning results obtained using the conservative strategy.
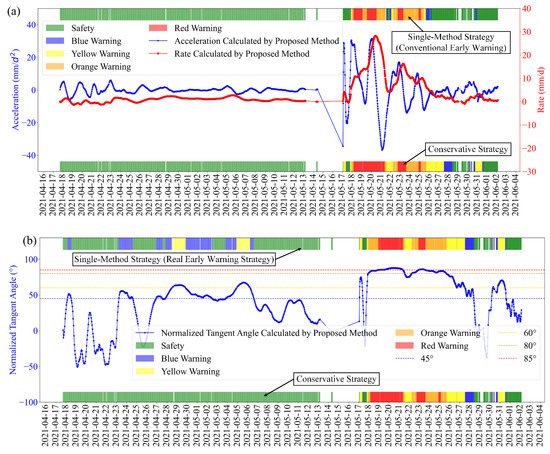
Figure 6.
Early warning results of the LISHAN-DB01 monitoring station obtained by the proposed method. (a) Results of the conventional warning method based on velocity and acceleration. (b) Results of the critical sliding warning method based on the normalized tangent angle.
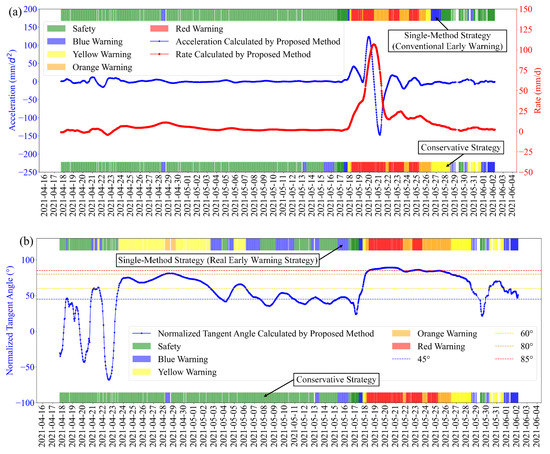
Figure 7.
Early warning results of the LISHAN-DB02 monitoring station obtained by the proposed method. (a) Results of the conventional warning method based on velocity and acceleration. (b) Results of the critical sliding warning method based on the normalized tangent angle.
From the Figure 6 and Figure 7, it can be found that the early warning results obtained by using the proposed method can reflect the landslide acceleration process well and have good continuity. As the two stations have the same deformation trend, we only calculate the results of LISHAN-DB02. This station is first warned by the conventional early warning method, during which, a blue warning event is triggered. After the calculation on 13 May, the LISHAN-DB02 started critical sliding early warning, and the early warning strategy was changed to the conservative strategy. Table 4 lists some key early warning events at LISHAN-DB02.
Table 4.
Key early warning events at the LISHAN-DB02 monitoring station.
The on-site inspection on 19 May found many cracks in the landslide body (see Figure 8), obvious slip of the slope body, soil accumulation at the landslide toe, and local small debris flows, which are consistent with the monitoring and early warning results.
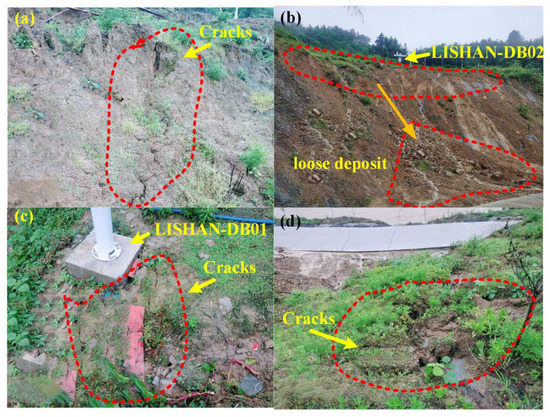
Figure 8.
Photos of the Lishanyuan landslide on 19 May.
3.5. Comparative Analysis
Using the same thresholds, the traditional differential method is also applied to calculate the early warning based on the monitoring data of the two GNSS monitoring stations. As shown in Figure 9 and Figure 10, the calculated velocity, acceleration, and normalized tangent angle have strong fluctuations, which makes it difficult to reflect the deformation state of the landslide.
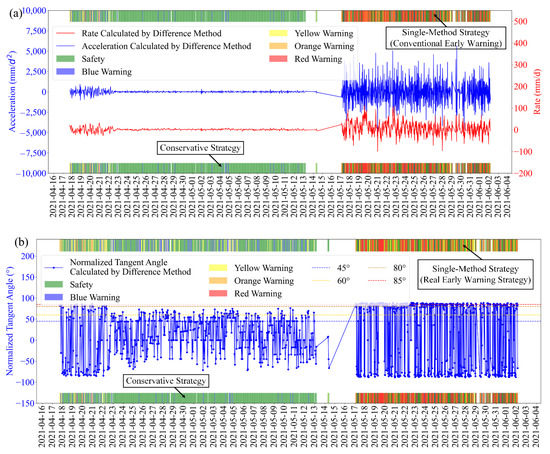
Figure 9.
Early warning results of the LISHAN-DB01 monitoring station obtained by the traditional difference method. (a) Conventional warning based on velocity and acceleration (b) critical sliding warning based on the normalized tangent angle.
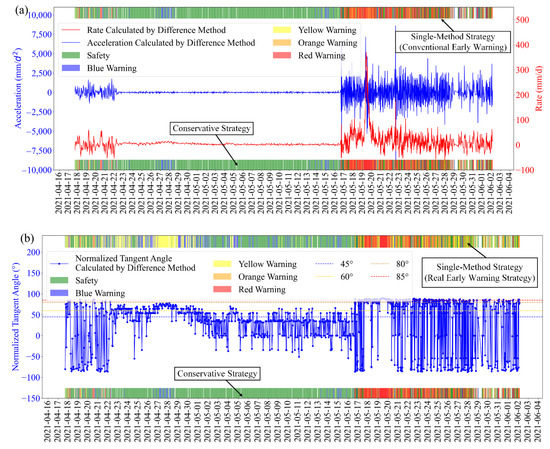
Figure 10.
Early warning results of the LISHAN-DB02 monitoring station obtained by the traditional difference method. (a) Conventional warning based on velocity and acceleration (b) critical sliding warning based on the normalized tangent angle.
There were intensive warnings during the accelerating deformation stage on 17 May, but they were mixed with a large number of false warnings, so the percentage of real warnings is relatively low. The curves of velocity, acceleration, and normalized tangent angle calculated by the proposed method are smooth, and can reflect each acceleration deformation process, thereby reducing false warnings.
4. Discussion
As landslide monitoring technology becomes more automated, and data volume and type become more enriched, more focus has been put on how to use automated monitoring data to quickly and accurately identify the landslide acceleration process and then carry out early warning work. In this paper, a hybrid early warning algorithm based on the parameters of cumulative displacement, velocity, acceleration, and normalized tangent angle is proposed for automated monitoring data from landslides, which primarily includes threshold determination, parameter selection, and early warning criterion judgment. The method was then tested using the Lishanyuan landslide as a case study.
The proposed method combines the conventional warning method with the critical sliding warning method according to different strategies. The conventional warning method relies on the characteristics of cumulative displacement, velocity, acceleration, and the given thresholds to determine the warning level. This method requires almost no prior parameters and can be used throughout the monitoring and warning process, but threshold selection is more difficult and requires dynamic adjustment throughout the monitoring period. Although this paper provides a semi-empirical and semi-quantitative method, there is no way to provide an early warning of the landslide’s critical sliding stage, and it can only serve as a backup in this stage. In contrast, the critical sliding warning method uses the normalized tangent angle as a criterion, which requires the velocity of the CDS to perform the normalization operation. The calculation and selection of necessitate a longer period of monitoring, so it can’t be used for a long time after the monitoring begins. Combining these two methods according to different strategies has two main advantages: Firstly, the hybrid of two methods can cover the entire monitoring life cycle with the identification and early warning of a landslide’s accelerated deformation processes. Secondly, different hybrid strategies can be selected based on different scenarios, balancing the needs for immediacy, accuracy, and computational resources of early warning.
The differential calculation approach studied by Xu et al. [13,14] and Wang et al. [10] may lead to significant oscillations and distortions in parameters such as velocity, acceleration, and normalized tangent angle, resulting in a large number of false warnings for automated monitoring data with characteristics such as large volume, unequal collection intervals, more anomalous data, and serious data fluctuations. To overcome this challenge, this study offers calculating various parameters using least-squares regression of the data inside a time window. This calculation approach not only uses substantially more data than the traditional difference calculation method, but it also has a noticeable continuous smoothness, which reduces the number of false warnings even further.
In conclusion, the early warning method proposed in this paper can not only identify a landslide’s accelerated deformation processes quickly and accurately using automated monitoring data throughout the monitoring life cycle, but it can also flexibly take into account user requirements for immediacy, accuracy, and computational resources of the early warning system using different strategies. However, many aspects of the method proposed in this paper need to be improved. For example, the determination of some of these parameters still relies on experience. Future optimization is needed to combine the evolution mechanisms of multiple physical fields inside the landslide.
5. Conclusions
To obtain early warnings of creep landslides by automated monitoring, this paper proposes a hybrid warning method combining the conventional warning method based on cumulative deformation, velocity, and acceleration with the critical sliding warning method based on the normalized tangent angle. The application in the Lishanyuan landslide shows that the proposed method can cover the whole life cycle of landslide monitoring and can accurately grasp the accelerating deformation process of creep landslides while reducing false early warnings to the greatest extent.
Considering the characteristics of automated monitoring data from landslides, such as large volume, periodic fluctuation, outliers, and unequal collection intervals, this paper proposes the concept of time windows and uses the data within time windows to calculate deformation parameters such as velocity, acceleration, and the normalized tangent angle by the least-squares method after preprocessing, which makes full use of monitoring data and reduces calculation errors.
We also propose some methods for calculating the thresholds in the conventional early warning and the critical sliding warning method. These methods are more reliable than the empirical-based methods.
Accurate grasp of each accelerating deformation process of a landslide is a prerequisite for the critical sliding early warning. The method proposed in this paper not only assists landslide monitoring practitioners in identifying a landslide’s displacement acceleration process quickly and accurately, but also allows the selection of different strategies to adjust the allocation of computational resources according to different scenarios and needs, lowering the cost of monitoring and warning systems and being of great importance for future large-scale automated landslide monitoring.
Author Contributions
Conceptualization, D.B. and G.L.; methodology, D.B.; software, D.B.; validation, D.B. and J.F.; formal analysis, D.B.; investigation, D.B.; resources, Z.Z.; data curation, D.B.; writing—original draft preparation, D.B.; writing—review and editing, G.L., Z.Z., X.Z., C.T., J.F.; visualization, D.B., X.Z., C.T.; supervision, G.L.; project administration, G.L.; funding acquisition, G.L. All authors have read and agreed to the published version of the manuscript.
Funding
This research was funded by National Natural Science Foundation of China, grant number: 41974148; Key research and development program of Hunan Province of China, grant number: 2020SK2135; Natural Resources Research Project in Hunan Province of China, grant number: 2021-15; and Department of Transportation of Hunan Province of China, grant number: 202012.
Institutional Review Board Statement
Not applicable.
Informed Consent Statement
Not applicable.
Data Availability Statement
Not applicable.
Acknowledgments
We would like to thank the editor and the reviewers for helping us improve the quality of the manuscript.
Conflicts of Interest
The authors declare no conflict of interest.
References
- National Bureau of Statistics of People’s Republic of China. China Statistical Yearbook 2020; China Statistics Press: Beijing, China, 2021; ISBN 1671-2552. [Google Scholar]
- Bai, D.; Tang, J.; Lu, G.; Zhu, Z.; Liu, T.; Fang, J. The Design and Application of Landslide Monitoring and Early Warning System Based on Microservice Architecture. Geomat. Nat. Hazards Risk 2020, 11, 928–948. [Google Scholar] [CrossRef]
- Benoit, L.; Briole, P.; Martin, O.; Thom, C.; Malet, J.P.; Ulrich, P. Monitoring Landslide Displacements with the Geocube Wireless Network of Low-Cost GPS. Eng. Geol. 2015, 195, 111–121. [Google Scholar] [CrossRef]
- Ju, N.; Huang, J.; He, C.; Van Asch, T.W.J.; Huang, R.; Fan, X.; Xu, Q.; Xiao, Y.; Wang, J. Landslide Early Warning, Case Studies from Southwest China. Eng. Geol. 2020, 279, 105917. [Google Scholar] [CrossRef]
- Xu, Q.; Peng, D.; Zhang, S.; Zhu, X.; He, C.; Qi, X.; Zhao, K.; Xiu, D.; Ju, N. Successful Implementations of a Real-Time and Intelligent Early Warning System for Loess Landslides on the Heifangtai Terrace, China. Eng. Geol. 2020, 278, 105817. [Google Scholar] [CrossRef]
- Wu, Y.; Niu, R.; Wang, Y.; Chen, T. A Fast Deploying Monitoring and Real-Time Early Warning System for the Baige Landslide in Tibet, China. Sensors 2020, 20, 6619. [Google Scholar] [CrossRef]
- Scoppettuolo, M.R.; Cascini, L.; Babilio, E. Typical Displacement Behaviours of Slope Movements. Landslides 2020, 17, 1105–1116. [Google Scholar] [CrossRef]
- Fukuzono, T. New Methods for Predicting the Failure Time of a Slope: Fukuzono, T Proc 4th International Conference and Field Workshop on Landslides, Japan, 23–31 Aug 1985 P145–150. Publ Tokyo: Japan Landslide Society, 1985. Int. J. Rock Mech. Min. Sci. Geomech. Abstr. 1987, 24, A34. [Google Scholar] [CrossRef]
- Saito, M. Forecasting the Time of Occurrence of a Slope Failure. Int. Soc. Soil Mech. Geotech. Eng. 1965, 6, 537–541. [Google Scholar]
- Wang, L.; Xie, M.; Chai, X. Research on Method of Displacement Speed Ratio for Spatial Evaluation of Landslide Deformation. Rock Soil Mech. (Chin.) 2014, 35, 519–528. [Google Scholar] [CrossRef]
- Zhou, X.-P.; Liu, L.-J.; Xu, C. A Modified Inverse-Velocity Method for Predicting the Failure Time of Landslides. Eng. Geol. 2020, 268, 105521. [Google Scholar] [CrossRef]
- Valletta, A.; Carri, A.; Segalini, A. Definition and Application of a Multi-Criteria Algorithm to Identify Landslide Acceleration Phases. Georisk 2021, 1–15. [Google Scholar] [CrossRef]
- Xu, Q.; Zeng, Y.; Qian, J.; Wang, C.; He, C. Study on a Improved Tangential Angle and the Corresponding Landslide Pre-Warning Criteria. Geol. Bull. China 2009, 28, 501–505. [Google Scholar]
- Xu, Q.; Yuan, Y.; Zeng, Y.; Hack, H. Some New Pre-Warning Criteria for Creep Slope Failure. Sci. China Technol. Sci. 2011, 54, 210–220. [Google Scholar] [CrossRef]
- Bao, L.; Zhang, G.; Hu, X.; Wu, S.; Liu, X. Stage Division of Landslide Deformation and Prediction of Critical Sliding Based on Inverse Logistic Function. Energies 2021, 14, 1091. [Google Scholar] [CrossRef]
- Carri, A.; Valletta, A.; Cavalca, E.; Savi, R.; Segalini, A. Advantages of IoT-Based Geotechnical Monitoring Systems Integrating Automatic Procedures for Data Acquisition and Elaboration. Sensors 2021, 21, 2249. [Google Scholar] [CrossRef]
- Gamperl, M.; Singer, J.; Thuro, K. Internet of Things Geosensor Network for Cost-Effective Landslide Early Warning Systems. Sensors 2021, 21, 2609. [Google Scholar] [CrossRef] [PubMed]
- Jin, D.; Li, J.; Gong, J.; Li, Y.; Zhao, Z.; Li, Y.; Li, D.; Yu, K.; Wang, S. Shipborne Mobile Photogrammetry for 3D Mapping and Landslide Detection of the Water-Level Fluctuation Zone in the Three Gorges Reservoir Area, China. Remote Sens. 2021, 13, 1007. [Google Scholar] [CrossRef]
- Khan, M.W.; Dunning, S.; Bainbridge, R.; Martin, J.; Diaz-Moreno, A.; Torun, H.; Jin, N.; Woodward, J.; Lim, M. Low-Cost Automatic Slope Monitoring Using Vector Tracking Analyses on Live-Streamed Time-Lapse Imagery. Remote Sens. 2021, 13, 893. [Google Scholar] [CrossRef]
- Liu, B.; He, K.; Han, M.; Hu, X.; Ma, G.; Wu, M. Application of UAV and GB-SAR in Mechanism Research and Monitoring of Zhonghaicun Landslide in Southwest China. Remote Sens. 2021, 13, 1653. [Google Scholar] [CrossRef]
- Cenni, N.; Fiaschi, S.; Fabris, M. Integrated Use of Archival Aerial Photogrammetry, GNSS, and InSAR Data for the Monitoring of the Patigno Landslide (Northern Apennines, Italy). Landslides 2021, 18, 2247–2263. [Google Scholar] [CrossRef]
- Shen, N.; Chen, L.; Wang, L.; Hu, H.; Lu, X.; Qian, C.; Liu, J.; Jin, S.; Chen, R. Short-Term Landslide Displacement Detection Based on GNSS Real-Time Kinematic Positioning. IEEE Trans. Instrum. Meas. 2021, 70, 1004714. [Google Scholar] [CrossRef]
- Tan, Q.; Wang, P.; Hu, J.; Zhou, P.; Bai, M.; Hu, J. The Application of Multi-Sensor Target Tracking and Fusion Technology to the Comprehensive Early Warning Information Extraction of Landslide Multi-Point Monitoring Data. Measurement 2020, 166, 108044. [Google Scholar] [CrossRef]


Publisher’s Note: MDPI stays neutral with regard to jurisdictional claims in published maps and institutional affiliations. |
© 2022 by the authors. Licensee MDPI, Basel, Switzerland. This article is an open access article distributed under the terms and conditions of the Creative Commons Attribution (CC BY) license (https://creativecommons.org/licenses/by/4.0/).