1. Introduction
Landslide disasters are extremely common around the world and are characterized by their sudden occurrence, wide distribution and being highly destructive [
1]. Landslide disasters cause serious damage to the local residents, as well as natural resources, ecology and the environment. However, it is difficult to accurately forecast the location, time and intensity of occurrence. Landslide deformation monitoring and early warning help reduce the damages caused by landslide disaster. Therefore, related studies are abundant [
2,
3].
With the development of monitoring technology, such as GPS, InSAR technology and 3D laser scanning, huge amounts of high temporal and spatial resolution data have become available. Furthermore, automatic landslide identification technology has been developed, laying the foundation for the development of landslide early warning technology.
A landslide monitoring system mainly includes risk identification, monitoring, early warning and emergency response measures. Risk identification is mainly carried out by geological experts to determine whether the slope is at risk by field exploration [
4]. Monitoring is an important part of the whole system and the basis of early warning, which consists of various types of sensors, such as rain gauges [
5], inclinometers [
6], etc. With the development of monitoring technology, the level of landslide monitoring has been significantly improved [
7], and gradually transitioned from low precision and manual monitoring in the past to high precision and automated monitoring, such as global navigation satellite system (GNSS), light detection and ranging (LIDAR) [
8], 3D laser scanning [
9], etc. Compared with conventional monitoring means, the new technology will also have more landslide monitoring data, which lays the foundation for the development of landslide early warning technology. The emergency response measures are the response methods after the landslide occurrence warning, and the relevant person in charge is notified by SMS or email. The early warning part is the key to the whole system, an important means to reduce the loss caused by landslide, and also the core of this study. At present, landslide warning depends on traditional empirical threshold warning methods, which use the threshold value as the discriminating criterion. The threshold value is generally determined according to the landslide development trend combined with expertise experience. Many scholars use landslide displacement rate, tangent angle and rainfall as landslide warning criteria [
10,
11,
12,
13,
14,
15] for real-time landslide warning. Li et al. [
16] set a velocity threshold for early warning based on the actual creep of large rock landslides. Guzzetti et al. [
17] determined the minimum rainfall intensity and duration as a threshold for landslide warning by analyzing the relationship between landslides and rainfall. C. Atzeni et al. [
18] used ground-based interferometric synthetic aperture radar (GBInSAR) to monitor landslide deformation and set displacement rate thresholds for early warning. Ponziani et al. [
19] analyzed the relationship between soil moisture and rainfall (rainfall impact was quantified as the 24, 36 and 48 h maximum cumulative rainfall values) to monitor and warn landslides.
Mass landslide monitoring results show that landslides of different materials (soil, rock, etc.), sizes and trigger factors have very different deformation thresholds, so we cannot set one threshold for all landslides. Improper threshold causes false alarm or missing alarm.
In the era of big data, data analysis, such as numerical simulation and machine learning, has been used for landslide early warning [
20,
21,
22]. Some efforts have been made to analyze landslide deformation data to extract the deformation characteristics and obtain the relationship among trigger factors. Data analysis was employed to select appropriate thresholds for landslide warning. Valletta A et al. [
23] identified the beginning of the landslide acceleration process by using a multi-criteria approach to analyze monitoring displacement data, so as to reduce the false alarms caused by minor landslide acceleration. Xu et al. [
24] proposed a phase division method to explore the tangent angle characteristics of the displacement time curve and proposed an early warning method based on the improved tangent angle. However, the improved tangent angle requires the average velocity during the constant deformation phase of the landslide, which is difficult to obtain at the beginning of monitoring. Bai et al. [
25] combined the conventional warning method based on the threshold of cumulative displacement, velocity and acceleration, with the method on the basis of normalized tangent angle. They used the time window method to analyze the monitoring data and calculate the warning parameters. They proposed a warning method that divides the warning into normal level and dangerous level. This method improves the warning accuracy, but the parameter determination still depends on experience. Dai et al. [
26] proposed a landslide warning method on the basis of displacement back-analysis based on long short-term memory networks (DBA-LSTM) and numerical simulation algorithm. The method was verified in the Shangtan landslide, Guangxi Province, China. However, the prediction ability of DBA-LSTM calculation depends on the correct choice of the model parameter setting.
The above methods effectively improve the accuracy of landslide warning, but they all need some a priori parameters, which determine the accuracy of the algorithms. The selection of these parameters relies on experience, which is not robust. The clustering and classification algorithms, such as K-means method and ResNet method, do not set thresholds for early warning, but classify the warning according to landslide deformation state. The K-means method is an unsupervised clustering method, which is widely used for landslide deformation state classification, due to its simple principle, convenient calculation and rapid convergence [
27]. The ResNet method is a supervised classification method that uses a residual structure to improve the accuracy of deep network training. It has been widely used in landslide early warning [
28].
This study proposes a landslide early warning model based on the K-means-ResNet fast classification algorithm, which does not require setting a priori parameters. Firstly, considering the velocity changes in landslide deformation, we use the K-means algorithm to cluster the deformation states of landslides and define the dangerous categories. Then, the features obtained by gray correlation analysis are used as input features. Based on the ResNet algorithm, we establish a classifier that can automatically recognize the landslide deformation state by adaptively searching for suitable features. In order to verify the performance of the model, the Zhongma landslide in Guangxi Province and Shangmao landslide, in Hunan Province, China, are selected as the study cases, because they are relatively representative landslides in their regions, and there are signs of sliding. They will continue to slide for some time in the future, and the landslide instability will cause more serious economic losses and casualties. Analyzing the data of these two landslides is beneficial to the subsequent early warning. The proposed method is also compared with models such as MLP and LeNet and traditional threshold warning.
2. Methodology
2.1. Time Series Decomposition
Landslide displacement data and rainfall data are all time series data, and can be written as .
Landslide time series decomposition can obtain multiple unlabeled subsequences, providing a data basis for landslide data clustering. The landslide time series data are generally processed by the sliding window. Specifically, the time series is divided into multiple equal-length subsequences by a window with the length of w sliding sequentially over the series with a step of d.
2.2. Landslide State Clustering and Dataset Production
The K-means algorithm is an unsupervised clustering algorithm [
29]. Using Euclidean distance for evaluating data similarity, the method adds classification labels to the landslide data, adaptively classifies the landslide temporal data and produces a dataset for subsequent classification by the ResNet algorithm.
Its basic idea is to initialize K cluster class centers and classify the samples of each cluster according to their distance to the cluster centroid at first. Then, iterate to achieve the minimum distance between the sample and the cluster center.
The loss function is Equation (1).
where
denotes the data point,
denotes the dataset of class
and
is the center of cluster
.
The K-means clustering algorithm consists of the following steps:
- (1)
Initialize the centers of K clusters, , , …, .
- (2)
Calculate the distance from a data point to all cluster centers, and take the label of the closest one (Equation (2)) as the label of that data point.
- (3)
Update the clustering center according to the results of step 2.
- (4)
Repeat steps 2 and 3 until convergence, i.e., the clustering centers do not change.
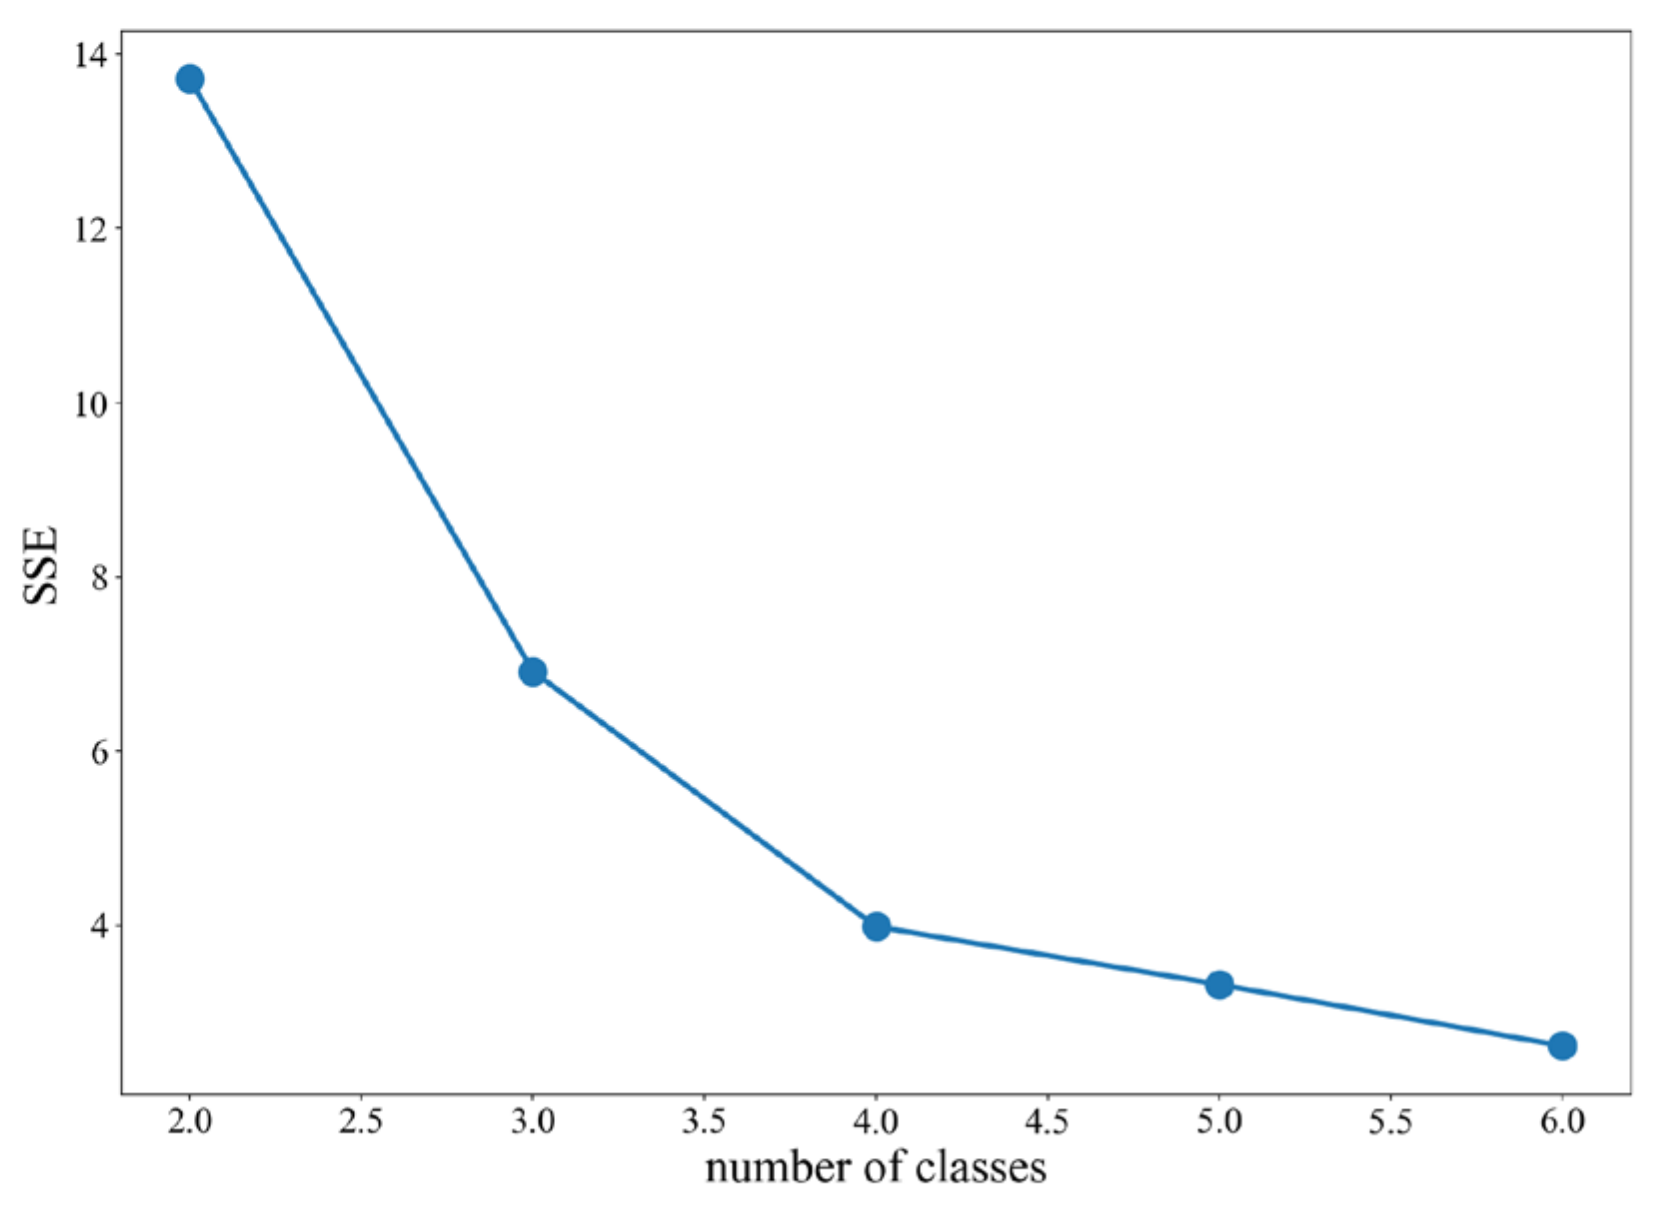
The K-means algorithm divides the data into K clusters, and the effect of the algorithm vary greatly with the K value, which is determined by the elbow method.
The core metric of the elbow method is the sum of the squared errors (
SSE).
where
is the
-th cluster,
is the sample point in
,
is the centroid of
(the mean of all samples in
) and
SSE is the clustering error of all samples, which reflects the clustering effectiveness.
As the number of categories increases, the decline in SSE slows down abruptly, then levels off as the value of k continues increasing. The elbow method selects the inflection point as the K.
2.3. Deep Residual Networks
ResNet is a neural network structure [
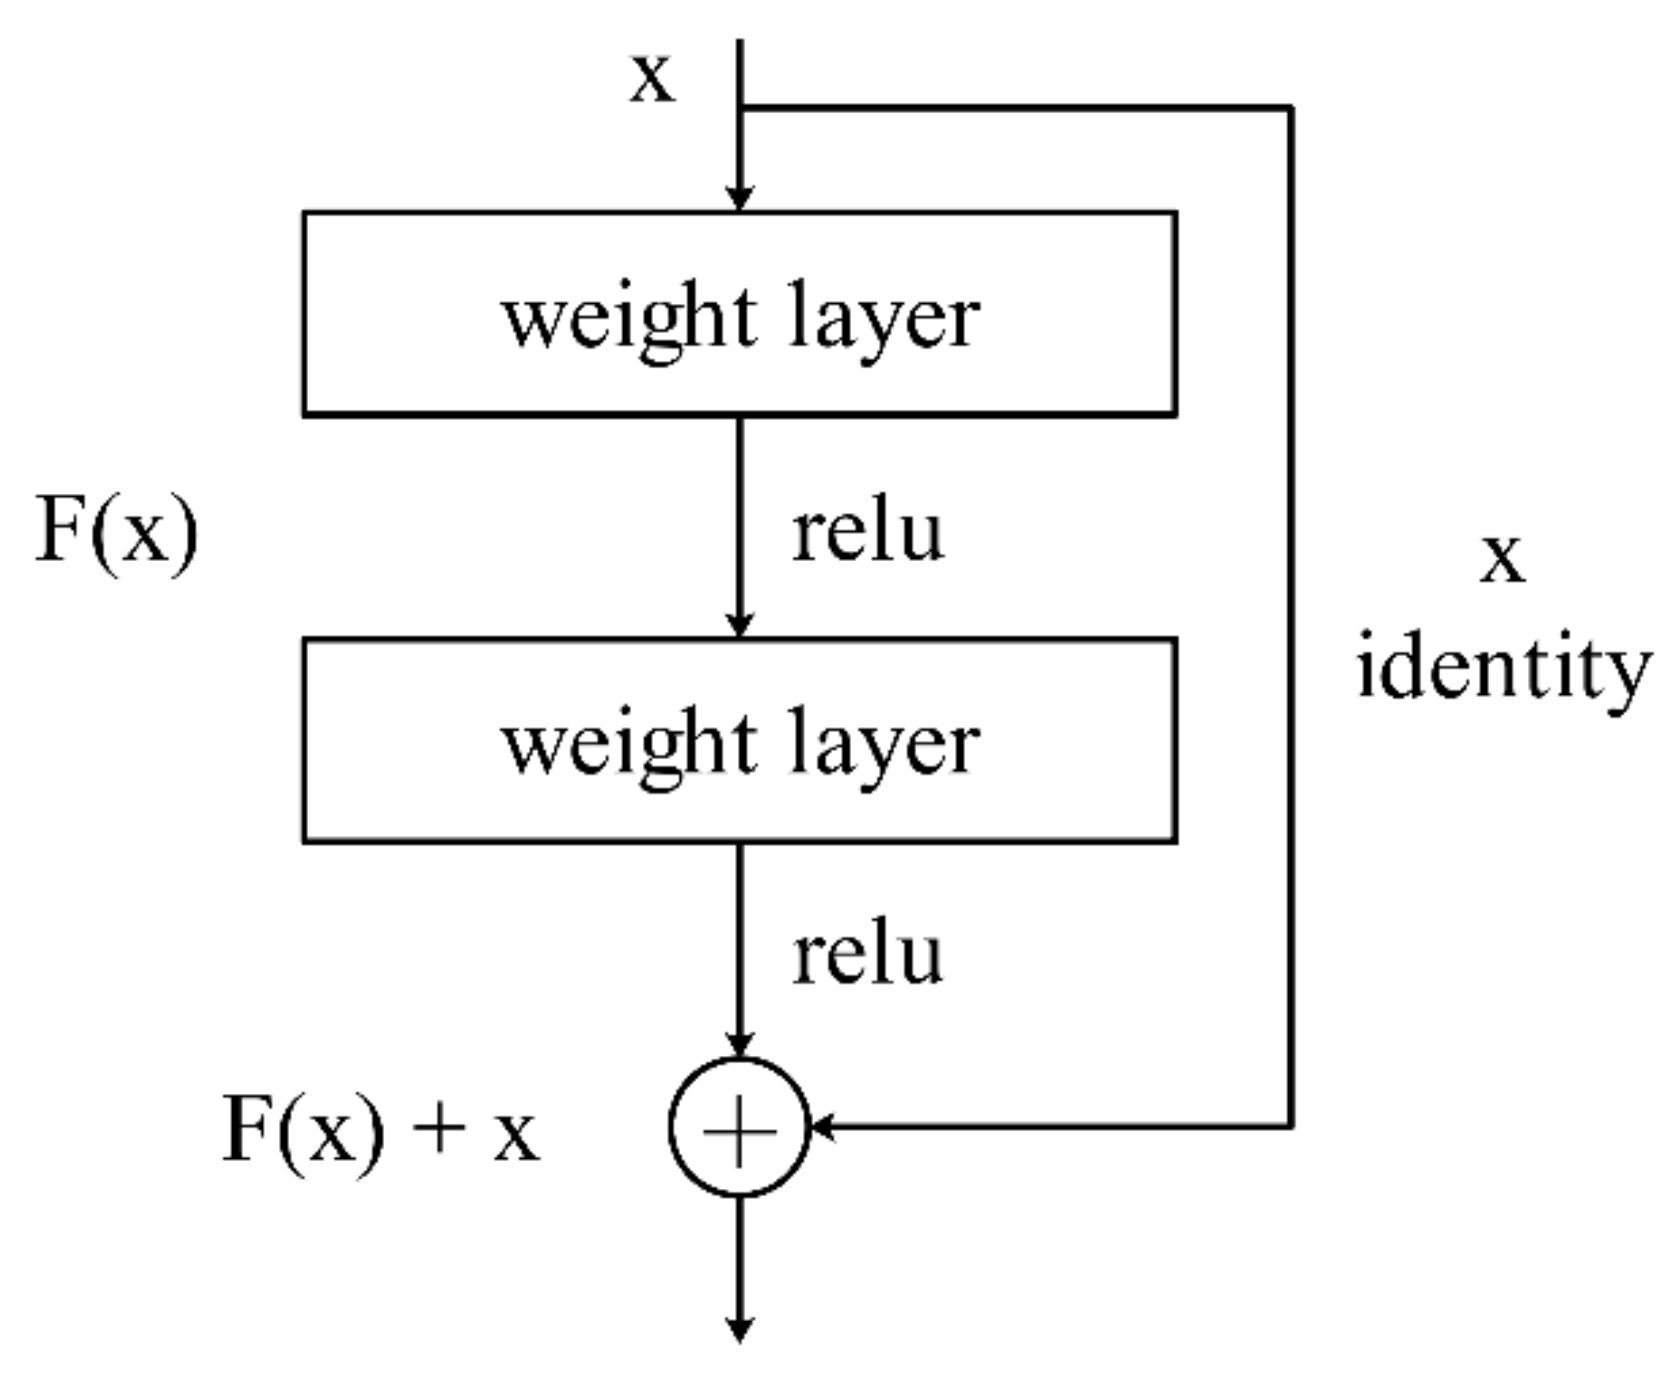
30]. In theory, the deeper the layers of the network, the more complex the feature the network can extract. So, the deeper network should perform better than the shallow network. However, in practice, deeper networks did not achieve better results. For a model with many layers, the training accuracy of the model layers decreases with the depth, so deeper layers may perform worse than shallow ones. Besides, the deeper layers have gradient disappearance and gradient explosion problems. ResNet solves such problems by introducing a residual network (
Figure 1). The residual network replaces the learning target
with the difference between
and input
, expressed as
. Therefore, the later training goal is to make residual
converge to 0.
When the input
is convolved, if the dimensionality does not change, the output
and
have the same dimensionality. The output of the residual block is the sum of
and
.
If the dimensionality changes, the output
has a different dimension from
. It is necessary to adjust the dimensionality of
by convolving it with
and then adding it to
.
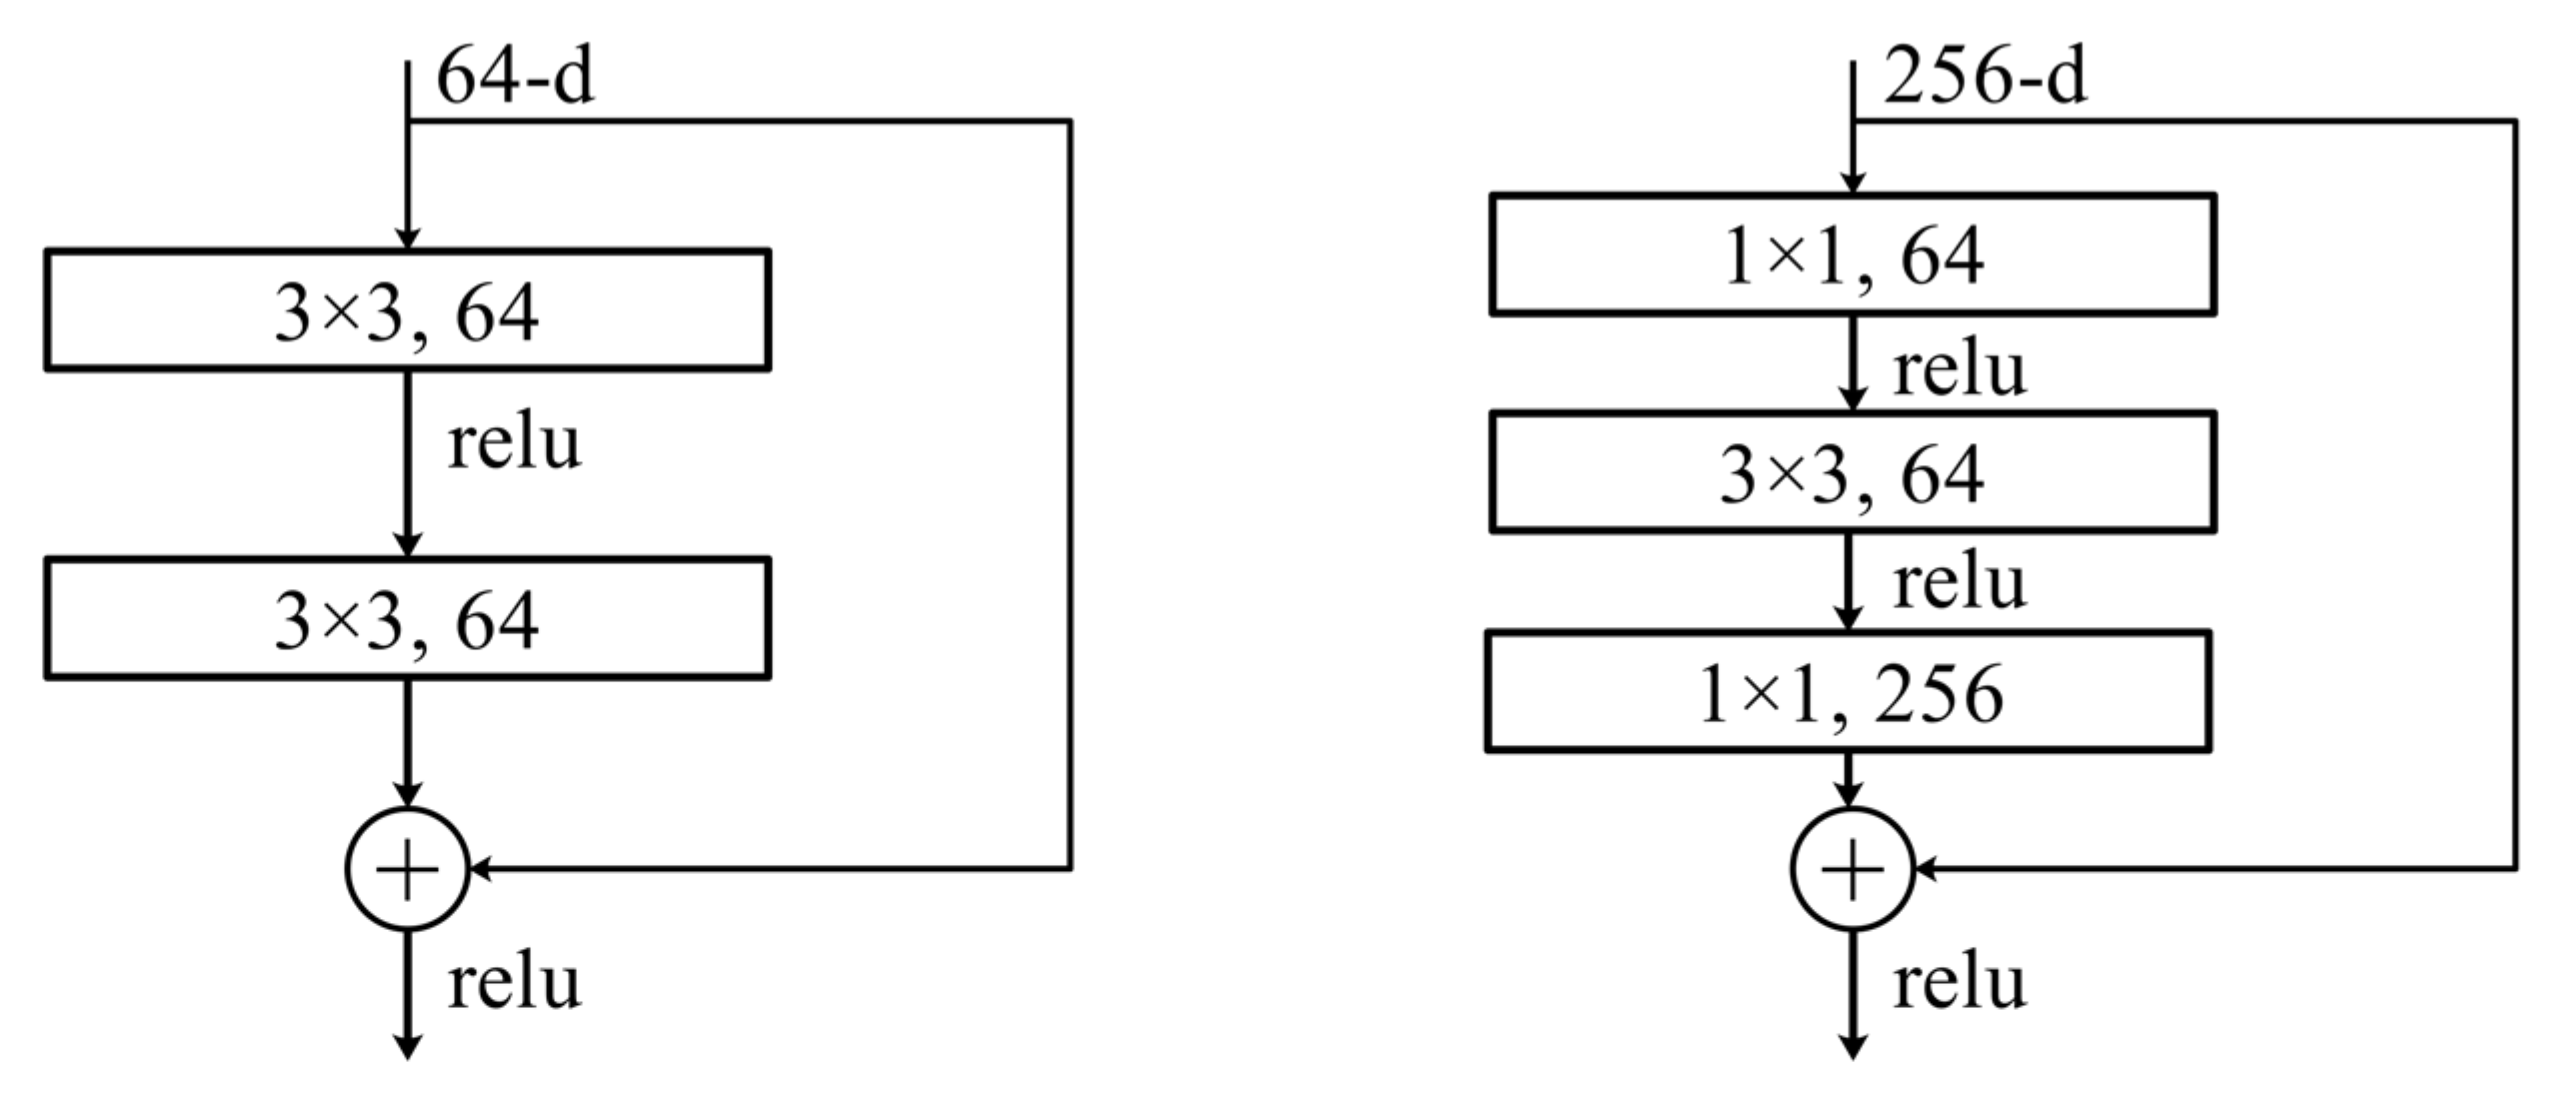
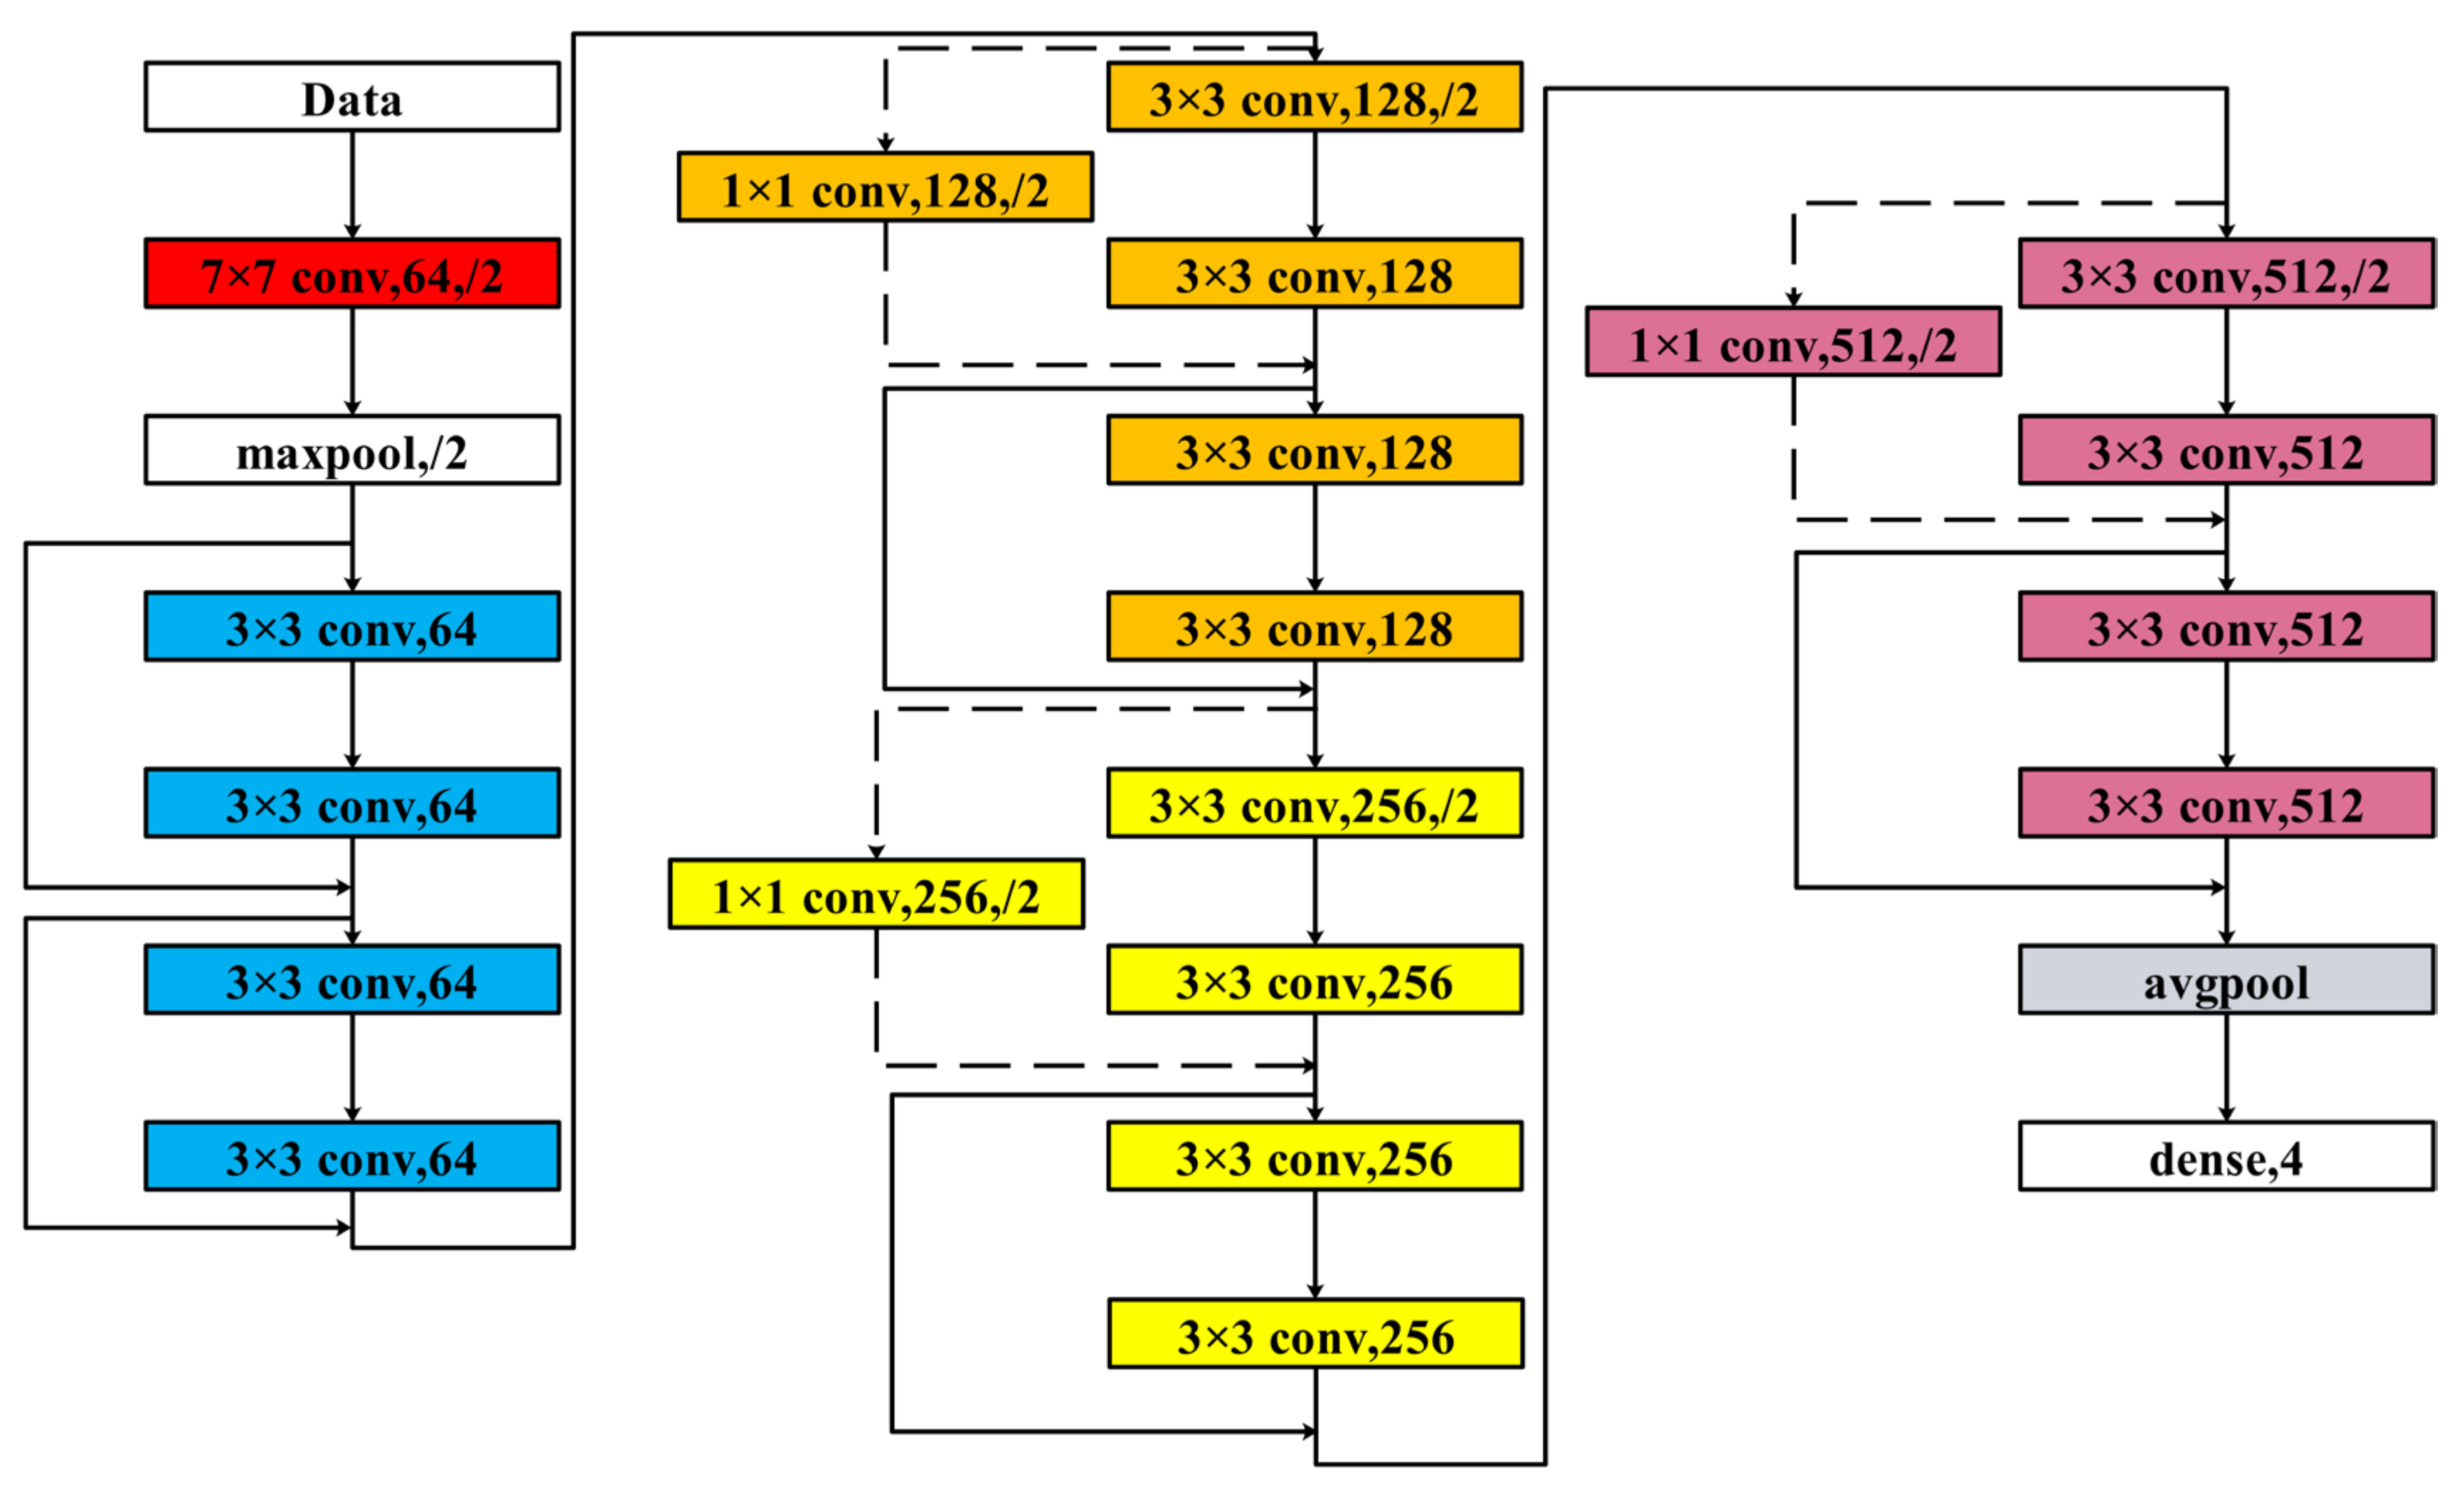
ResNet consists of 5 convolutional layers and 1 integrated module. All convolutional layers consist of different numbers of stacked residual modules, and the integrated module consists of fully connected layers, pooling layers and classification modules. Each residual module has some hidden layers. Therefore, ResNet has different numbers of layers, such as 18, 34, 50, 101 and 152 layers. The ResNet with different layers has different number of residual blocks and different parameters in the residual blocks for each convolutional layer.
As
Figure 2 shows, ResNet has two residual structures. The residual structure on the left is for networks with fewer layers, such as ResNet-18 and ResNet-34, and the one on the right can effectively reduce the network parameters and operations for networks with more layers, such as ResNet-101 and ResNet-152.
ResNet resolves the degeneracy problem of the network, making the network better trained and easier to optimize. It deepens the network and achieves a better classification effect and better application in the field of computer vision.
2.4. The Proposed Model
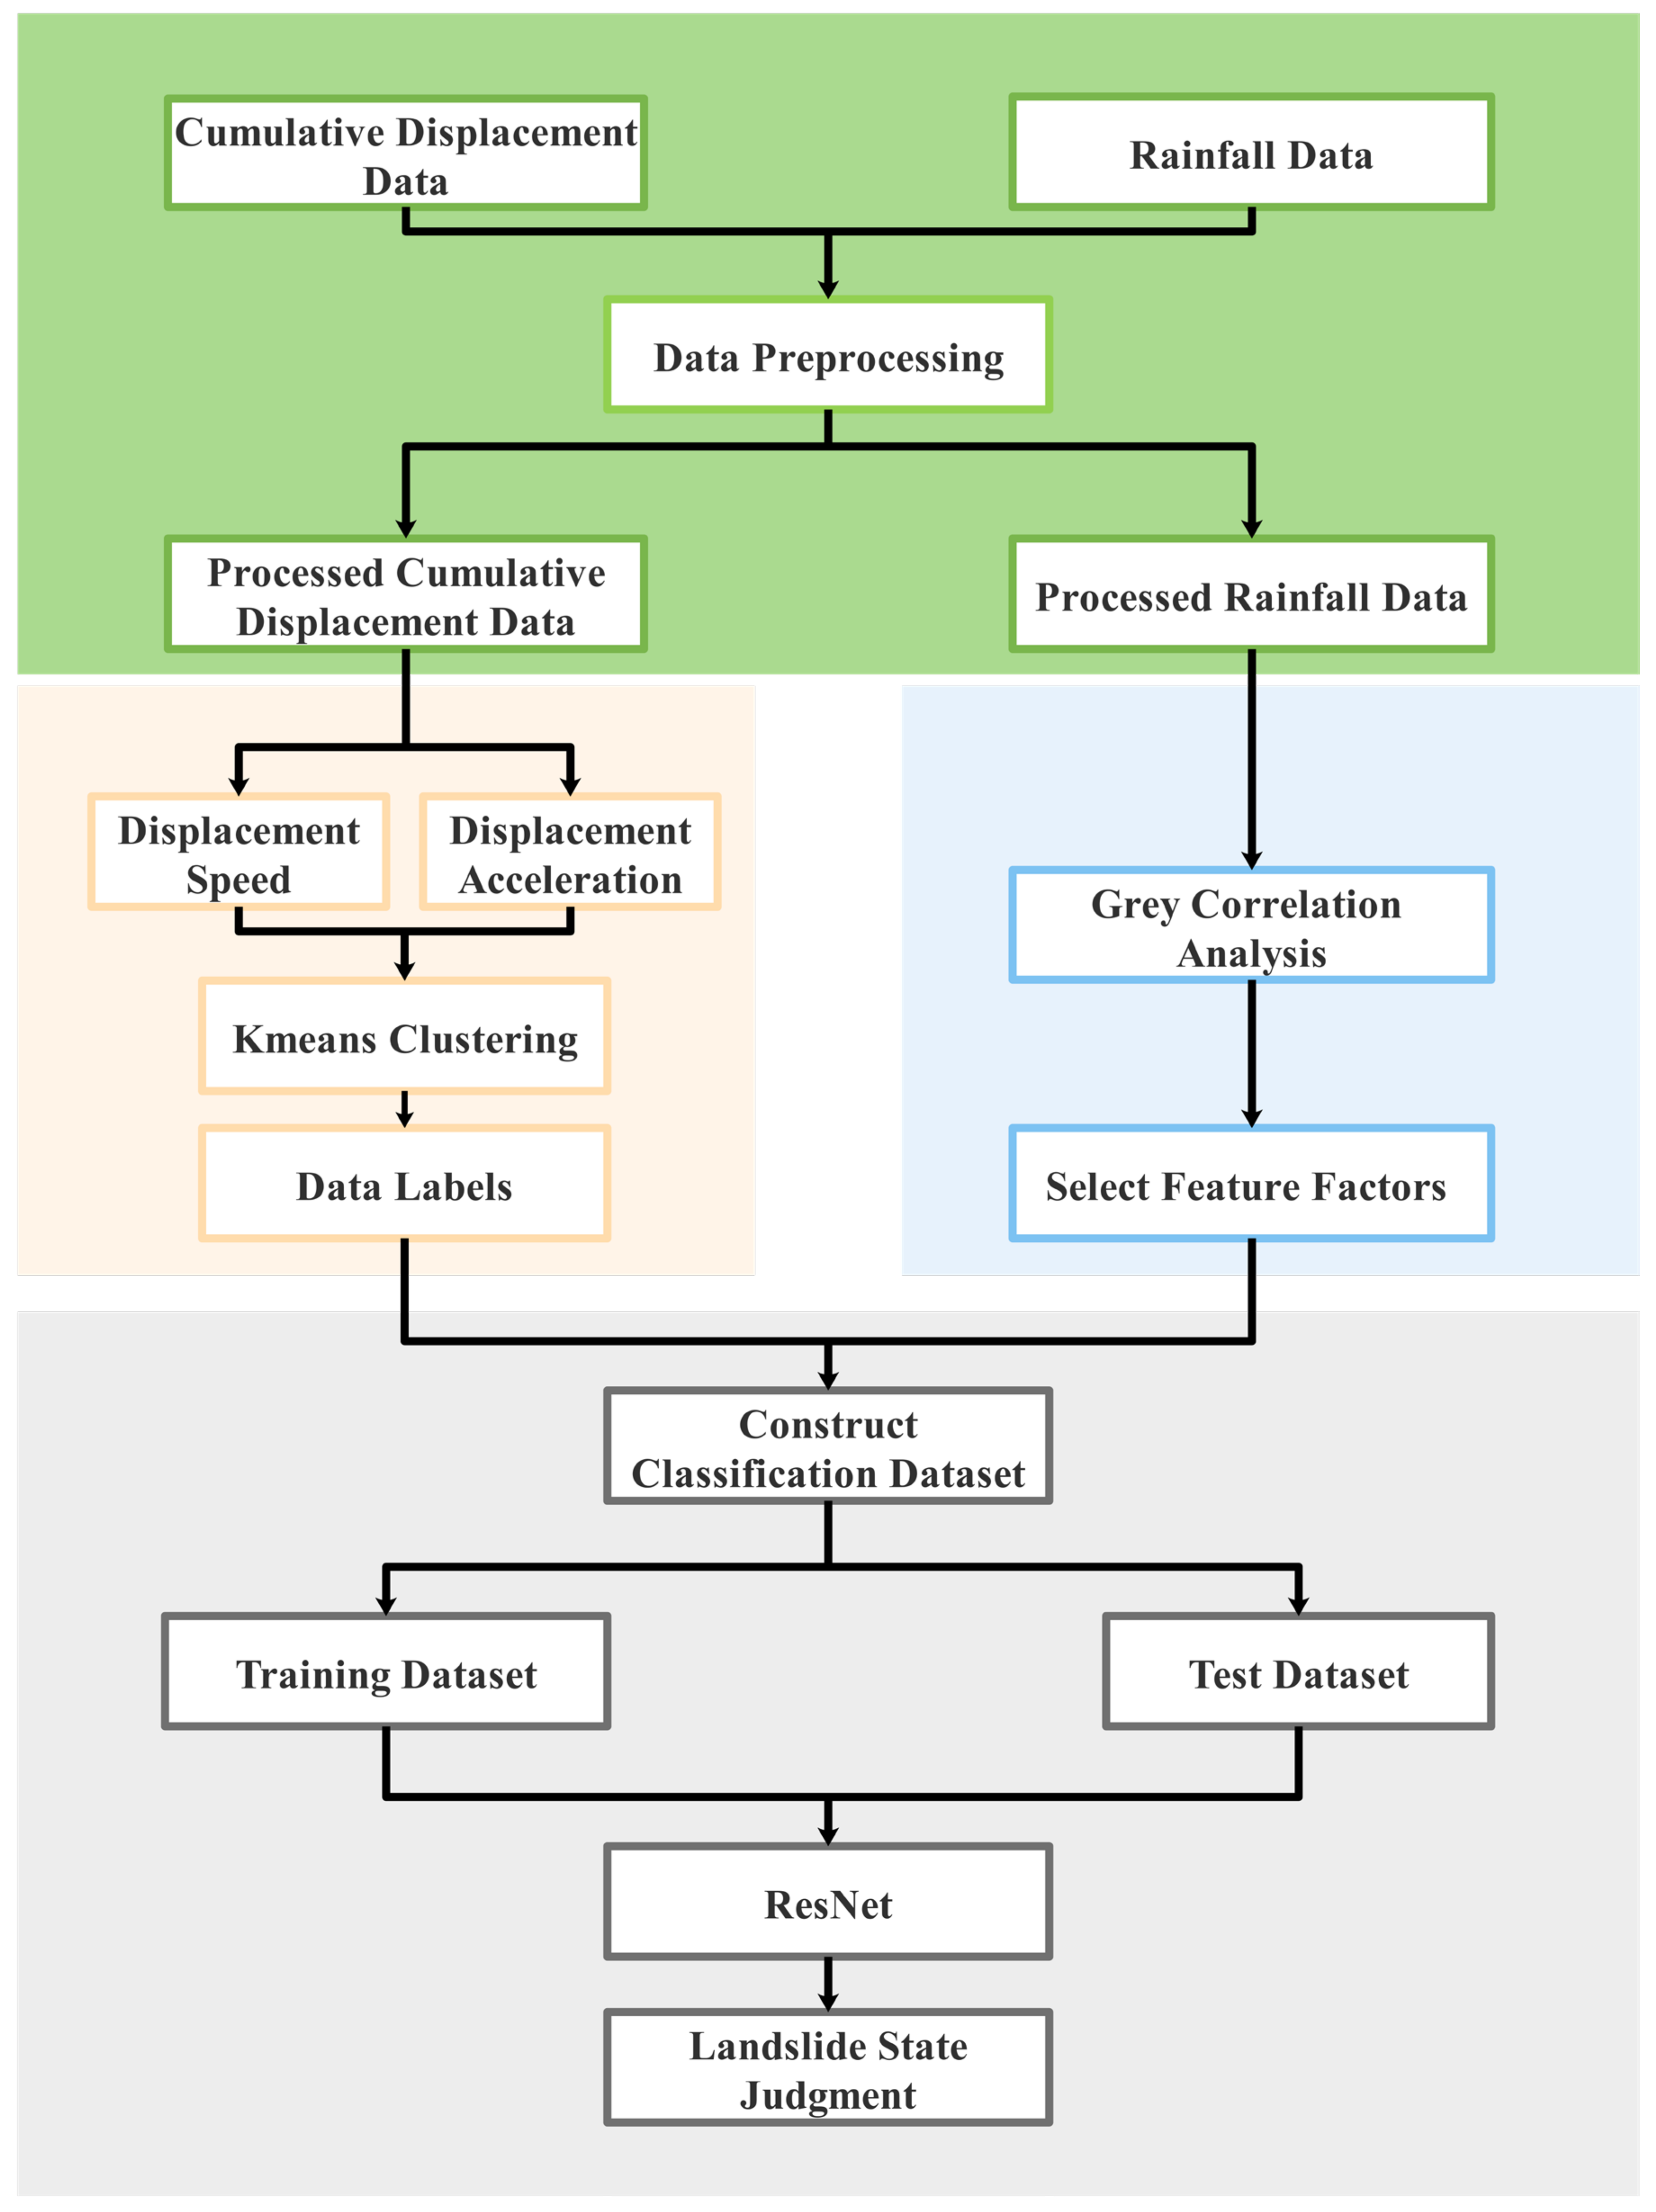
In order to improve the accuracy of landslide warning and reduce the false and missing alarms caused by the wrong thresholds, we propose a landslide warning model based on the K-means-ResNet algorithm.
The proposed model has four parts: constructing landslide displacement subsequence, extracting features and K-means clustering, obtaining input features by gray correlation analysis [
31] and ResNet classification (
Figure 3).
- (1)
Construct landslide displacement subseries
Landslide displacement is a non-smooth time series that varies with time. The displacement time series data are used to generate more equal-length time series for data analysis by the sliding window.
- (2)
Extract features and perform K-means clustering
Traditional clustering methods cannot be applied to time series data directly, so we extract features of the time series subsequences for analysis.
Deformation velocity can directly reflect the landslide status. The extracted velocity has a different order of magnitude, so it is normalized, that is, mapped to an interval of , to ensure the accuracy and validity of the clustering results. The K-means algorithm is used to cluster the velocity and acceleration. Based on the clustering results, a dataset with labels is constructed to identify the categories prone to landslides, and take them as the basis for landslide warning.
- (3)
Obtain input features by grey correlation analysis
The deformation of landslide is caused by a combination of factors. Therefore, a dataset consisting of landslide triggering factors and monitored displacement is constructed to select the deformation characteristics factors by gray correlation analysis.
- (4)
ResNet classification
The classification dataset is constructed based on the feature factors using clustering results as labels, and it is divided into a training set and a test set. The ResNet classification model is applied to the datasets, and the results are compared with those of the MLP model, the LeNet model and the traditional threshold warning method.
2.5. Evaluation Indicators
The effectiveness of the K-means-ResNet model is assessed by accuracy, precision and recall. In the multi-category problem, each category is considered as “positive” and the rest are considered as “negative”.
Accuracy: The ratio of the correctly classified samples to the total samples. It is the most commonly used metric in classification.
where
TP denotes the number of the correctly classified positive samples,
TN is the number of the correctly classified negative samples,
FP is the number of the negative samples that are misclassified as positive and
FN is the number of the positive samples that are misclassified as negative.
Precision: The ratio of the correctly classified positive samples to all positive samples.
Recall: The ratio of the correctly classified positive samples to all positive samples.
3. Case Study: Zhongma Landslide
3.1. Landslide Overview
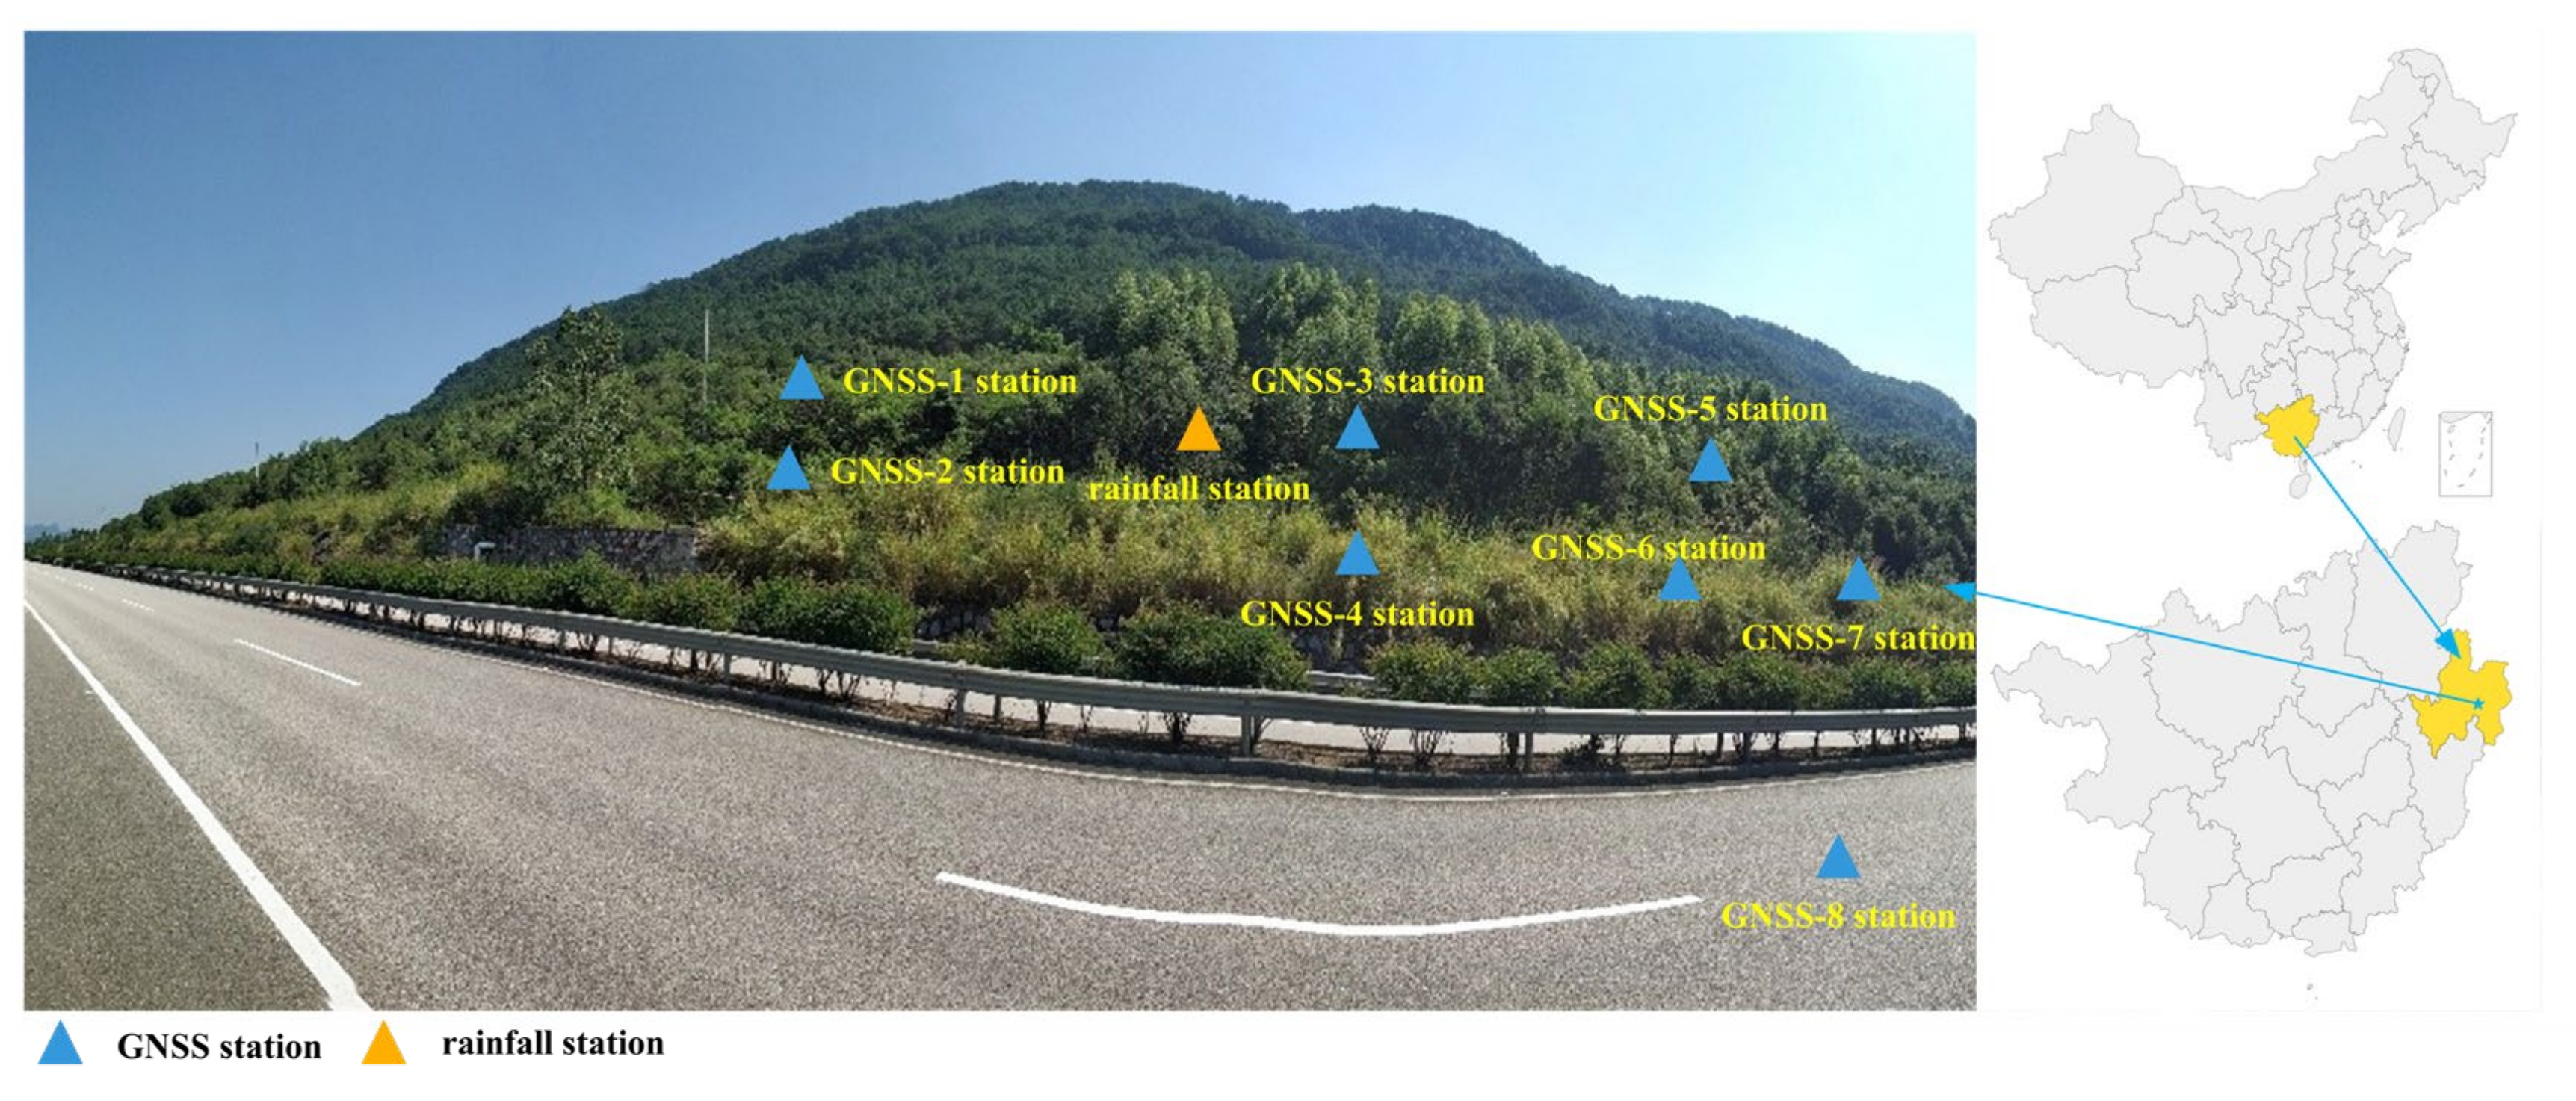
The Zhongma landslide locates in Pingtian Village, Guangxi Province, China (
Figure 4). The volume of the whole landslide is about 212 m (vertical length) × 111 m (horizontal length) × 24.5 m (thickness), which is large. The main sliding direction of the landslide is 270°. The slope failed after the rainy season in 2007. In 2013, the landslide was reactivated by the continuous heavy rainfall brought by two typhoons, “Yut” and “Tammy”. A 300 m long section showed more obvious deformation displacement. On-site investigation reported that the landslide body is mainly muddy siltstone, gravel and clay containing gravel.
The upper layer of the landslide is the Quaternary overburden, and the lower layer is bedrock. The upper soil layer of the landslide is affected by rainfall infiltration. On the one hand, the soil capacity increases and the sliding force increases. On the other hand, the soil shear strength and other parameters decrease; in particular, the friction at the soil–rock interface decreases sharply, leading to a decrease in the landslide resistance. The combined effect of the two factors causes the landslide to start deformation acceleration. It can be found that rainfall is the main triggering factor of the landslide, so we must consider the rainfall factor when conducting early warning, which fully considers the landslide deformation mechanism and can improve the accuracy of early warning.
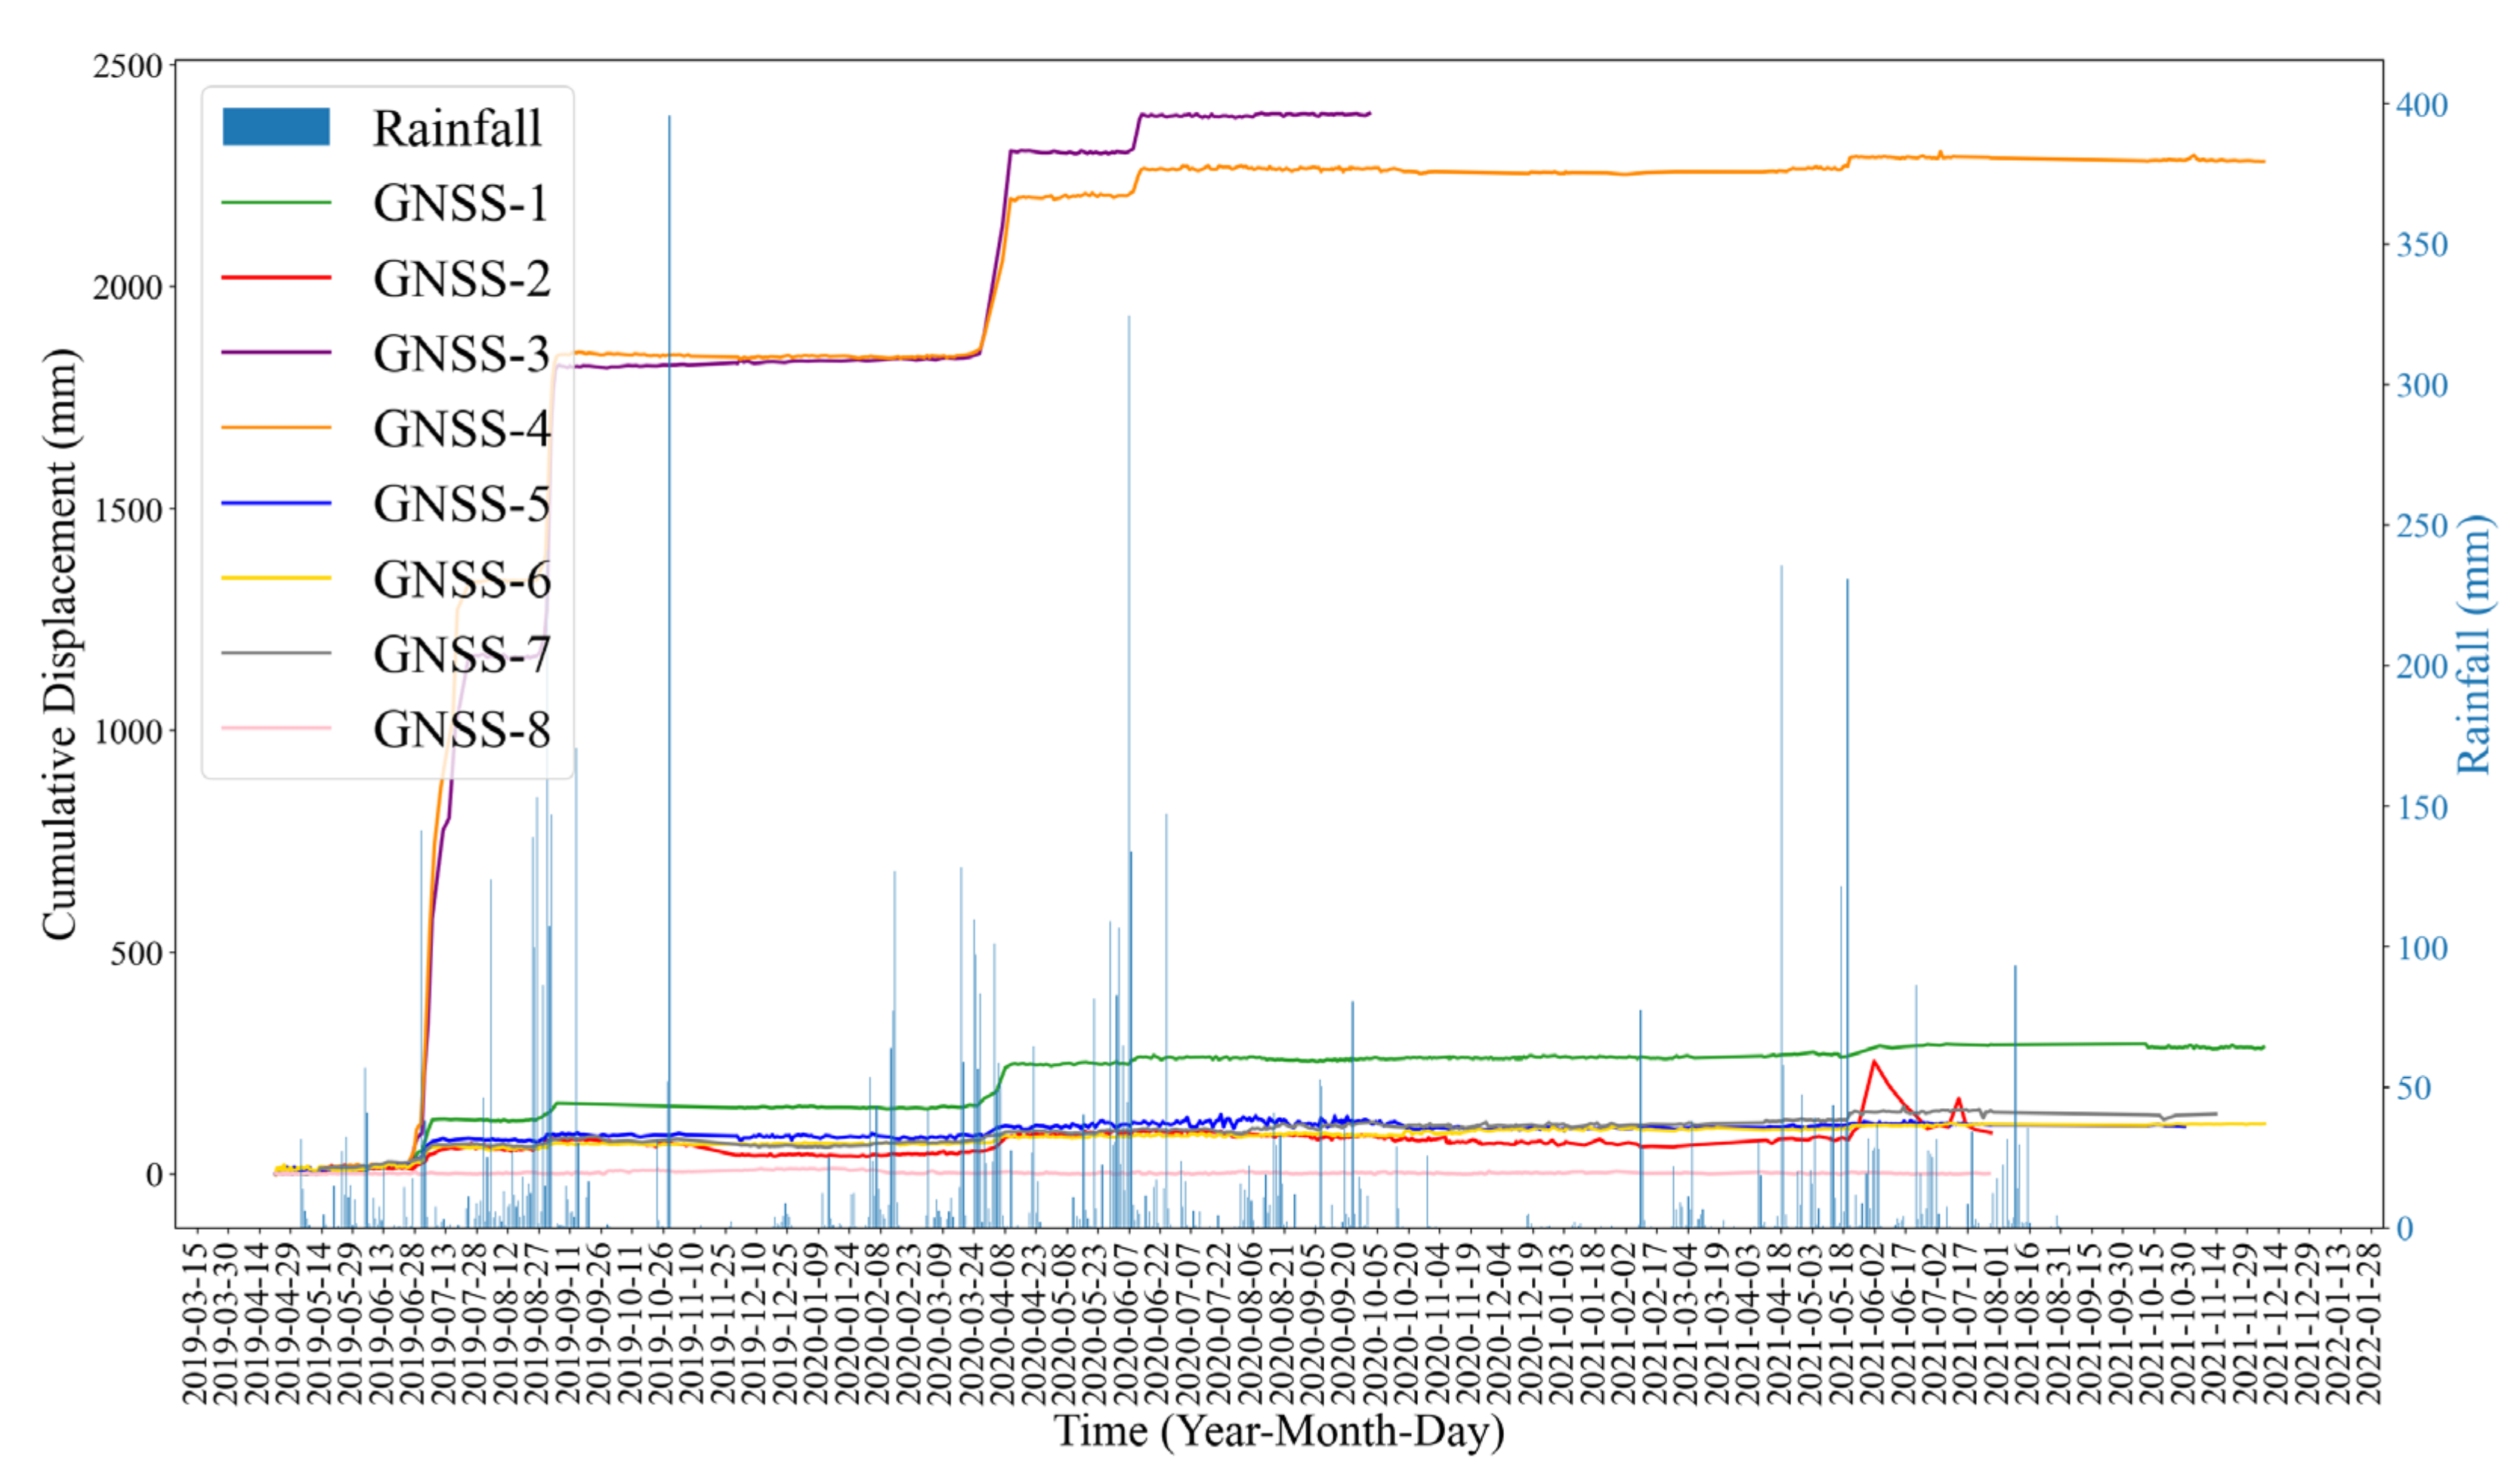
3.2. Landslide Monitoring Data
Eight GNSS stations and one rainfall station (
Figure 4) were deployed on the landslide. The GNSS stations were installed on the main deformation area of the landslide. The GNSS data were collected every hour, and the rainfall data were collected every 24 h.
As
Figure 5 shows, the deformation of the Zhongma landslide has obvious acceleration steps, temporally coincident with the periods of continuous rainfall or after a large rainfall. So, the landslide deformation is closely related to the amount of rainfall.
3.3. K-Means Clustering
The GNSS-4 with more obvious deformation and less noisy data and the rainfall station was selected for the study. From 23 April 2019 to 7 December 2021, 13,670 monitoring data were collected, including 12,724 GNSS-4 data and 946 daily rainfall data.
Notably, in real landslide displacement monitoring, missing values may be caused by various factors, so they may appear at any time. Before being used for training and classification, the displacement data are processed by methods such as one-time sample difference to obtain an isochronous order. We used the slide window with the size of 48 and step size of 2 to construct the landslide displacement subseries, so each subseries has a time span of 2 days and a data length of 48 items. Finally, 23,050 data items were generated.
The velocity feature was extracted from each subseries using least squares fitting. The max–min normalization was applied to the two features, see Equation (10).
K-means clustering was performed and the K values were determined by the elbow method. In
Figure 6, the K value is 4.
We select K = 4 for K-means clustering. The clustering centroids are shown in
Table 1, and the clustering results are shown in
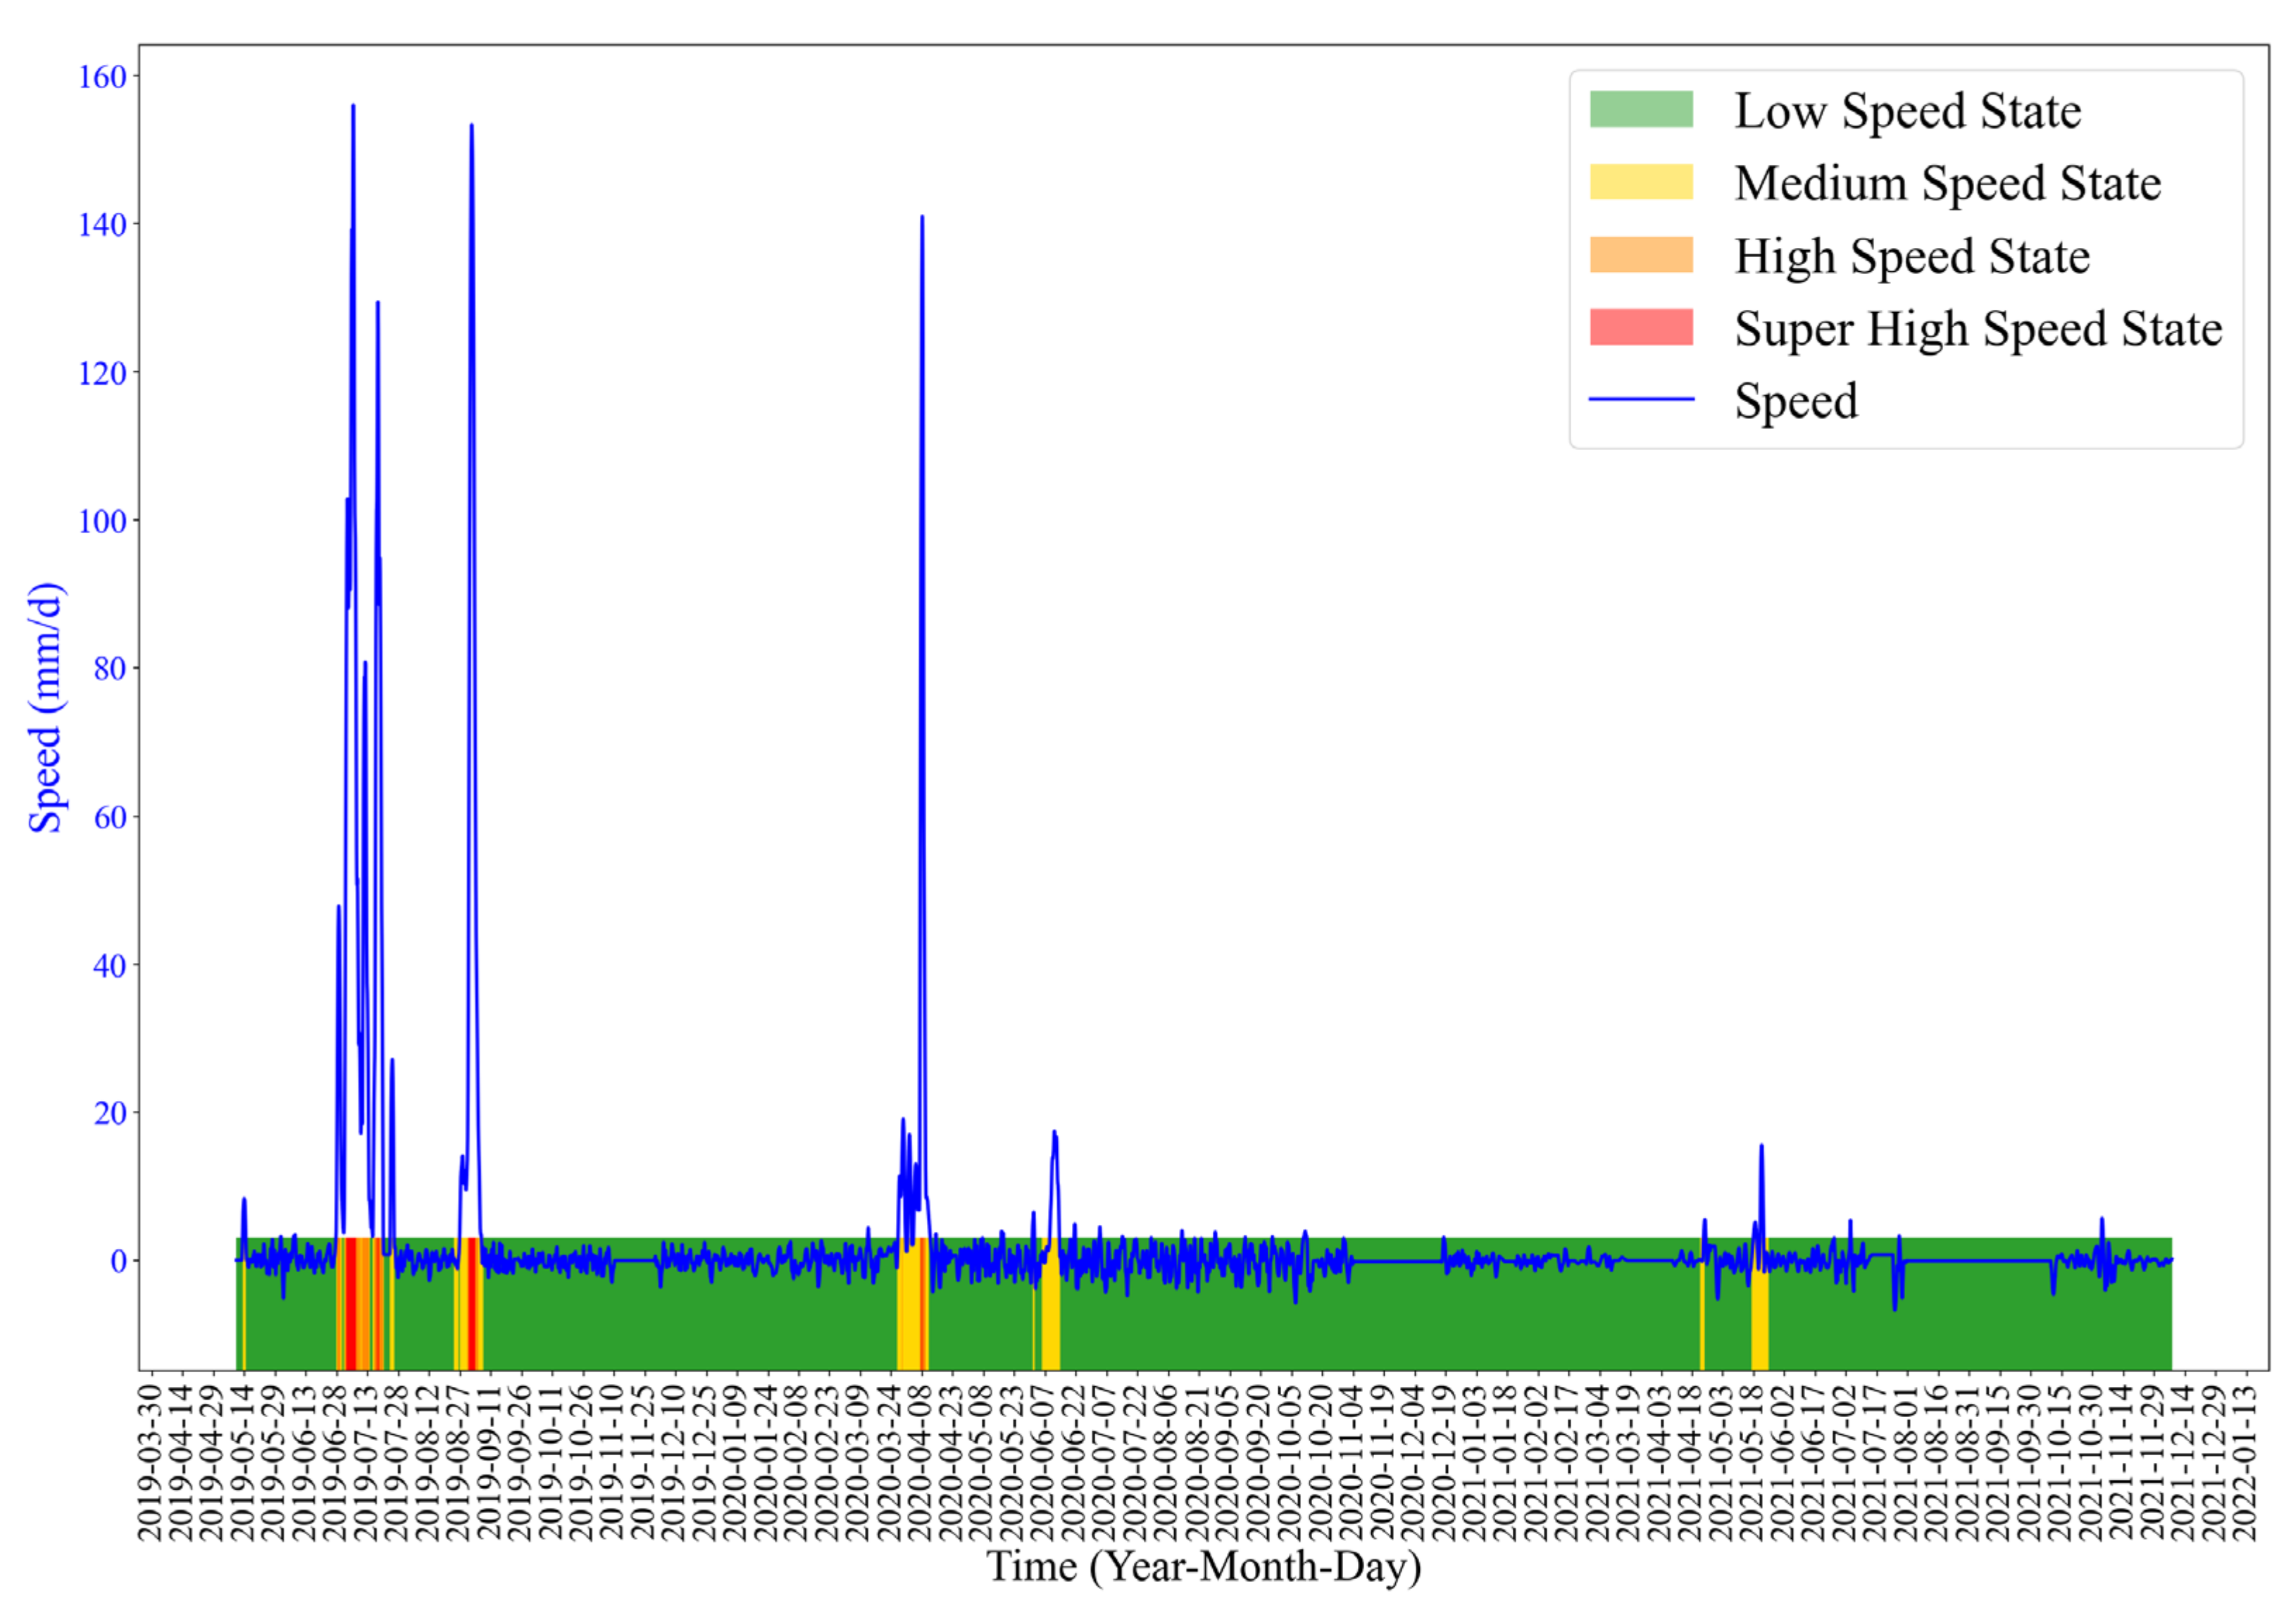
Figure 7. We divide the warning into three levels. Level 1: The medium speed state. At this level, the deformation speeds up. The landslide has the possibility of occurrence. Level 2: The high speed state. In this state, the deformation velocity is high. The landslide is in a more dangerous state. Level 3: The super high speed state, in which the displacement velocity is large. In this state, the landslide is likely to fail.
3.4. Feature Factors Selection for Landslide Data
The effectiveness of a deep learning model is closely related to the input features. Therefore, it is necessary to select the features which have impacts on landslide deformation.
Landslide deformation is usually related to rainfall, so rainfall intensity and duration are often used for predicting landslides [
5]. Therefore, we consider the rainfall data in the model. The cumulative rainfall of the first 1–7 days
and the maximum continuous effective rainfall of the 7 days
(the effective rainfall factors are 1.0, 0.8, 0.6, 0.4, respectively) are selected as the influencing factors for landslide displacement. Among them, the maximum continuous rainfall is calculated as follows.
where
is the maximum continuous rainfall,
is the amount of rainfall before the
-th day,
,
is the effective rainfall coefficient and
n is the maximum continuous rainy days.
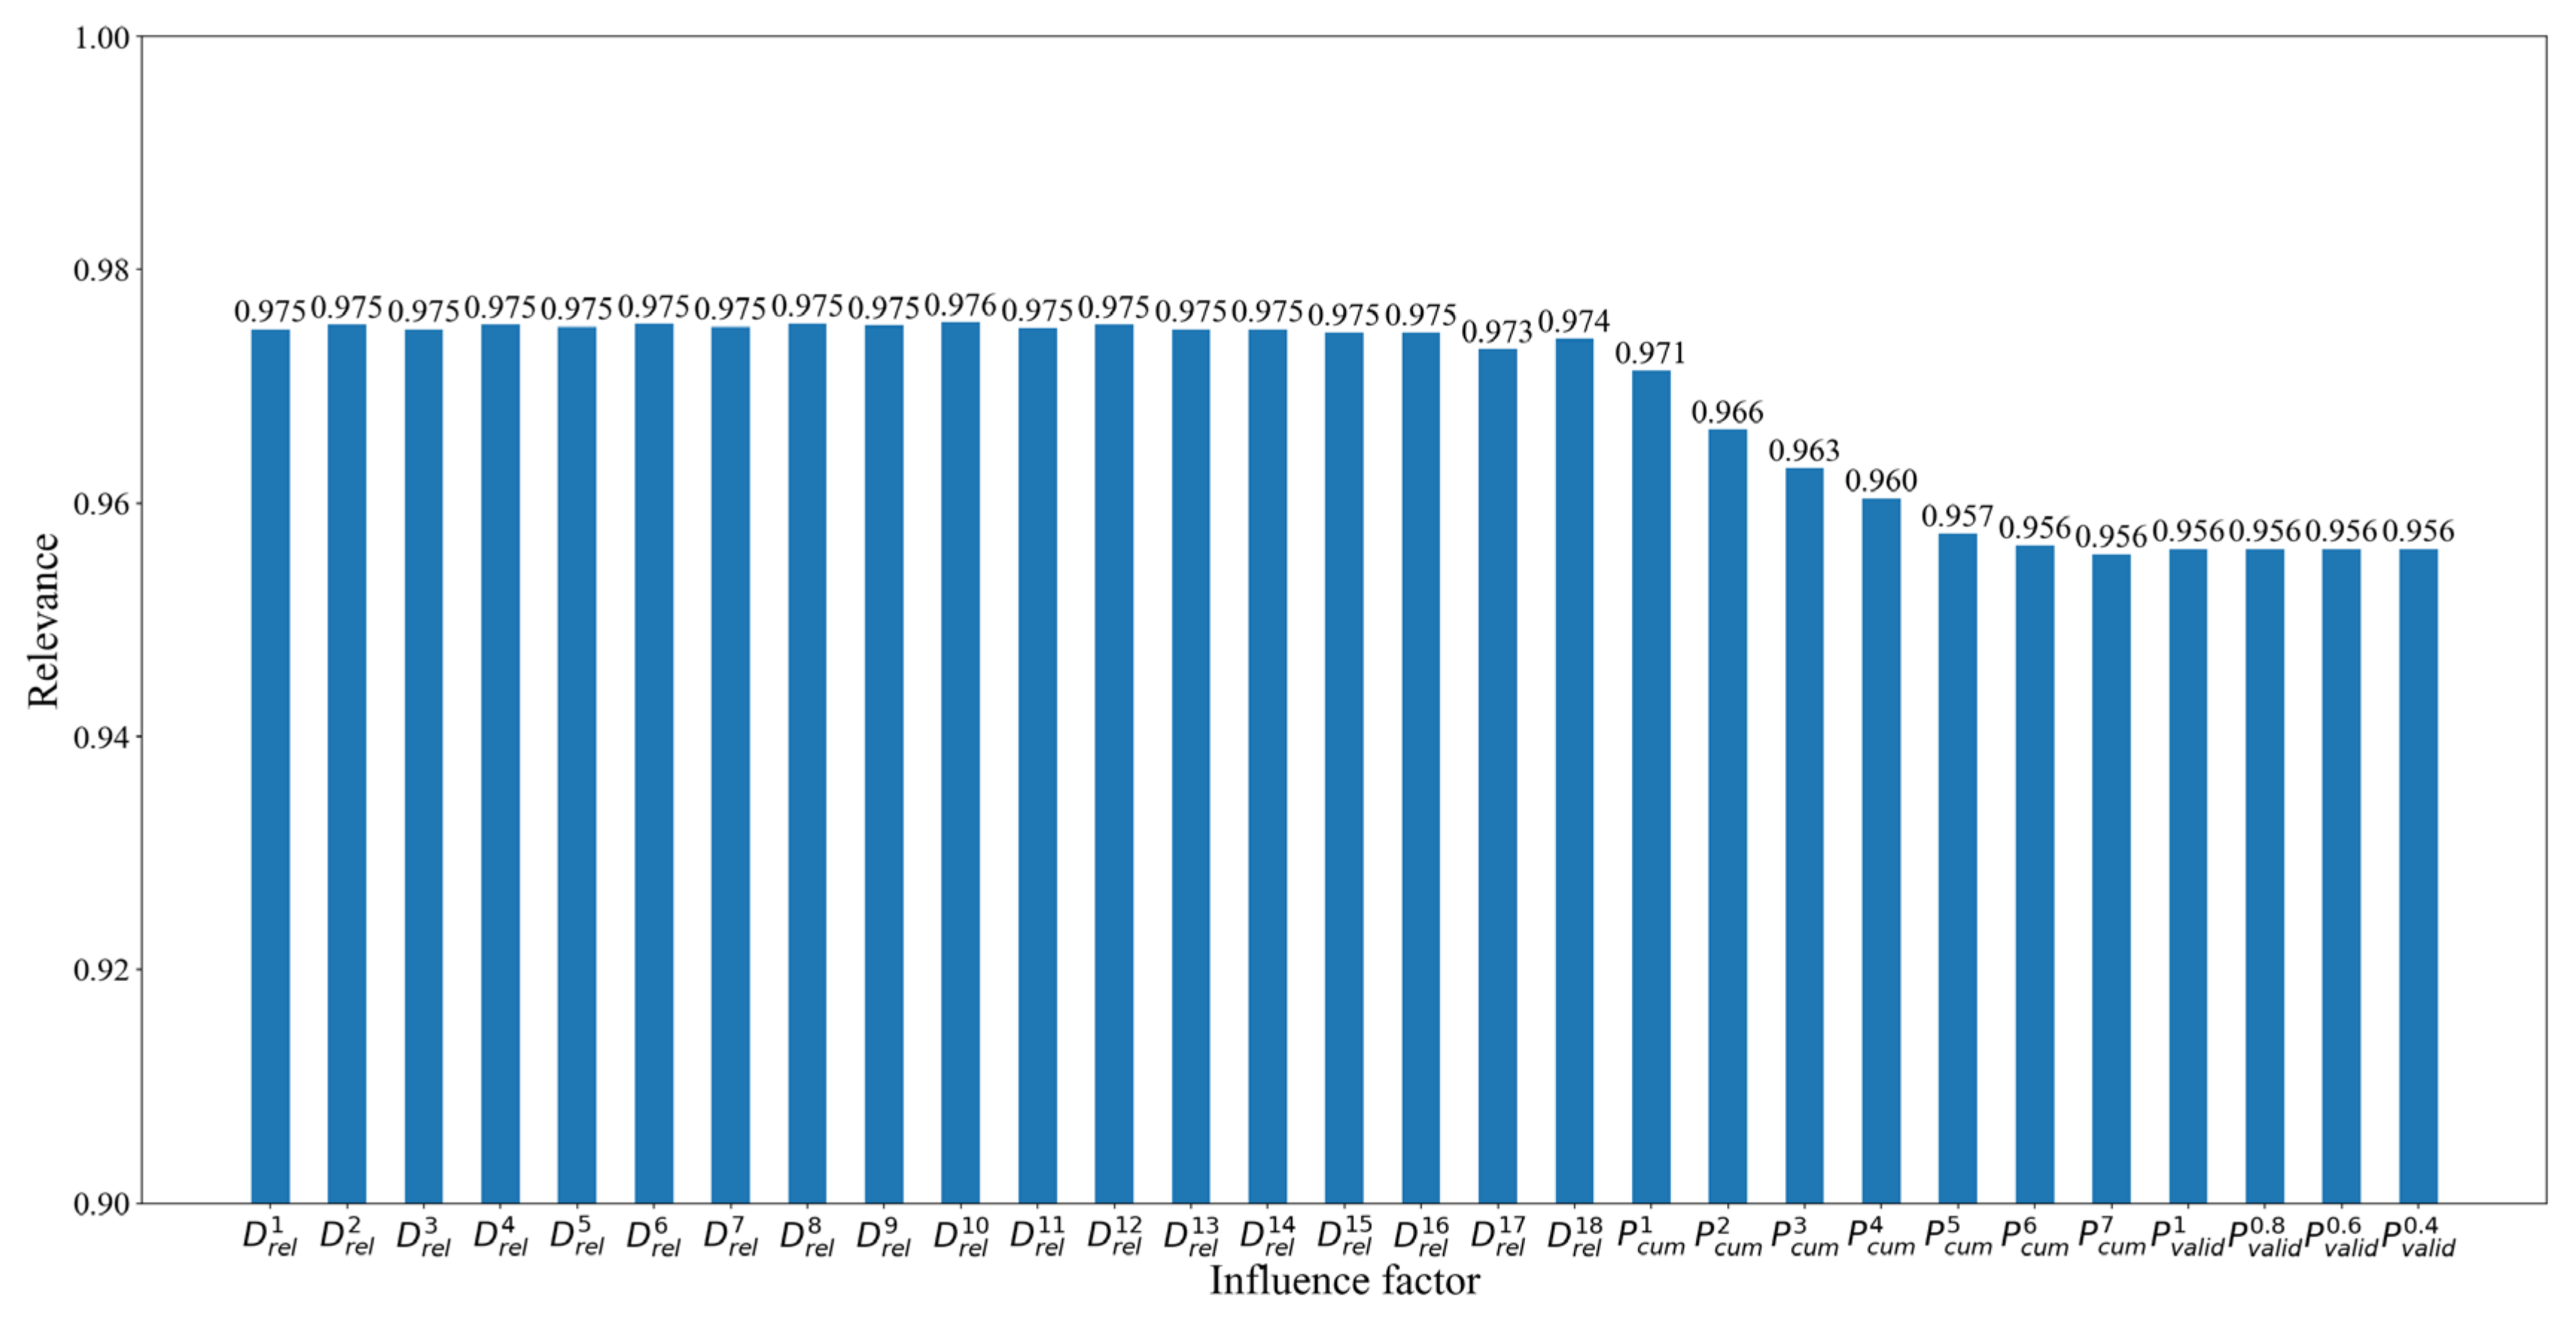
The landslide displacement change affects the landslide deformation state. So, the first 18 relative changes in the landslide displacement subseries were selected as supplements to the rainfall factor.
The correlation between these factors and landslide deformation was calculated by gray correlation analysis, using the discrimination coefficient of 0.5, and the mean normalization method. Factors with the gray correlation greater than 0.6 can be used as input features for the model. In
Figure 8, all factors have a gray correlation greater than 0.9, so they can be used as input features of the classification model. A total of 29 parameters were selected to construct a dataset for classification.
3.5. Model Training
The constructed dataset was divided into training and testing sets by the ratio of 7:3. The ResNet model was constructed for classification training. The model architecture is shown in
Figure 9.
The random search algorithm is applied to find the best optimal hyperparameters of the model. The iteration is 20 times. The result is validated by a fivefold cross-validation technique. The number of residual blocks ranges between 1 and 6. The initial learning rate is set to be one of 0.1, 0.01, 0.001 or 0.0001. The batch size selection parameters range from 16 to 128 with a step size of 2, and the optimization function selection parameters are SGD, Adagrad, RMSprop and Adam.
By the random search algorithm, we obtained the optimal hyperparameters of the model: four residual blocks, Adam optimizer, loss function of the categorical cross-entropy, batch size of 32, the initial iteration number of 1500 and the initial learning rate of 0.01. To speed up the training, a learning rate dynamic decay strategy was employed to accelerate convergence and the EarlyStopping method was used to stop the iteration before overfitting and terminate training (i.e., stop training when the accuracy is not increasing within 100 iterations).
The computer configuration for this work was Intel(R) Core (TM) i5-9400F CPU @ 2.90 GHz CPU processor, OS Windows 10 Professional, 16 GB RAM and NVIDIA GeForce GTX 1660 SUPER graphics card.
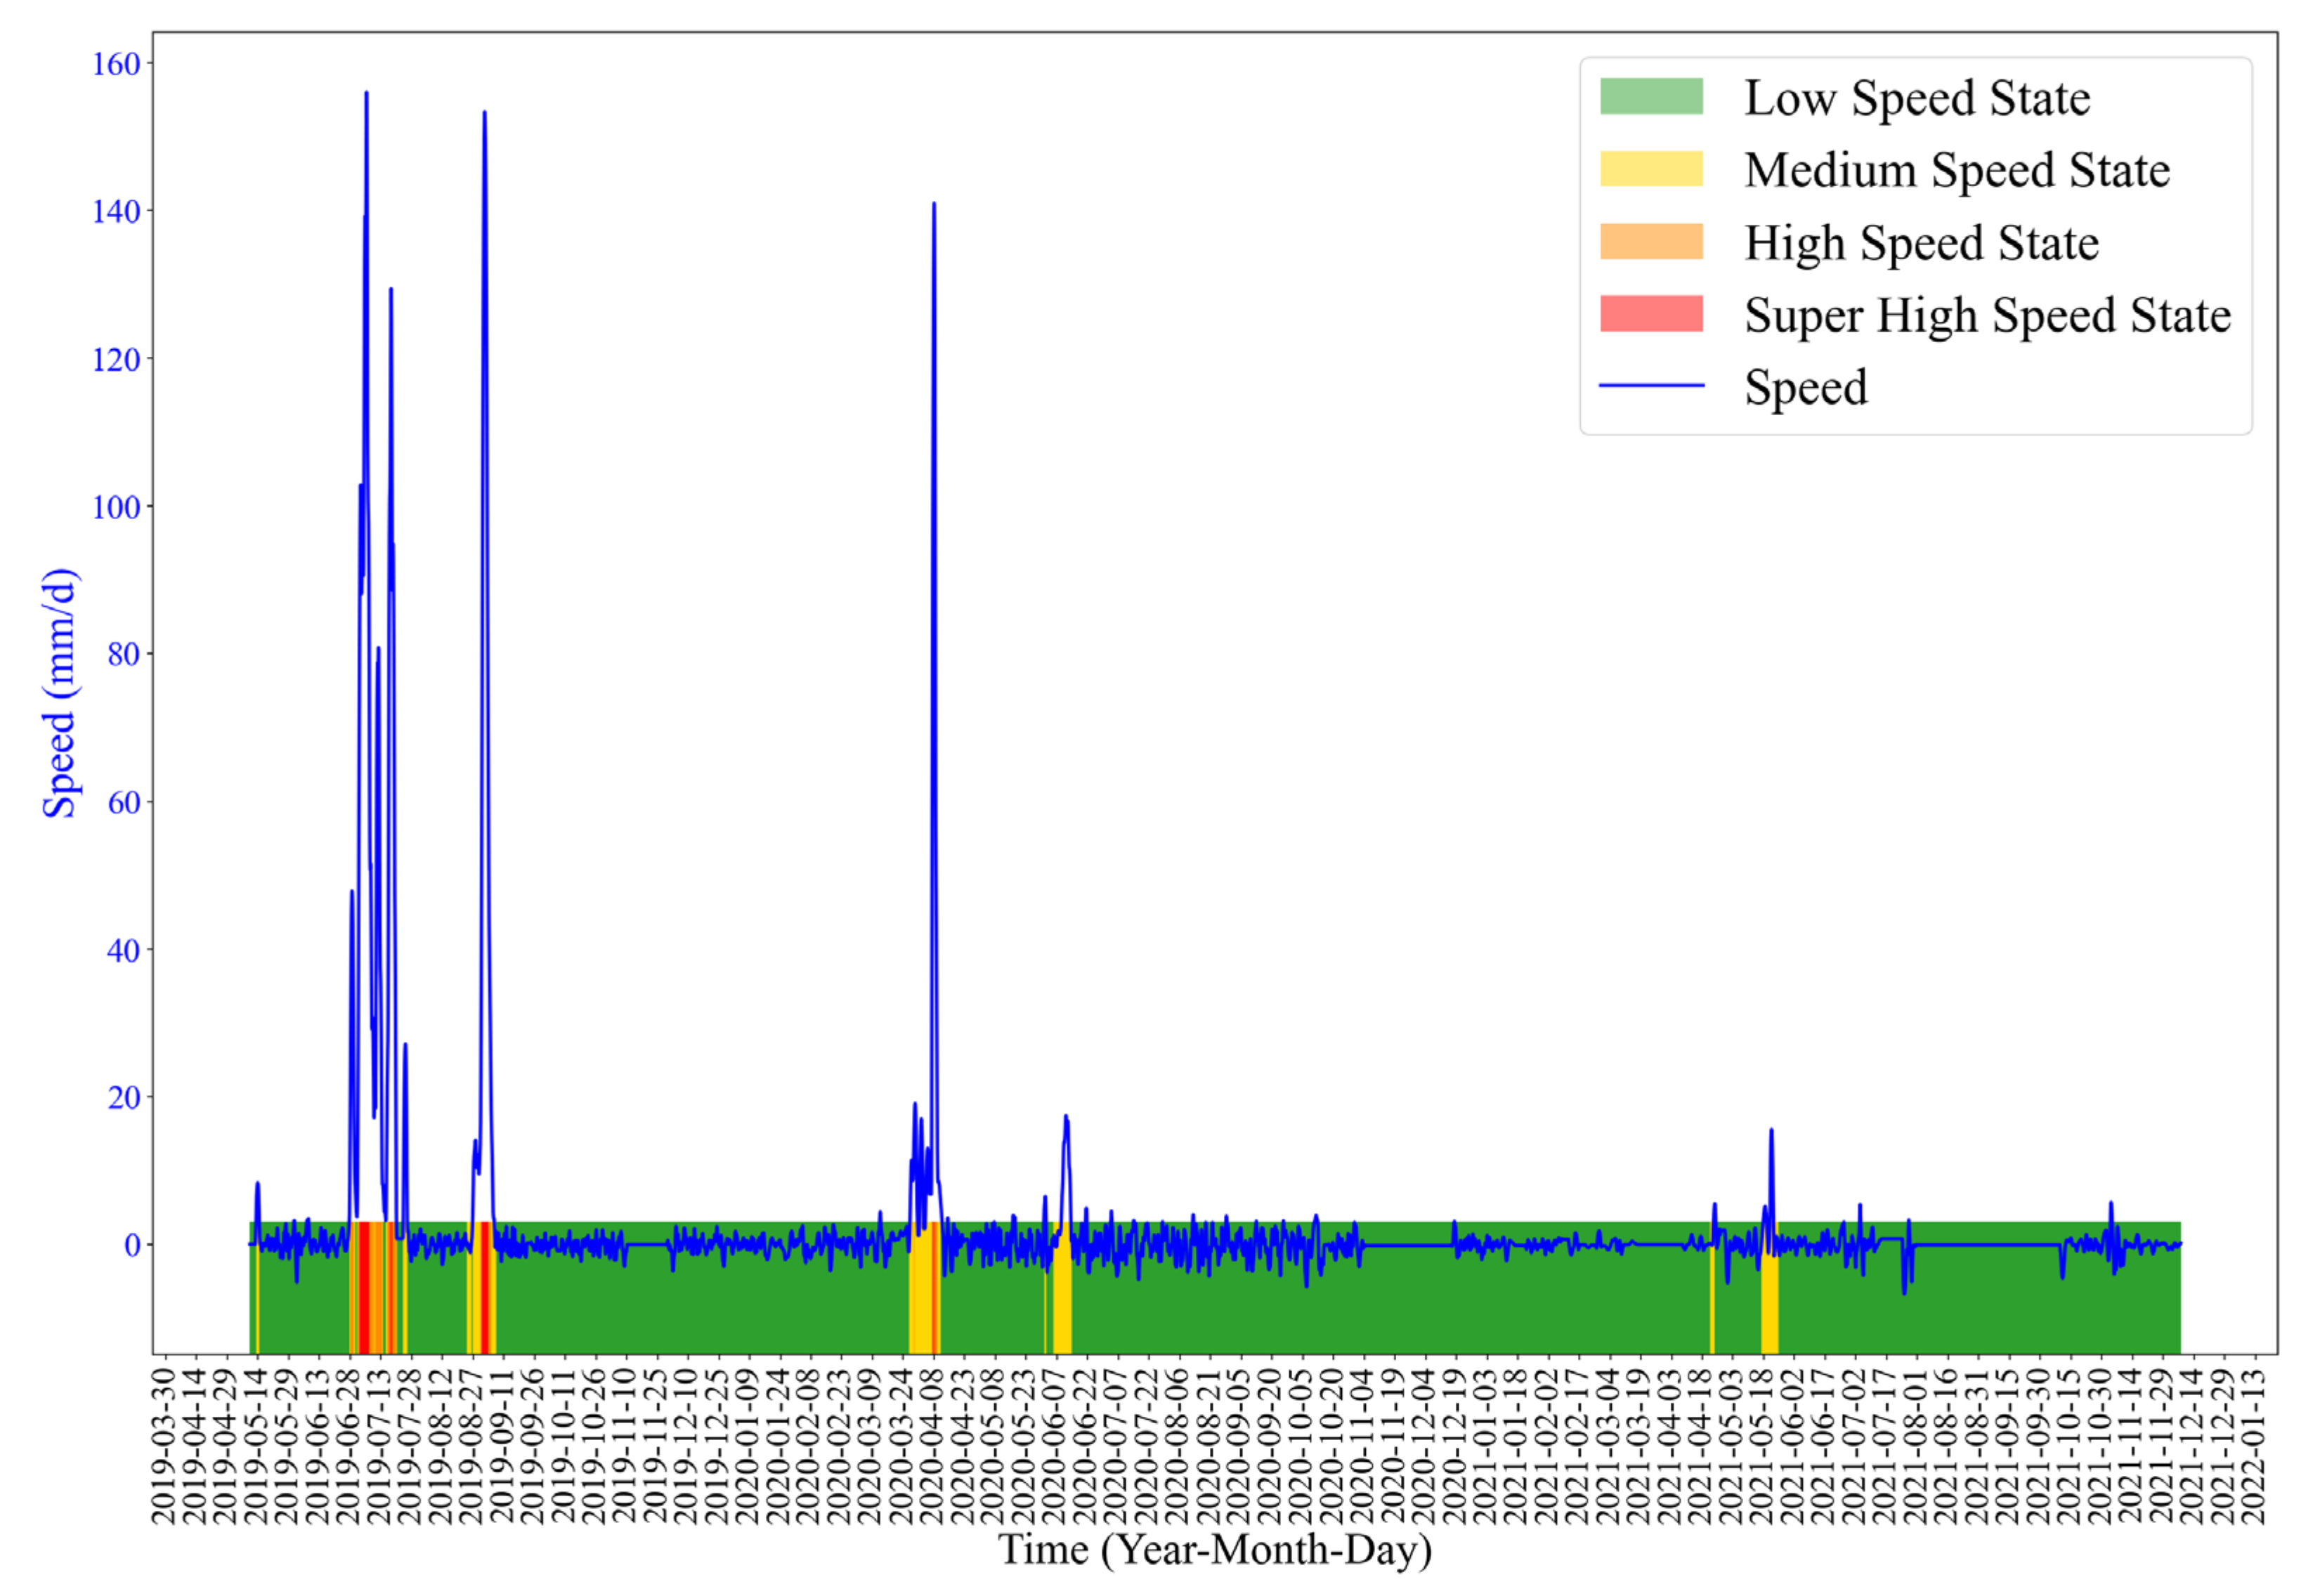
The training results show that the accuracy, precision and recall of the algorithm are 0.981, 0.971 and 0.871, respectively. The trained ResNet algorithm was applied to the landslide deformation dataset, and the deformation state classification results are shown in
Figure 10.
The above results show that the K-means-ResNet method can identify the deformation state of landslide accurately on the whole. According to the deformation state, we can carry out landslide warning.
3.6. Validation
To evaluate the reliability of the proposed model, we also processed the dataset by two neural networks, MLP and LeNet, and compared their results with our results.
They also use the random search algorithm to determine the optimal hyperparameters. The iteration is 20 times and the result is validated by a fivefold cross-validation technique. The numbers of hidden layers are 1, 2, 3, 4 and 5. The initial learning rate parameters are 0.1, 0.01, 0.001 and 0.0001. The batch size selection parameters ranged from 16 to 128 with a step size of 2, and the optimization function selection parameters included SGD, Adagrad, RMSprop and Adam.
The MLP model uses three hidden layers. We set the dropout as 0.5. Adam optimizer was used to optimize the network. The Relu function was chosen for the activation function, and categorical cross-entropy was used for the loss function. The batch size was 32, the initial learning rate was 0.01 and the initial iteration number was 1500.
The LeNet model uses five hidden layers and the Adam optimizer to optimize the network. The loss function is categorical cross-entropy. The batch size is 32, the initial learning rate is 0.001 and the initial number of iterations is 1500.
To speed up model training, the learning rate dynamic decay strategy and EarlyStopping (i.e., stop training when the accuracy is not increasing within 100 iterations) were used to stop iterations before overfitting and terminate training.
The evaluation of the training results in
Table 2 shows that the ResNet algorithm outperformed the MLP and LeNet algorithms.
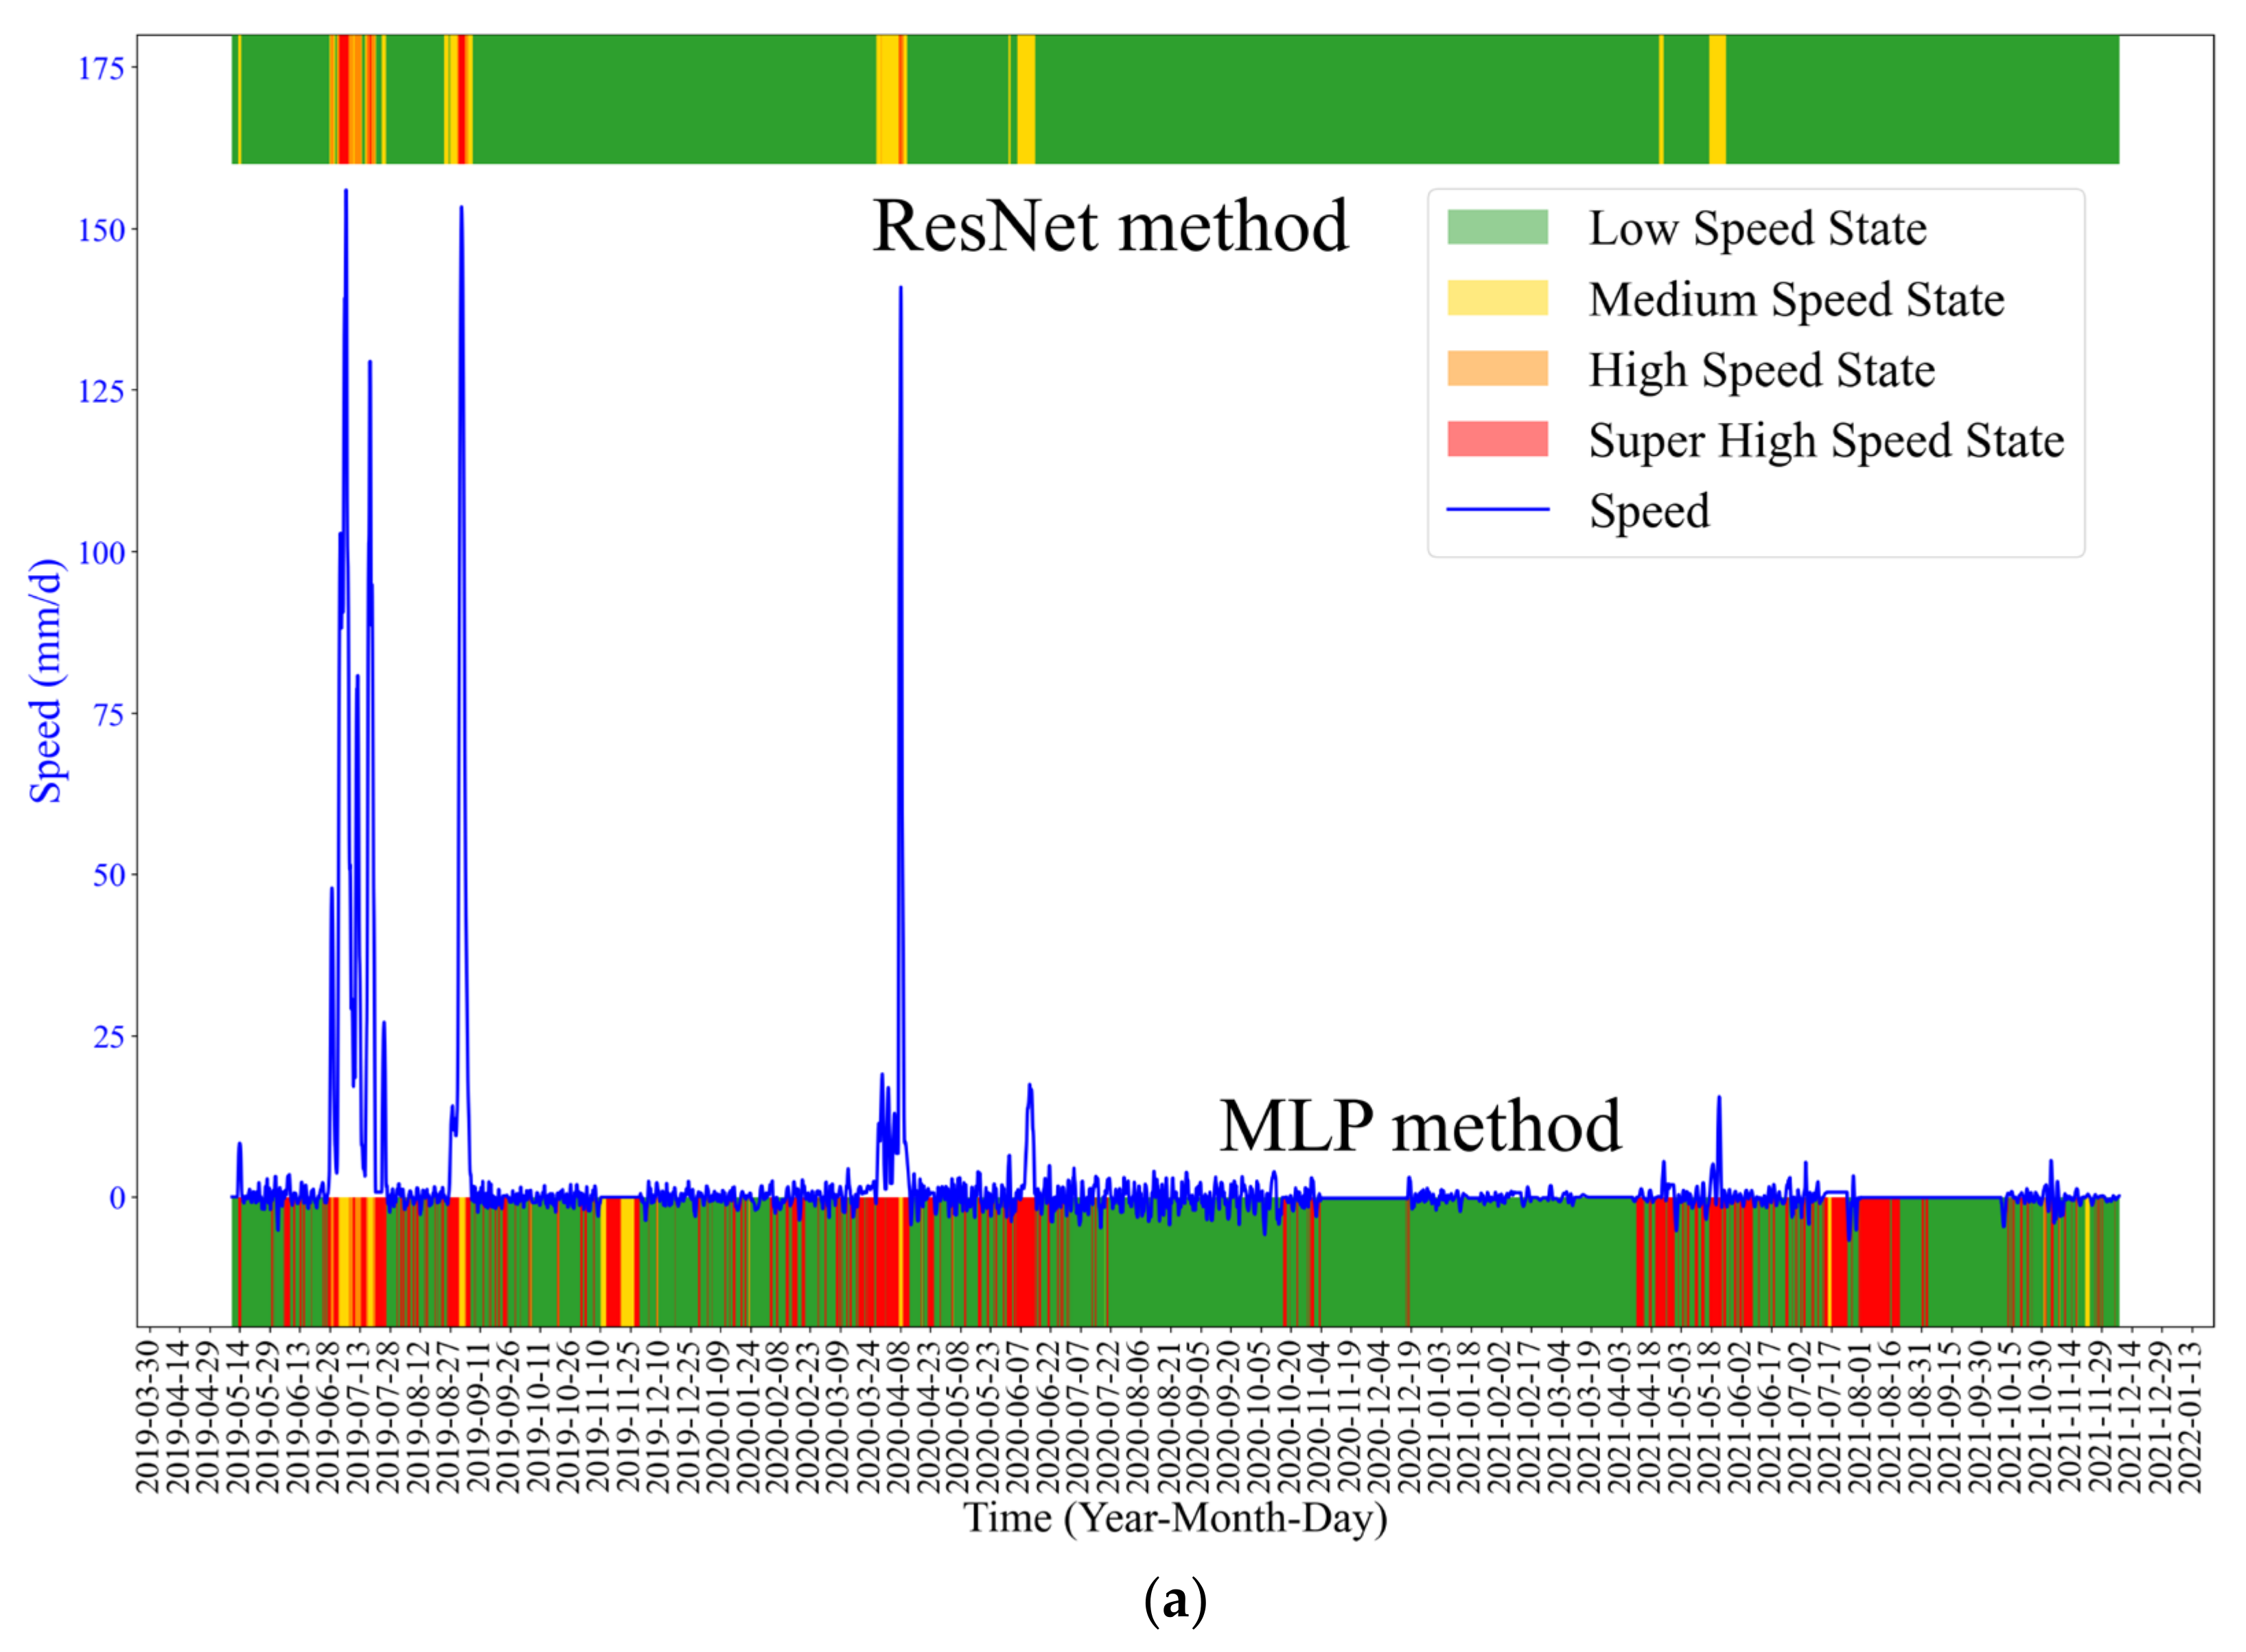
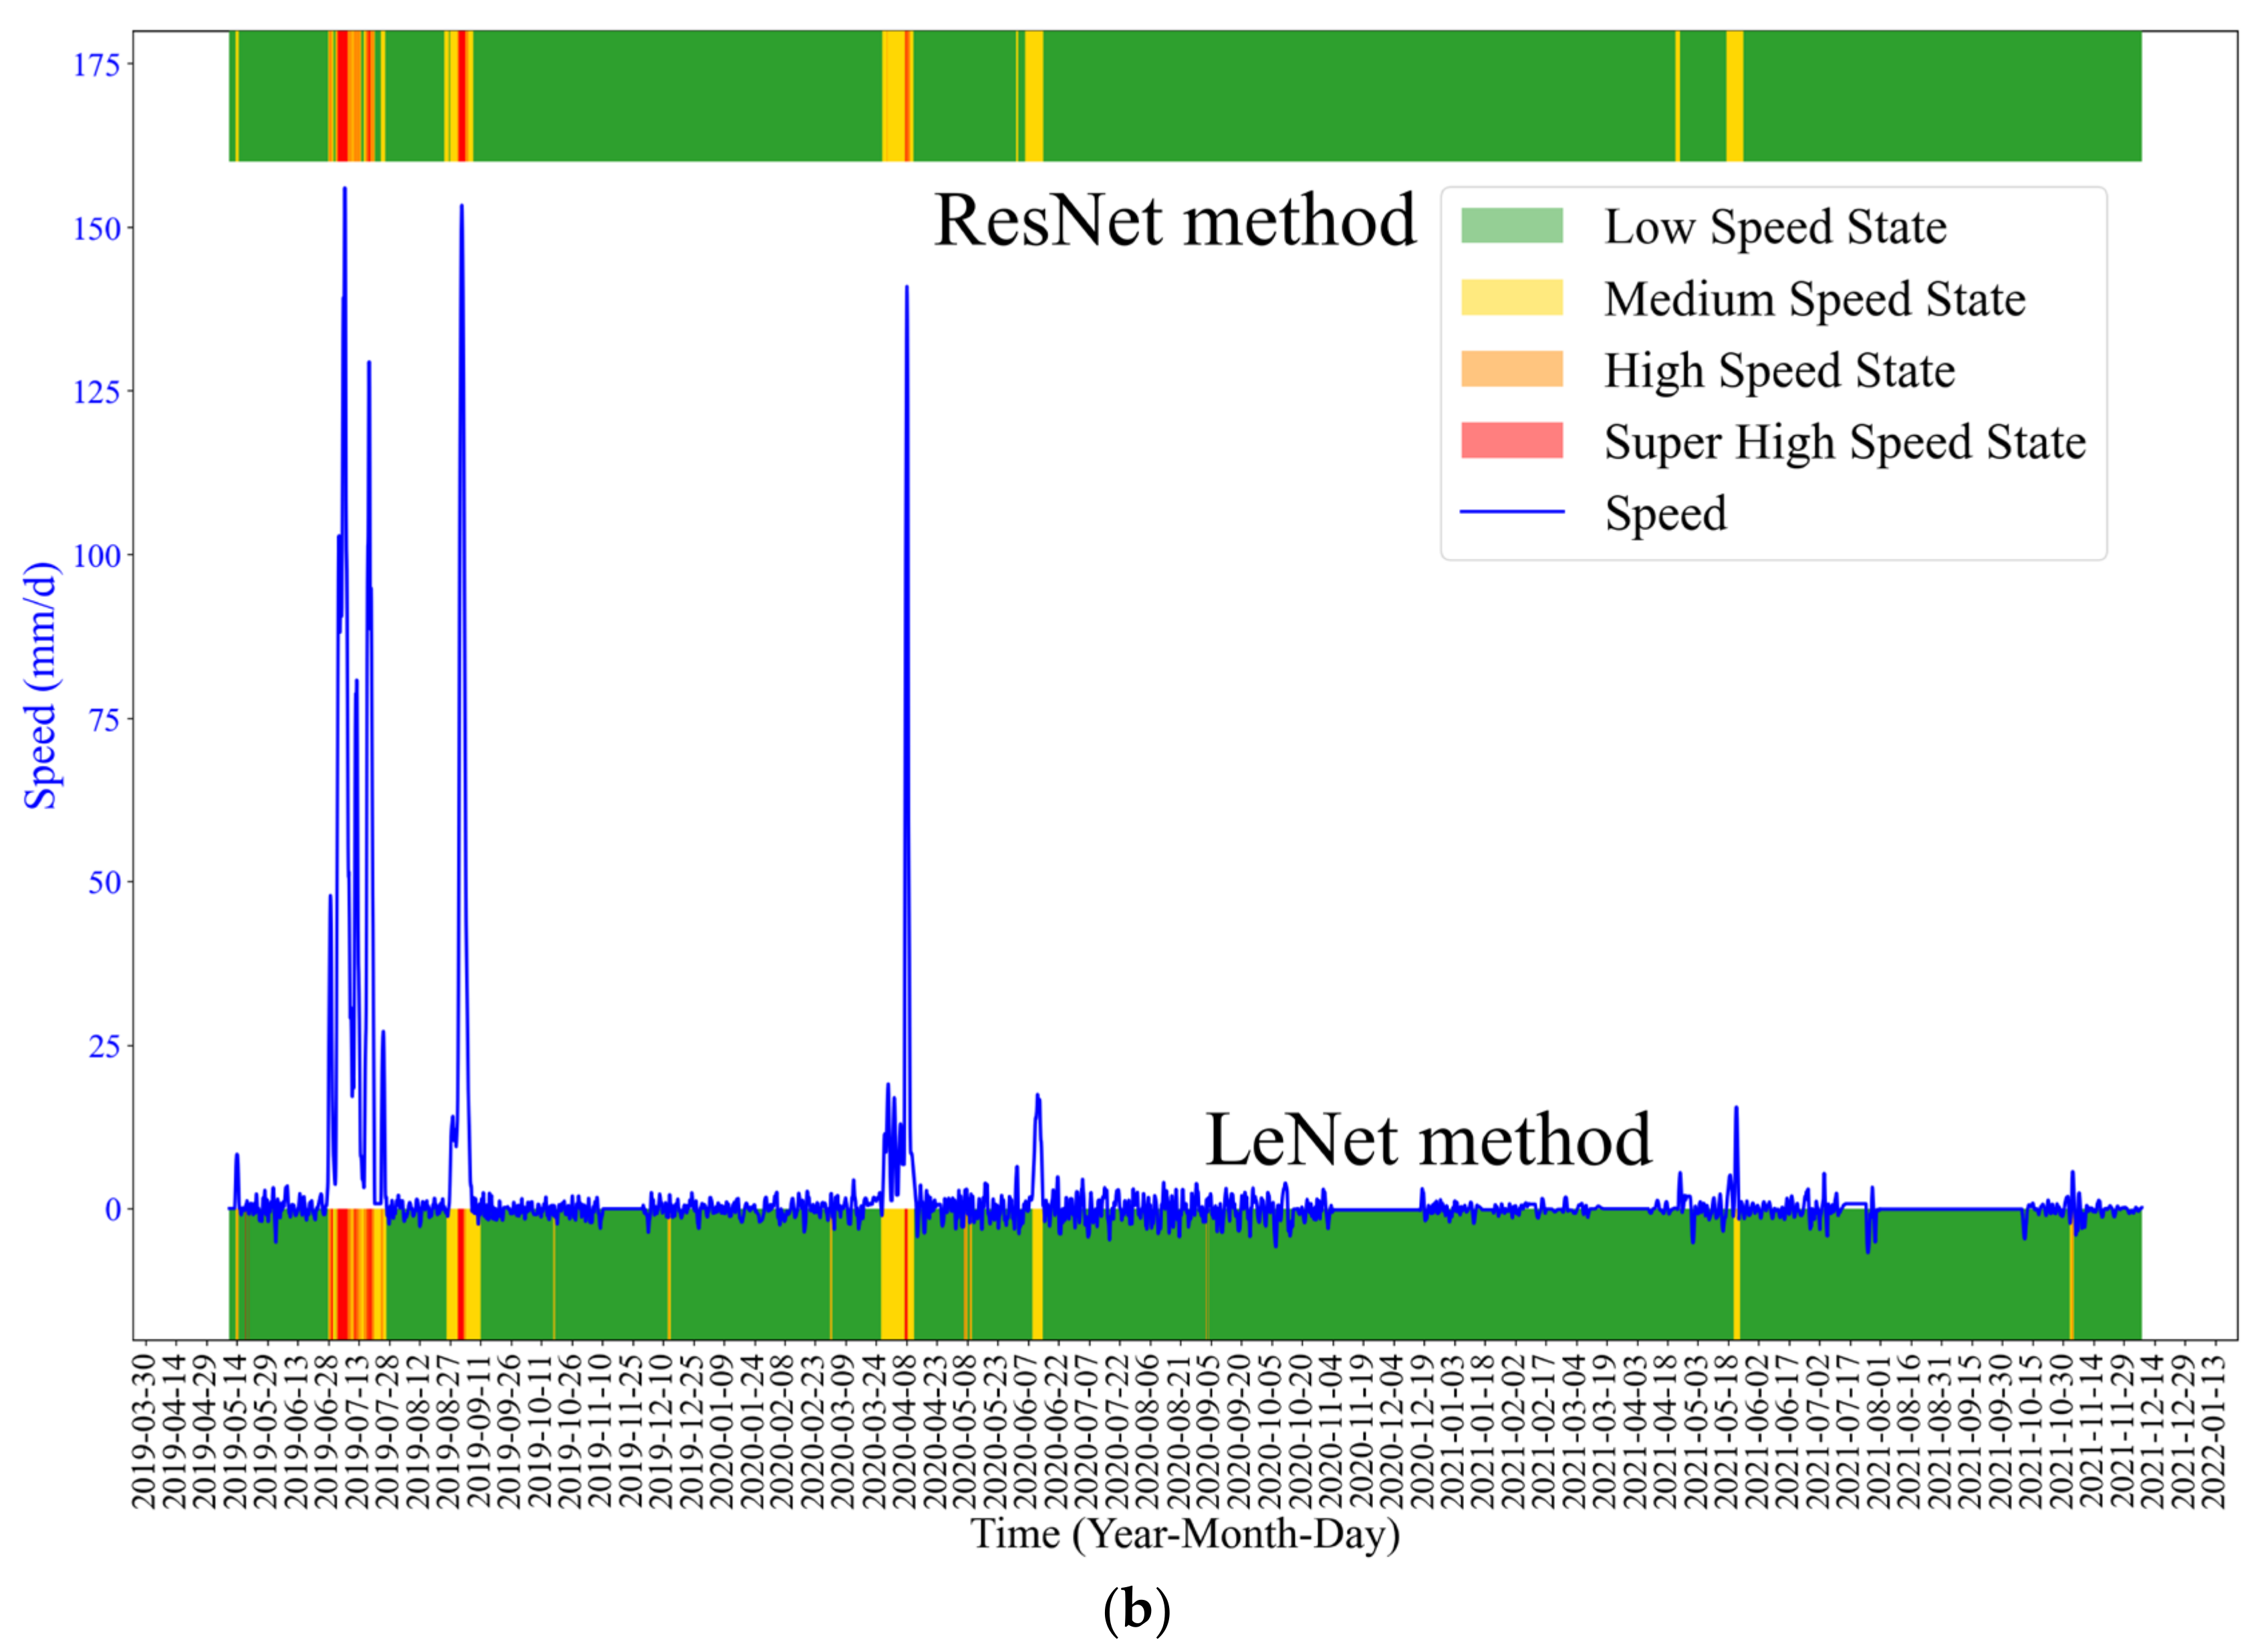
The early warning results of MLP and LeNet algorithms are shown in
Figure 11. The results show that the ResNet method performed better in early warning than MLP and LeNet methods.
We also compare the K-means-ResNet model-based warning with the warning method in [
23], and the thresholds are listed in
Table 3.
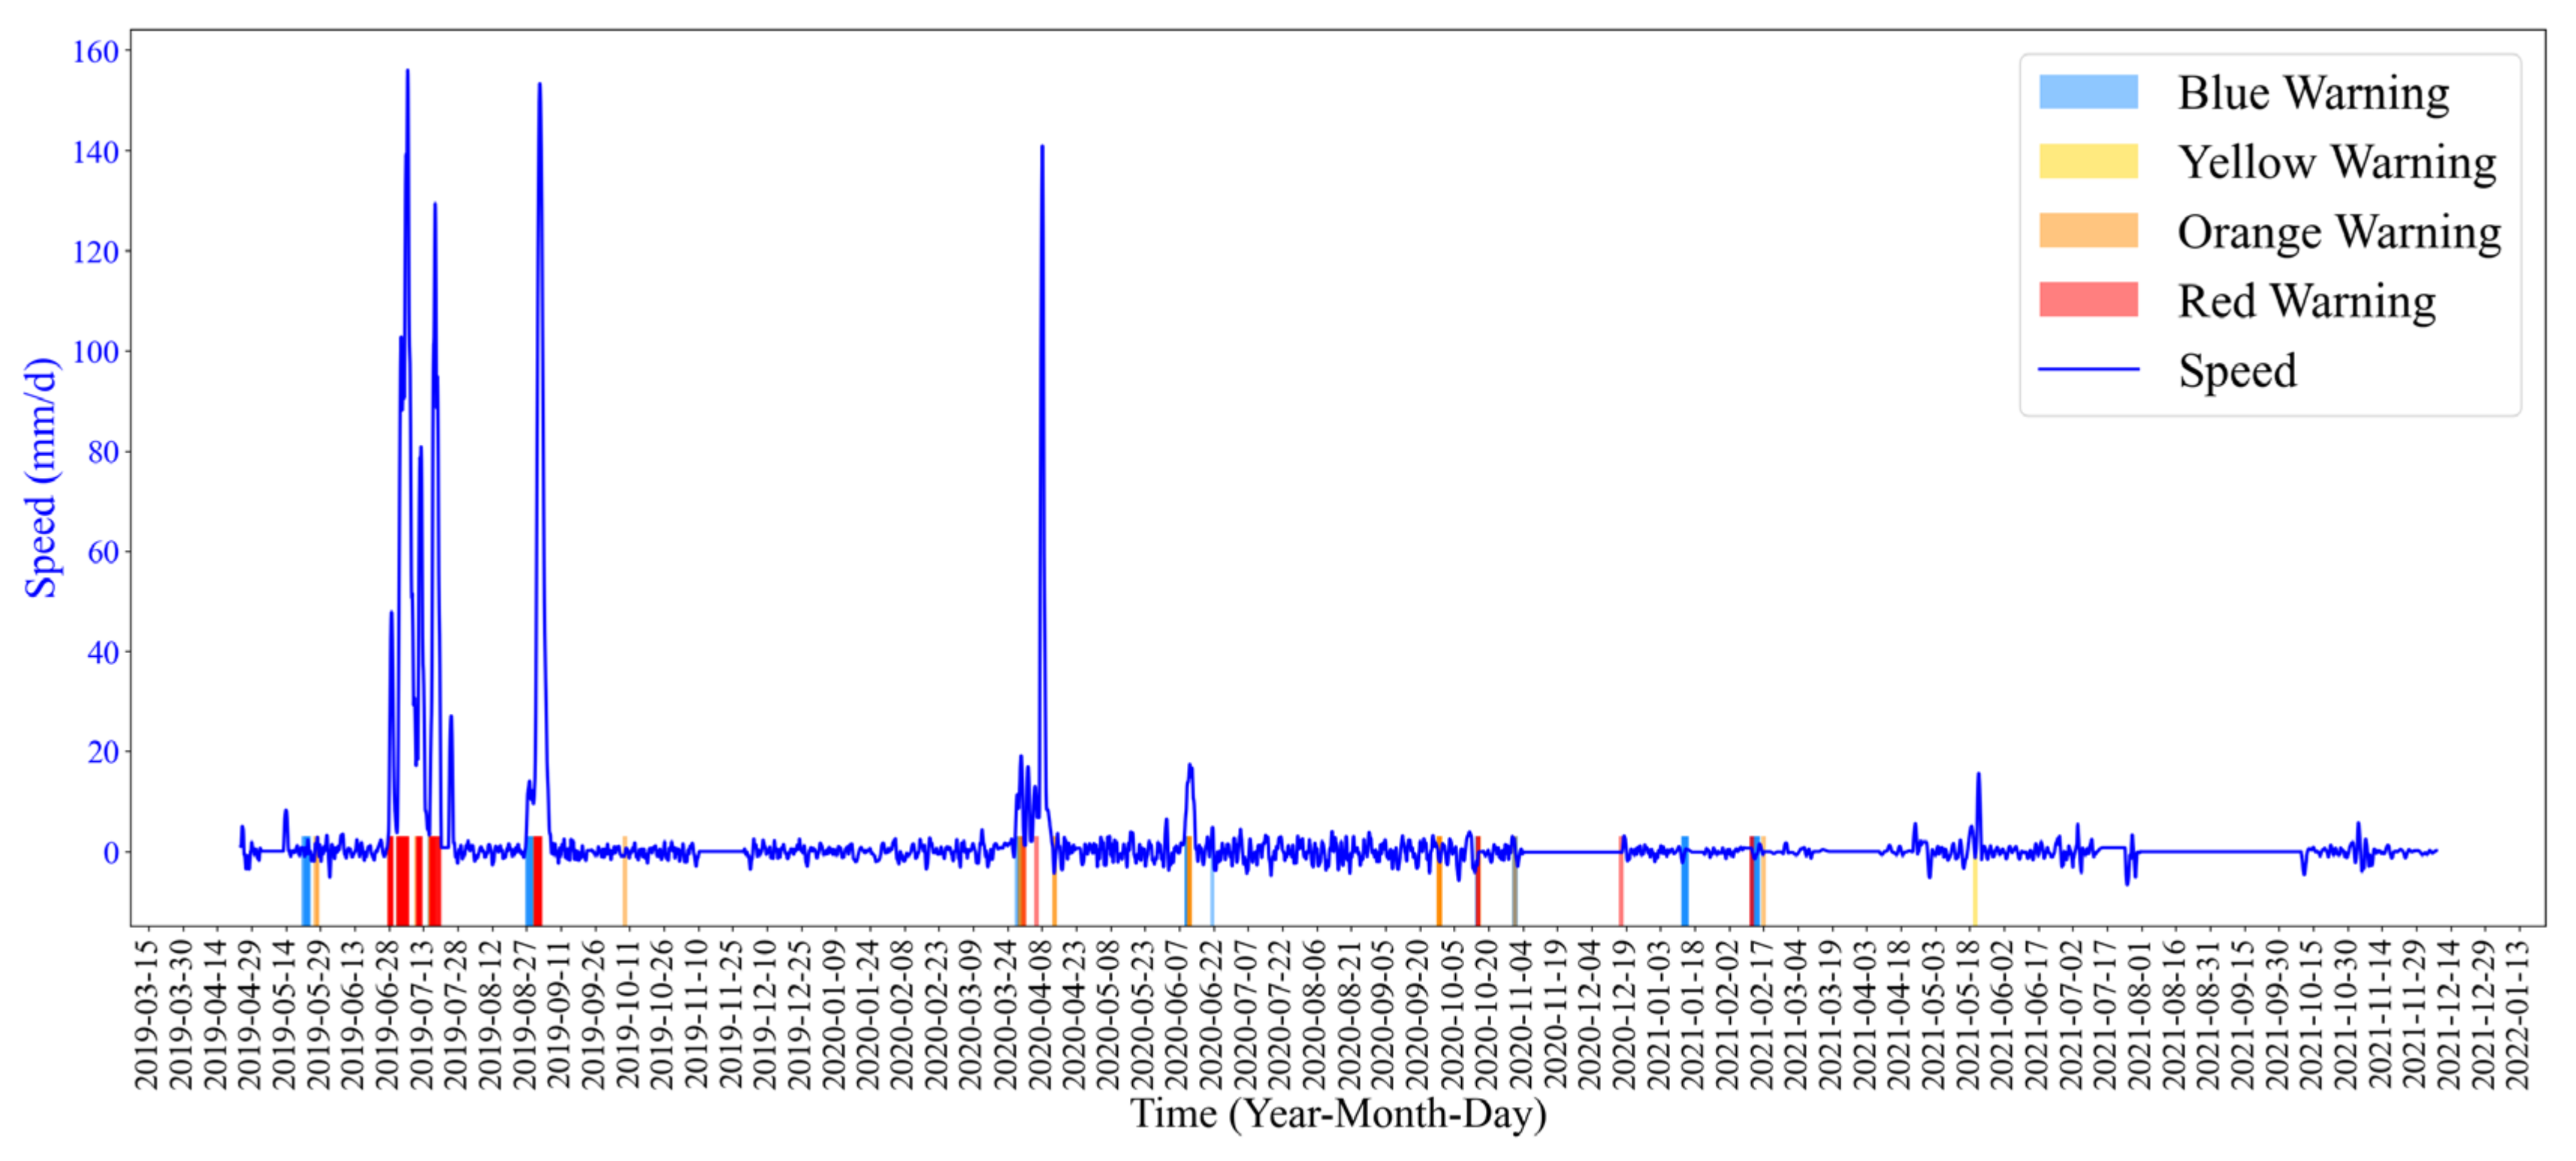
The early warning results are shown in
Figure 12. Between 14 and 29 May 2019 and 20 September 2020 and 14 March 2021, the landslide deformation velocity fluctuated in a small range, so the landslide state did not change. However, the early warning system generated some false warnings.
The early warning method based on the K-means-ResNet model proposed in this paper can effectively reflect the deformation state of landslides and reduce false alarms. In addition, this method does not need to determine the threshold value or dynamically adjust the threshold value based on experience, which is necessary for the traditional threshold warning method.
4. Case Study: Shangmao Landslide
4.1. Landslide Overview
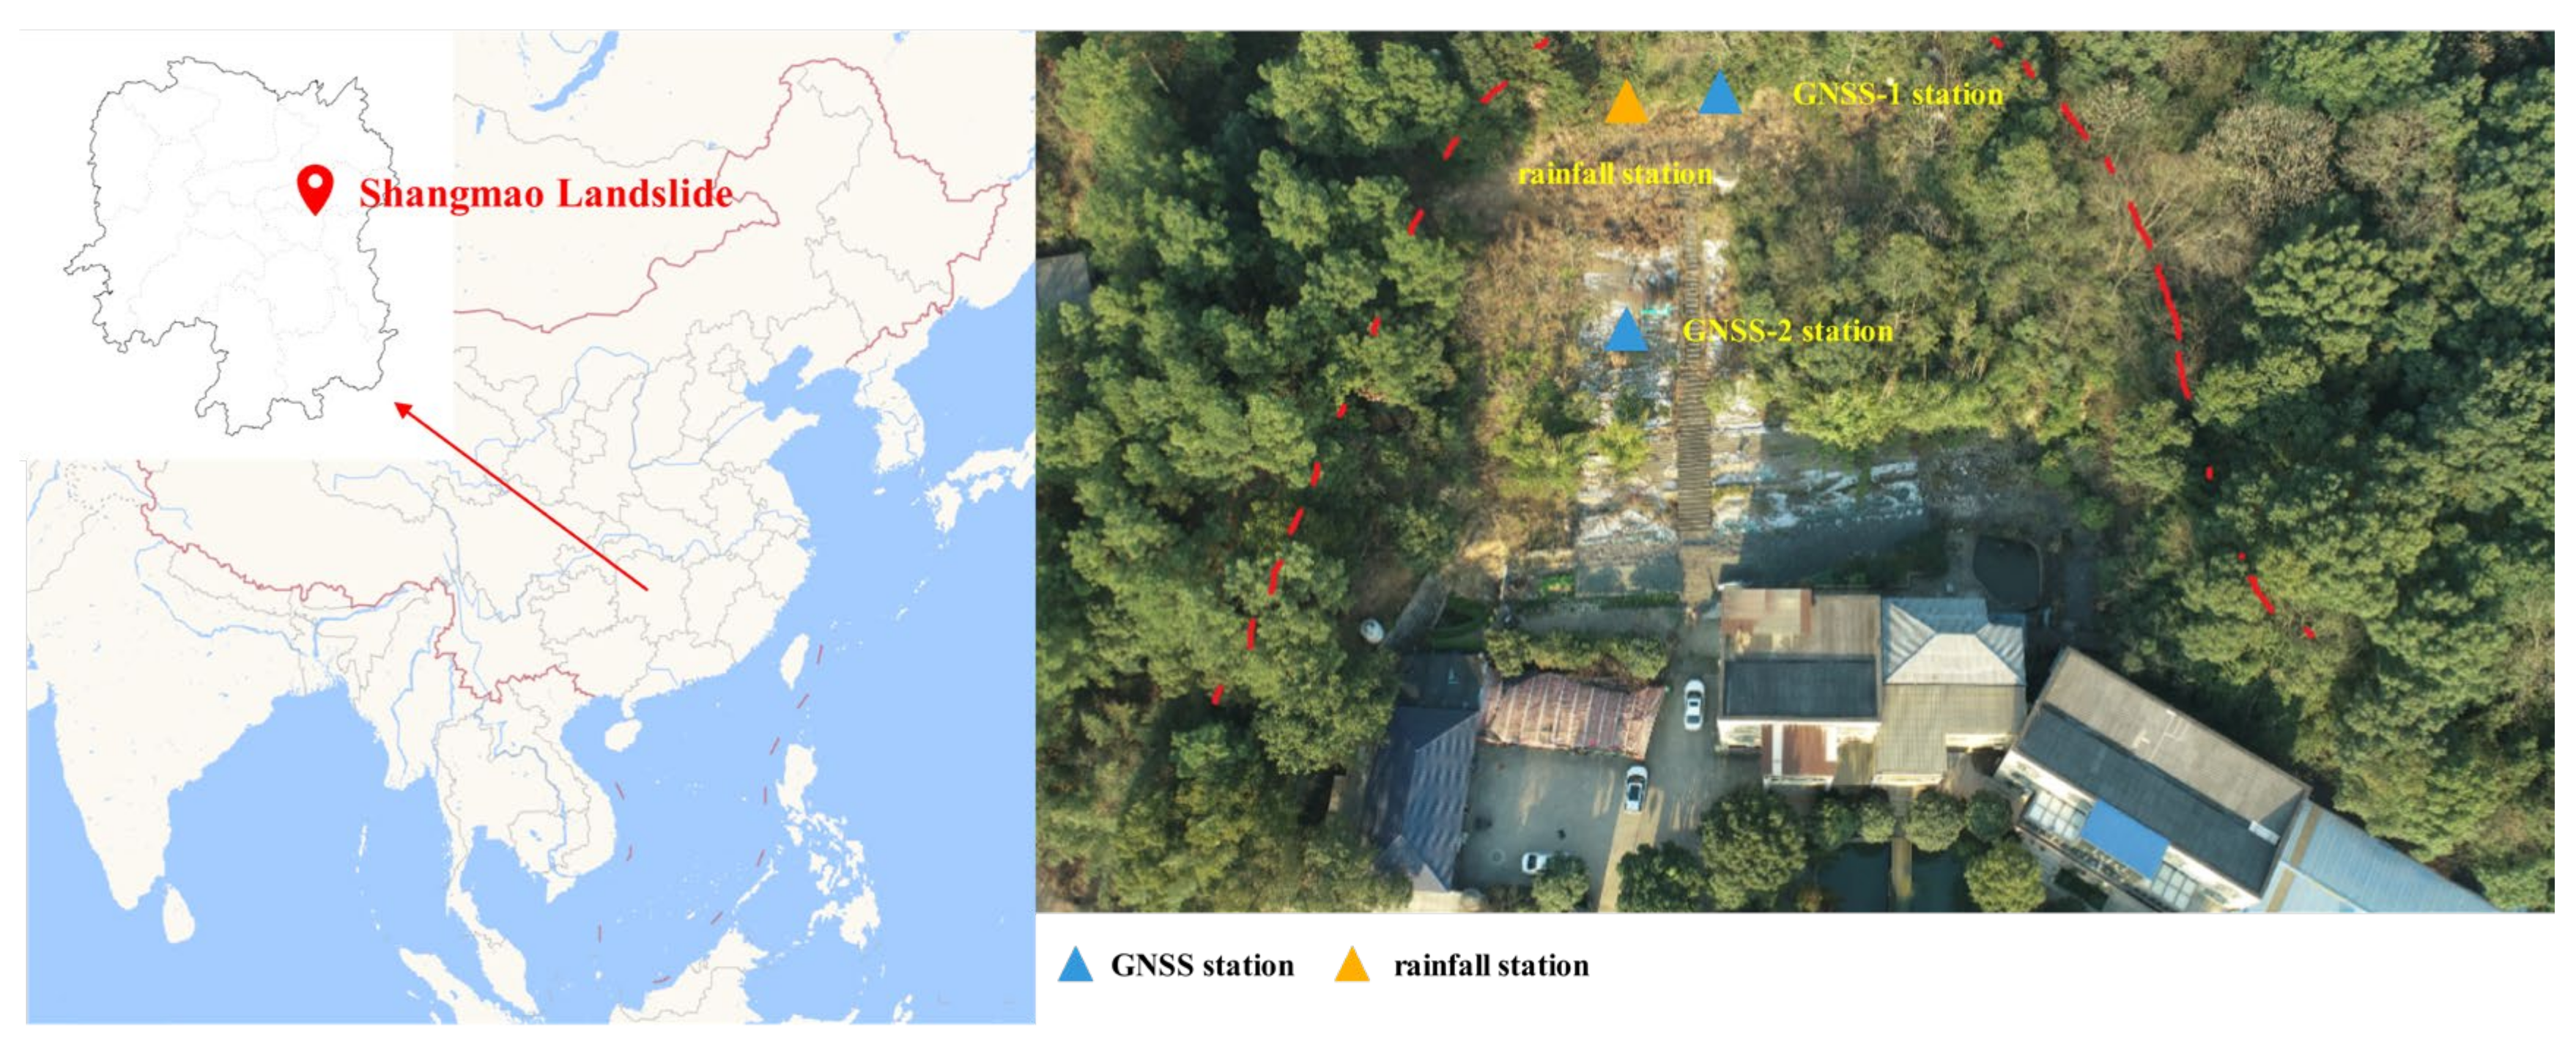
The Shangmao landslide locates in Chihu Village, Hunan Province, China (
Figure 13), which has an armchair shape. The front edge is about 45 m (vertical length) × 62 m (horizontal length) × 45 m (thickness), and the back edge is about 45 m (vertical length) × 35 m (horizontal length) × 60 m (thickness). This is a small soil landslide. The main sliding direction is 225°. The slope started sliding in June 2017 after a strong rainfall. The landslide experienced the second failure in the 2019 flood season, the original crack formed a scarp, and the front edge of the retaining wall was displaced. The landslide body is mainly muddy siltstone, gravel and clay containing gravel.
Similar to the Zhongma landslide, the upper soil layer of the landslide is affected by the infiltration of rainfall, which causes the landslide to start deformation acceleration. Rainfall is the main precipitating factor of landslide, so we must consider the rainfall factor when conducting early warning.
4.2. Landslide Monitoring Data
Two GNSS monitoring stations were installed on the deformation area of the landslide. The GNSS data were collected every hour, and the rainfall data were collected from the deployed rainfall station every 24 h.
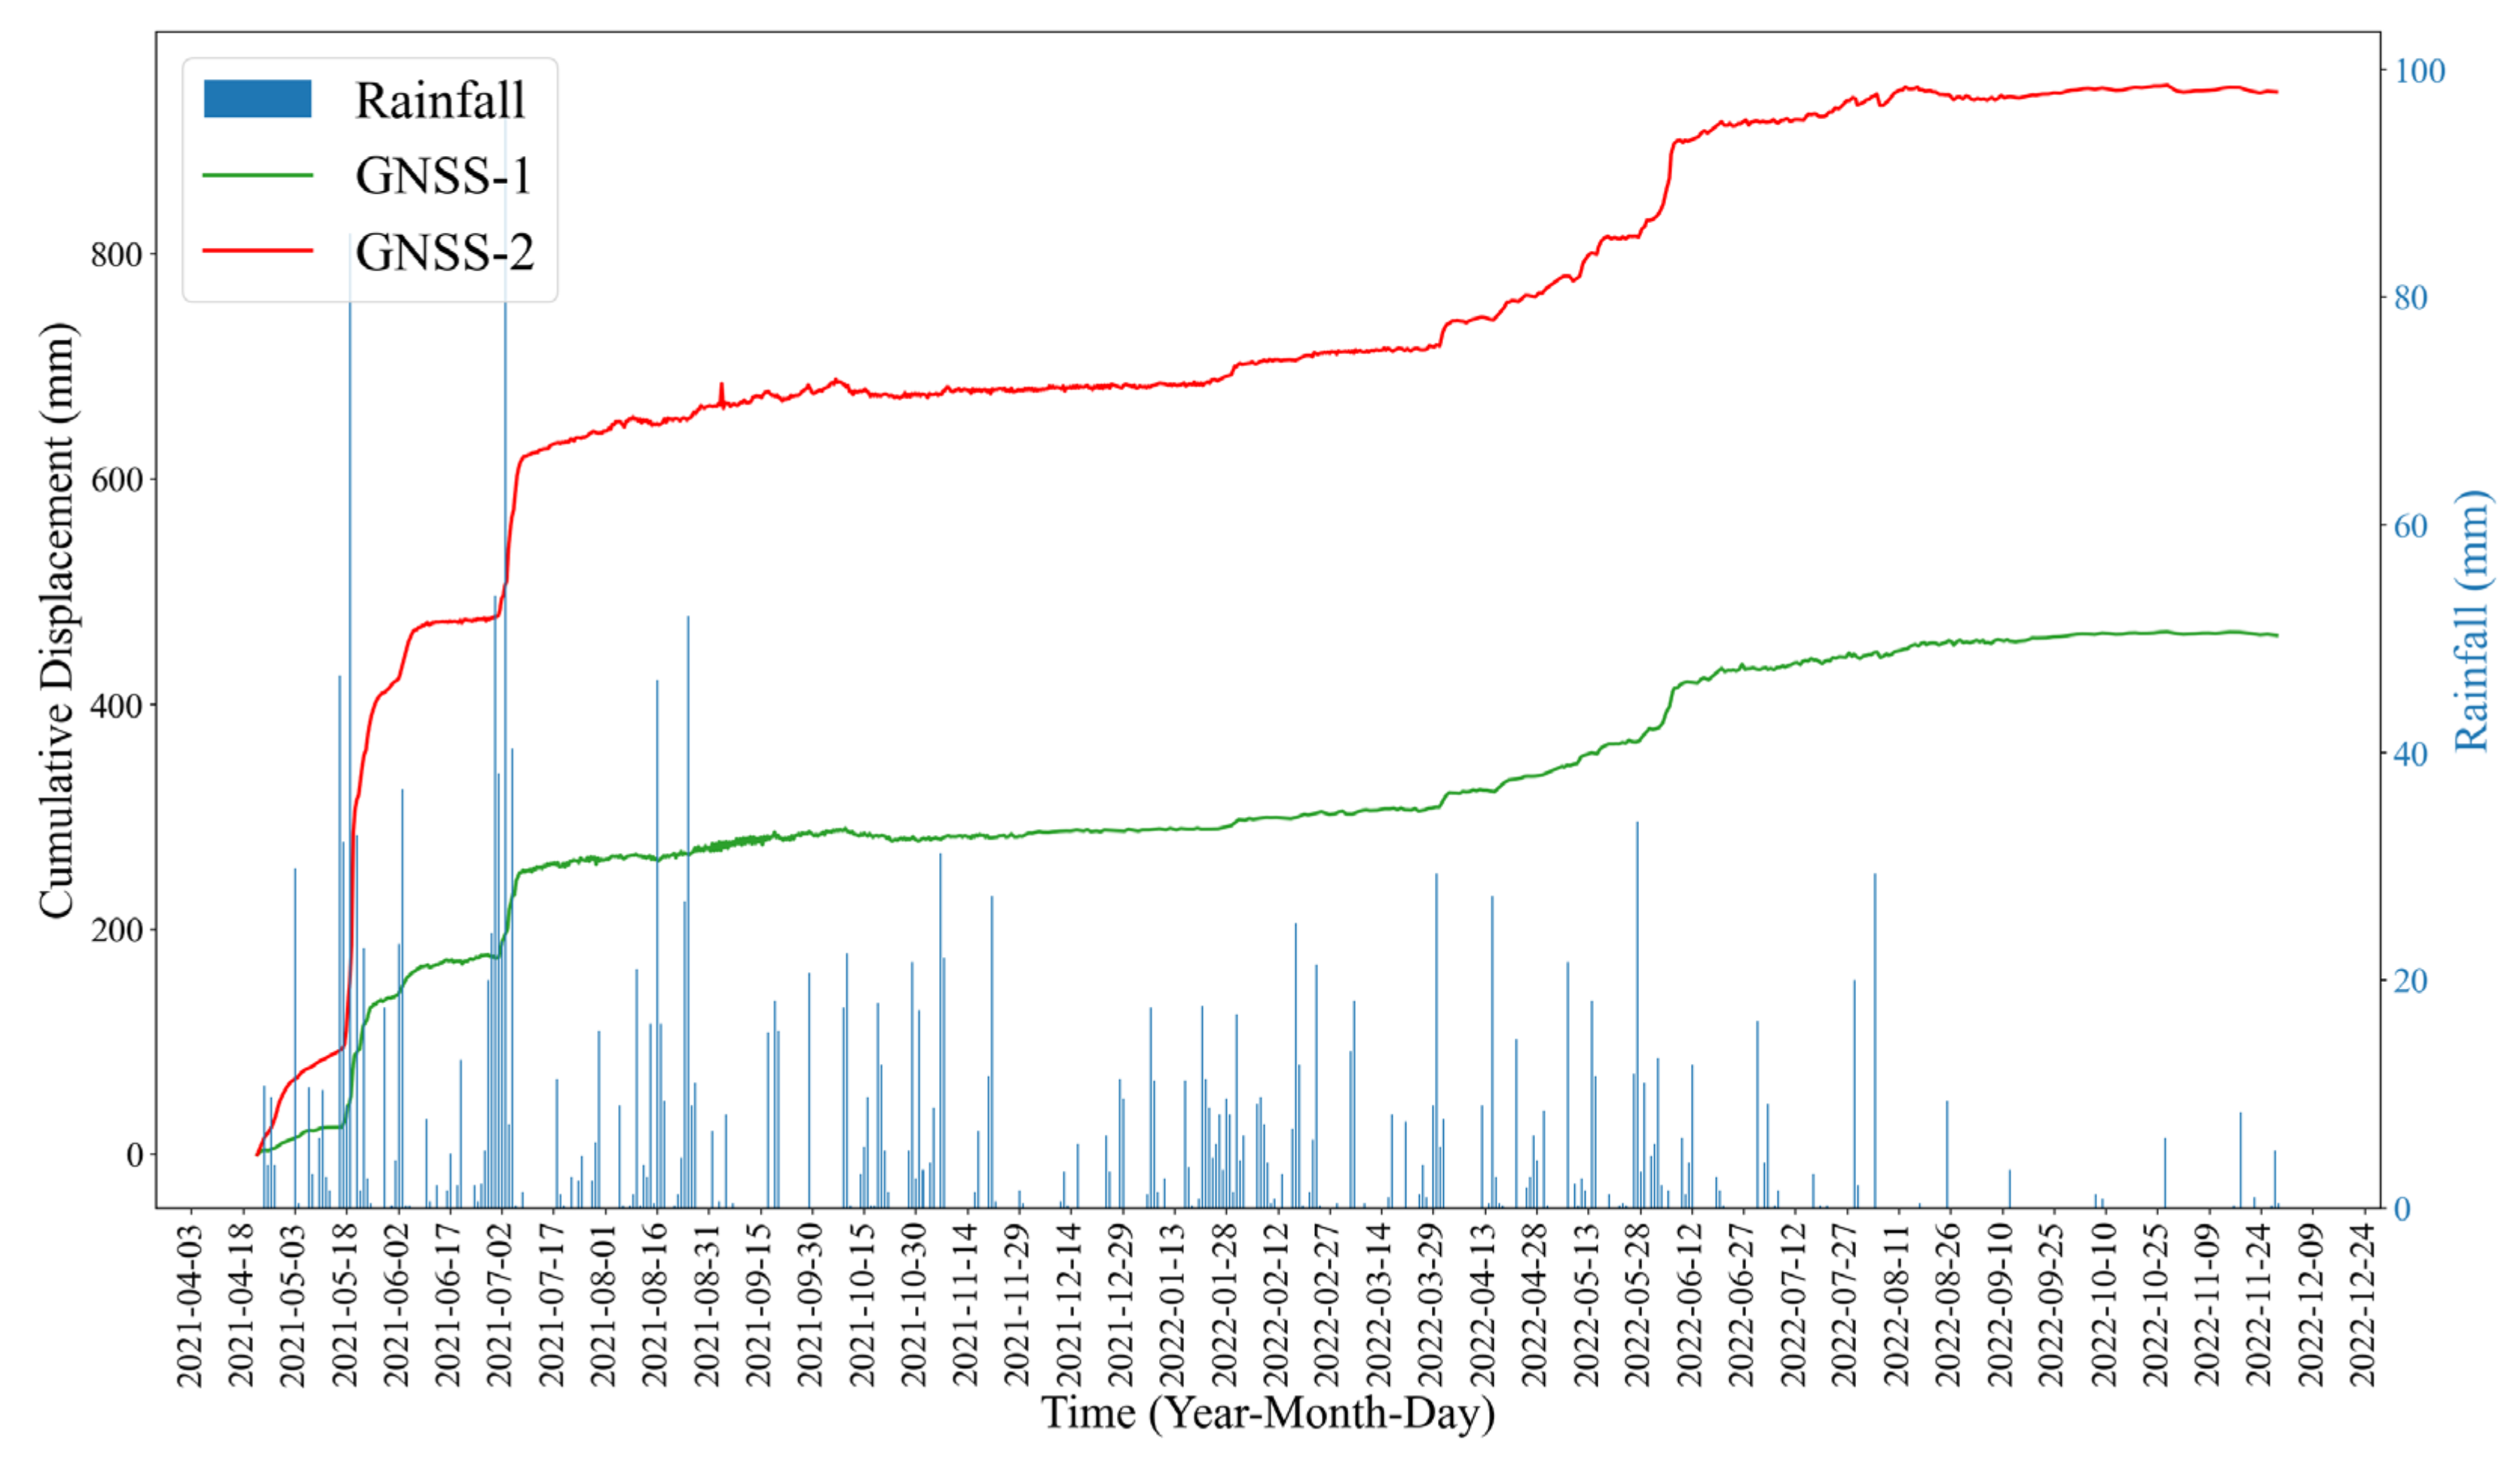
As
Figure 14 shows, the deformation of the Shangmao landslide has obvious step accelerations, temporally coincident with the periods of continuous rainfall or after a large rainfall. So, the landslide deformation is closely related to the rainfall.
4.3. K-Means Clustering
The GNSS-2 with more obvious deformation and rainfall data was selected for the study. From 22 April 2021 to 7 November 2022, 20,739 monitoring data were collected, including 20,152 GNSS-2 data and 587 daily rainfall data.
As in the case of the Zhongma landslide, the displacement data were processed by one-time sample difference to attain an isochronous order. We used the slide window with the size of 48 and step size of 2 to construct the landslide displacement subseries. Finally, 14,080 data were obtained.
The velocity feature was extracted from each subseries using least squares fitting. The max–min normalization was applied to the velocity feature (see Equation (10)).
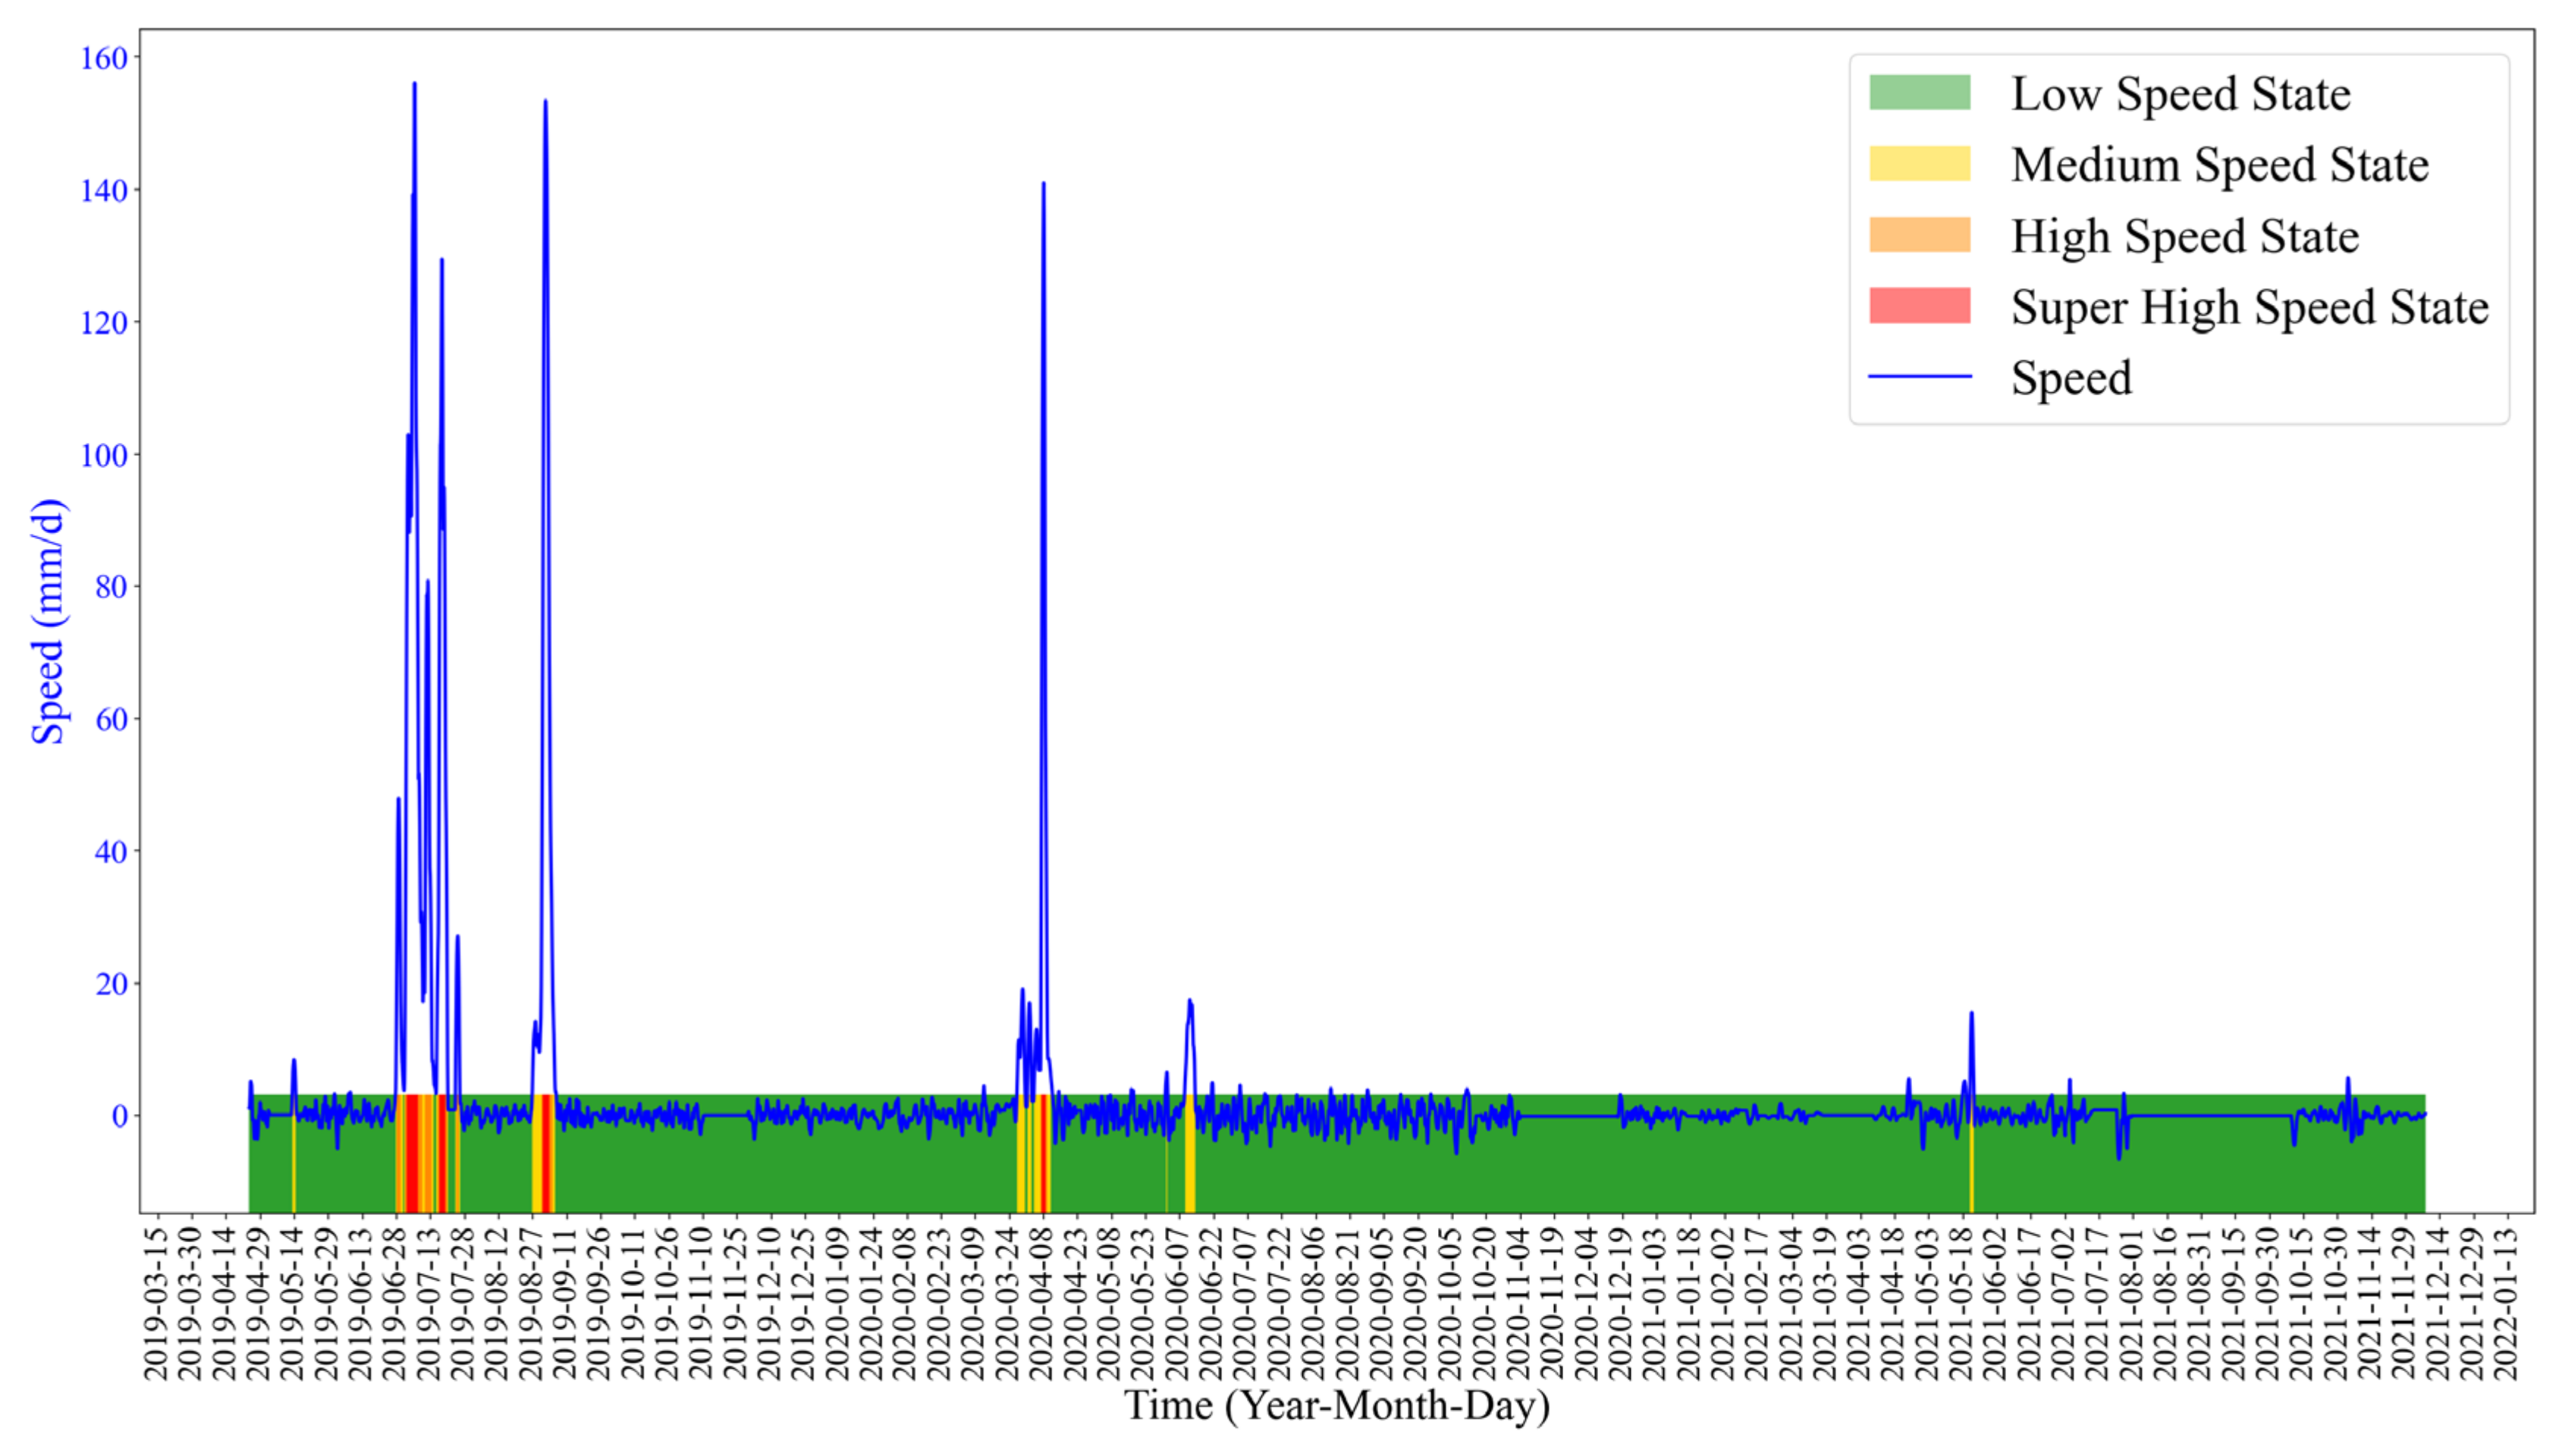
K-means clustering was performed and the K value, 4, was also determined by the elbow method.
The clustering centroids are shown in
Table 4, and the clustering results are shown in
Figure 15.
4.4. Feature Factors Selection for Landslide Data
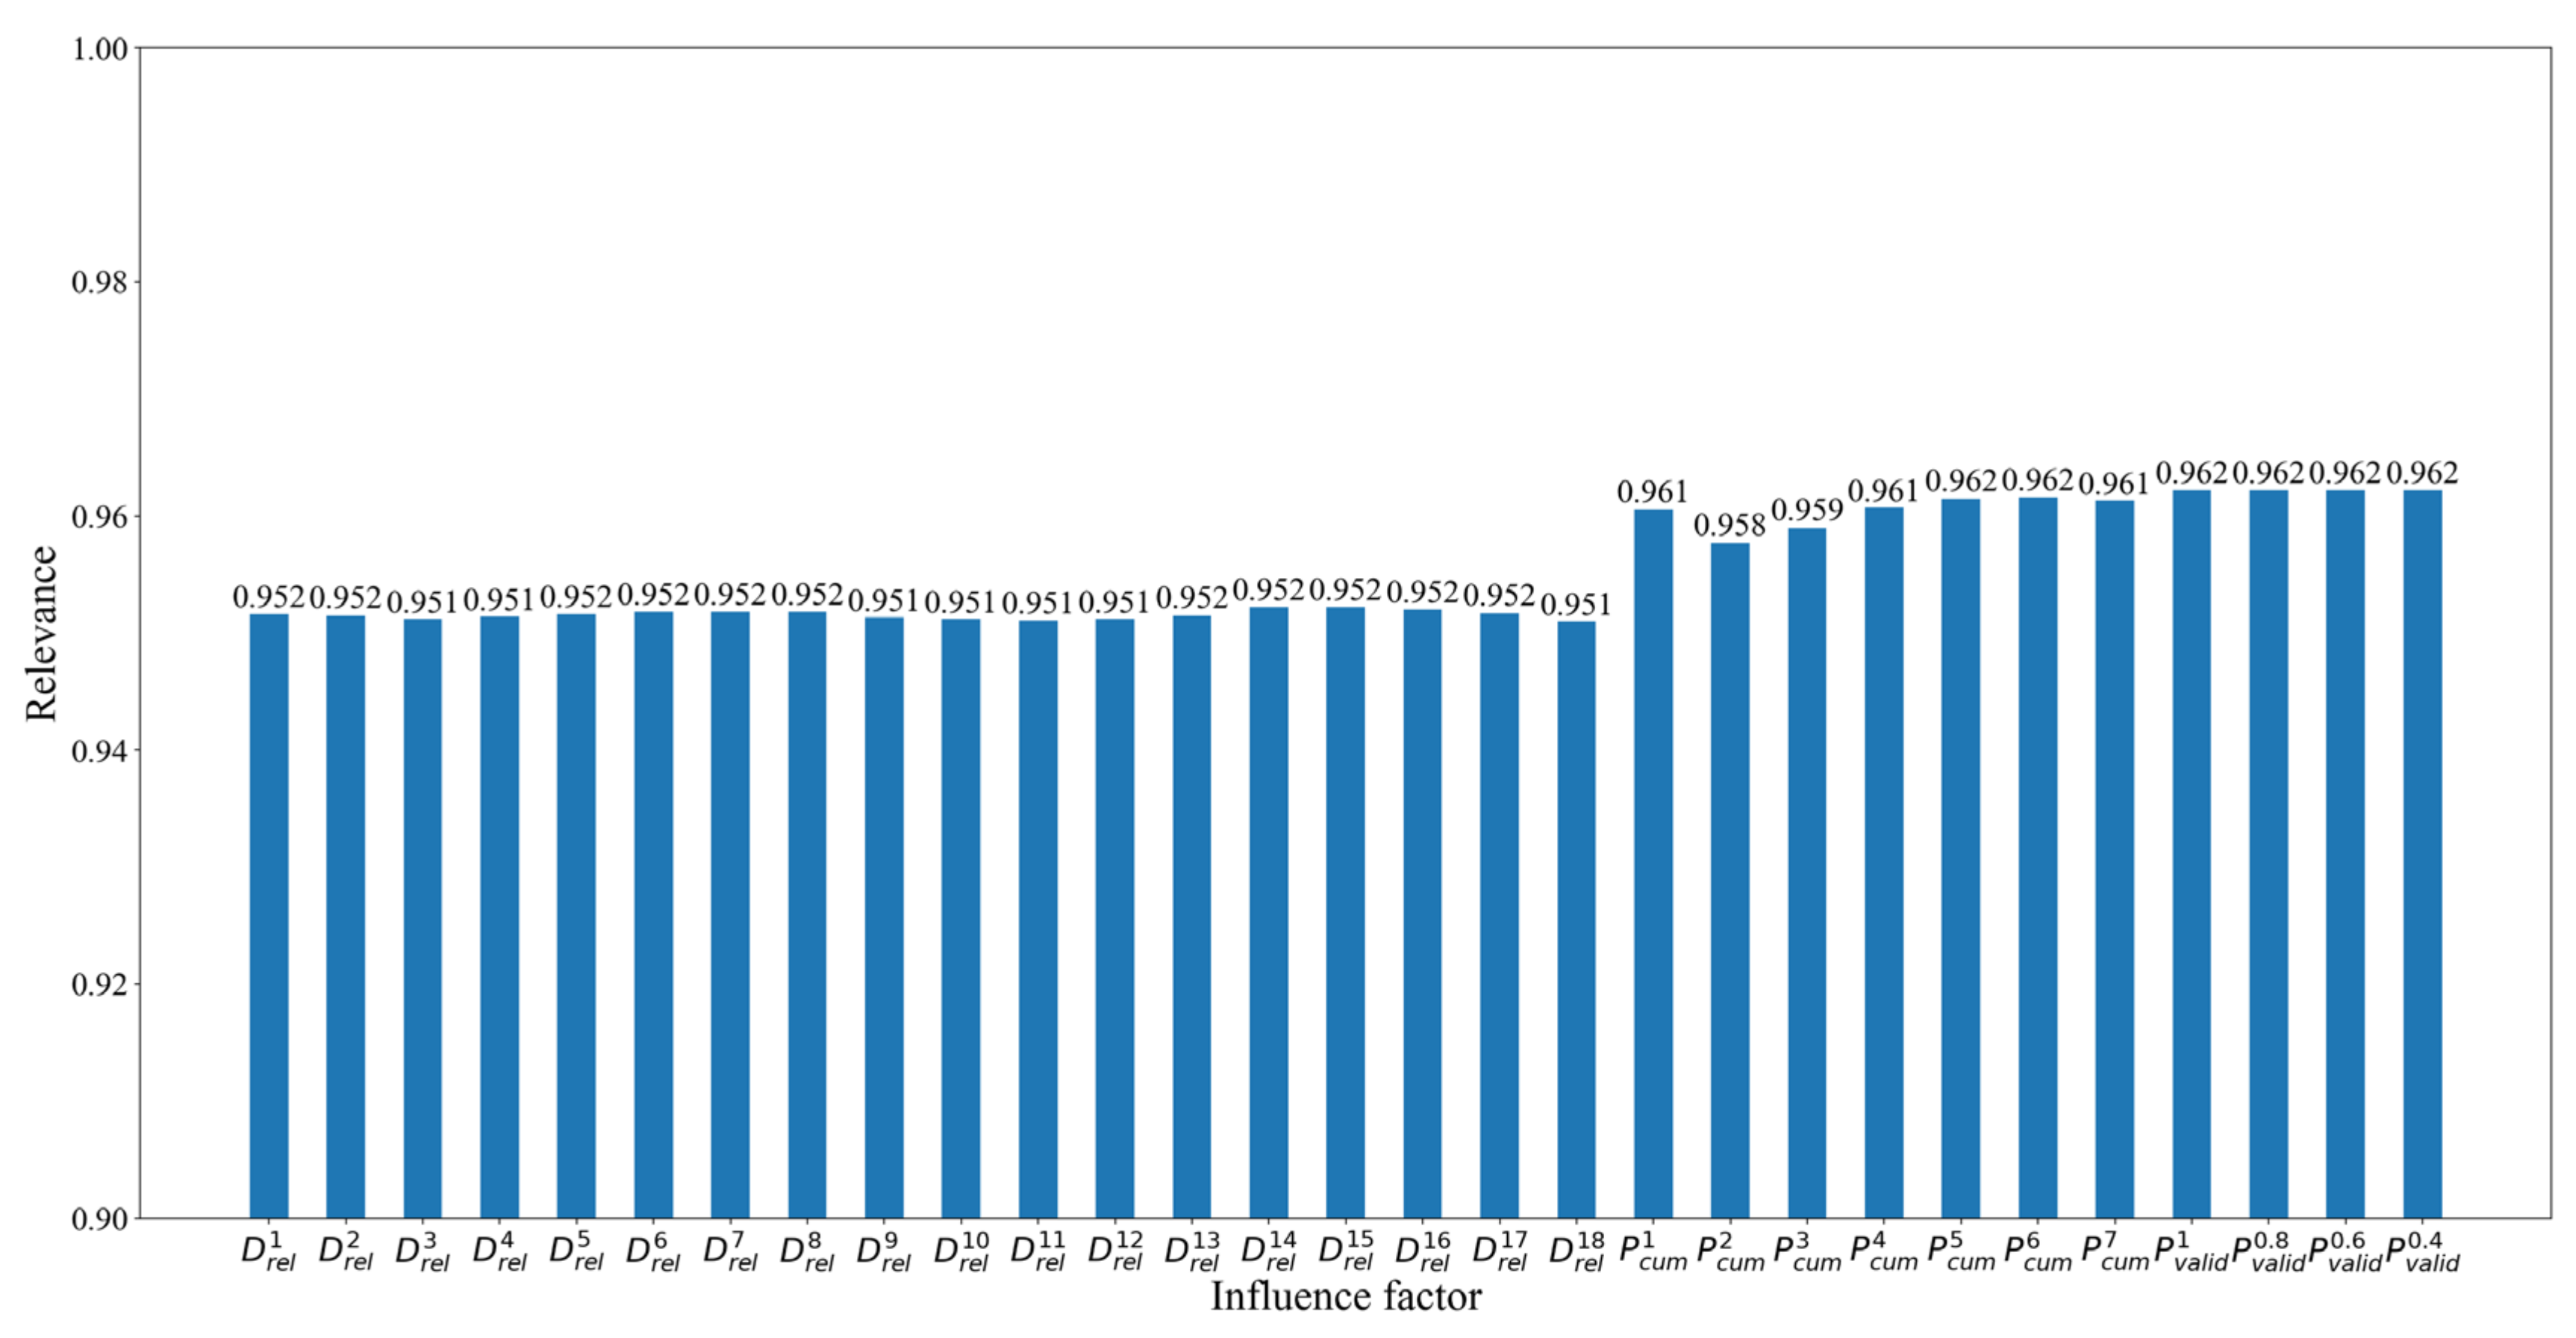
Similar to the Zhongma landslide experiment, rainfall features and relative displacement features were selected and analyzed by the gray correlation method.
As
Figure 16 shows, we can find that the gray correlation of all factors is greater than 0.9, so these factors can be used as input features of the classification model. A total of 29 parameters were selected to construct a dataset for classification.
4.5. Model Training
The constructed dataset was divided into training and testing sets by the ratio of 7:3. The ResNet model was constructed for classification training.
The hyperparameters were also determined by the random search algorithm as follows: the model uses four residual blocks, and is optimized using the Adam optimizer. The loss function is the categorical cross-entropy, the batch size is 32, the initial iteration number is set as 1500 and the initial learning rate is set as 0.01. To speed up the training, a learning rate dynamic decay strategy was employed to accelerate convergence and the EarlyStopping method was used to stop the iterations before overfitting and terminate training (i.e., stop training when the accuracy is not increasing within 100 iterations).
The training results show that the accuracy, precision and recall of the algorithm are 0.993, 0.993 and 0.925, respectively. The trained ResNet algorithm was applied to the slide deformation dataset, and the deformation state classification results are shown in
Figure 17.
The above results show that the K-means-ResNet method can identify the deformation state of a landslide accurately. According to the deformation state, we can make a landslide warning.
4.6. Validation
To evaluate the reliability of the proposed model, we processed the dataset by two neural networks, MLP and LeNet, and compared their results with our results.
The hyperparameter search process was the same as in the previous example.
The MLP model uses three hidden layers. We set the dropout as 0.5. Adam optimizer was used to optimize the network. The Relu function was chosen for the activation function, and categorical cross-entropy was used for the loss function. The batch size was 32, the initial learning rate was 0.01 and the initial iteration number was 1500.
The LeNet model uses five hidden layers and the Adam optimizer to optimize the network. The loss function is categorical cross-entropy. The batch size is 32, the initial learning rate is 0.001 and the initial number of iterations is 1500.
To speed up the model training, the learning rate dynamic decay strategy and EarlyStopping (i.e., stop training when the accuracy is not increasing within 100 iterations) were used to stop iterations before overfitting and terminate training.
The evaluation of the training results in
Table 5 shows that the ResNet algorithm outperformed the MLP and LeNet algorithms.
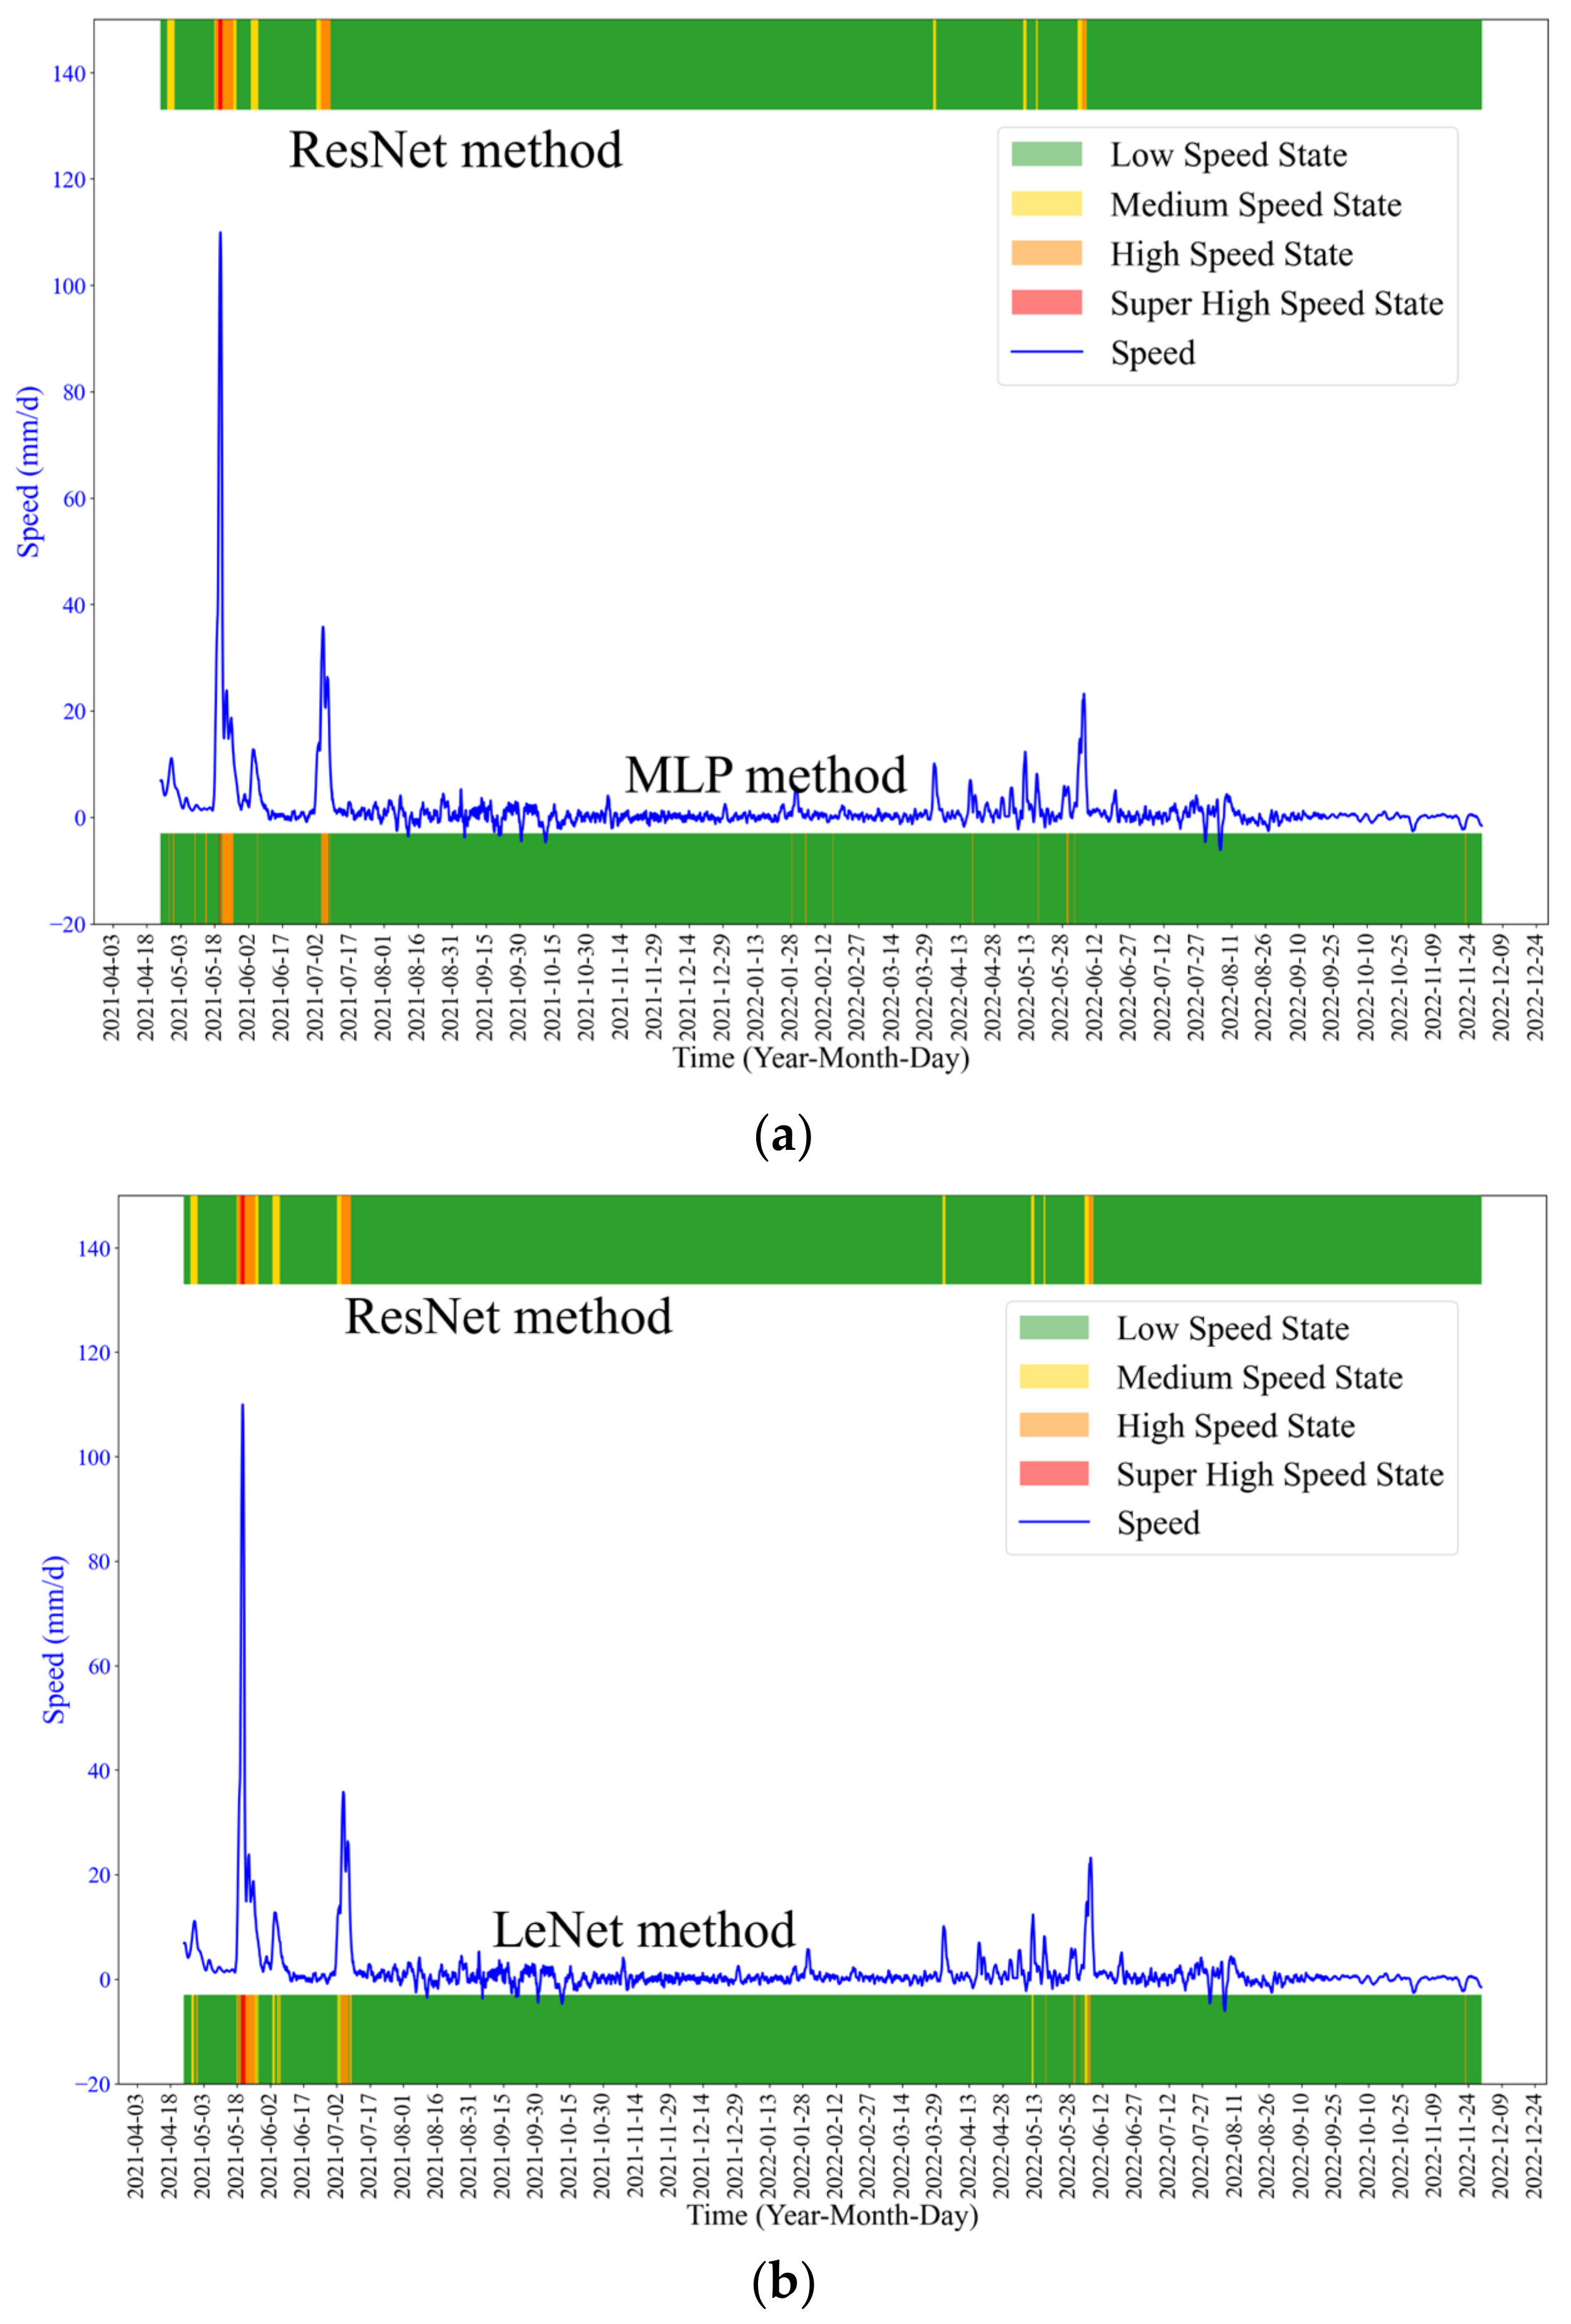
The early warning results of MLP and LeNet algorithms are shown in
Figure 18. The results show that the ResNet method performs better in early warning than MLP and LeNet methods.
We also compared the K-means-ResNet model-based warning with the landslide warnings obtained by the conventional warning method from [
17], and the thresholds are listed in
Table 6.
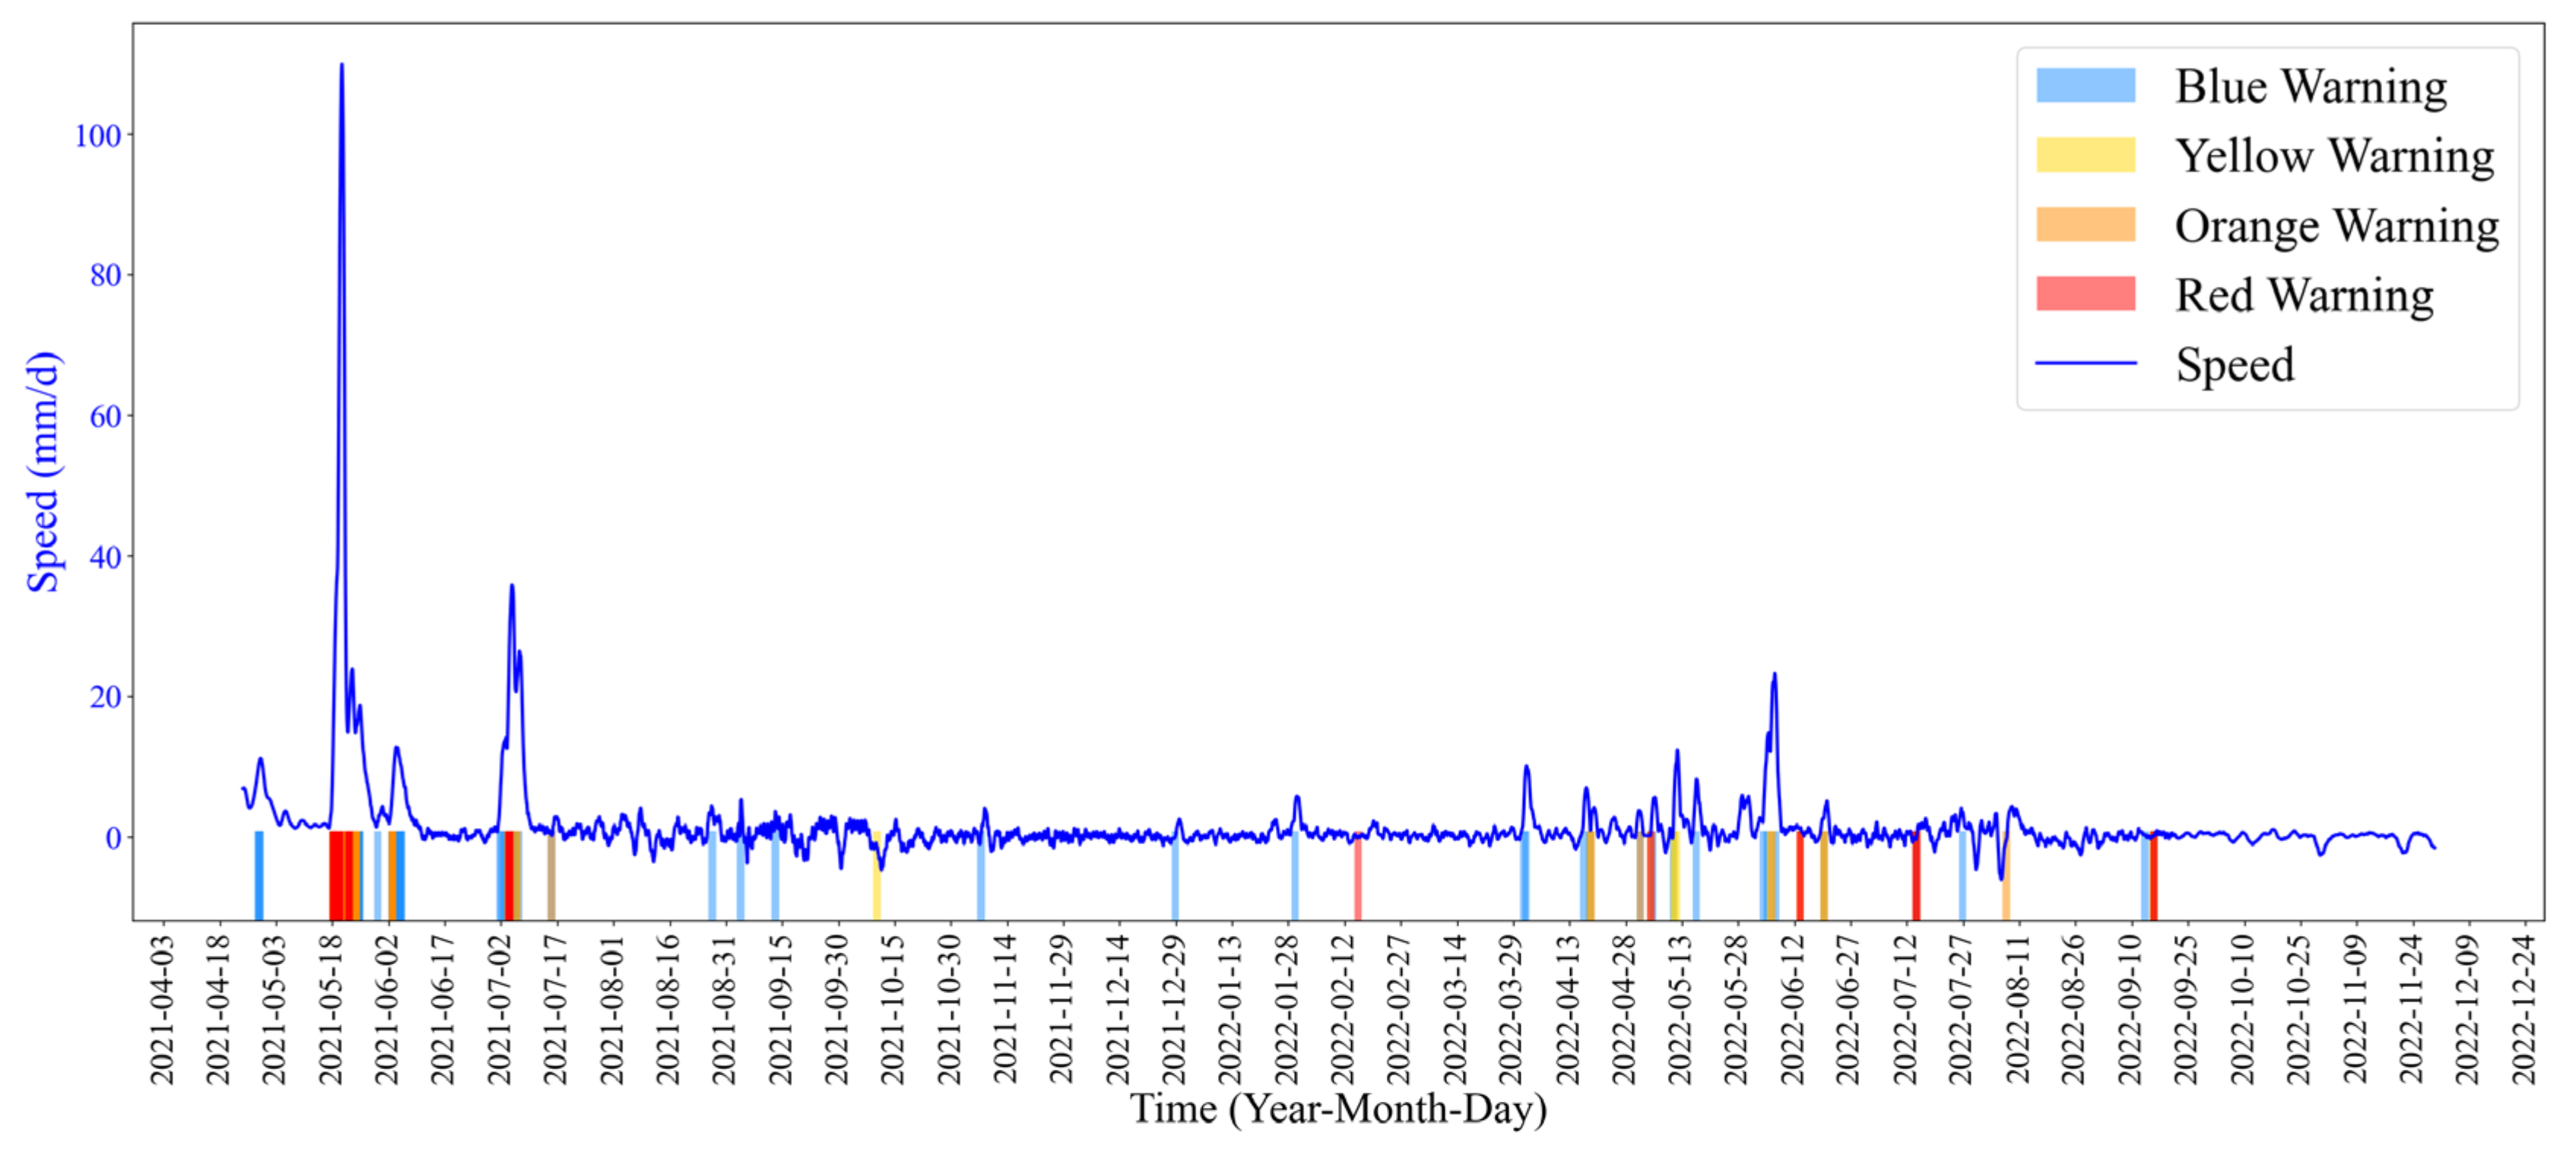
>The warning results of the conventional warning method are shown in
Figure 19. There are some false warnings from 16 August 2021 to 28 May 2022. After 28 May 2022, the landslide deformation rate increased, and intensive warnings were generated. However, when the landslide deformation slowed down, there were still many missing alarms and false alarms.
The proposed early warning method based on the K-means-ResNet model can effectively reflect the deformation state of landslides and reduce false alarms. In addition, this method does not need to determine the threshold value or dynamically adjust the threshold value based on experience, which is necessary for the traditional threshold warning method.
5. Discussion
Traditional landslide warnings are usually decided by thresholds. However, the complex landslide generation factors, slope internal structure and physical properties lead to great difficulty in determining an appropriate threshold. Besides, the threshold requires dynamic adjustment during the monitoring process. These warning algorithms are semi-empirical. Improper thresholds will lead to missing alarms and false alarms.
In this study, a landslide warning algorithm based on K-means-ResNet is proposed for rapid and automatic identification of landslide acceleration. This method includes the steps of subsequence construction, feature extraction, data clustering, feature screening and landslide state classification. The method was validated on the Zhongma landslide in Guangxi Province and the Shangmao landslide in Hunan Province, China. The results show that the proposed algorithm can quickly and accurately identify the landslide acceleration and deformation process, and improve the accuracy and efficiency of early warning.
Compared with the traditional warning methods based on thresholds, the proposed algorithm has the following two advantages. First, the proposed algorithm determines the landslide state quantitatively, which is more objective and reliable than traditional threshold-based methods. Second, traditional early warning methods only rely on displacement value. However, single sensors are highly susceptible to environmental influence, leading to serious noise. The proposed algorithm takes both the displacement value and disaster-causing factors as the input to the model to identify the landslide status, effectively improving the accuracy and reliability of early warning.
The algorithm also has some limitations. First, the algorithm needs sufficient data for model training, so it cannot perform early warning in the early stage and cannot cover the whole monitoring cycle. Second, model training needs to collect data and the model parameters need to be optimized, increasing the complexity of the algorithm. Finally, the deep learning model requires training samples. The samples are generated from the original data through a tedious process. The original data are usually uneven, which reduces the classification accuracy.
In summary, the proposed early warning method can effectively and reliably identify the landslide deformation state and realize the landslide warning. The deep learning technique is the first time used in the field of landslide warning, so further research work is needed, such as dataset production, feature selection and model interpretability.
6. Conclusions
This study proposes a landslide early warning method based on the K-means-ResNet classification model. The effectiveness of the model was assessed by applying it to the Zhongma landslide and Shangmao landslide. The following conclusions are obtained.
The proposed method uses K-means method to categorize and analyze the landslide deformation data and uses gray correlation analysis to select the corresponding input features, classify the landslide state by ResNet algorithm and finally achieve the early warning.
The K-means-ResNet model is applied to the Zhongma landslide and Shangmao landslide. The results show that the landslide deformation can be classified into four states, which are low speed state, medium speed state, high speed state and super high speed state. The accuracy, precision and recall of the early warning are better than those of the MLP and LeNet models. The method was also compared with the traditional landslide threshold warning method, and the results show that this method reduces the false alarm and does not need to rely on the threshold parameters determined by the expert experience.
The proposed K-means-ResNet model uses the K-means algorithm to cluster landslide states. Future research can take relevant geological and geotechnical information into consideration to classify the states of landslides, establish more accurate pre-training datasets and improve the accuracy of landslide warning. In addition, the landslide state is changing, so analyzing the influence of triggering factors on landslides is difficult. The model in this study could adaptively learn the relationship between rainfall and deformation by deep learning. Future work can be focused on exploring the interpretability of the features learned by the ResNet algorithm, classifying landslide state and warning by both internal and external factors and establishing a more accurate landslide warning method to further improve landslide warning.


 ,
, 


