Featured Application
The proposed models’ validation will enable the proper use of ultrasonic simulation for designing NDT methods for embedded crack detection and characterization.
Abstract
Ultrasonic Non-Destructive Testing (NDT) methods are broadly used for detection and characterization/imaging of cracks. Simulation is of great interest for designing such NDT methods. To model the ultrasonic 3D response of a crack, ultrasonic high frequency asymptotic (semi-analytical) models (such as the Physical Theory of Diffraction—PTD) are known to provide accurate predictions for most classical NDT configurations, and 3D numerical models have also emerged more recently. The aim of this paper is to carry out for the first time an experimental and theoretical comparison of 3D models for ultrasonic NDT of embedded cracks in 3D configurations. Semi-analytical models and a hybrid 3D FEM strategy—combining high-order spectral Finite Elements Method (FEM) for flaw scattering and an asymptotic ray model for beam propagation—have been compared. Both numerical validations and comparisons between simulation and experiments prove the effectiveness of PTD in numerous configurations but validate and demonstrate the improvement provided by the 3D hybrid code, notably for small flaws compared to the wavelength and for shear waves.
1. Introduction
Nowadays, simulation plays a key role in the design and demonstration of performances of Non-Destructive Testing (NDT) methods. Conventional ultrasonic inspection methods have been used for the NDT of cracks for several decades. The analysis of the echoes generated by cracks, generally specular or diffraction ones, can lead to their detection or imaging. To simulate the ultrasonic response of a crack during an ultrasonic inspection, system models [1,2] have been devised. Such models consist of modeling the propagated beam, its interaction with scatterers and the reception by a probe.
Historically, semi-analytical models were first studied to model flaw scattering. Two classical ones were revisited in elastodynamics from the end of 1970s: the Kirchhoff approximation (KA) [3] and the Geometrical Theory of Diffraction (GTD) [4], which have complementary areas of validity. KA enables handling reflections from planar or multifaceted cracks, volumetric voids [5] and impedance interfaces [6,7]. GTD is preferred to KA for simulating scattering by crack edges (notably for TOFD configurations [8,9]) but fails in the near-incident and specular reflection directions (shadow boundaries). A GTD solution has also recently been proposed for wedge scattering [10,11,12]. Several system models based on KA [3] or GTD [13,14] were conceived first for 2D configurations and then developed in 3D for KA [1,5] and for GTD [15], then using an incremental Huygens model [16]. Strategies were then created to take into account both reflection and edge diffraction. Recently, an approach based on the Huygens–Fresnel diffraction theory has been proposed [17] to evaluate the signals diffracted by the edges, but it is equivalent [18] to KA and limited to 2D time-of-flight diffraction (TOFD) configurations; it also cannot describe head waves [19,20]. Uniform corrections of GTD which are able to predict a spatially uniform scattered field has led to recent developments for elastic waves. An elastodynamic version of the Uniform Asymptotic Theory (UAT) [21] was first proposed [4]; however, the UAT requires an artificial extension of the scattering surface and additional costly tracing of fictitious rays reflected on this extended surface. The elastodynamic Uniform Theory of Diffraction (UTD) [22] has also been established for the scattering from a stress-free half-plane and represents a good alternative even if leading to small differences with UAT. Finally, an ultrasonic system model accounting for both reflection and diffraction has been proposed for 3D crack-like flaws in 3D configurations [23]. It is based on the Physical Theory of Diffraction (PTD), initially developed in electromagnetism [24] and extended to elastodynamics [25]. For a half-plane, PTD has been shown to be identical to UAT at the used leading order. Moreover, the region of the model’s validity has been extended [26] to cover some transition zones surrounding critical rays, where the shear diffracted waves and head waves interfere. Important efforts have been made to propose an analytical modelling of some head waves contributions, notably lateral waves in the TOFD configuration [27,28]: for planar surfaces, lateral waves are head waves propagating along such surfaces, and recent advances have been obtained in their modelling [29,30,31,32,33]; for complex or cylindrical surfaces, lateral waves can include bulk wave contributions [34]. The PTD-based system model [26] can be considered as the most sophisticated and valid semi-analytical approach existing at the present date.
Nevertheless, the ultrasonic high frequency asymptotic models, despite providing accurate predictions in a wide range of situations, have a limited domain of validity identified through various experimental validation campaigns [35,36,37]: they can fail at predicting responses from defects in some complex configurations when creeping and bulk head waves or caustics occur. In the same way, their precision drops for defects with characteristic dimension of the order of the wavelength. To overcome these limitations, the use of hybrid models such as the 2D CIVA ATHENA model [5] combining numerical and asymptotic methods has been demonstrated as an effective strategy. However, the computational cost of the numerical solver remains a crucial issue for 3D simulations. Different numerical codes [38,39,40] have been devised for simulating flaw scattering but have limited performances for 3D problems. In this paper, we use a 3D hybrid model [41,42], coupling FEM (Finite Element Method) for flaw scattering and a ray model for beam propagation. In this model, the numerical parameters are set automatically, and the use of high-order spectral elements [43,44] and techniques of domain decomposition ensures high numerical performance.
A comparison of analytical, semi-analytical and numerical techniques has been performed for 2D/3D ultrasonic field modeling [45]. For flaw scattering simulation, different analytical approximations (such as GTD, UAT, UTD, KA and PTD) have been compared for the wedge scattering problem in acoustics [46] or for the rigid half-plane problem in elastodynamics [25]. When modelling a complete inspection with both beam propagation and flaw scattering, a comparison between an analytical model (integral equation [47]) and two numerical (COMSOL FEM and finite differences) models has been recently carried out in some 2D ultrasonic NDT configurations [48]. A comparison between the semi-analytical PTD model and the hybrid 2D numerical model CIVA ATHENA model has also been studied in detail for 2D configurations [26]. Preliminary numerical comparisons between PTD and the 3D hybrid FEM model have been reported in two simple 2D configurations [42]. To our knowledge, no study has yet compared the most advanced semi-analytical (as PTD) and numerical 3D crack ultrasonic NDT models in 3D configurations and their results with experience. The models’ comparison proposed here relate to embedded planar defects inspected in 3D configurations with a special interest in defect characteristic lengths of the order of the wavelength for which asymptotic models are no longer valid. The models involved are the semi-analytical (GTD, PTD) and the hybrid numerical FEM models. We also present comparisons between simulations and experiments for the models’ validation. The analytical and numerical simulation methods are briefly recalled in Section 2 of this paper; then, numerical (Section 3) and experimental (Section 4) validations are described for 3D-embedded flaws.
2. Simulation Methods
All the simulation methods used are integrated in the CIVA NDT platform [49] for simulation [2] and analysis. The semi-analytical models (GTD, PTD) have been widely described in Refs. [15,26]. The Physical Theory of Diffraction (PTD) combines GTD (ray theory) and Kirchhoff Approximation (KA—integral method) and applies to arbitrary large scatterers. PTD [25,26] replaces the Kirchhoff edge diffraction contribution by GTD, the asymptotical approximation of the edge problem solution. The PTD scattered field is the sum of the Kirchhoff scattered field and a modified GTD field, whose diffraction coefficient is the difference between the GTD and Kirchhoff edge diffraction coefficients. Finally, this summation enables building a PTD total field which is spatially uniform, contrary to GTD, which leads to several singularities (shadow boundaries).
The 3D hybrid FEM model is a coupling method [42] between an FEM scattering model with a ray-based asymptotic field model (the CIVA pencil method for field computation [2]). This hybrid methods consequently consists of simulating the propagation field until the defect vicinity employing the CIVA pencil method [50] and then the scattering of this field from the defect thanks to a numerical approach. The flaw’s echographic signal is finally obtained by the way of the Auld’s reciprocity principle [51], which expresses it as a combination of fields from the emitter and receiver with and without a scattering defect. The numerical solver is built upon a “dedicated” high-order spectral finite element method [43,44], which enables us to address 3D configurations, and second, the constitution of the numerical parameters are automatically deduced from the inspection configuration. A theoretical description of the hybrid FEM method is given in Appendix A. Some additional details (meshing around the defect, numerical scheme, etc.) can be found in [41,52]. Different calculation strategies adopted in the CIVA 2017 release used in this paper depend on the defect’s location (embedded or surface breaking) and on the sensibility area defined by the user to reduce the computation time. For breaking flaws, the coupling reciprocity integral [51] is carried out on both the flaw and component surfaces inside the sensibility area (in red in Figure 1b).
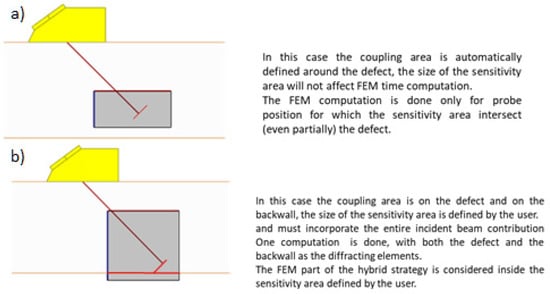
Figure 1.
Different coupling strategies used in the CIVA hybrid FEM model for (a) embedded and (b) breaking cracks.
Finally, the simulation methods utilized here both use the same ray-based asymptotic field model (the CIVA pencil method for field computation [2]) to simulate wave propagation, but they differ in the method they employ to model flaw scattering. The model based on GTD or on the Physical Theory of Diffraction (PTD) is a semi-analytical high frequency model, whereas, for the hybrid CIVA-FEM model, spectral finite elements (using high order polynomials) are used.
For contact probes, only longitudinal waves are taken into account in the probe by the simulation, and since a coupling gel is used in experiments to make a bond between the probe and the specimen, a solid–solid sliding interface model is used for transmission coefficients at the specimen interface.
3. Numerical Validations of 3D Embedded Flaws Simulations
In a first step prior to this study, numerical validations were performed in a wide range of classical 2D NDT configurations by comparing simulations from the proposed hybrid FEM method, the asymptotic PTD model [10] and another coupling method (2D CIVA ATHENA). Such numerical validations showed that the PTD approach, which has a lower computation time, breaks downs for small flaw heights compared to the wavelength as shown in [10]. Preliminary comparisons between PTD and hybrid FEM have been reported by some of the present authors in two simple 2D configurations [42] and lead to the same conclusions. The hybrid FEM method appears thus be a solution to overcome the limitation of analytical models for small flaws.
The proposed 3D hybrid FEM model is evaluated here by comparing numerically it with existing analytical 3D models as the 3D PTD model. In these validations, crack inspections in ferritic steel components are simulated using several different configurations: TOFD [28] configurations, which are usually used to detect and characterize cracks from their edge diffraction echoes, and pulse echo configurations with various incidences to study both the reflection (normal incidence) and diffraction (oblique incidence) from the crack. The influence of the flaw height and extension is also evaluated notably for small sizes to determine the improvement provided by the FEM model in 3D configurations. For the simulations, the following mechanical parameters have been considered: longitudinal and shear sound velocities of 5900 and 3230 m/s and a density of 7.9 g/cm3. All the input data for simulation are exactly the same for all the used models. These data describe the inspection configuration [1]: the characteristics of the component, the used probes, the inspection scanning, the inspected flaws and the simulation settings.
3.1. Longitudinal Waves
P waves are first considered. The first TOFD configuration is described in Figure 2a. The specimen includes a 5 mm (or 0.5 mm) high rectangular crack with a varying extension (perpendicular to the plane of Figure 2a). It is inspected using P45 waves in TOFD mode at 2.25 MHz.

Figure 2.
(a) Inspection of a 5 mm high (height represented by a red segment) and varied extent rectangular crack inspected using P45 waves in TOFD mode at 2.25 MHz; Echo magnitude versus the flaw extension (b) for the 0.5 mm high crack and (c) for the 5 mm high crack.
The first numerical comparison of models consists in studying the effect of the flaw extension on maximal flaw echo amplitude (Figure 2b). For both the 0.5 mm and 5 mm high cracks, very important differences are observed between the FEM and PTD models in terms of maximal echo amplitudes. Such differences are more important for the smallest height. Nonetheless, for the 5 mm height differences are not negligible even for large extensions for which the echo magnitude tends to stabilise (25 mm is close to the beam width). For this 5 mm height, the echoes from the top and bottom edge are well dissociated, and the amplitude noticeably oscillates as a function of the extension for the FEM model. These oscillations may be due to interference between waves scattered from each edge and their corners, the latter being better predicted by FEM than by the PTD model. The PTD model used here relies on the incremental Huygens model to account for the finite edge extension [16,26,53,54].
The second numerical comparison in the previous P45° TOFD configuration (Figure 2a) consists of studying the effect of the flaw height on maximal flaw echo amplitude for the 25 mm extent crack (extension large enough to include the beam width). The flaws’ heights from 0.5 to 5 mm are studied, which correspond to adimensional wave number 0.6 < ka < 6. Again, significant differences are observed in Figure 3a between the FEM and PTD models in terms of maximal echo amplitudes, especially for the smallest heights. Whereas the echo amplitude is quite constant versus the height for the PTD, the FEM model predicts higher amplitudes when the scattered waves are mixed for small heights.
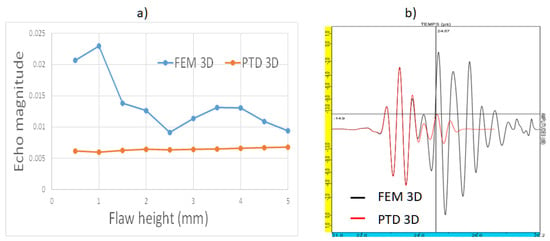
Figure 3.
Inspection of a 25 mm extent rectangular crack inspected using P45 waves in TOFD mode at 2.25 MHz: (a) Echo magnitude versus the flaw height; (b) Ascans simulated both by the 3D FEM and PTD models for the 5 mm high crack.
By comparing the Ascans simulated by both the 3D FEM and PTD and generated by the 5 mm high and 25 mm extent rectangular crack (Figure 3b), the two models lead to a similar prediction from the top edge response, but PTD provides an underestimation for the bottom edge echo (which yields the maximal amplitude from the flaw). This is due to the use of P45° waves and the presence at the 38° inspection angle of a minimum predicted by GTD for the amplitude of the bottom edge echo versus the angle of observation in TOFD. As shown in [55], GTD and CIVA ATHENA (hybrid FEM model) both predict a minimum, but it is much more pronounced with GTD. Consequently, the difference of prediction of this minimum by the two models explains the gaps obtained in terms of echo magnitude even for large flaw heights in TOFD P45°. The FEM model also predicts later contributions, notably due to the Rayleigh waves propagating on the flaw surfaces.
The previous section concludes that the P45° waves TOFD configuration exhibits differences between PTD and FEM predictions due to the presence of a minimum in the directivity pattern for a particular observation angle. In the next P60° waves TOFD configuration, the PTD and FEM models are expected to lead to similar results for large flaws. When comparing the Ascans simulated both by the 3D FEM and PTD models using inspection at 60° still at 2.25 MHz (configuration shown in Figure 4a), the two models give rise to similar echoes for both the top and bottom edges (Figure 4b). The FEM model also predicts later contributions. The amplitude difference between the 3D FEM and PTD models observed using P45 waves in TOFD is not reproduced for P60 waves.

Figure 4.
(a) Inspection of a 25 mm extent rectangular crack of varying height using P60 waves in TOFD mode at 2.25 MHz. (b) Superimposition of Ascans simulated both by the 3D FEM and PTD for the echoes generated for the 5 mm high crack. (c) Echo magnitude versus the flaw height.
In the previous configuration with P60 waves at 2.25 MHz, another validation consists of studying the effect of the flaw height on maximal flaw echo amplitude. The flaws’ heights from 0.25 to 10 mm are studied, which corresponds to 0.3 < ka < 12. For small heights (especially for heights less than 1 mm; ka < 1.2), significant differences in terms of echo magnitude are observed between the two models.
Comparisons of the Ascans simulated by 3D PTD and 3D FEM (Figure 5) show that according to finite elements, the two different echoes arising from the top and bottom edges are relatively well dissociated for heights higher than 5 mm (ka > 6). From this height, these two echoes are very well simulated by PTD, but the later Rayleigh waves are nevertheless not taken into account in the PTD model. For small heights, important differences are observed between the two models in terms of waveforms, which is most likely due to primary edge diffracted waves and secondary diffractions of multiply reflected Rayleigh waves (not modelled in the PTD model) having close time of flights.
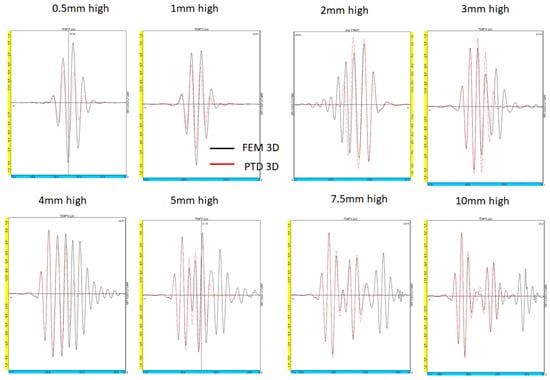
Figure 5.
Inspection of a 25 mm extent rectangular crack of varied height inspected using P60 waves in TOFD mode at 2.25 MHz: Ascan versus the flaw height.
3.2. Shear Waves
3.2.1. Immersion Pulse Echo Mode: S45° Waves—Various Incidences on the Flaw
Figure 6a describes the first validation case in the pulse echo mode involving defects of various heights, a fixed 0.5 mm extension and of an arbitrary tilt angle α. A 12.7 mm diameter immersed transducer positioned 20 mm above the component generates transversal 45° waves at 5 MHz.
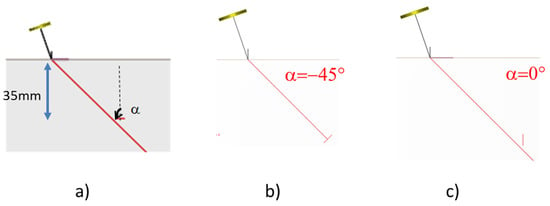
Figure 6.
(a) pulse echo configuration with the SV45° wave at 5 MHz of a rectangular defect of varying height (5 mm here—red segment), 0.5 mm extent and various tilts; (b) α = −45°, specular reflection configuration; (c) α = 0°, classical configuration of a vertical flaw.
The probe is not very divergent, and the flaw is in the area of the maximal field amplitude (33–40 mm depths). The flaw extension is small (0.5 mm extent), which will enable us to study the 3D effects of the flaw size in configurations unfavourable to analytical models such as PTD.
In Figure 7, the 3D FEM and PTD models predict the flaw echo amplitude versus the tilt angle α for three different flaw heights: 5, 1 and 0.5 mm (ka ~ 2.4 both in height and extension in the latter case). An improvement consisting in a smoothing of PTD coefficients near critical angles has been devised and described in [26]: it is referred to as “PTD3D critical smoothing”. The results referred to as “PTD3D” were obtained without this treatment, using a GTD code based on previous works [56]. Its response exhibits peaks around critical angles.

Figure 7.
A planar component containing an embedded rectangular flaw of 0.5 mm extent and of height: (a) 5, (b) 1 and (c) 0.5 mm. Comparison of FEM and PTD (standard or with smoothing around the critical angle) models.
For specular reflection, PTD generally leads to a relatively good approximation and to simulated results close to that of FEM even for small heights. Nonetheless, for the smallest height (0.5 mm), the PTD response versus the tilt angle exhibits two local maxima, contrary to FEM. This suggests that some phenomena are better predicted by the numerical model than by PTD, possibly due to interferences between the waves reflected from the flaw surface and those diffracted from the contour.
The difference between PTD and FEM can be significant away from the specular direction, especially beyond the critical angle. This is due to head waves not being accounted for in the PTD model presented here. Consequently, the 3D extension of the flaw can be assumed to be a source of inaccuracies for the PTD model, possibly due to quantitative errors in the PTD prediction of corner diffractions.
PTD differs most significantly from the FEM reference—for specular reflection when the flaw height or extent is small—near and above the critical angle for S waves (head waves) and small heights.
3.2.2. Contact Pulse Echo Mode: S45° Waves—Vertical Flaw
The next numerical comparison case involves the inspection of a vertical rectangular crack inspected using SV45 waves in pulse echo mode at 2.25 MHz (Figure 8a). The used probe emitting at 2.25 MHz is a contact circular planar probe of 6.35 mm diameter. The first numerical comparison consists in studying the effect of the flaw extension on maximal flaw echo amplitude for the 5 mm high crack (Figure 8b). For small extensions (<4 mm), some amplitude oscillations occur, probably due to interferences between waves scattered from both the edges and the corners. Important differences are observed between the FEM and PTD models in terms of maximal echo amplitudes for all extensions. It is unexpected that differences are obtained even for large extensions (25 mm ~ beam width) in the case of a 5 mm high crack corresponding to a large dimensionless factor ka ~ 11.25. In order to analyze the previous differences, the Ascans simulated by 3D FEM and 3D PTD are plotted in Figure 9 for the 40 mm extent (the largest extension in Figure 8b) and 5 mm high rectangular crack both at 2.25 MHz (corresponding to the case studied in previous Figure 8) and also at 5 MHz. At 5 MHz, the Ascan simulated by 2 D FEM CIVA ATHENA is also provided. The first echo chronologically observed in Figure 9a,b is obviously the top edge diffracted wave. Echoes generated by bulk wave diffraction from the bottom edge (after 40.5 µs) and by later waves can be better distinguished at the higher frequency (5 MHz). A head wave arrives at almost the same time as a wave diffracted from the bottom edge: it corresponds to the diffraction at the top edge of the incident S wave path into a P creeping head wave, which is then rediffracted into a bulk S wave at the bottom tip (see Figure 9c), and its time of flight, which can be theoretically calculated by ray theory, is close to that of the bottom edge diffraction (as explained later using Table 1). Chronologically, the first wave arriving after the bottom edge diffracted wave is a bulk diffraction of a Rayleigh wave. When the beam hits the top tip, a Rayleigh wave (R1) is generated. It propagates along each crack face towards the opposite tip. Upon reaching the bottom tip, R1 sheds the bulk S5 wave. The path of this Rayleigh wave then diffracted in the bulk corresponds to that of the so-called S5 wave, which is due to a secondary diffraction (see its path drawn in Figure 6 of Ref. [26]).

Figure 8.
(a) Inspection of rectangular crack using SV45 waves in Pulse Echo mode at 2.25 MHz (circular planar probe of 6.35 mm diameter), (b) of 5 mm height and varying extension and (c) of a 34 mm extension and varying height.
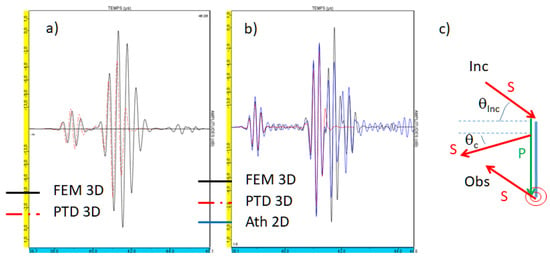
Figure 9.
Inspection of a 40 mm extent and 5 mm high rectangular crack inspected using SV45 waves in Pulse Echo mode (circular plane probe of 6.35 mm diameter); Ascans simulated by 3D FEM and 3D PTD: (a) at 2.25 MHz (b) at 5 MHz with also the normalized Ascan modelled by 2D FEM Civa/Athena. (c) S head waves diffracted from a crack (in blue) under 45° incidence: the S wave shed by the bottom tip irradiated by the P creeping wave coming back to the probe at 45° direction and the S head wave radiated during the propagation of the P creeping wave along the crack surface.

Table 1.
Analysis of Ascans simulated by 3D FEM and 3D PTD of the inspection of a 40 mm extent and 5 mm high rectangular crack using SV45 waves in Pulse Echo mode (circular planar probe of 6.35 mm diameter) at 5 MHz: time of flight of the different waves theoretically calculated using ray theory or obtained after 3D FEM simulation; PTD amplitude versus 3D FEM (dB).
When considering the time of flight of the top edge diffracted wave as the time origin, the time of flight of the different waves can be theoretically calculated using ray theory and compared to that obtained after 3D FEM simulation (see Table 1).
The comparison of the times of flight shows that the second echo chronologically observed corresponds to the bottom edge diffracted wave interfering slightly with the head wave. Such a head wave is of lower amplitude since it decreases quickly during its propagation along the flaw surface and since the incidence is not critical (in Figure 9c, θinc = 45° whereas θc = 33° for steel). The third echo corresponds to the secondary Rayleigh wave diffraction S5. PTD predicts correctly the amplitudes of the primary bulk waves diffracted by the two edges but the PTD model does not simulate the secondary Rayleigh wave diffraction S5. It is this latter wave which leads to the more important amplitude in the 3D FEM Ascan.
At the lower frequency of 2.25 MHz, the secondary Rayleigh wave diffraction echo coalesces with the bottom edge diffracted echo, which explains the difference of simulated maximal amplitudes between PTD and FEM shown in Figure 8b for large extensions.
After studying the effect of the flaw extension, a second numerical comparison (Figure 8c) consists of studying the effect of the flaw height on maximal flaw echo amplitude for the 34 mm extent crack (extension wider than the beam size). For rather small heights (<8 mm), the FEM model highlights oscillations probably due to interferences between waves scattered from the edges, and Rayleigh waves multiply reflected at edges and also to a lesser extent to multiply reflected head waves. For large heights, a difference of 2 dB is observed between the two models. The maximal echo amplitude slightly decreases with height due to the decrease in the field with the increasing distance from the bottom edge.
4. Experimental Validations
In a second step of validation, experimental measurements have been carried out on ferritic steel components. First, TOFD inspections of large flaws involving 3D effects (sometimes very important) have been considered.
4.1. Inspection of Large Flaws
Several notches and holes have been fabricated in a planar specimen (Figure 10a). In order to study the influence of the orientations of both probes and flaws, two 6.35 mm diameter probes emitting 45° P-waves at 2.25 MHz have been positioned in a TOFD configuration with a 60 mm Probe Center Separation and rotated from the 0° skew angle to the 34° skew angle. Figure 10b,c present a typical case of the 11° skew.

Figure 10.
(a) A planar component containing disoriented backwall breaking flaws and a 2 mm diameter SDH; the TOFD configuration with the 11° probes’ skew: (b) top view and (c) side view showing the flaw used for simulating the top edge of the 30° disoriented notch.
Measurements have been carried out on a rectangular 0° flaw and three defects (with vertical disorientation of 10, 20 and 30° for the top edge) and calibrated against a 2 mm diameter SDH. The resulting experimental B-Scan is shown in Figure 11a. The variation in the amplitude of the echo from the top tip (equivalent to that of an embedded flaw) with the vertical disorientation is displayed in Figure 11b. The results simulated by different models are compared in terms of echo amplitude: (1) an older model based on the so-called 2.5D GTD [5], which involves the projection of the incoming and scattered wave vectors on the plane normal to the flaw edge and 2D GTD coefficients related to these projections, (2) 3D PTD model and (3) the hybrid 3D FEM model.
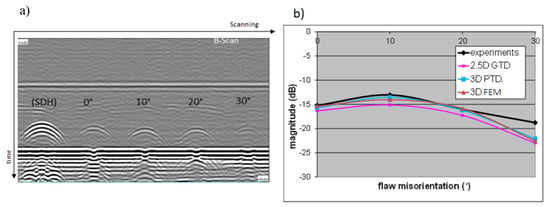
Figure 11.
(a) Experimental B-scan obtained when scanning the side drilled hole (SDH) and the three defects (with vertical misorientation of 10° to 30° for the top edge); (b) validation of the 2.5D GTD, 3D PTD and the hybrid 3D FEM models against the measured echoes from the top tip of misoriented backwall breaking flaws.
The differences between the 3D PTD model, the hybrid 3D FEM model and experimental data are less than 1 dB, except for the 30° misoriented flaw, for which the signal-to-noise ratio is low (see Figure 11b). Note that the 3D PTD-based model provides a slight improvement over the 2.5D GTD model in that configuration.
In the view of studying more important 3D effects, a second experimental validation has been performed to evaluate the effect of skew flaw angle on edge diffraction amplitude. Tests have been carried out on a planar rectangular backwall breaking flaw (10 mm high and 40 mm wide) using a pair of transducers (2.25 MHz, 45° longitudinal waves, 6.35 mm diameter) in contact mode. The probes have been positioned in a TOFD configuration with a 60 mm Probe Space Center and with flaw skew angle varying from 0° to 70° (Figure 12a).
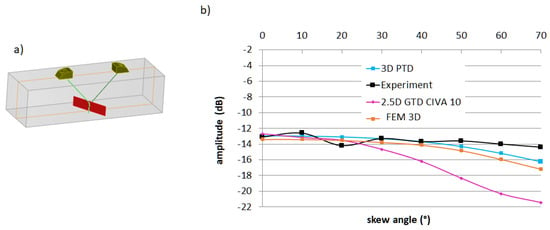
Figure 12.
(a) TOFD configuration on a skewed backwall breaking crack; (b) top edge diffraction echoes amplitudes versus skew angle for measure, 2.5D GTD and 3D PTD and FEM simulations.
In Figure 12b, it can be seen that the influence of the skew angle on the measured diffraction echo amplitudes is minor. The 3D hybrid FEM model leads to a good prediction with a maximal disagreement of about 2.5 dB with measure; the 3D PTD also effectively surpasses the older 2.5D GTD model (available in a previous CIVA release), which breaks down for important skew (>40°). It can be noticed that the 3D PTD and hybrid 3D FEM models lead to close results for this configuration involving a flaw of both large height and extension.
The previous experimental validations have thus confirmed that the 3D hybrid method provides in the case of a large flaw a prediction in very good agreement with experiments and also with the other CIVA 3D model (PTD). The hybrid method correctly simulates larges flaws and 3D configurations.
4.2. Inspection of Small Flaws Compared to the Wavelength
Several measurements have also been carried out to evaluate the models validity on cracks with a small height with respect to the wavelength.
The component used for the following experimental validations is described in Figure 13. The thickness of the specimen, which is the depth to be inspected in experiments (see Figure 14b for an example of inspection configuration), is indicated in red in Figure 13.
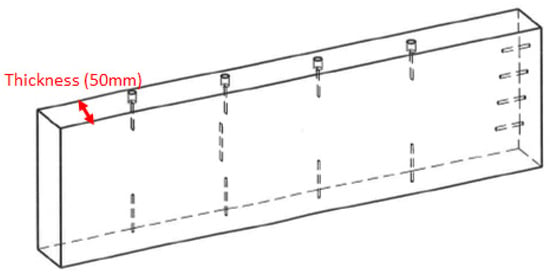
Figure 13.
Specimen used for the following experimental validations.

Figure 14.
(a) Photograph of the setup; (b) TOFD inspection configuration using immersion probes: study of P45 echoes scattered by the flaw surrounded in blue.
The specimen contains the following:
- -
- Four electro-eroded notches (5 mm height × 30 mm extension) and four side-drilled holes (2 mm diameter × 40 mm extension) which are embedded with respective bottom ligaments (distance between notch extremity and backwall) of 5, 10, 15 and 20 mm;
- -
- One backwall breaking notch (not considered in the following validation study);
- -
- Four flat bottom holes on the right side.
The experimental validations presented here concern inspections in immersion of the notch of the highest ligament 20 mm (surrounded in blue in Figure 14b). We privilege validation on the flaw with the highest ligament for a better confidence in the measurements, even though measurements on the other flaws were satisfactory. A 10 mm extent starter hole was pre-drilled before producing the notch of 30 mm extension by electro erosion. To study small notch heights with respect to the wavelength, since the flaw height (5 mm) is relatively important, low frequency transducers (0.5 MHz and 1 MHz) have been employed in experiments. We controlled the measurements reproducibility with an obtained confidence interval of the order ±3 dB owing to the low time resolution of the echoes observed at the low frequencies used (0.5 MHz and 1 MHz). Measurements of side-drilled holes have been carried out to set the input signal in simulation [2].
4.2.1. Inspections with Compressional (P) Waves
The specimen has been first inspected in a TOFD configuration for which the probes radiate P45° waves. Figure 14a depicts the device, and the inspection configuration is described in Figure 14b.
The experimental and simulated Bscans obtained using the 1 MHz probes and the 3D hybrid FEM model in simulation for the notch are provided in Figure 15. The Bscans chronologically display the lateral wave, the echo from the defect and the echo due to the P waves backwall reflection. At this low frequency (1 MHz), we observe a single echo arising from the entire flaw. The experimental and simulated results are very similar: the observed relative amplitudes of all echoes are very well reproduced in simulation. Details on the simulation of lateral wave or backwall reflection in TOFD can be found in [13]. The comparison of maximal amplitude for the flaw echo lead to a simulation/experience gap of −1.6 dB for the 3D hybrid FEM model against −2.2 dB for the 3D PTD model.

Figure 15.
For the TOFD P45° waves inspection at 1 MHz: (a) experimental Bscan; (b) Bscan simulated using the 3D hybrid FEM model in simulation.
The 3D hybrid FEM model provides a slightly better prediction than the analytical model for small flaws and TOFD P waves at 1 MHz.
4.2.2. Inspections with Shear (S) Waves
Since the numerical validations have shown that differences are more important between the numerical and analytical models for shear waves, experimental acquisitions employing transversal waves have also been carried out in pulse-echo and TOFD configurations.
Figure 16a shows the configuration of ultrasonic pulse echo NDT of the embedded planar electro-eroded slots (depicted in Figure 13). Transducers acting in immersion and generating oblique transversal waves at 45° at 0.5 and 1 MHz have been used. The experimental BScan at 0.5 MHz shown in Figure 16b highlights the emission echo versus time in blue, the echo from the entry surface, the response of the four slots and the flat bottom holes. The echogenic signature of the slot include the direct, corner and indirect echoes. All these echoes can be mixed when the slot backwall ligament is low (two slots at left); in that case, the corner echo amplitude is higher.

Figure 16.
(a) Configuration of ultrasonic pulse echo NDT of the embedded planar electro-eroded slots (depicted in Figure 13); (b) experimental True BScan using the immersion probe at 0.5 MHz. The entry surface and backwall of the component are indicated in grey. The slot utilized for validation is shown thanks to the blue arrow, whereas the yellow ellipse indicates the component right corners and the flat bottom holes.
As seen in Figure 17a, the FEM model leads to the better prediction. The gap between PTD and FEM reaches 8 dB at 0.5 MHz, PTD losing its effectiveness for small flaw heights with respect to the wavelength. The prediction of the echo signal also seems better when using the FEM model (Figure 17b,c).

Figure 17.
(a) Disagreements with measurements obtained with the 3D FEM and PTD simulations; (b) Predicted and measured signals with the 0.5 MHz probe; (c) the same as (b) with normalization on the maximal amplitude.
The previous validation confirms that the FEM-based 3D hybrid model could bring an interesting contribution to the simulation of small defects compared to the wavelength for shear waves.
The last experimental validation deals with the S45° TOFD inspection of the specimen at both 0.5 MHz and 1 MHz, whose configuration is schematized in Figure 18a. One can observe chronologically on the experimental BScan of Figure 18b for the 0.5 MHz case the lateral wave, the echo due to the specular reflection on the entry surface, the echo from the defect and the echo due to the S waves reflection on the backwall.

Figure 18.
(a) S45° TOFD immersion inspection of several embedded planar electro eroded slots; (b) experimental BScan obtained when scanning the notches and the flat bottom holes at 0.5 MHz.
The table of Figure 19a presents the comparison with measure of both the 3D hybrid FEM method and the PTD model simulations of the maximal echo amplitude from the validation defect. The 3D hybrid FEM gives rise again to a better prediction in amplitude for the 0.5 MHz case corresponding to the smallest flaw height/wavelength ratio. The measured and simulated normalized Ascans are presented in Figure 19b at 0.5 MHz. One can notice the effectiveness of the simulation which models all these waves of very different natures both in terms of wave forms and of amplitude ratios (notably relatively to the lateral wave and entry surface echoes for the FEM model).
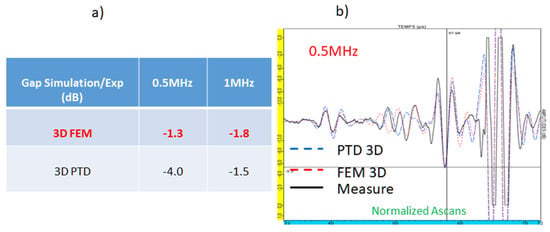
Figure 19.
(a) Gap between simulation and experience for the 3D hybrid FEM model and for the 3D PTD model; (b) Superimposition of the normalized experimental and simulated AScans at 0.5 MHz.
The experimental validation has to be pursued on small flaws notably in 3D configurations, but the first numerical and experimental validations show that the hybrid method provides a much better prediction than analytical models for small flaws (especially with shear waves).
5. Conclusions
An efficient semi-analytical ultrasonic crack measurement model based on the Physical Theory of Diffraction (PTD) and an original hybrid asymptotic/numerical approach based on a high-order spectral-like finite element method were recently proposed in the literature. The numerical comparison of the new 3D hybrid model with semi-analytical models for 3D planar embedded defects has been carried out in this study. It highlights important differences in terms of echo amplitude and waveforms for small flaw heights or extensions and the FEM method seems to provide a more physical description in all configurations by simulating phenomena not or badly accounted for by analytical models as corner diffraction, Rayleigh and head waves. When the crack extension is large, the overall validity range of PTD on the flaw half height —where is the dimensionless wave number—is wider for P waves ( approximately) than for S waves ( approximately). When the crack height is large, a similar criterion (around ka > 5–10) could be approximately found for the overall PTD validity range with the flaw extension. The PTD limitations are more noticeable when edge diffraction echoes are predominant with respect to specular echoes and when head waves occur; PTD can be valid for smaller ka than those given in the criterion in configurations of specular reflection. The existing PTD code could be improved by accounting for the secondary diffractions due to Rayleigh waves.
Experimental validations on notches have first confirmed the good prediction provided by PTD for simulating 3D top edge diffraction of large flaws. Measurements of embedded slots carried out at low frequency have shown that the proposed 3D hybrid method leads to a significant improvement for simulating small flaws compared to the wavelength, notably for shear waves. Similar comparisons have been made for surface-breaking cracks and should be the object of a complementary future publication. In-progress improvements and developments of the 3D hybrid method (notably for handling complex-shaped cracks) also have to be evaluated.
Author Contributions
Conceptualization, M.D.; methodology, M.D.; software, M.D. and V.D.; validation, M.D. and G.T.; formal analysis, M.D.; writing—original draft preparation, M.D.; writing—review and editing, M.D. and V.D.; funding acquisition, G.T. All authors have read and agreed to the published version of the manuscript.
Funding
This research received no external funding.
Conflicts of Interest
The authors declare no conflict of interest.
Appendix A. Hybrid Method Description
In this appendix, a quick description of the hybrid method is given; more theoretical details can be found in [42,52].
The adopted strategy consists of coupling a semi-analytical propagation model to a scattering numerical model. The main principle of such coupling is to use the computation of the incident field from CIVA by applying the beam computation module [50], and to compute the interaction with the flaw using a dedicated scattering model. The echo-response from the defect is then given by the Auld’s reciprocity principle [51], which links healthy (incident field) and damaged (defect scattering) components. Indeed, in the time domain, the elastodynamic response of a defect is expressed as:
where the involved displacements and stresses are defined below, refers to the normal integration surface (surrounding the flaw and depicted in dash blue in Figure A1) and indices E and R denote two states. E quantities correspond to the ultrasonic fields radiated by the emitting probe in the presence of the defect and R quantities are linked to the field radiated by the receiver (used as a fictitious emitter) in healthy components (without flaws).

Figure A1.
The two different states for reciprocity application. For state R, the dashed red line mimics the absence of the flaw.
The total displacement field is defined as follows for each state as the sum of the incident and diffracted fields (similar notations/decompositions are employed for the stresses also involved in Equation (A1)):
In the case of cracks, a stress-free boundary condition applies:
and Equation (A1) reduces to:
The two incident fields involved in the previous Equation (A4) are calculated by the ray-based asymptotic model [50], whereas the diffracted field in state E is obtained by a numerical model.
In the latter calculation, the input data of the scattering model is obtained in an area of interest associated with the flaw (around the defect) using the ray-based beam computation model in the healthy part. The response of the flaw to this incident field is then computed using the numerical dedicated model (high order spectral finite elements).
The advantages of such an approach are that the flaw response does not disturb the incident field calculated by the ray method. In practice, the defect should be at sufficient distance from the component edges to not interact with them. Otherwise, it is necessary to consider the defect and the component edges in the diffraction pattern.
Computational performances are significantly enhanced by the use of high-order spectral finite elements [43,44] defined on hexahedral meshes. This numerical method is widely spread in the community of numerical solutions of transient high-frequency wave propagation problems since they combine the flexibility of finite element methods and the performances of standard finite differences by allowing a fully explicit numerical scheme thanks to a diagonal mass matrix—in the literature, this technique is referred to as the mass-lumping technique. By using a second-order leap-frog time discretization, a fully explicit numerical scheme is finally obtained and transparent boundary conditions are performed using the so-called perfectly matched layer (PML) formulation. Moreover, by allowing high-order polynomials to represent the solutions, the spectral finite elements require less discretization points to reach a given precision, which is a major asset when simulating 3D configurations.
The assumption of embedded crack is utilized to derive an unbounded diffracted field formulation:
The first equation is the fundamental equation of dynamics; the second one corresponds to the boundary conditions applied to the flaw surfaces and transparent boundary conditions are used to model an unbounded domain. Finally, the solution to the diffracted field formulation (A5) is approximated using the numerical model based on high-order spectral finite elements.
References
- Schmerr, L.W.; Song, S.-J. Ultrasonic Nondestructive Evaluation Systems: Models and Measurements; Springer: Berlin/Heidelberg, Germany, 2007. [Google Scholar]
- Darmon, M.; Chatillon, S. Main Features of a Complete Ultrasonic Measurement Model—Formal Aspects of Modeling of Both Transducers Radiation and Ultrasonic Flaws Responses. Open J. Acoust. 2013, 3, 43–45. [Google Scholar] [CrossRef]
- Chapman, R.K. Ultrasonic Scattering from Smooth Flat Cracks: An Elastodynamic Kirchhoff Diffraction Theory; CEGB Report, NWR/SSD/82/0059/R; North Western Region NDT Applications Centre: Manchester, UK, 1982. [Google Scholar]
- Achenbach, J.D.; Gautesen, A.K.; McMaken, H. Rays Methods for Waves in Elastic Solids; Pitman: Boston, MA, USA, 1982. [Google Scholar]
- Darmon, M.; Leymarie, N.; Chatillon, S.; Mahaut, S. Modelling of Scattering of Ultrasounds by Flaws for NDT. In Ultrasonic Wave Propagation in Non Homogeneous Media; Springer: Berlin, Germany, 2009; Volume 128, pp. 61–71. [Google Scholar]
- Dorval, V.; Chatillon, S.; Lu, B.; Darmon, M.; Mahaut, S. A General Kirchhoff Approximation for Echo Simulation in Ultrasonic NDT. In Proceedings of the 38th Annual Review of Progress in Quantitative Nondestructive Evaluation (QNDE), Burlington, VT, USA, 17–22 July 2011; Volume 1430, pp. 193–200. [Google Scholar]
- Lu, B.; Darmon, M.; Potel, C.; Zernov, V. Models Comparison for the Scattering of an Acoustic Wave on Immersed Targets. In Proceedings of the 10th Anglo-French Physical Acoustics Conference (AFPAC), Villa Clythia, Fréjus, France, 19–21 January 2011; Volume 353, p. 12009. [Google Scholar]
- Toullelan, G.; Raillon, R.; Chatillon, S.; Dorval, V.; Darmon, M.; Lonné, S.; Chimenti, D.E.; Bond, L.J. Results of the 2015 UT Modeling Benchmark Obtained with Models Implemented in CIVA. AIP Conf. Proc. 2016, 1706, 190001. [Google Scholar] [CrossRef]
- Raillon-Picot, R.; Toullelan, G.; Darmon, M.; Lonné, S. Experimental Study for the Validation of CIVA Predictions in TOFD Inspections. In Proceedings of the 10th International Conference on NDE in Relation to Structural Integrity for Nuclear and Pressurized Components, Cannes, France, 1–3 October 2013. [Google Scholar]
- Chehade, S.; Djakou, A.K.; Darmon, M.; Lebeau, G. The Spectral Functions Method for Acoustic Wave Diffraction by a Stress-Free Wedge: Theory and Validation. J. Comput. Phys. 2019, 377, 200–218. [Google Scholar] [CrossRef]
- Chehade, S.; Darmon, M.; Lebeau, G. 2D Elastic Plane-Wave Diffraction by a Stress-Free Wedge of Arbitrary Angle. J. Comput. Phys. 2019, 394, 532. [Google Scholar] [CrossRef]
- Chehade, S.; Darmon, M.; Lebeau, G. 3D Elastic Plane-Wave Diffraction by a Stress-Free Wedge for Incident Skew Angles below the Critical Angle in Diffraction. J. Comput. Phys. 2021, 427, 110062. [Google Scholar] [CrossRef]
- Baskaran, G.; Balasubramaniam, K.; Krishnamurthy, C.V.; Rao, C.L. Ray Based Model for the Ultrasonic Time-of-Flight Diffraction Simulation of Thin Walled Structure Inspection. J. Press. Vessel Technol. 2005, 127, 262–268. [Google Scholar] [CrossRef]
- Nath, S.K. Effect of Variation in Signal Amplitude and Transit Time on Reliability Analysis of Ultrasonic Time of Flight Diffraction Characterization of Vertical and Inclined Cracks. Ultrasonics 2014, 54, 938–952. [Google Scholar] [CrossRef]
- Darmon, M.; Chatillon, S.; Mahaut, S.; Fradkin, L.; Gautesen, A. Simulation of Disoriented Flaws in a TOFD Technique Configuration Using GTD Approach. In Proceedings of the 34th Annual Review of Progress in Quantitative Nondestructive Evaluation, Golden, CO, USA, 22–27 July 2007; Volume 975, pp. 155–162. [Google Scholar]
- Darmon, M.; Djakou, A.K.; Chehade, S.; Potel, C.; Fradkin, L. Two Elastodynamic Incremental Models: The Incremental Theory of Diffraction (ITD) and a Huygens Method. IEEE Trans. Ultrason. Ferroelectr. Freq. Control 2019, 66, 998–1005. [Google Scholar] [CrossRef]
- Kolkoori, S.; Venkata, K.C.; Balasubramaniam, K. Quantitative Simulation of Ultrasonic Time of Flight Diffraction Technique in 2D Geometries Using Huygens–Fresnel Diffraction Model: Theory and Experimental Comparison. Ultrasonics 2015, 55, 33–41. [Google Scholar] [CrossRef]
- Lhemery, A. Modèles Théoriques et Études Pratiques En Imagerie Ultrasonore Large Bande; Applications Au Contrôle Non Destructif Des Matériaux Habilitation à Diriger des Recherches; Université Paris VII Denis Diderot: Paris, France, 2000. [Google Scholar]
- Gridin, D. The Radiating near Field of a Circular Normal Transducer of Arbitrary Apodization on an Elastic Half-Space. J. Acoust. Soc. Am. 1999, 106, 1237–1246. [Google Scholar] [CrossRef]
- Gridin, D.; Fradkin, L.J. The High-Frequency Asymptotic Description of Pulses Radiated by a Circular Normal Transducer into an Elastic Half-Space. J. Acoust. Soc. Am. 1998, 104, 3190–3198. [Google Scholar] [CrossRef]
- Lewis, R.M.; Boersma, J. Uniform Asymptotic Theory of Edge Diffraction. J. Math. Phys. 1969, 10, 2291–2305. [Google Scholar] [CrossRef]
- Djakou, A.K.; Darmon, M.; Fradkin, L.; Potel, C. The Uniform Geometrical Theory of Diffraction for Elastodynamics: Plane Wave Scattering from a Half-Plane. J. Acoust. Soc. Am. 2015, 138, 3272–3281. [Google Scholar] [CrossRef]
- Dorval, V.; Darmon, M.; Chatillon, S.; Fradkin, L. Simulation of the UT Inspection of Planar Defects Using a Generic GTD-Kirchhoff Approach. AIP Conf. Proc. 2015, 1650, 1750–1756. [Google Scholar]
- Ufimtsev, P.Y. Fundamentals of the Physical Theory of Diffraction; John Wiley & Sons: Hoboken, NJ, USA, 2007. [Google Scholar]
- Zernov, V.; Fradkin, L.; Darmon, M. A Refinement of the Kirchhoff Approximation to the Scattered Elastic Fields. Ultrasonics 2012, 52, 830–835. [Google Scholar] [CrossRef]
- Darmon, M.; Dorval, V.; Djakou, A.K.; Fradkin, L.; Chatillon, S. A System Model for Ultrasonic NDT Based on the Physical Theory of Diffraction (PTD). Ultrasonics 2016, 64, 115–127. [Google Scholar] [CrossRef][Green Version]
- Chaffai, S.; Darmon, M.; Mahaut, S.; Menand, R. Simulations Tools for TOFD Inspection in Civa Software. In Proceedings of the ICNDE 2007, Istanbul, Turkey, January 2007. [Google Scholar]
- Darmon, M.; Ferrand, A.; Dorval, V.; Chatillon, S.; Lonné, S. Recent Modelling Advances for Ultrasonic TOFD Inspections. AIP Conf. Proc. 2015, 1650, 1757–1765. [Google Scholar]
- Zernov, V.; Gautesen, A.; Fradkin, L.J.; Darmon, M. Aspects of Diffraction of a Creeping Wave by a Back-Wall Crack. J. Phys. Conf. Ser. 2012, 353, 012017. [Google Scholar] [CrossRef]
- Huet, G.; Darmon, M.; Lhemery, A.; Mahaut, S. Modelling of Corner Echo Ultrasonic Inspection with Bulk and Creeping Waves. In 5th Meeting of the Anglo-French-Research-Group; Léger, A., Deschamps, M., Eds.; Springer: Berlin/Heidelberg, Germany, 2009; Volume 128, pp. 217–226. [Google Scholar]
- Zernov, V.; Fradkin, L.; Gautesen, A.; Darmon, M.; Calmon, P. Wedge Diffraction of a Critically Incident Gaussian Beam. Wave Motion 2013, 50, 708–722. [Google Scholar] [CrossRef]
- Fradkin, L.J.; Darmon, M.; Chatillon, S.; Calmon, P. A Semi-Numerical Model for near-Critical Angle Scattering. J. Acoust. Soc. Am. 2016, 139, 141–150. [Google Scholar] [CrossRef]
- Fradkin, L.J.; Djakou, A.K.; Prior, C.; Darmon, M.; Chatillon, S.; Calmon, P.-F. The Alternative Kirchhoff Approximation in Elastodynamics with Applications in Ultrasonic Nondestructive Testing. ANZIAM J. 2020, 62, 406–422. [Google Scholar] [CrossRef]
- Ferrand, A.; Darmon, M.; Chatillon, S.; Deschamps, M. Modeling of Ray Paths of Head Waves on Irregular Interfaces in TOFD Inspection for NDE. Ultrasonics 2014, 54, 1851–1860. [Google Scholar] [CrossRef] [PubMed]
- Raillon, R.; Bey, S.; Dubois, A.; Mahaut, S.; Darmon, M. Results of the 2010 Ut Modeling Benchmark Obtained with Civa: Responses of Backwall and Surface Breaking Notches. AIP Conf. Proc. 2011, 1335, 1777–1784. [Google Scholar] [CrossRef]
- Raillon, R.; Bey, S.; Dubois, A.; Mahaut, S.; Darmon, M. Results of the 2009 Ut Modeling Benchmark Obtained with Civa: Responses of Notches, Side-drilled Holes and Flat-bottom Holes of Various Sizes. AIP Conf. Proc. 2010, 1211, 2157–2164. [Google Scholar] [CrossRef]
- Raillon-Picot, R.; Toullelan, G.; Darmon, M.; Calmon, P.; Lonné, S. Validation of CIVA Ultrasonic Simulation in Canonical Configurations. In Proceedings of the World Conference of Non Destructive Testing (WCNDT), Durban, South Africa, 16–20 April 2012. [Google Scholar]
- Dhvani, A.I. Available online: https://www.dhvani-analytic-intelligence.com/simsonic.html (accessed on 4 February 2022).
- OnScale Solve—The Cloud Engineering Simulation Platform. Available online: https://onscale.com/ (accessed on 4 February 2022).
- Pogo—High Speed Wave Simulations. Available online: http://www.pogo.software/ (accessed on 15 April 2021).
- Imperiale, A.; Chatillon, S.; Darmon, M.; Leymarie, N.; Demaldent, E. UT Simulation Using a Fully Automated 3D Hybrid Model: Application to Planar Backwall Breaking Defects Inspection. AIP Conf. Proc. 2018, 1949, 050004. [Google Scholar] [CrossRef]
- Imperiale, A.; Leymarie, N.; Fortuna, T.; Demaldent, E. Coupling Strategies Between Asymptotic and Numerical Models with Application to Ultrasonic Non-Destructive Testing of Surface Flaws. J. Theor. Comput. Acoust. 2019, 27, 1850052. [Google Scholar] [CrossRef]
- Cohen, G. Higher-Order Numerical Methods for Transient Wave Equations; Springer Science & Business Media: Berlin/Heidelberg, Germany, 2002; ISBN 978-3-540-41598-5. [Google Scholar]
- Komatitsch, D.; Tromp, J. Introduction to the Spectral Element Method for Three-Dimensional Seismic Wave Propagation. Geophys. J. Int. 1999, 139, 806–822. [Google Scholar] [CrossRef]
- Kundu, T.; Placko, D.; Rahani, E.; Yanagita, T.; Dao, C. Ultrasonic Field Modeling: A Comparison of Analytical, Semi-Analytical, and Numerical Techniques. IEEE Trans. Ultrason. Ferroelectr. Freq. Control 2010, 57, 2795–2807. [Google Scholar] [CrossRef]
- Lü, B.; Darmon, M.; Fradkin, L.; Potel, C. Numerical Comparison of Acoustic Wedge Models, with Application to Ultrasonic Telemetry. Ultrasonics 2016, 65, 5–9. [Google Scholar] [CrossRef]
- Bövik, P.; Boström, A. A Model of Ultrasonic Nondestructive Testing for Internal and Subsurface Cracks. J. Acoust. Soc. Am. 1998, 102, 2723. [Google Scholar] [CrossRef]
- Semenova, M.; Wirdelius, H.; Persson, G. Comparison between Three Mathematical Models of Three Well Defined Ultrasonic NDT Cases. IOP Conf. Ser. Mater. Sci. Eng. 2020, 747, 012061. [Google Scholar] [CrossRef]
- Civa Software Website. Available online: http://www.Extende.com/ (accessed on 11 May 2022).
- Gengembre, N.; Lhémery, A. Pencil Method in Elastodynamics: Application to Ultrasonic Field Computation. Ultrasonics 2000, 38, 495–499. [Google Scholar] [CrossRef]
- Auld, B.A. General Electromechanical Reciprocity Relations Applied to the Calculation of Elastic Wave Scattering Coefficients. Wave Motion 1979, 1, 3–10. [Google Scholar] [CrossRef]
- Imperiale, A.; Demaldent, E. A Macro-Element Strategy Based upon Spectral Finite Elements and Mortar Elements for Transient Wave Propagation Modeling. Application to Ultrasonic Testing of Laminate Composite Materials. Int. J. Numer. Methods Eng. 2019, 119, 964–990. [Google Scholar] [CrossRef]
- Djakou, A.K.; Darmon, M.; Potel, C. Elastodynamic Models for Extending GTD to Penumbra and Finite Size Flaws. J. Phys. Conf. Ser. 2016, 684, 012002. [Google Scholar] [CrossRef]
- Djakou, A.K.; Darmon, M.; Potel, C. Elastodynamic Models for Extending GTD to Penumbra and Finite Size Scatterers. Phys. Procedia 2015, 70, 545–549. [Google Scholar] [CrossRef][Green Version]
- Raillon-Picot, R.; Toullelan, G. Caractérisation Expérimentale de CIVA, Contrôle TOFD Par Ultrasons, Échos de Diffraction de Défauts Plans Verticaux et Échos de Trous Génératrice, Mode Longitudinal, CEA/DISC/LMC/12 RT128. 2012.
- Darmon, M.; Chatillon, S.; Mahaut, S.; Calmon, P.; Fradkin, L.J.; Zernov, V. Recent Advances in Semi-Analytical Scattering Models for NDT Simulation. J. Phys. Conf. Ser. 2011, 269, 012013. [Google Scholar] [CrossRef]
Publisher’s Note: MDPI stays neutral with regard to jurisdictional claims in published maps and institutional affiliations. |
© 2022 by the authors. Licensee MDPI, Basel, Switzerland. This article is an open access article distributed under the terms and conditions of the Creative Commons Attribution (CC BY) license (https://creativecommons.org/licenses/by/4.0/).