Article

Changes in Propeller Shaft Behavior by Fluctuating Propeller Forces during Ship Turning

1
Division of Marine System Engineering, Korea Maritime and Ocean University, Busan 49112, Korea
2
Department of Naval Architecture, Ocean and Marine Engineering, University of Strathclyde, 100 Montrose Street, Glasgow G4 0LZ, UK
*
Author to whom correspondence should be addressed.
Appl. Sci. 2022, 12(10), 5041; https://doi.org/10.3390/app12105041
Submission received: 5 April 2022 / Revised: 13 May 2022 / Accepted: 14 May 2022 / Published: 17 May 2022

Abstract

:
It is known that a ship’s shafting system can be adversely affected by hull deformation, variations in the engine power, the propeller load, and eccentric propeller thrusts, thereby increasingly affecting the behavior of the shaft’s movement. A deformed shafting system may also lead to a potential risk of bearing damage by causing a change in the local load of the rear part of the after-stern tube bearing of the propeller shaft. With this concern, a series of previous studies were focused on optimizing the effects of hull deformation by securing a proper level of propulsion shaft stability and optimizing the relative inclination angle and oil film retention based on a quasi-static state, that is, Rules for the Classification of Steel Ships and experiences of shipyards. However, despite our efforts to resolve this issue, marine accidents involving stern tube bearing damage have continued to occur under relatively unattended ship motions in a transient state, that is, a quasi-static state that can possibly cause sudden stern flow field changes. Therefore, to improve the stability of the propulsion shaft, it is necessary to understand ship motions and the conditions of shafting systems in a dynamic state and a transient state when the system is designed. From this point of view, this study investigated the effect of changes in eccentric propeller forces on the motion of the propeller shaft in a representative transient state of a 50,000 deadweight tonnage tanker by means of the strain gauge method and a displacement sensor. The research findings demonstrate that propeller thrust fluctuations have a direct effect on the shaft stability by significant changes in the shaft motion that can lead to unbalanced supporting loads on the stern tube bearing. These results clearly reproduce the cause of damage to the ship in which the accident occurred at a reliable level and will be a reference for establishing pragmatic guidelines for preventing damage to similar ships in the future.

1. Introduction

The first studies related to securing the stability of ships’ shafting systems began in the United States Navy in the late 1950s and progressed in various ways throughout the 1970s [1]. In the 1960s, when shaft alignment was performed according to the conventional straight alignment theory, it was found that the shaft system could be damaged by the uneven distribution of the bearing load [2]. With the introduction of the fair curve alignment theory, which can guarantee the proper spacing and height adjustment between the shaft support bearings, the support bearings could be made to effectively share the loads of the propulsion shafts, leading to a significant reduction in the bearing damage caused by poorly distributed loads on the bearings [3,4,5]. In addition, a series of shaft optimization studies conducted in the late 1970s, along with the development of shaft alignment computation programs, played an important role in establishing the shaft alignment theory that is still used to this day [6,7,8,9].
Meanwhile, the application of high-tensile steel plates in shipbuilding in the 1990s offered a great deal of flexibility to the hulls of large ships. This trend resulted in a higher degree of deformation of ship hulls, whereas the strength of the propulsion shaft tended to increase to cover larger engines with high power. In other words, the engine compartment located in a double-bottom hull has become thinner and is easier to deform as a consequence of hull optimization; the opposite trend occurred with propulsion shafts [10]. Similarly to the target ship of this study, the oil tanker is a linear type of ship that exhibits the greatest hull deformation due to draught changes due to the characteristics of transporting oil cargo. As a result of such hull deformation, the offset of the propulsion shaft support bearing will change and the reaction force of the support bearing will also significantly change in a chain, resulting in damage to the shaft bearing. There are two parts that would suffer bearing damage in the propulsion system due to offset changes.
Firstly, in the case of main engine bearing damage, damage to the aftmost bearing in the vicinity of the turning wheel occurs as a wiping phenomenon due to overloading, whereas crank throw end bearing (the aftmost crank throw bearing) damage occurs as a hammering phenomenon due to unloading. These types of damage have as their main cause the ship’s deformation due to a change in the ship’s draught. These types of damage can be reduced significantly in collaboration with main engine manufacturers who could recognize and address the load sharing problem in the crankshaft bearing [11,12]. Meanwhile, the second issue, damage involved in the second after-stern tube bearing, remains serious. The major causes of such damage to the after-stern tube bearing are primarily the misalignment and excessive local load at the end of the after-stern tube bearing due to hull deformation [13,14]. Therefore, in consideration of the major damage issues mentioned above, shafting system design has been carried out focusing on alleviating the local load of the rear end [15] and maintaining the minimum oil film thickness of the after-stern tube bearing [16,17,18] in accordance with the Rules for the Classification of Steel Ships and the guidelines of the shipyard.
However, despite such design considerations in the rules and guidelines, if eccentric propeller thrust force fluctuations frequently occur in a dynamic or transient state, the after-stern tube bearing is highly likely to be damaged, regardless of how much the bearing local load fluctuation is predicted and prepared for by means of sophisticating machining with single-sloped or double-sloped processing. Another notable recent shaft system design perspective is to apply an ultra-long stroke engine to increase the ship’s operating efficiency. The ship’s operating efficiency can be improved through the application of an ultra-long stroke engine, while the shaft rotation speed can be lowered, resulting in a slight decrease in the ship’s speed. Therefore, to compensate for this, the propeller’s diameter can be slightly increased compared with the previous design [19]. The increase in the propeller’s diameter leads to an increase in the propeller’s mass, and the bearing load and pressure of the after-stern tube bearing (ASTB) are also increased. Therefore, to cope with the above-mentioned issue, the length of the ASTB of the vessel is increased in order to compensate for the increased load and pressure compared with the previous medium-range (MR) class vessel. However, the bearing load will be closer to the manufacturer’s maximum allowable bearing load compared with the previous design.
Considering the current trend, this situation leads to higher loads on the after-stern tube bearing. These load distribution conditions bring about a high probability of bearing damage. In these circumstances, the stability of the shaft system cannot be ensured by standardized quasi-static methods. ‘Quasi-static’ analysis means that the calculations are performed in a static state, but the eccentric propeller thrust values generated at the vessel’s maximum design speed are reflected in the static state in the form of a bending moment. The quasi-static method has the advantage of being able to save time and reduce costs because the calculation is relatively simple, and it is easy to estimate the amount of deformation of the propulsion shaft. However, this method has fundamental limitations that make it difficult to identify potential hazards that may arise under real dynamic conditions. Saitoh [20] found that when the shaft system is designed in such a way that only the existing quasi-static conditions are considered, the force generated by the propeller causes serious damage to the stern tube bearing and the stern tube seal ring when the ship is in a dynamic state. This has created a strong demand for securing the shaft’s stability under various propeller loads continuously in dynamic ship states, such as when the ship goes straight ahead or turns [21,22,23,24,25,26,27,28,29,30,31,32,33,34].
In order to ensure the stability of the ship’s propulsion shaft, it is important to perform extensive statistical analyses to obtain reliable data to further develop rules and standards applicable to all types of ships. Therefore, in this study, the effect of eccentric propeller thrust on the propeller shaft behavior during turning, which is a typical transient operating state of a ship, was investigated using a strain gauge and a displacement sensor for a medium-range tanker, which has not been covered in past studies that rely on the conventional methods.

2. Approaches Adopted

Figure 1 schematically shows the research approach used in this study. First, the data acquisition (DAQ) system and sensors were configured to collect information on the ship’s propulsion system, and the target data were collected by operating the ship according to the established trial plan. In addition, data conversion and analysis were performed. The results of this study are discussed through cross-validation between the sensors.

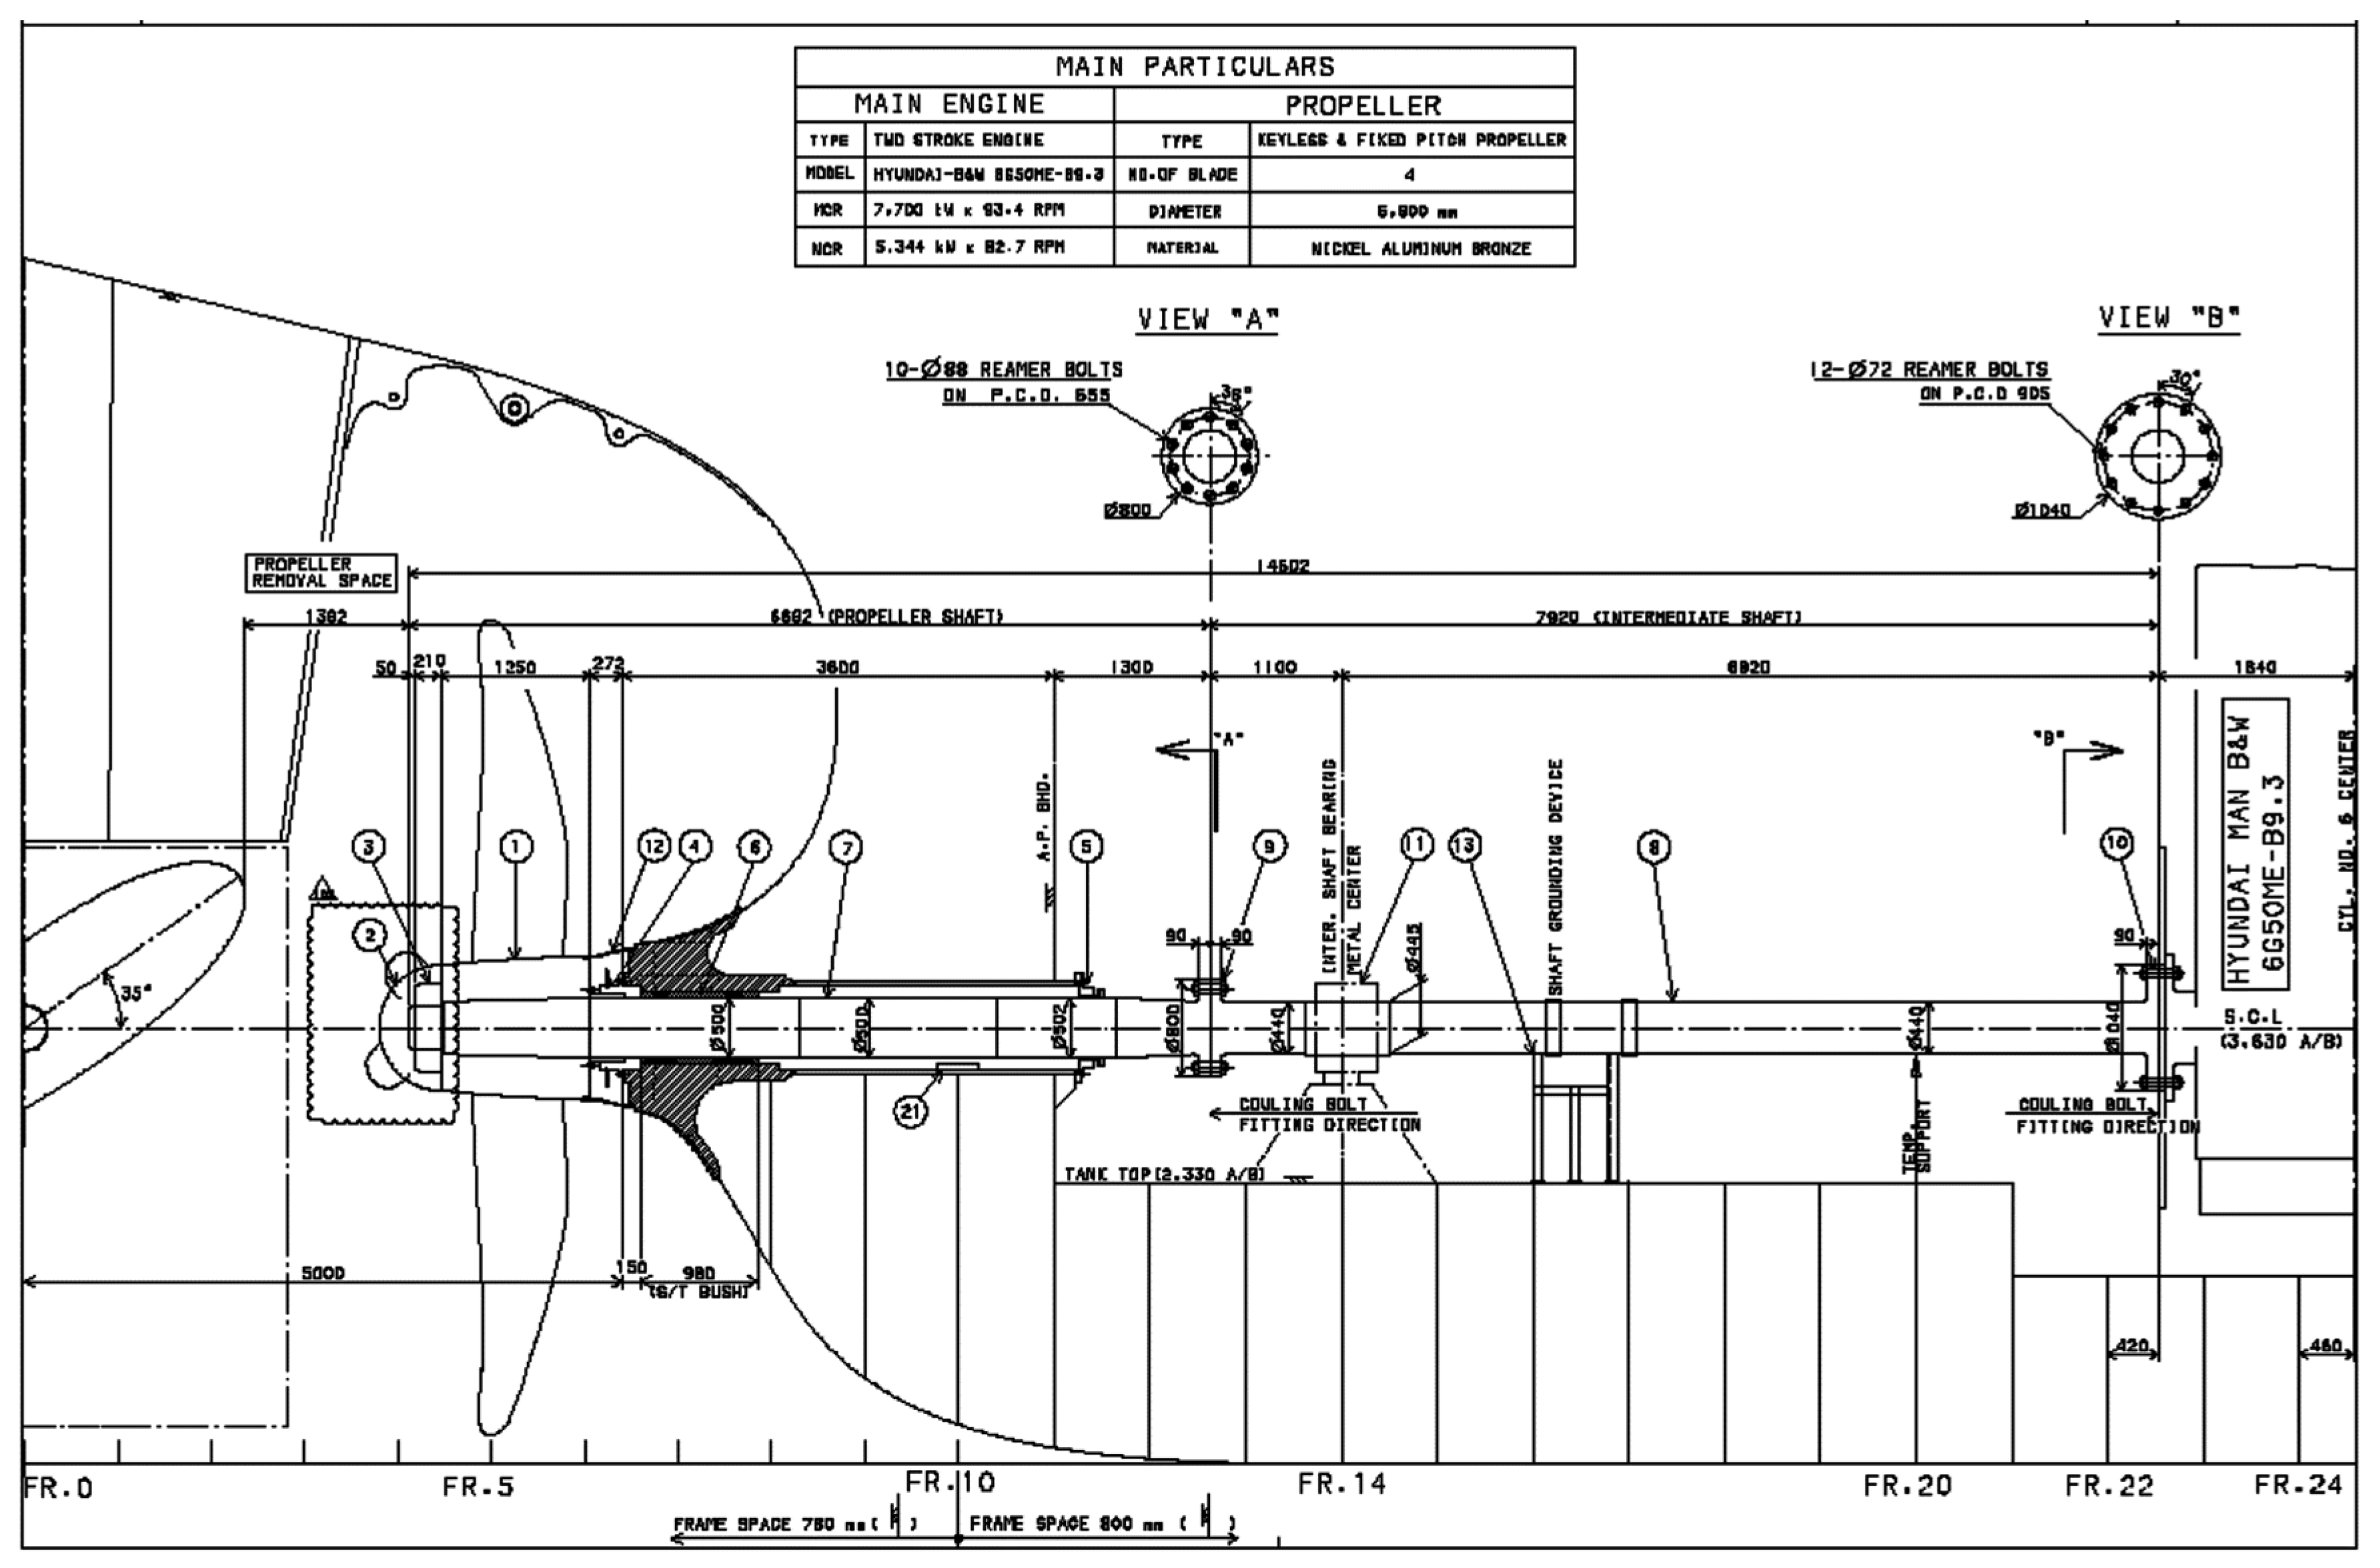
2.1. Ship Description

The selected case study ship was a 50 K deadweight tonnage (DWT) oil/chemical tanker. Table 1 presents the main specifications of the case study ship, whose shafting system was used for this study, while Figure 2 shows the shafting system’s layout.

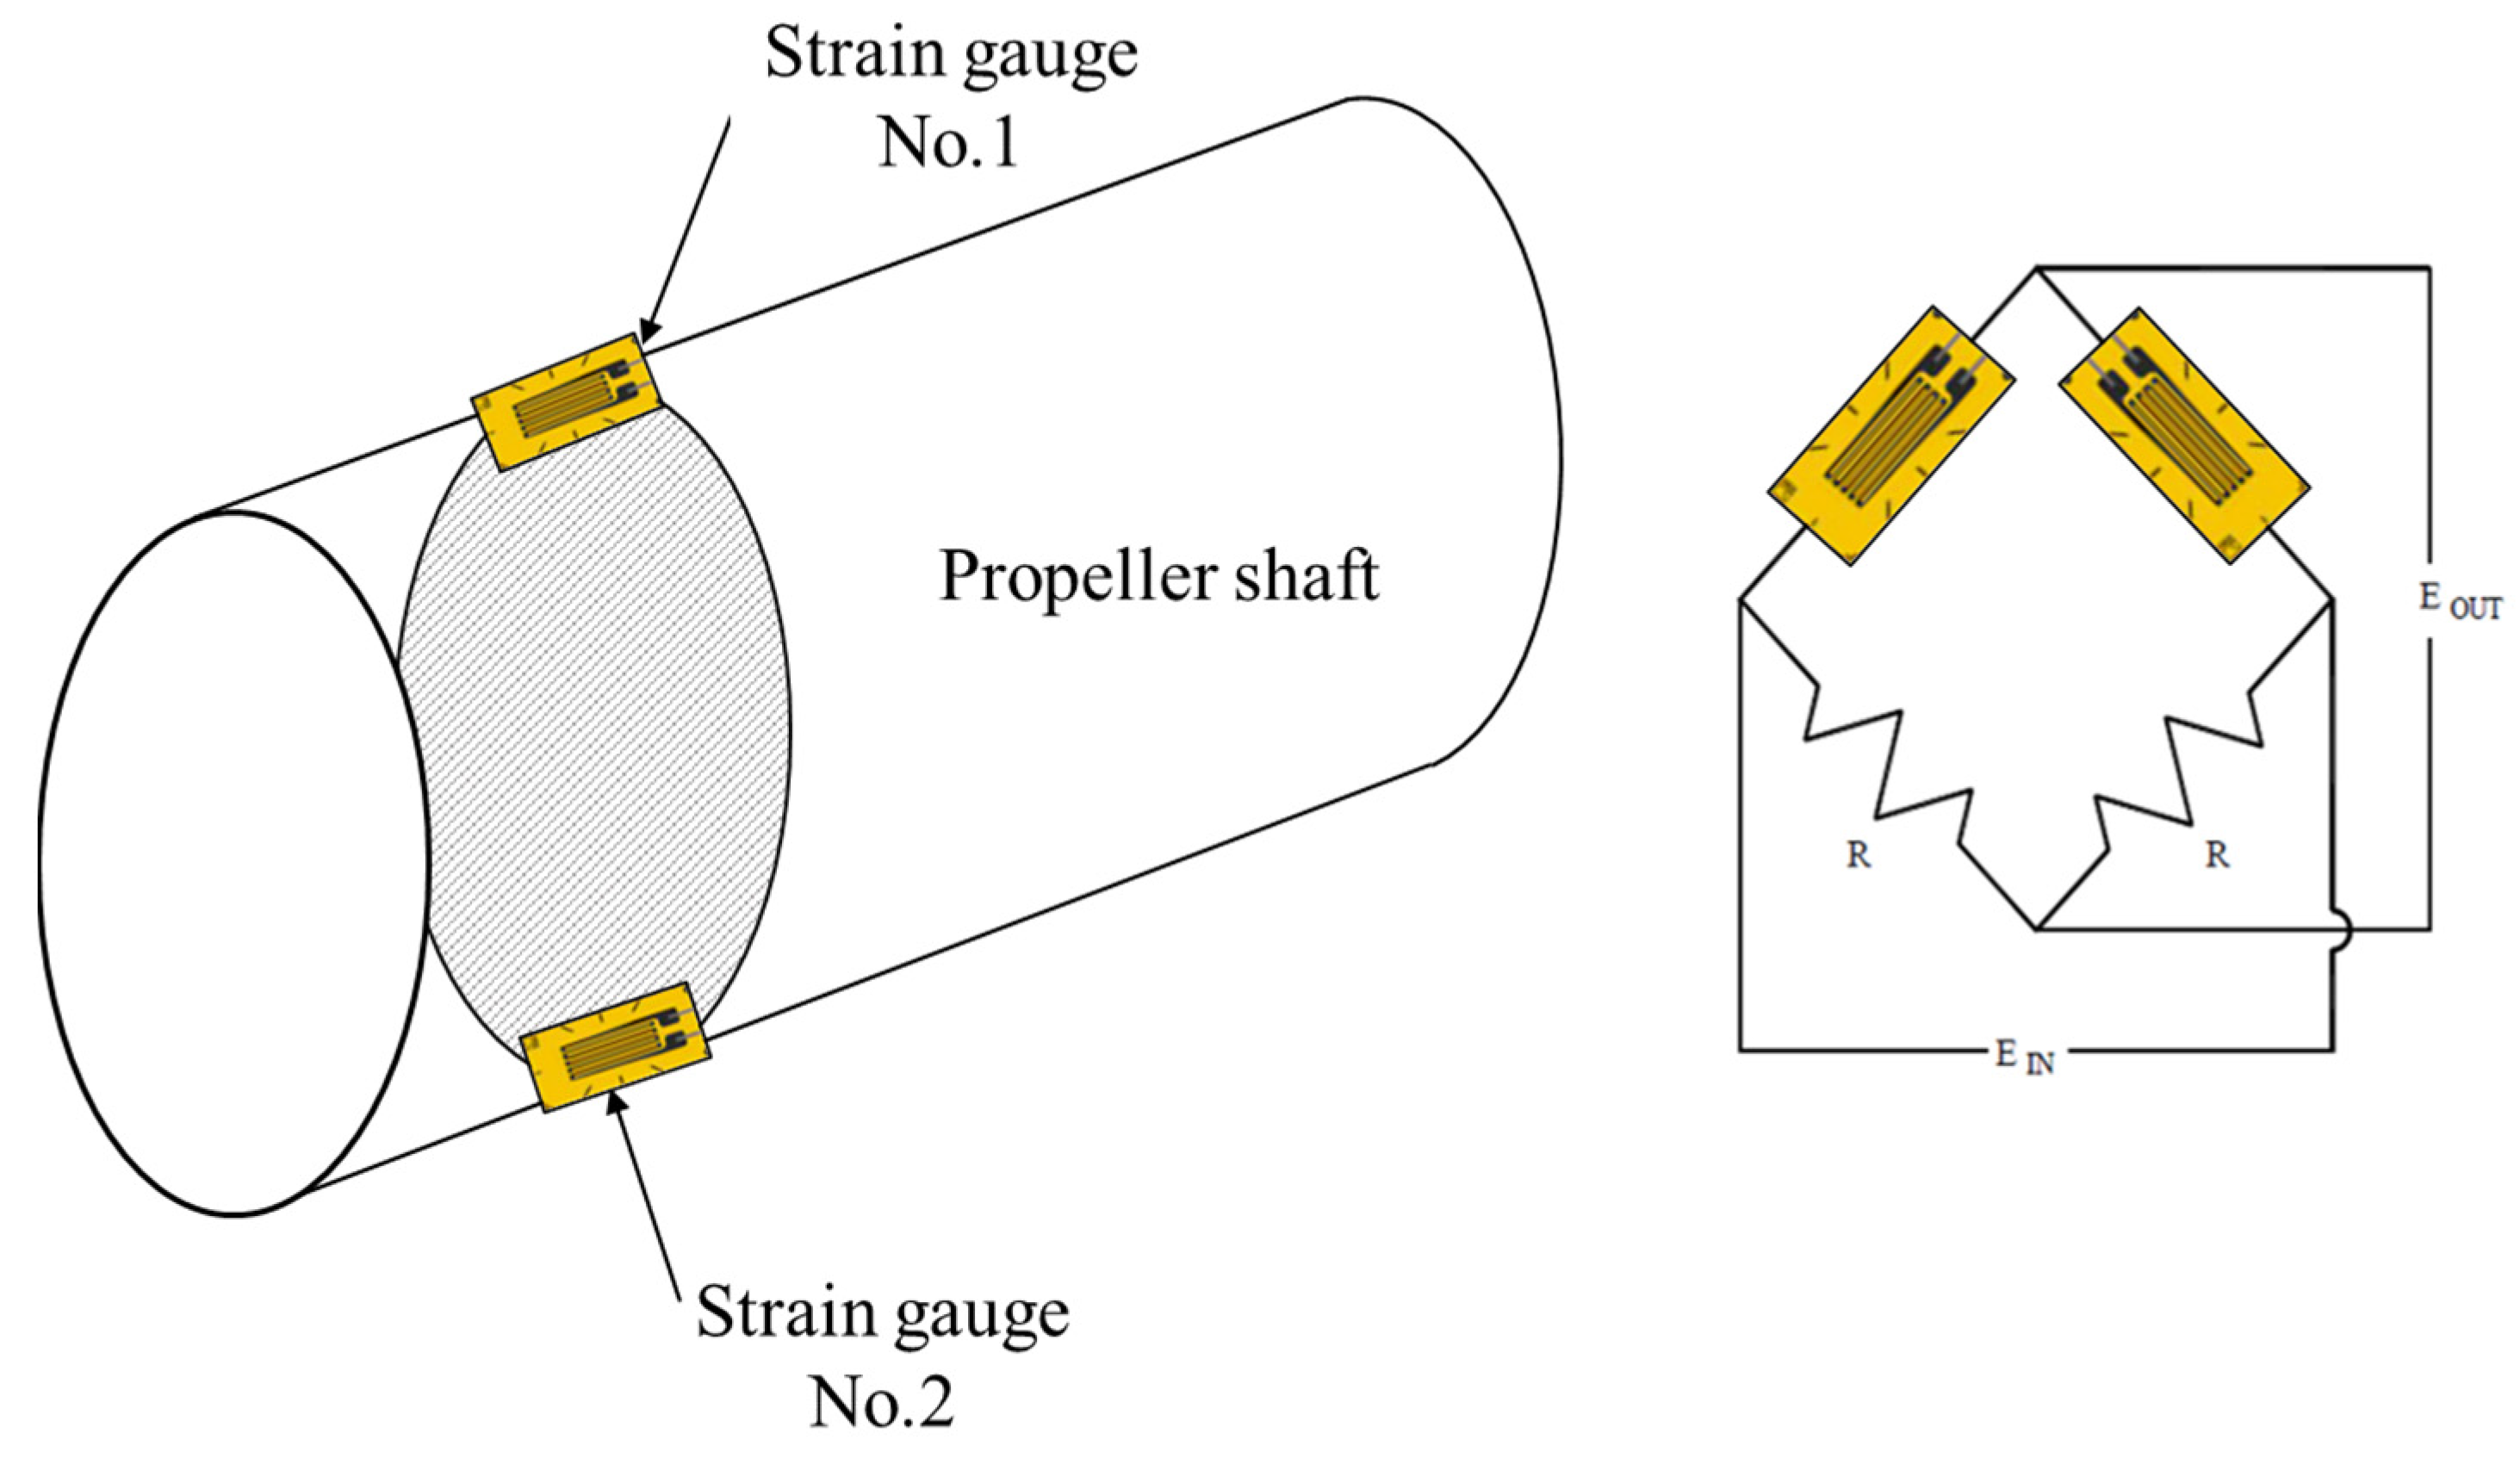
2.2. Introduction to the Strain Gauge Method
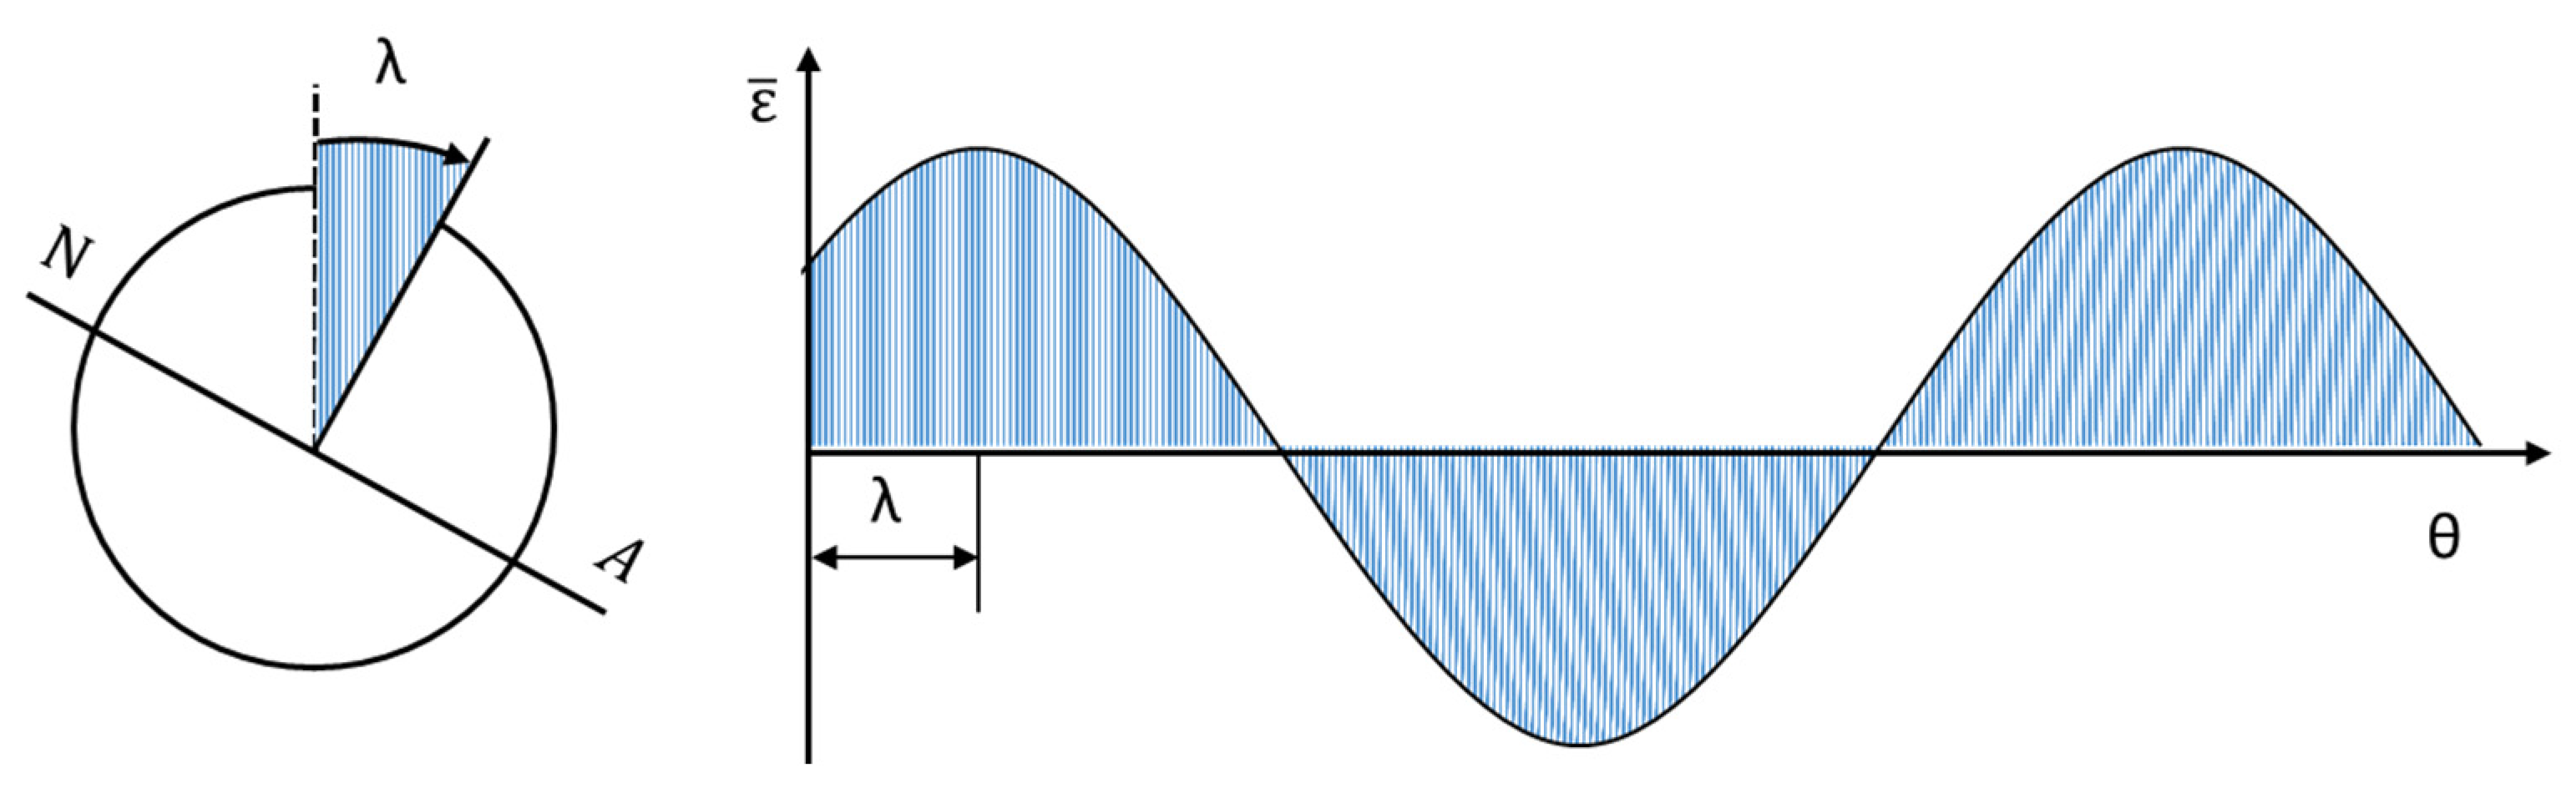
The Wheatstone bridge circuit method is a common method that is applied for measurement using a strain gauge. There are 3 types of strain gauge configuration based on the number of active gauges: quarter-bridge (1 active gauge); half-bridge (2 active gauges); and full-bridge (4 active gauges). In general, the half-bridge configuration for bending moment measurement has all the advantages of the full-bridge configuration. The full-bridge configuration creates an output voltage that is double that of the half-bridge configuration, but it was not necessary for the measurements in this study. Therefore, as shown in Figure 3, a half-bridge strain gauge circuit was applied in consideration of the high accuracy compared with the installation time.
The resistance of the strain gauge varies in proportion to the strain at the gauge position when the shaft rotates. It can be expressed as shown in Figure 4.
The strain curve has a sine wave since the strain depends on the bending moment and the angle position where the strain is measured. The strain ε, as measured by strain gauges at any point, can be expressed as Equation (1) [35].
ε = ε a cos ( θ λ ) + ε ¯
where
  • ε a is the strain amplitude, ε a = ( ε m a x ε m i n ) / 2 ,
  • θ is the angle between the vertical direction and the gauge,
  • λ is the angle between the normal to neutral axis and the vertical direction or bending angle, and
  • ε ¯ is the average strain.
The average strain value does not matter because, to determine the moment, only the strain amplitude is needed.
The strain is at its maximum when θ = λ
ε = ε a cos ( 0 ) + ε ¯ = ε a + ε ¯
The uniaxial stress can be expressed as Equation (3) by applying the beam relation used in the calculation of uniaxial stress on the shaft surface.
σ = E ε a = M b c I
where
  • ε a is the strain amplitude,
  • M b is the bending moment of the shaft,
  • E is Young’s modulus,
  • I is the second moment of the shaft’s cross-section, and
  • c is the radius of the shaft’s cross-section.
In a hollow axis or a solid axis, I is to be I = π ( d o 4 d i 4 ) 64 or I = π d o 4 64 , respectively, and c = d o 2 in common. Thereby, Equation (3) can be rearranged as Equation (4).
M b = E π 32 ( d o 4 d i 4 ) d o ε a , M b = E π d o 3 32 ε a ,   M b = σ Z
The bending moment measured at the position of the strain gauge is obtained by:
M s = E π d o 3 32 ε
Therefore, Equation (4) becomes:
M b = M s   m a x M s   m i n 2
where
  • Z is the section modulus of the shaft.
Then, the vertical and horizontal moments can be expressed by Equations (7) and (8), respectively.
M v = I c E ε a c o s λ = M b c o s λ
M h = I c E ε a s i n λ = M b s i n λ
The reason for following this process is that the measured bending moment is a combined value containing both the large vertical moment and the small horizontal moment.
To improve the accuracy of the measurement of the displacement and trajectory of the shaft, it may be effective to install a sensor on the side of the propeller that the change in hydraulic propeller force directly affects. However, this idea is difficult to realize in practice for all ships as it requires additional costly processes such as waterproofing and oil sealing treatments and the installation of a bracket for signal transmitters [36,37].
An alternative method that can be used is to install the strain gauge in the engine room to measure the bending moment of the shaft. This can be separated into vertical and horizontal bending moment components to ensure that the measurement is reliable. The separate components are used as elements to draw track diagrams and check the movement of the shaft measured by displacement sensors.
Although this method is not able to indicate the exact displacement component of the center of the shaft, compared with direct measurement in the vicinity of the propeller, it is practical in such a way that it can directly or indirectly determine the direction of the shaft’s movement during the ship’s operation.
Therefore, in this study, a displacement sensor was additionally installed in the vicinity of the strain gauge to directly measure the vertical displacement, and we ensured that the measurements were accurate by cross-verifying the movement behavior of the shaft represented by the track diagram.

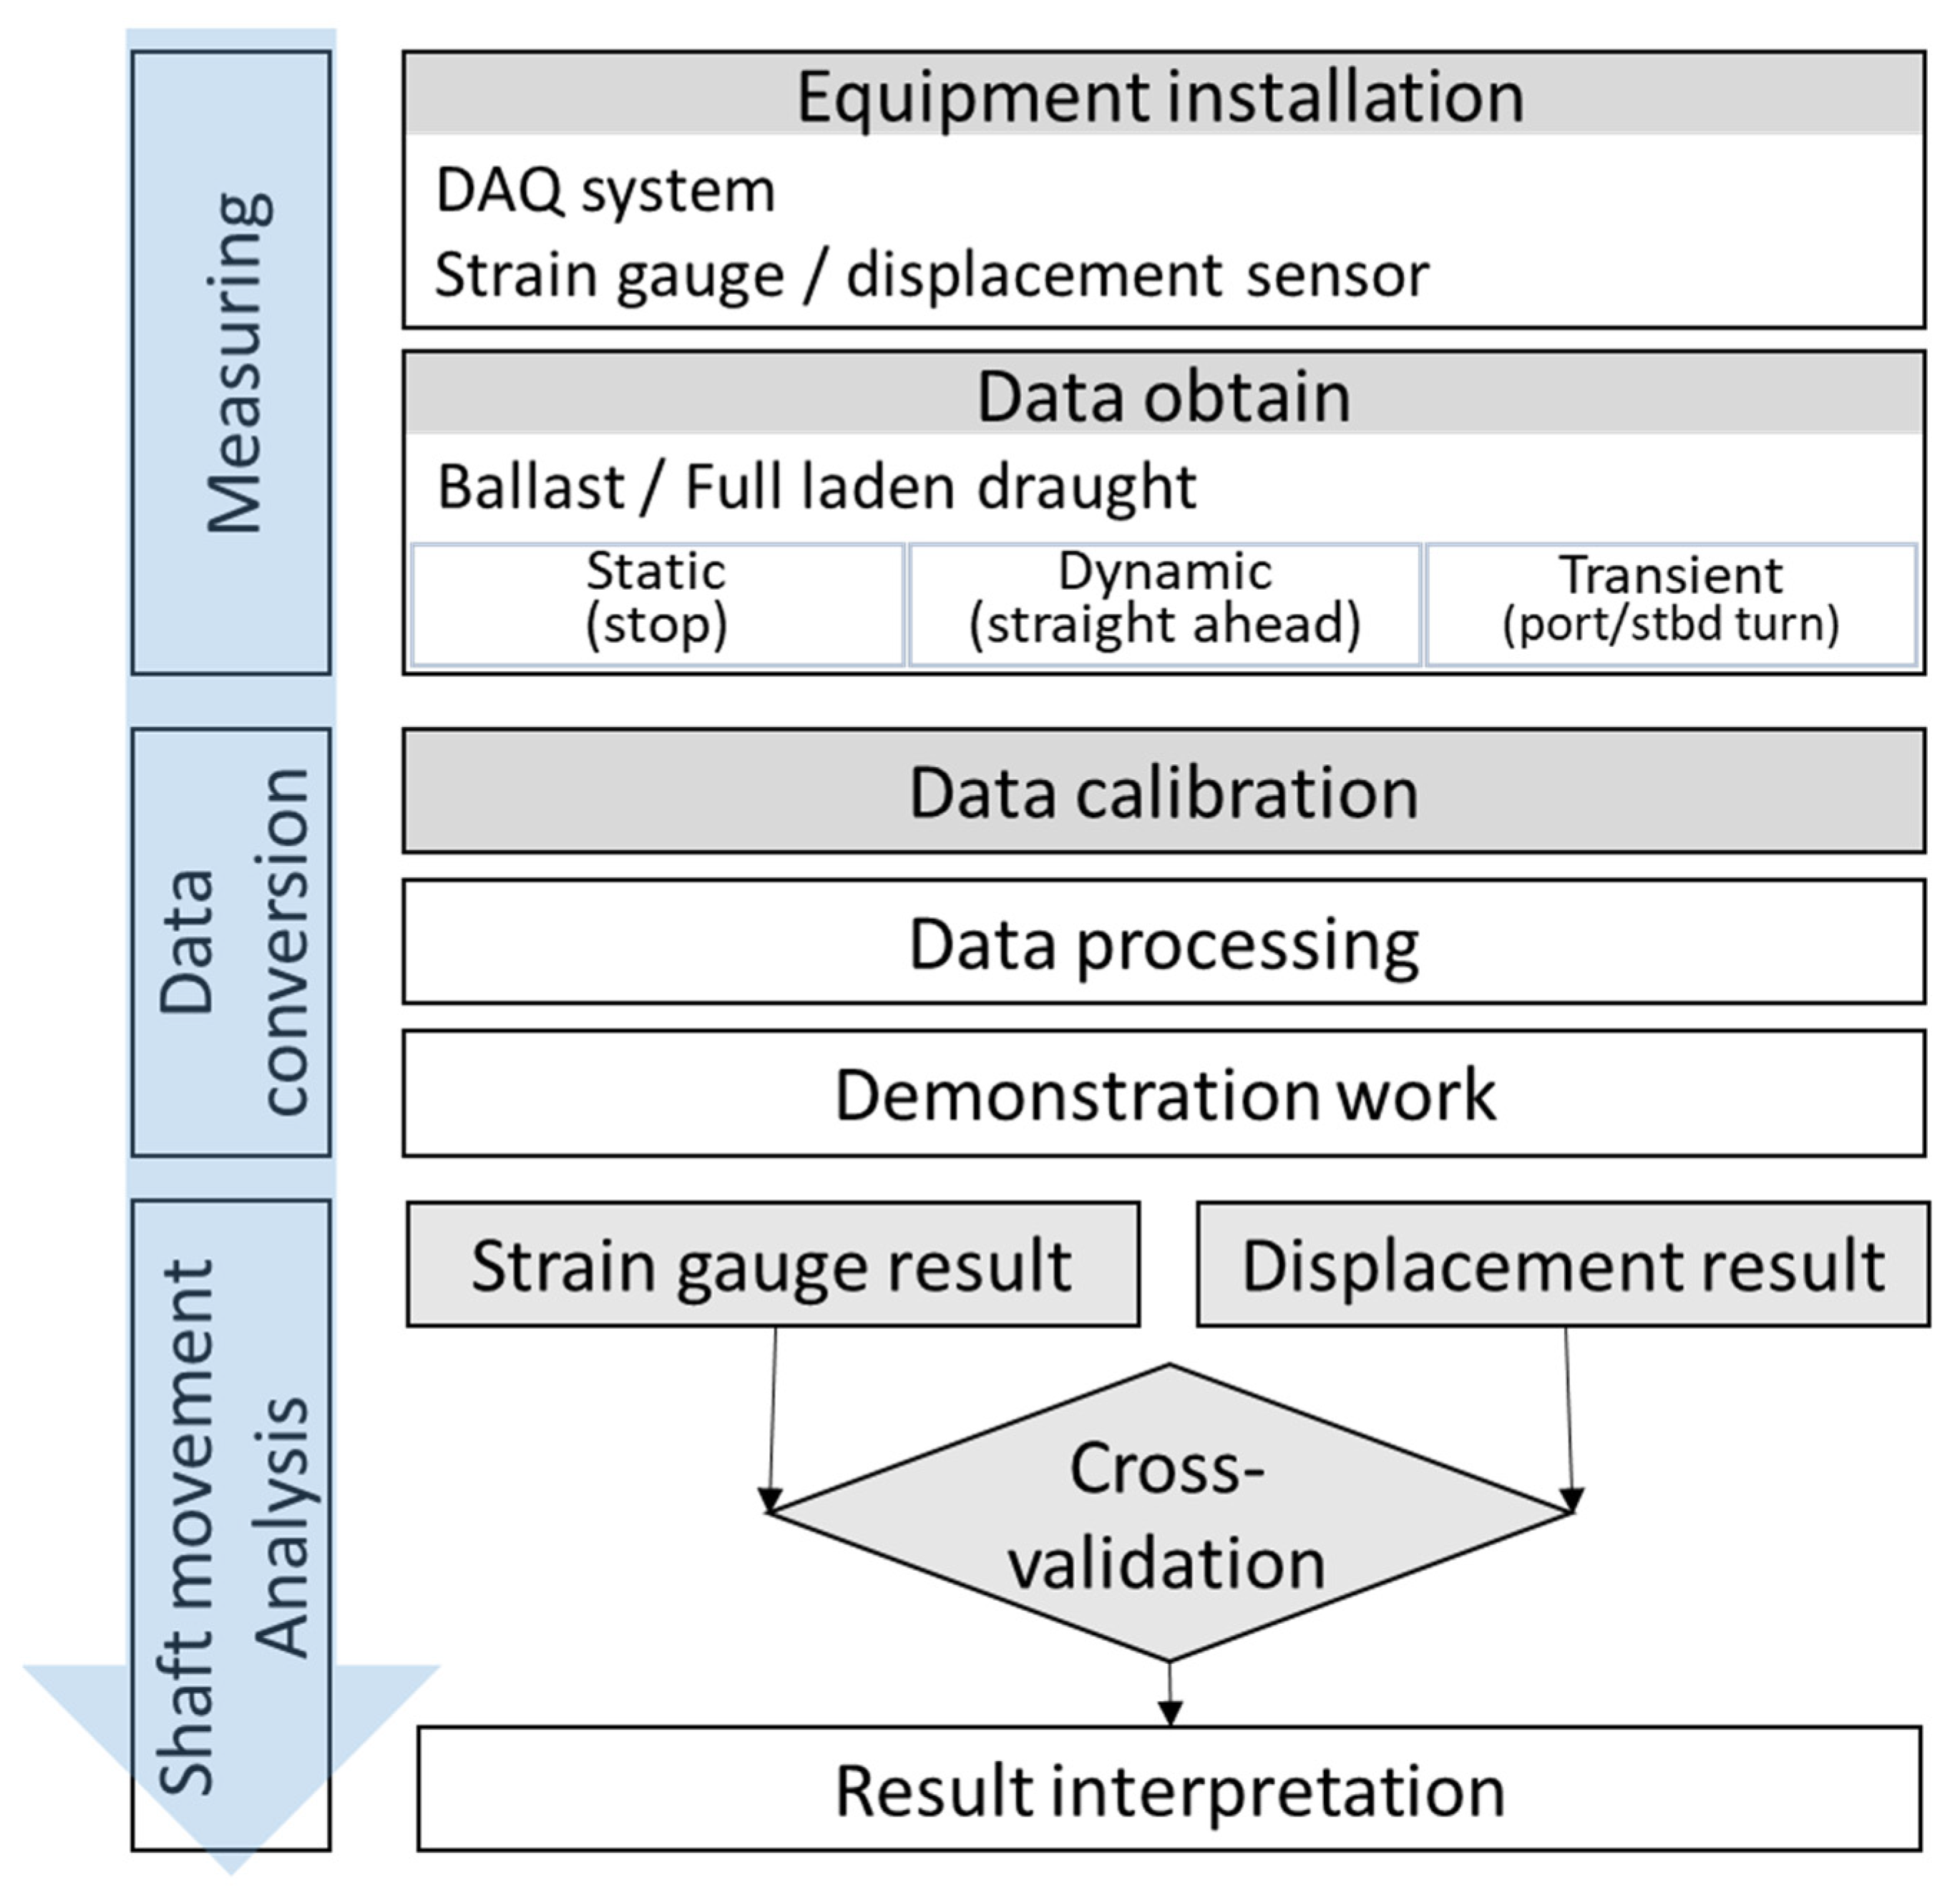
2.3. Measurement and Data Analysis Procedures

The experiments were performed under two conditions (full draught and ballast draught) during an official sea-trial. The direction of the shaft’s movement according to rapid turning while the ship went straight ahead under the normal continuous rate (NCR) condition was mainly observed.

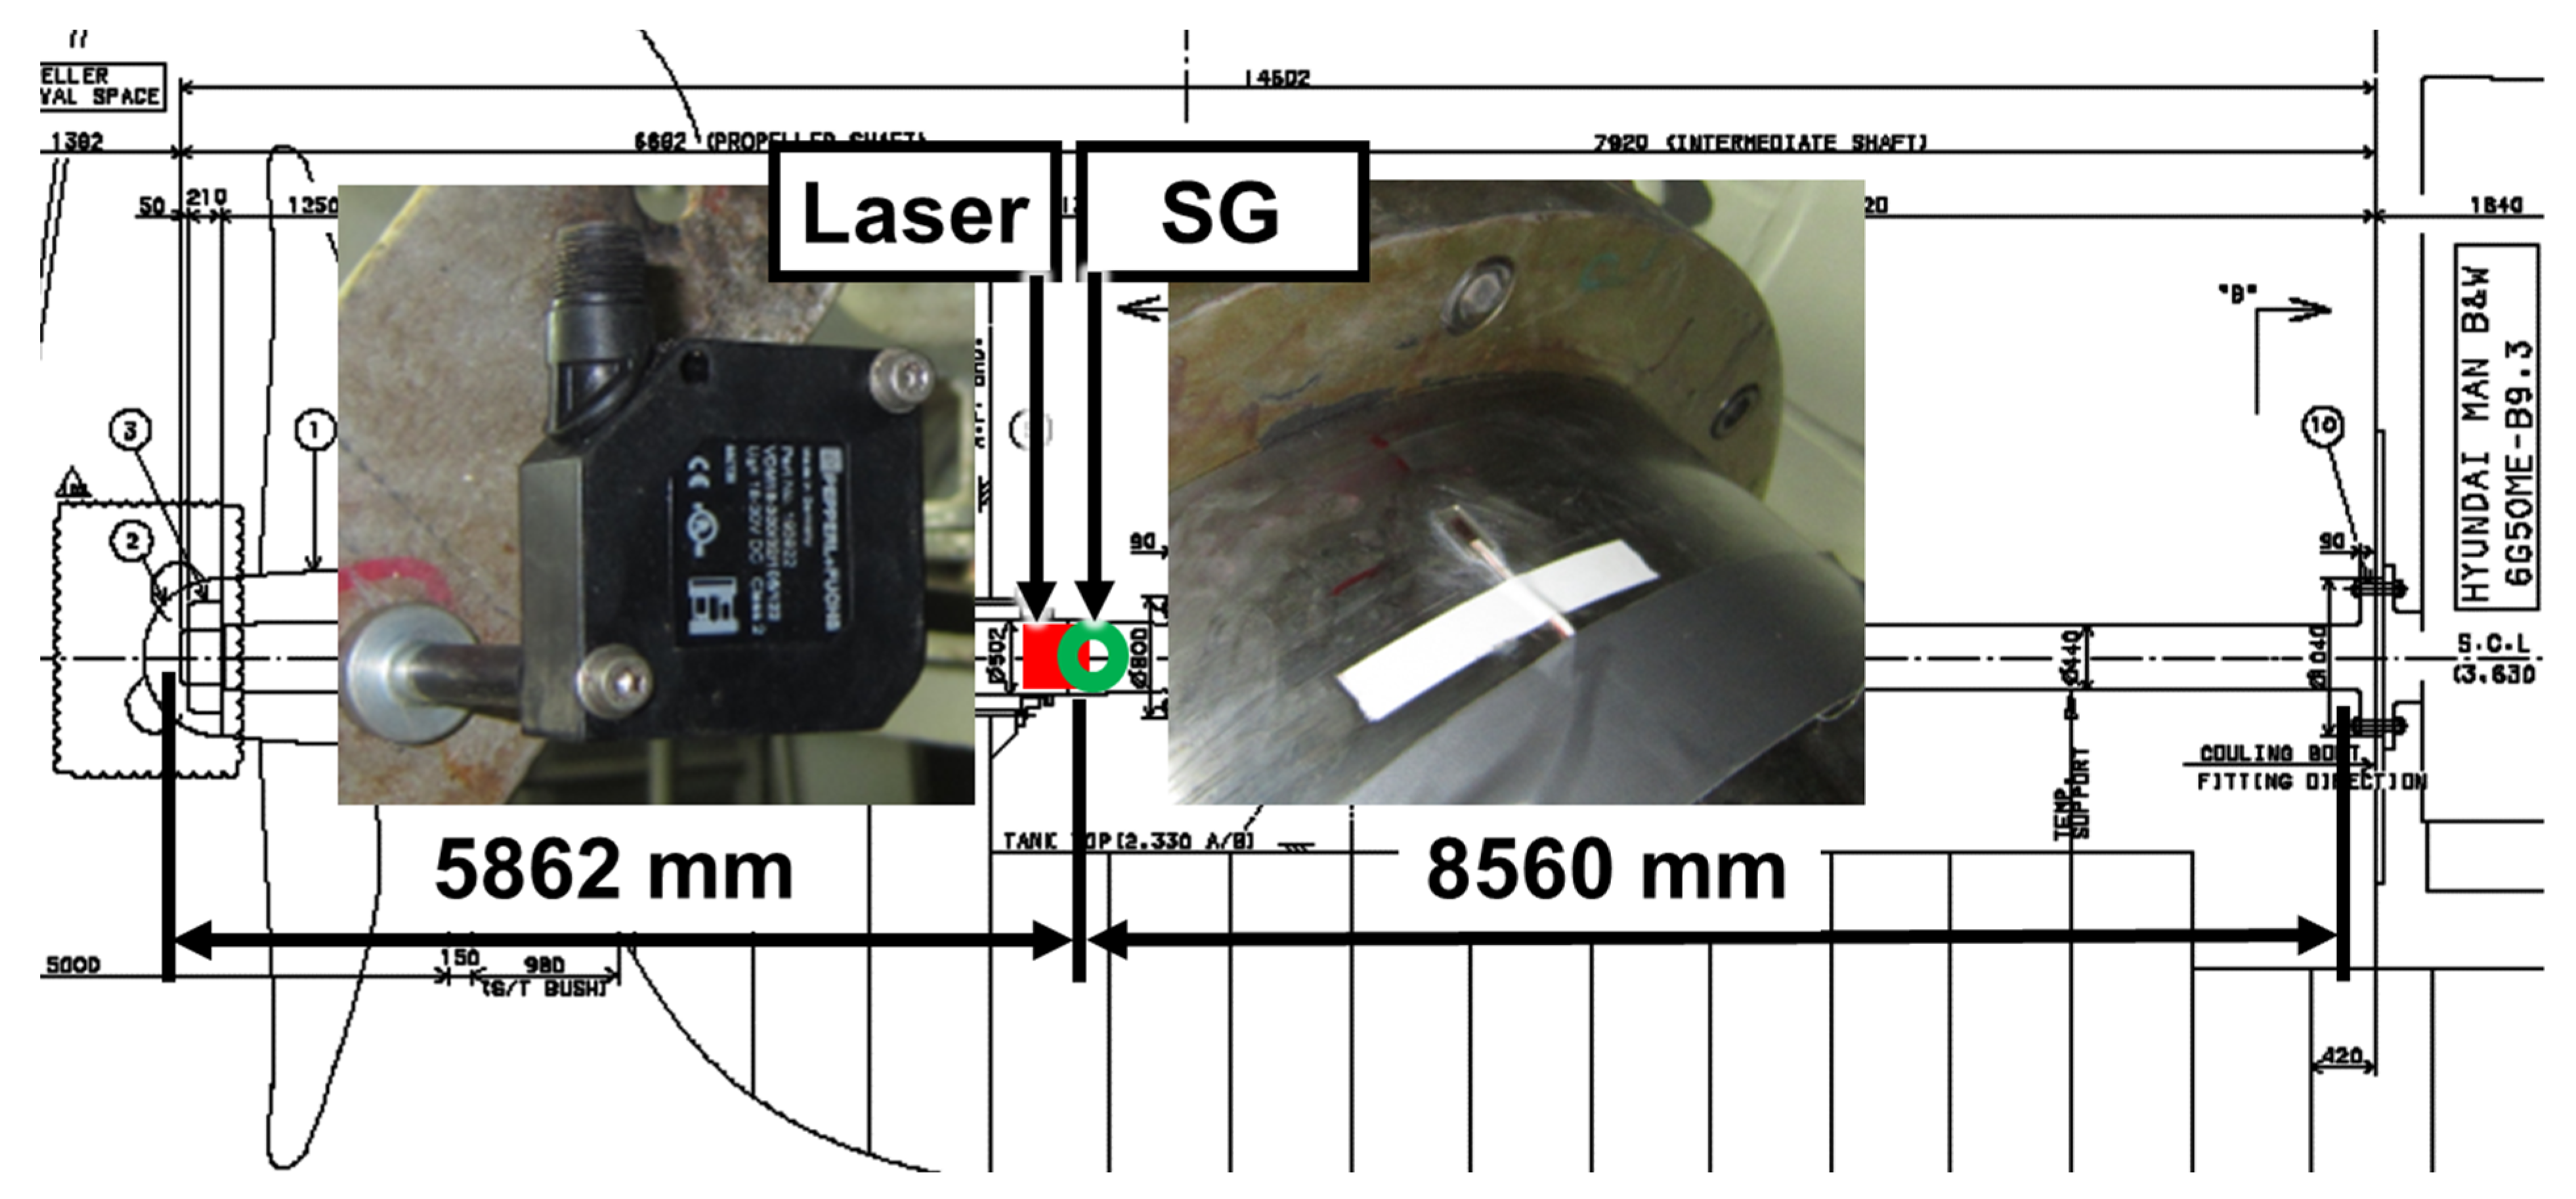
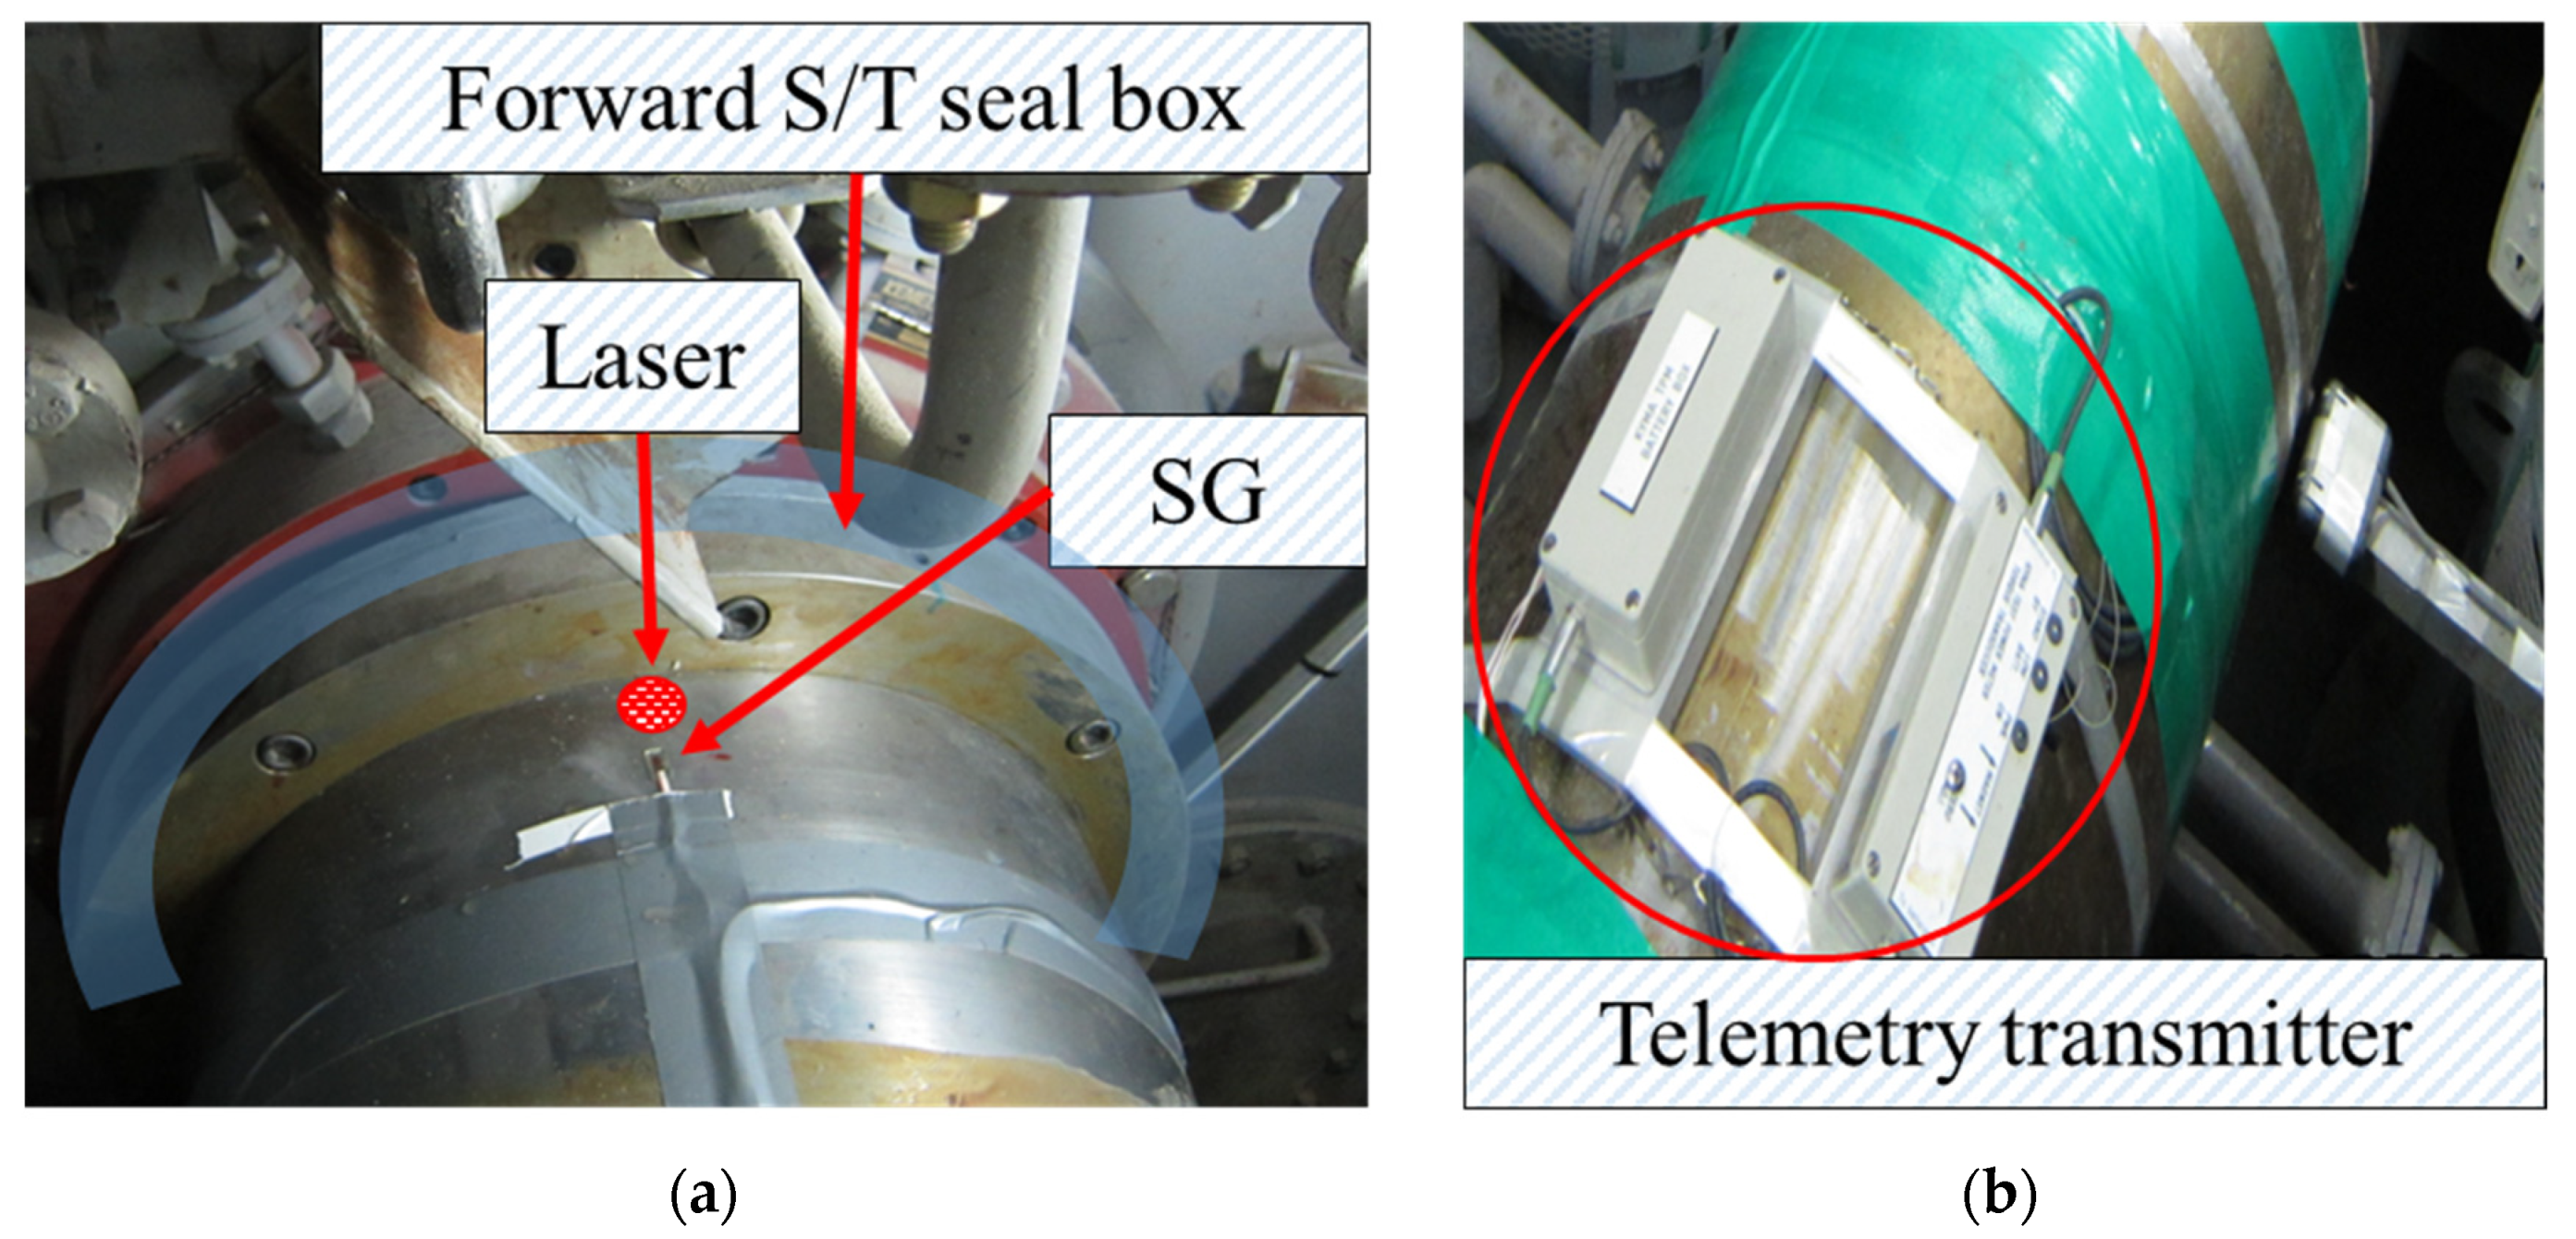
2.3.1. Configuration

The location of the strain gauge and the laser displacement sensor applied for the analysis is shown in Figure 5 and Table 2.
As shown in Figure 3, the strain gauges were mounted using a Wheatstone half-bridge circuit with a 180-degree interval at the top and bottom of the shaft. The laser displacement sensor was installed in order to measure the shaft displacement and a tachometer was used to measure the shaft speed.
Figure 6a also shows that both sensors were installed close to the engine room (E/R) forward-stern tube seal box, which is highly subject to the impact of eccentric propeller thrust. The configuration of the installed measuring device is shown in Figure 6b.

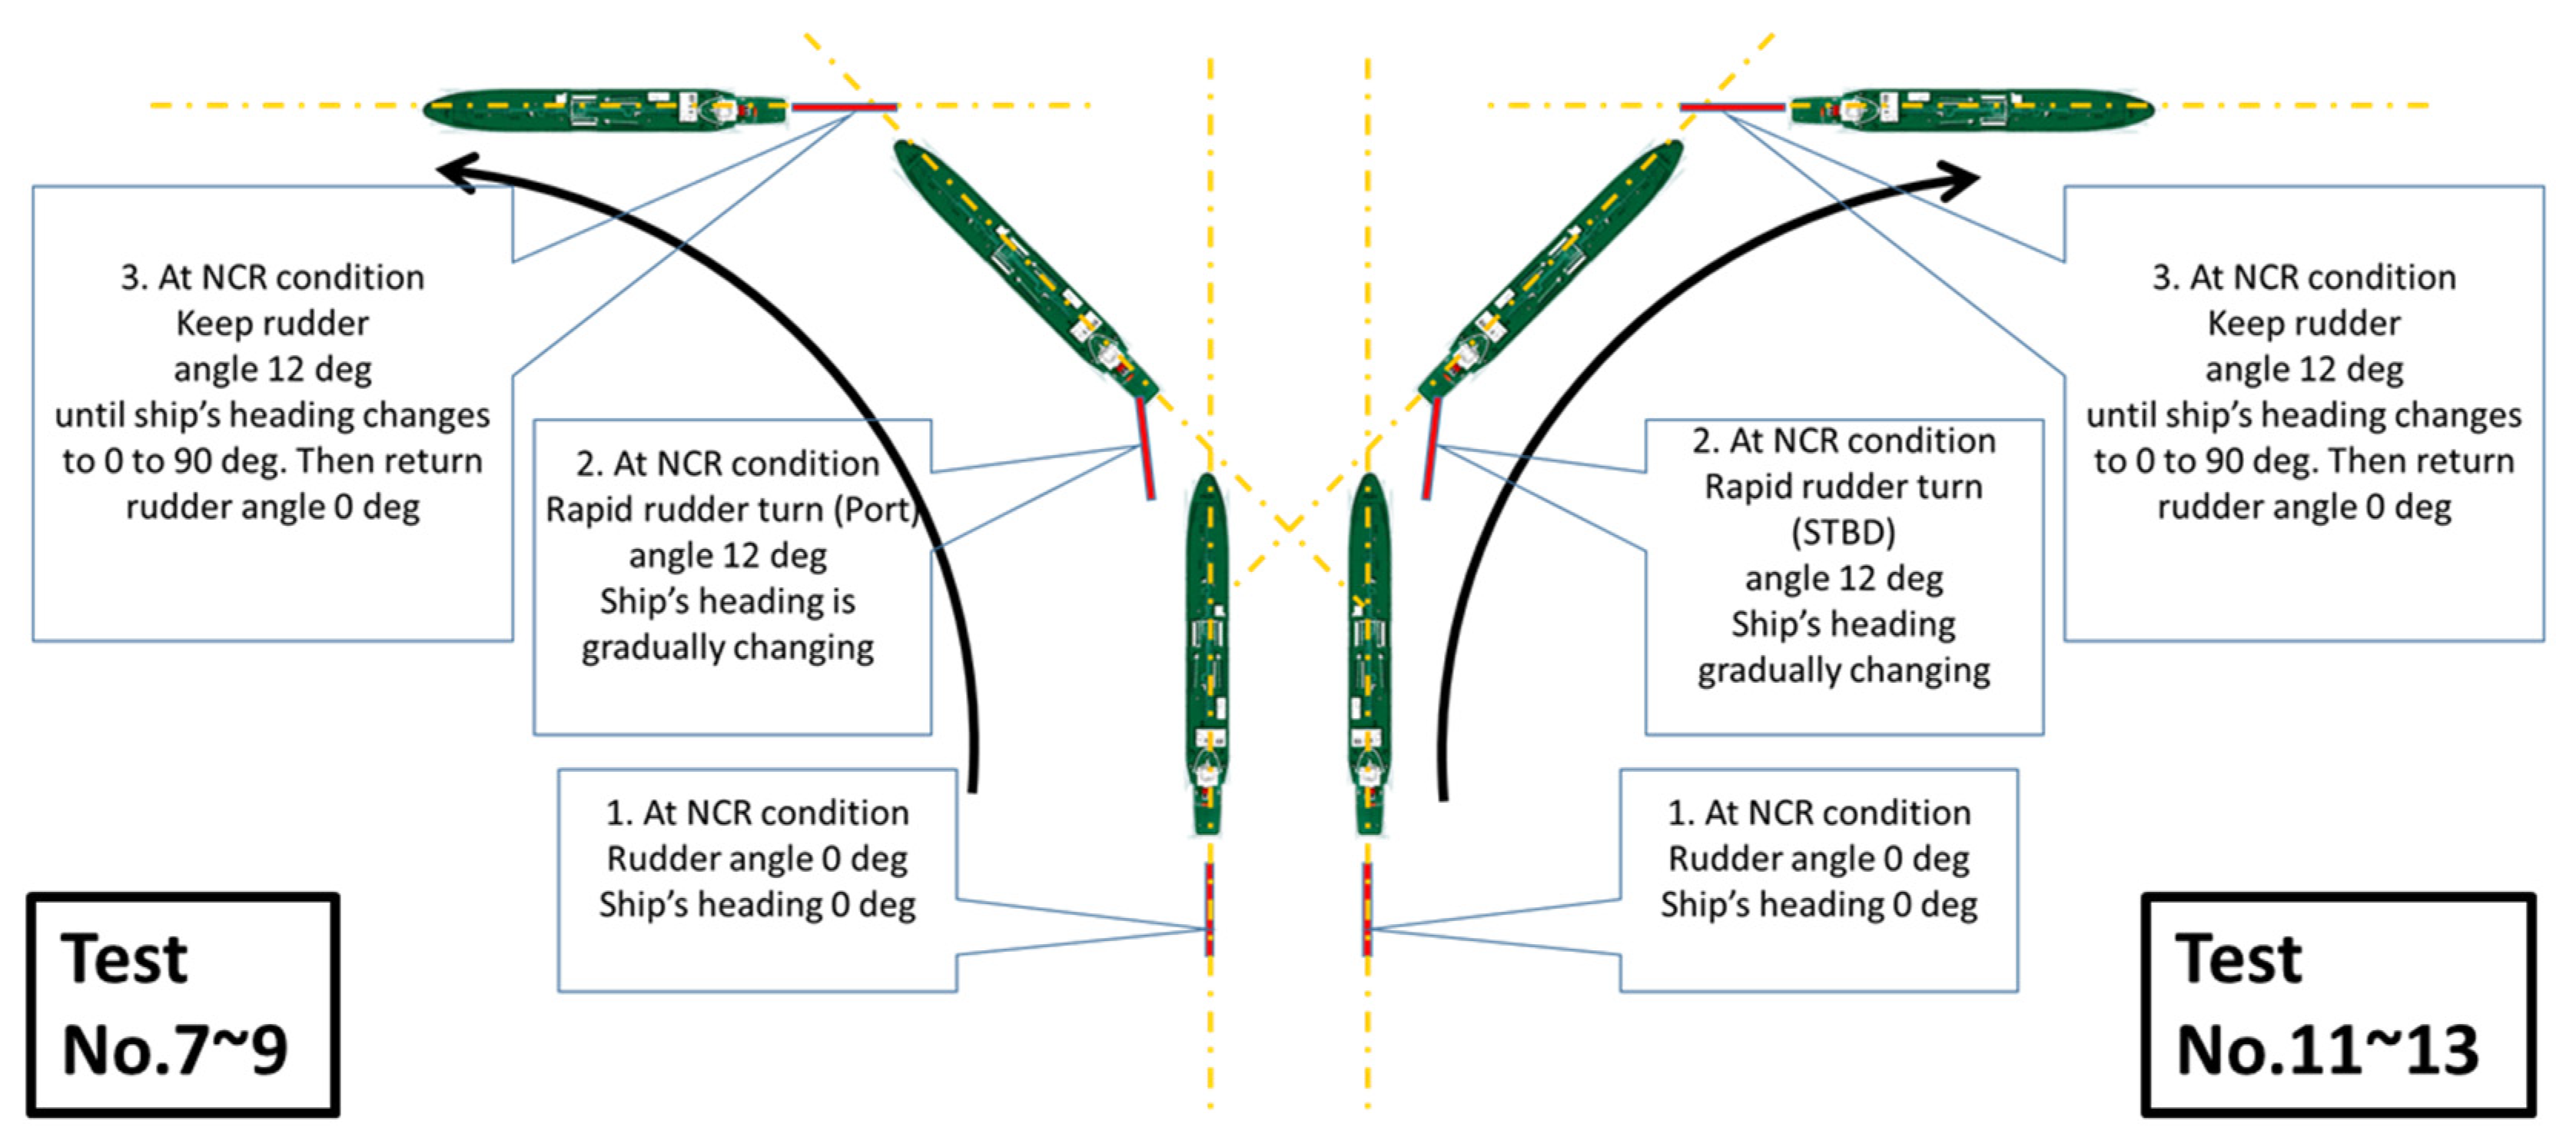
2.3.2. Measurement Procedures

The test conditions of the case study ship were established based on SOLAS (the Marine Life Safety Convention) (IMO, 2014) II-1, Chapter 29, Paragraph 3 (rudder test).
However, the purpose of this test was not to verify the rudder’s torque capability, but to evaluate the impact of the eccentric propeller thrust fluctuation. This is caused by the sudden change in the stern’s wakefield when the ship moves forward and has an effect on the propulsion shaft’s stability.
Therefore, as given in Table 3 and Figure 7, the measurement was made by going straight ahead (at a 0° rudder angle) and then turning rapidly (at a 12° rudder angle) until the head of the ship changed by 90°, and then the ship went back to going straight ahead (at a 0° rudder angle).
In addition, the ship’s speed was limited to the NCR in consideration of the ship’s operational conditions, the sea states, and the ship’s seaworthiness.

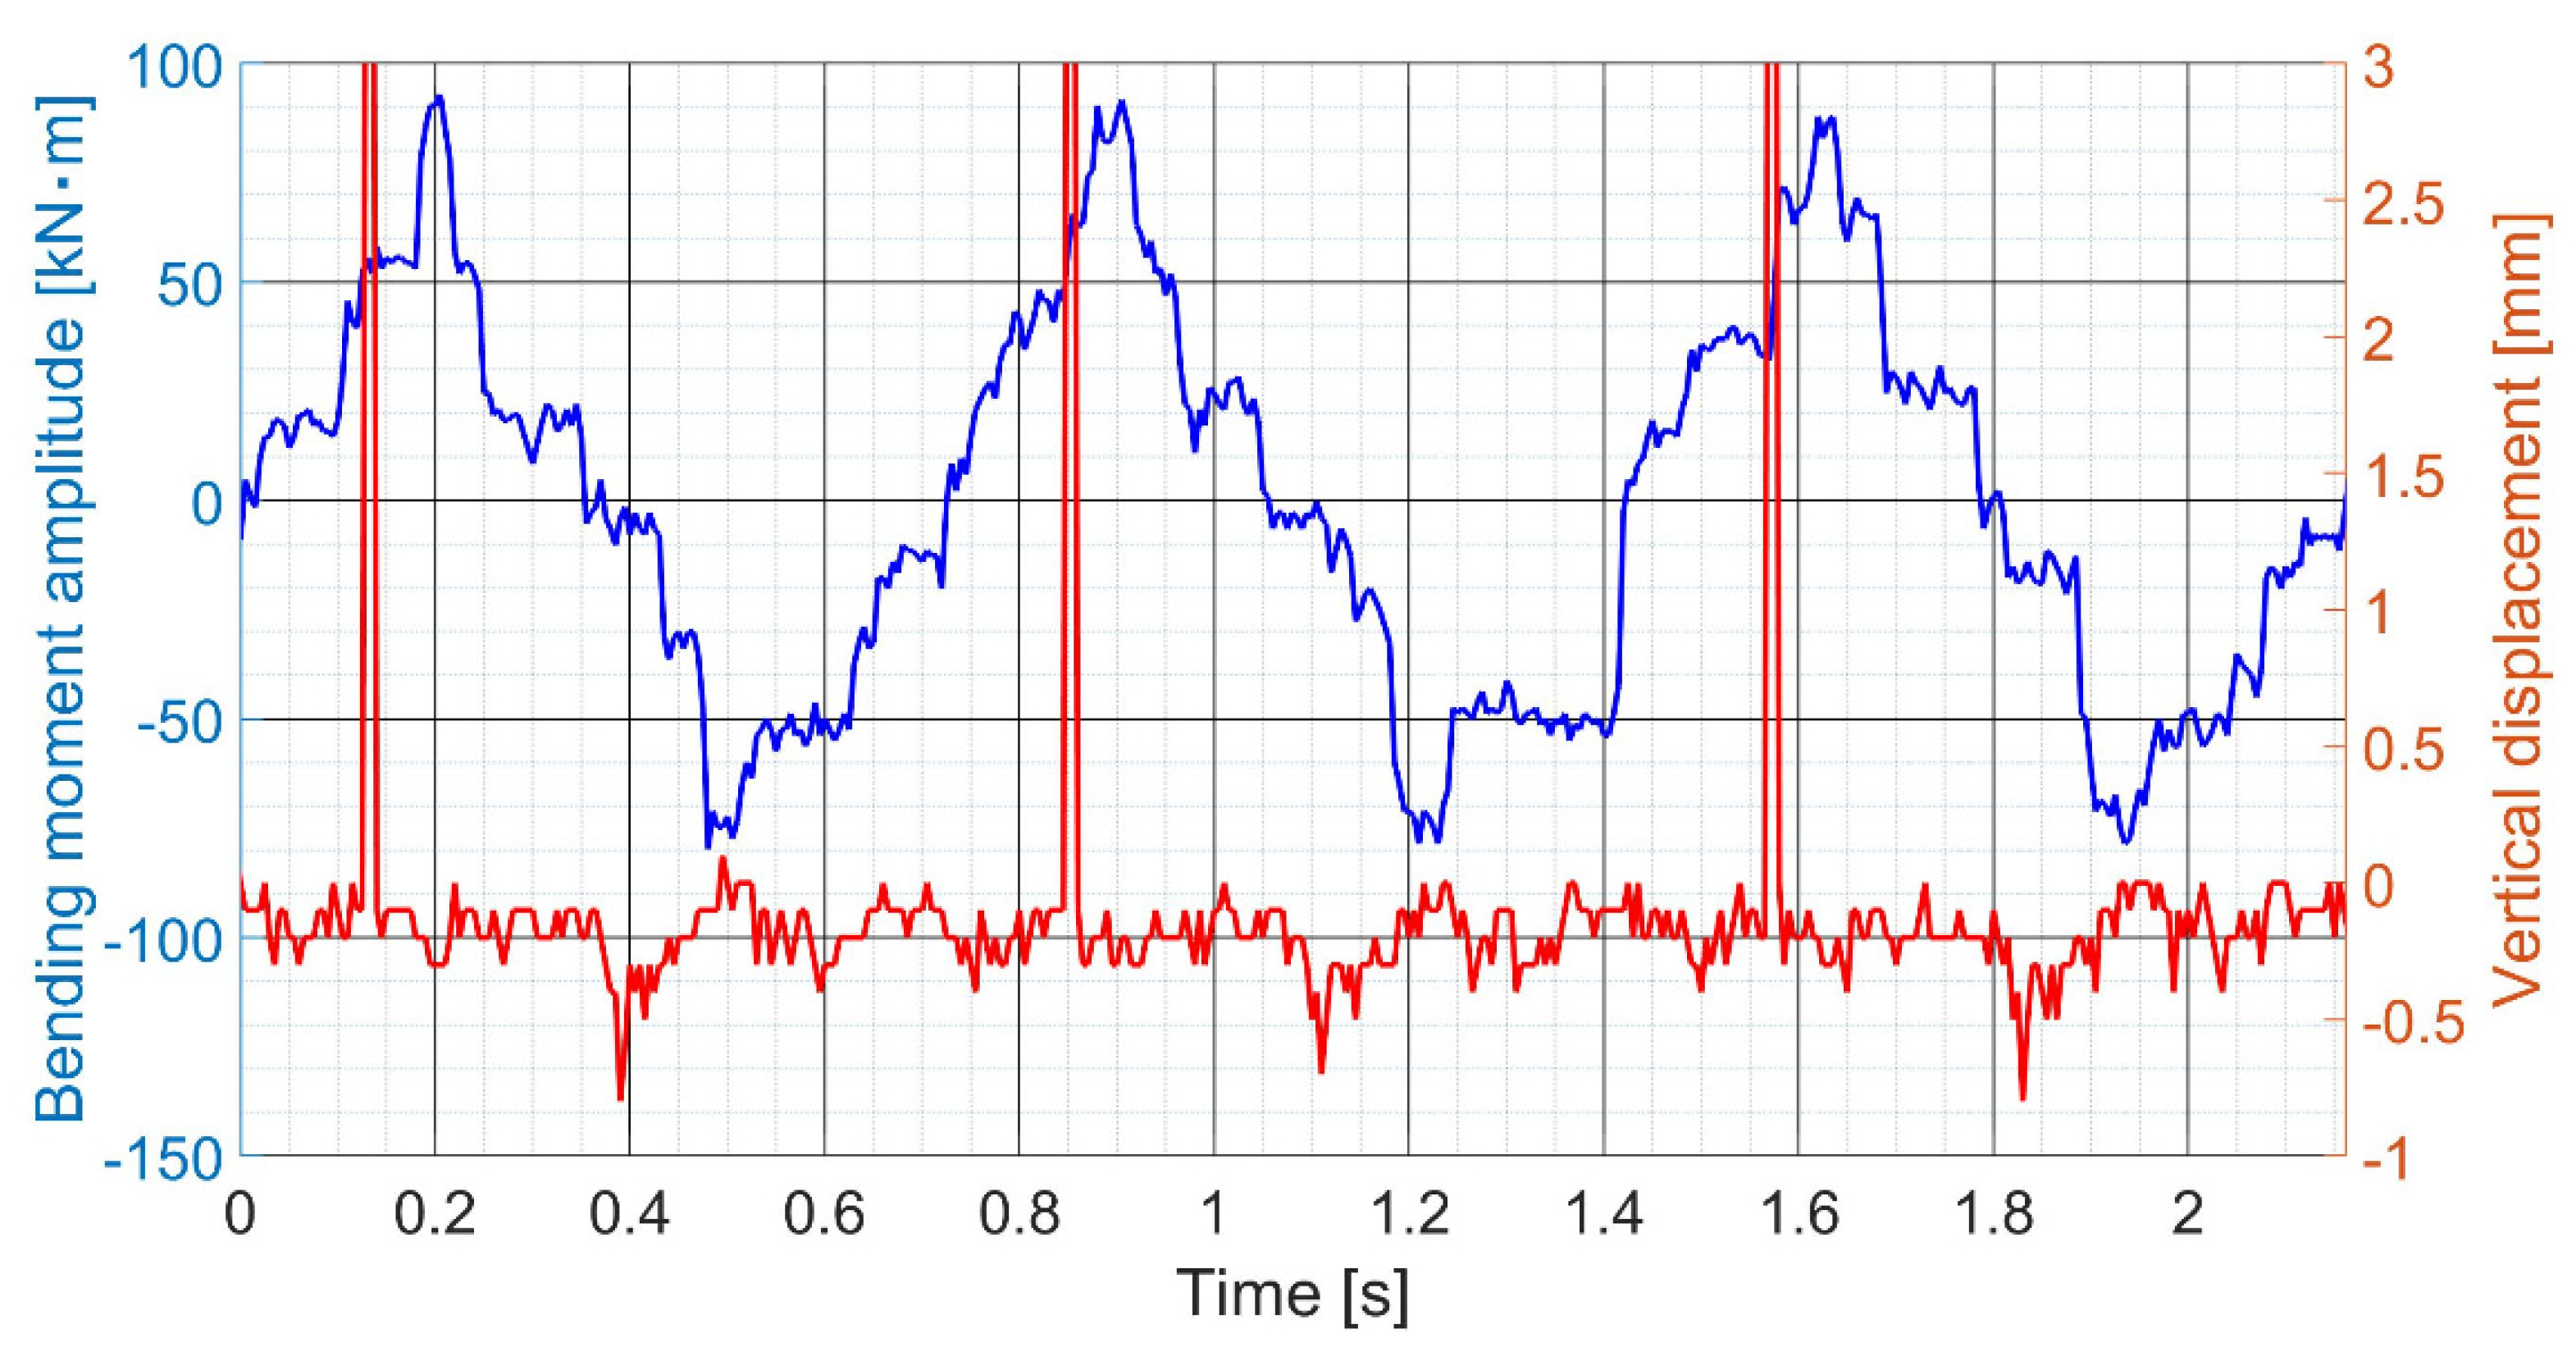
2.3.3. Processing of Raw Signals

The measurement data received from the strain gauge were used as basic information to obtain the amplitude and direction (bending angle) of bending moments that were subjected to the engine loads in the shaft cross-section where the gauges were installed. The bending moments at the position of the strain gauge were obtained by using the measured strain (ε) as described in Figure 8.
In Figure 8, the signal received from the displacement sensor includes the tacho-component for detecting the rotating angle as well as the rotating speed of the shaft. The laser maker is located at 40° before the position of the strain gauge. As a result, the extracted signal was required to undergo a smoothing process to acquire proper displacement values as shown in Figure 9.
Figure 9 shows the waveform of the local bending moment, M s , at the position of the strain gauge. The magnitude of the nominal bending moment for the cross-section (it is now shortened to the bending moment) can be simply determined as follows:
  • Read the local bending moment directly from the measured strain during one revolution;
  • Determine the maximum and minimum values;
  • Obtain the bending moment as half of the peak-to-peak amplitude ((max − min)/2) as described in Equation (5).
The above algorithm is very convenient and precise for a pure sine wave, or a wave that is close to a sine wave, such as in a static slow shaft turning test (using turning gear). The accuracy is sufficient in the case of a complex signal in a dynamic test. In fact, the signal waveform is the result of the summation of many separate sine waves. By using the fast Fourier transform (FFT), it is possible to distinguish the vibrations of separate orders. The magnitude of the bending moment, M b , and the bending angle, λ , are determined as the magnitude and the phase of the first-order vibration. In this way, the bending moment can be obtained for every revolution. Therefore, the bending moments of the separate vertical and horizontal components can be obtained using Equations (6) and (7), respectively. This process enables us to understand the general trends in the bending direction of the shaft.
Therefore, through the use of these two methods, it is possible to cross-validate the behavior of the shaft occurring during the ship’s operation.

3. Results

This section summarizes the main results obtained in the dynamic transient state by the methods and procedures described in the previous section.

3.1. Fully Laden (FL) Condition

First, regarding the rapid port turn test as shown in Figure 10, both the amplitude of the bending moment and the bending direction changed during the turn compared with going straight ahead.
The increase and the decrease in the amplitude of the port and starboard turns compared with going straight ahead within the same period appear to be directly affected by the change in the stern’s wakefield due to the turn.
Using Equations (7) and (8), from the amplitude of the bending moment and the bending direction as shown in Figure 10, the vertical component of the bending moment was obtained as shown in Figure 11 in the comparison with the vertical displacement while the horizontal component is shown in Figure 12. In the same manner, the results of the rapid starboard turn test are depicted in Figure 13, Figure 14 and Figure 15.
Next, using the horizontal and vertical components shown in Figure 11 and Figure 12 and Figure 14 and Figure 15 as the x-axis and y-axis, respectively, the average value trajectories of the straight/port and straight/starboard turns were obtained and are shown in Figure 16 and Figure 17, respectively.
As presented in Figure 16 and Figure 17, the trajectory plot obtained from Figure 11, Figure 12, Figure 14 and Figure 15 provides another perspective to help us understand the actual shaft movement.
It can be clearly seen how the fluctuating propeller forces directly have an effect on the shaft’s movement while the ship is turning, and it is easy to compare it with the NCR going straight ahead case or the rapid port turn case or vice versa.
It is worth noting that the moment behavior of the shaft shifts downward (counterclockwise) during the port turn compared with going straight ahead, while it shifts upward (clockwise) during the starboard turn, and the opposite trend can be seen.
As described above, the reason for the opposite pattern of the shaft behavior is that the formation of the wakefield is completely different at the rear of the stern tube depending on the rudder angle.
These results were cross-validated with the shaft displacement values obtained from the displacement sensor during the same period as shown in Figure 18.
Through this, it can clearly be seen that the shaft behavior compared with going straight ahead shows a high degree of consistency in both the direction of the bending moment and the displacement value and changes to the downward direction during the port turn and to the upward direction during the starboard turn.
For reference, the straight solid line and the straight dotted line represent the average value of the shaft’s bending moment and displacement, respectively, obtained by rotating the shaft approximately one to two times at a low speed using the turning gear while the ship was in a warm static condition. As the engine load rises to the NCR, it was observed that the degree of eccentric propeller thrust was proportional to the increase in the rotation speed.

3.2. Normal Ballast (NB) Condition

The experiments were also performed under the normal ballast condition. Using the same signal processing procedures, the bending moment amplitudes as well as the bending directions were obtained and are shown in Figure 19 for the case of a rapid port turn and Figure 20 for the case of a rapid starboard turn.
The average values of the trajectories for the going straight ahead, port turn, and starboard turn cases are shown in Figure 21 and Figure 22.
In addition, as described in Section 3.1, the axis shows a similar tendency to move downward during the port turn and upward the during starboard turn. This trend was cross-validated using the shaft’s vertical displacement as shown in Figure 23.
As described in Section 3.1, the straight solid line and the straight dotted line in Figure 23 represent the average value of the shaft’s bending moment and vertical displacement, respectively, obtained by rotating the shaft approximately one to two times using a turning gear. It can be observed that the shaft gradually rises as the eccentric propeller thrust gradually increases to the NCR.
In addition, compared with Figure 18, it can be observed that the average values of the static bending stress (80 kN∙m under the FL condition to 60 kN∙m under the NB condition) and the shaft’s vertical displacement (0.17 mm under the FL condition to −0.2 mm under the NB condition) were changed. This is due to the effect of hull deformation according to the change in the draught, and it is the result of the deformation of the shaft line depending on it [38,39,40,41].
Moreover, when taking the results together, one can observe that the shaft’s vertical bending moment and displacement values show an increase during the starboard turn under both draught conditions.
Additionally, when comparing stage (c) in Figure 18, one can also observe that the shaft continuously moves upward for a longer time under the normal ballast condition than under the fully laden condition during the starboard turn.
This means that eccentric propeller thrust fluctuations directly affect the amplitude and magnitude of the vertical load applied by the vertical component to the after-stern tube bearing that supports the shaft as discussed in Section 4. Accordingly, this acts as an important observation in terms of developing safety guidelines for ship operation.

4. Discussion

The factors that have an effect on the test results can be summarized as follows.

4.1. Eccentric Propeller Thrust Fluctuations

Eccentric propeller thrust fluctuations due to abrupt non-uniformities in the stern’s flow field under transient conditions during the vessel’s operation cause fluctuations in the bearing force.
The bearing force causes a change in the behavior of the rotating shaft in the form of displacements and bending moments.
This may act temporarily or continuously on the stern tube rear bearing with loads that may exceed the allowable values, causing fatigue and thermal damage such as wiping of the stern tube bearings.
As reviewed in previous studies [38,42,43], based on the fact that the shaft system under hull deformation satisfies the allowable values and there is no singularity in the analysis of the lateral vibration caused by the bearing force, such a transient state did not negatively affect the shaft system during a short period of time.
However, from a long-term perspective, we recommend that the research on the accurate evaluation of the effect of the bearing force on the propulsion system due to a non-uniform wake distribution be further extended.

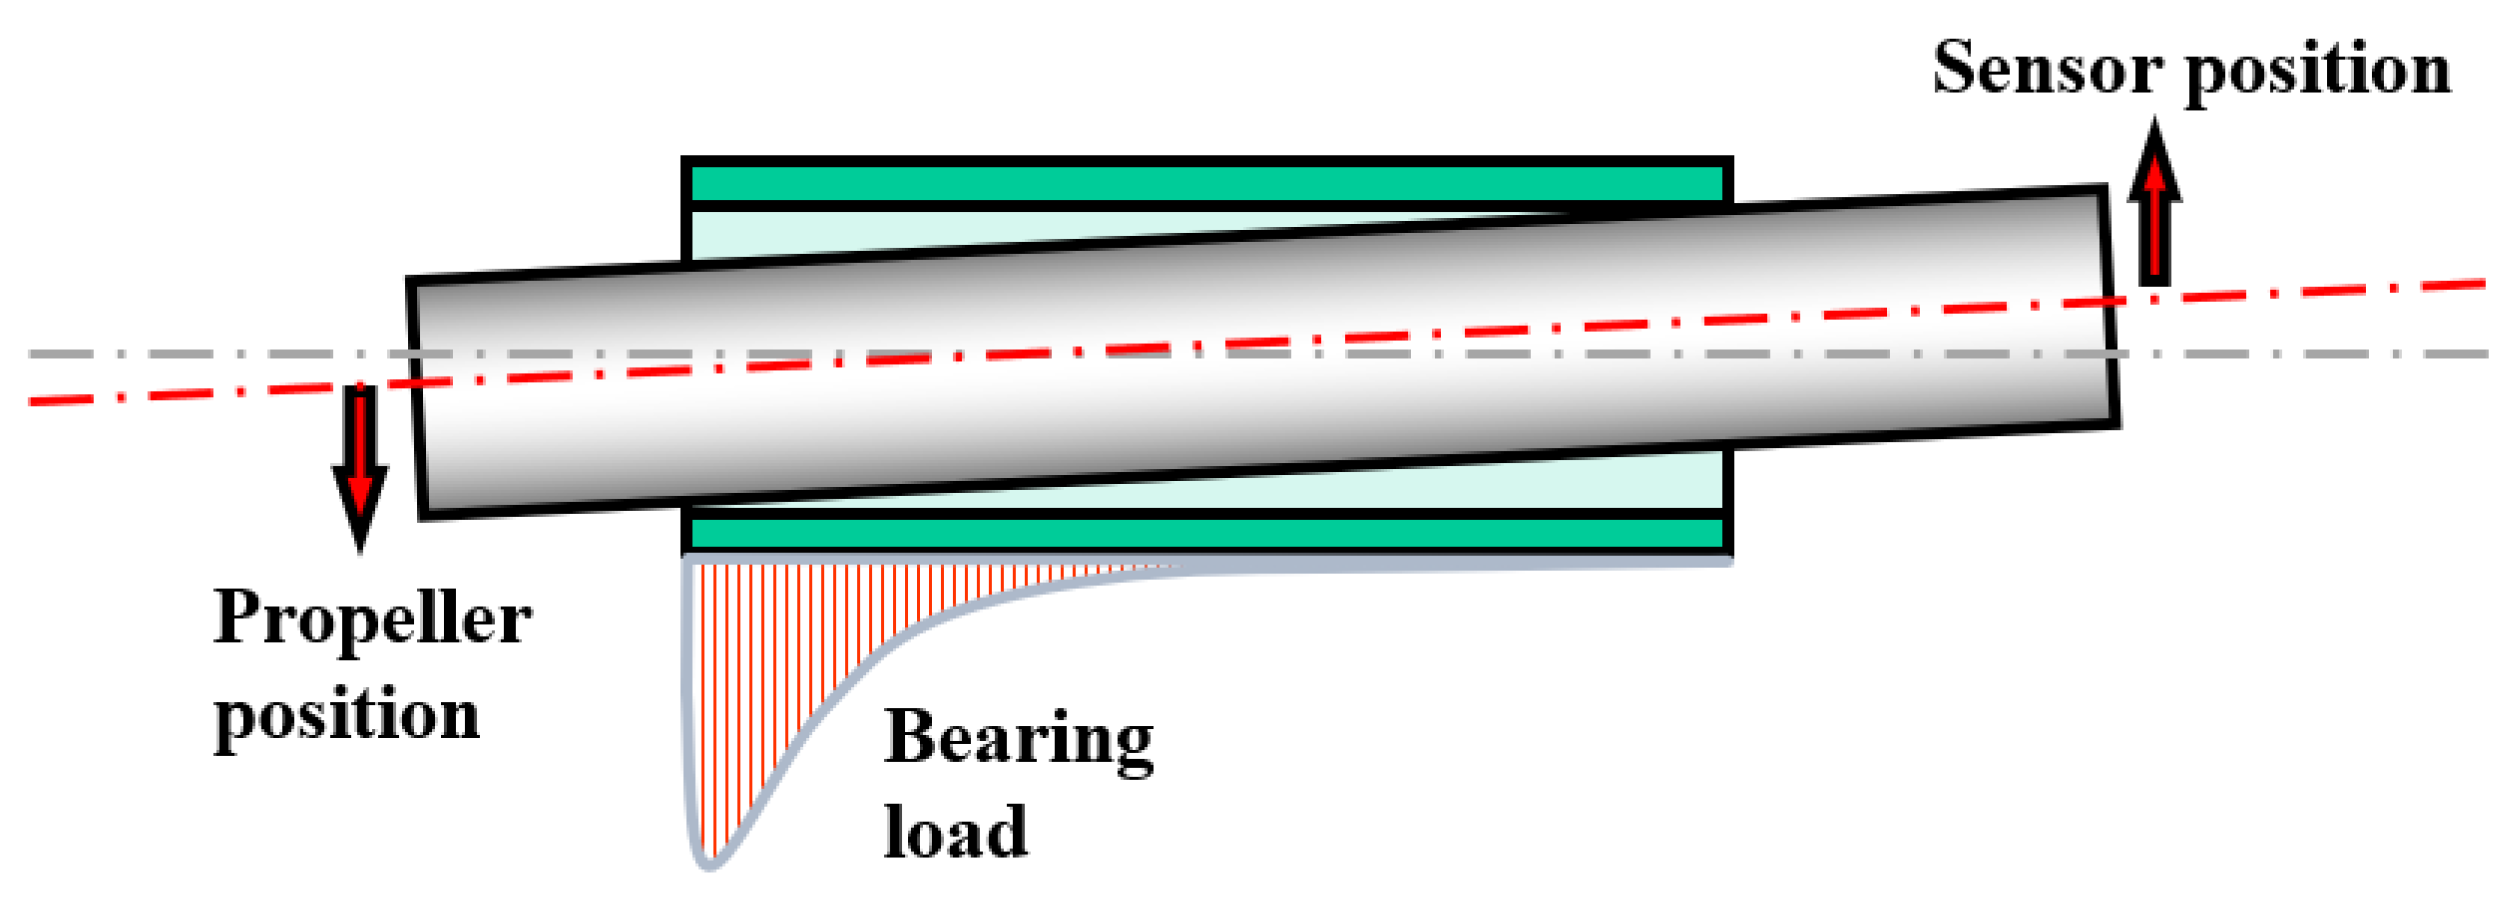
4.2. Correlation between Sensor Position and Propeller Thrust Force Generating Position

Figure 24 briefly shows the change in the displacement of the propeller shaft relative to the stern tube bearing. This describes the correlation between the shaft displacement at the forward-stern tube seal box in the engine room where the laser displacement sensor was installed and the propeller thrust force generating position.
If it is assumed that the propeller shaft is a rigid beam without deformation, the movement of the propeller’s position (the eccentric thrust force generating position) can be deductively inferred to lie in the opposite direction to the sensor position.
Therefore, while turning to the port side, the shaft of the measurement position moves downward. So, this force is transmitted as a force applied to the propeller shaft to the upward direction, which temporally relieves the stern tube bearing of the supporting loads.
On the other hand, during a starboard turn, it can be seen that the force is applied in the opposite way such that it increases the supporting load of the stern tube bearing by acting as a force that pushes down at the propeller position.
The validity of this inference regarding the shaft behavior was confirmed by its similarity to the result of the calculation of a bending moment near an actual propeller performed by Vartdal [24].
In summary, it can be observed that the reaction force state of the stern tube bearing is relieved during a port turn and deteriorates during a starboard turn when compared with going straight ahead.
Additionally, it can be seen that the after-stern tube bearing reaction force continuously increases for a longer period of time under the normal ballast condition compared with the fully laden draught condition.
Therefore, we recommend that ships avoid making a rapid starboard turn under normal ballast draught conditions.
The shaft’s moment behavior was determined to fluctuate in the clockwise and counterclockwise directions; however, the measurement of only the vertical displacement of the shaft can be seen as a limitation of this study from the point of view of complete cross-validation. This limitation needs to be supplemented through additional studies.
The key finding of this study is that, even with the same starboard turn, a greater load is applied to the stern tube bearing under ballast conditions compared with fully laden conditions. In addition, the correlation between bending moment and displacement was determined (Figure 23) under the normal ballast condition and was found to be much more consistent than in the Figure 18 case of the fully laden condition. The reason for this is probably the eccentric propeller thrust fluctuation. This could be a significant contribution to the literature, as the conventional quasi-static analysis methods cannot yield these results.
Despite its limitations, this study is meaningful. Through our experiments, we found that, at present, the key reasons for bearing damage are not sufficiently considered during propulsion shaft system engineering in a transient state. We also discovered that, even with the same starboard turn, a greater load is applied to the stern tube bearing under the ballast condition compared with the fully laden condition. We believe that this could be a significant contribution to the literature, as the conventional quasi-static analysis methods cannot yield these results.
In particular, this study offers an insight into the overload of the bearing support load as it reproduced the same situation at the time of the accident with an identical ship, which may help with the development of guidelines for increasing the stability of the shafting system for similar vessels in the future.

5. Conclusions

This study successfully cross-validated the effect of eccentric propeller thrust fluctuations on the shaft behavior in the case of excessive dynamic conditions through strain gauges and displacement sensors.
The shaft measurement was performed under two conditions (FL and NB), and the following results were obtained regarding the effects of the hydrodynamic force of the propeller that was generated during port and starboard turns on the behavior of the shaft system.
(1)
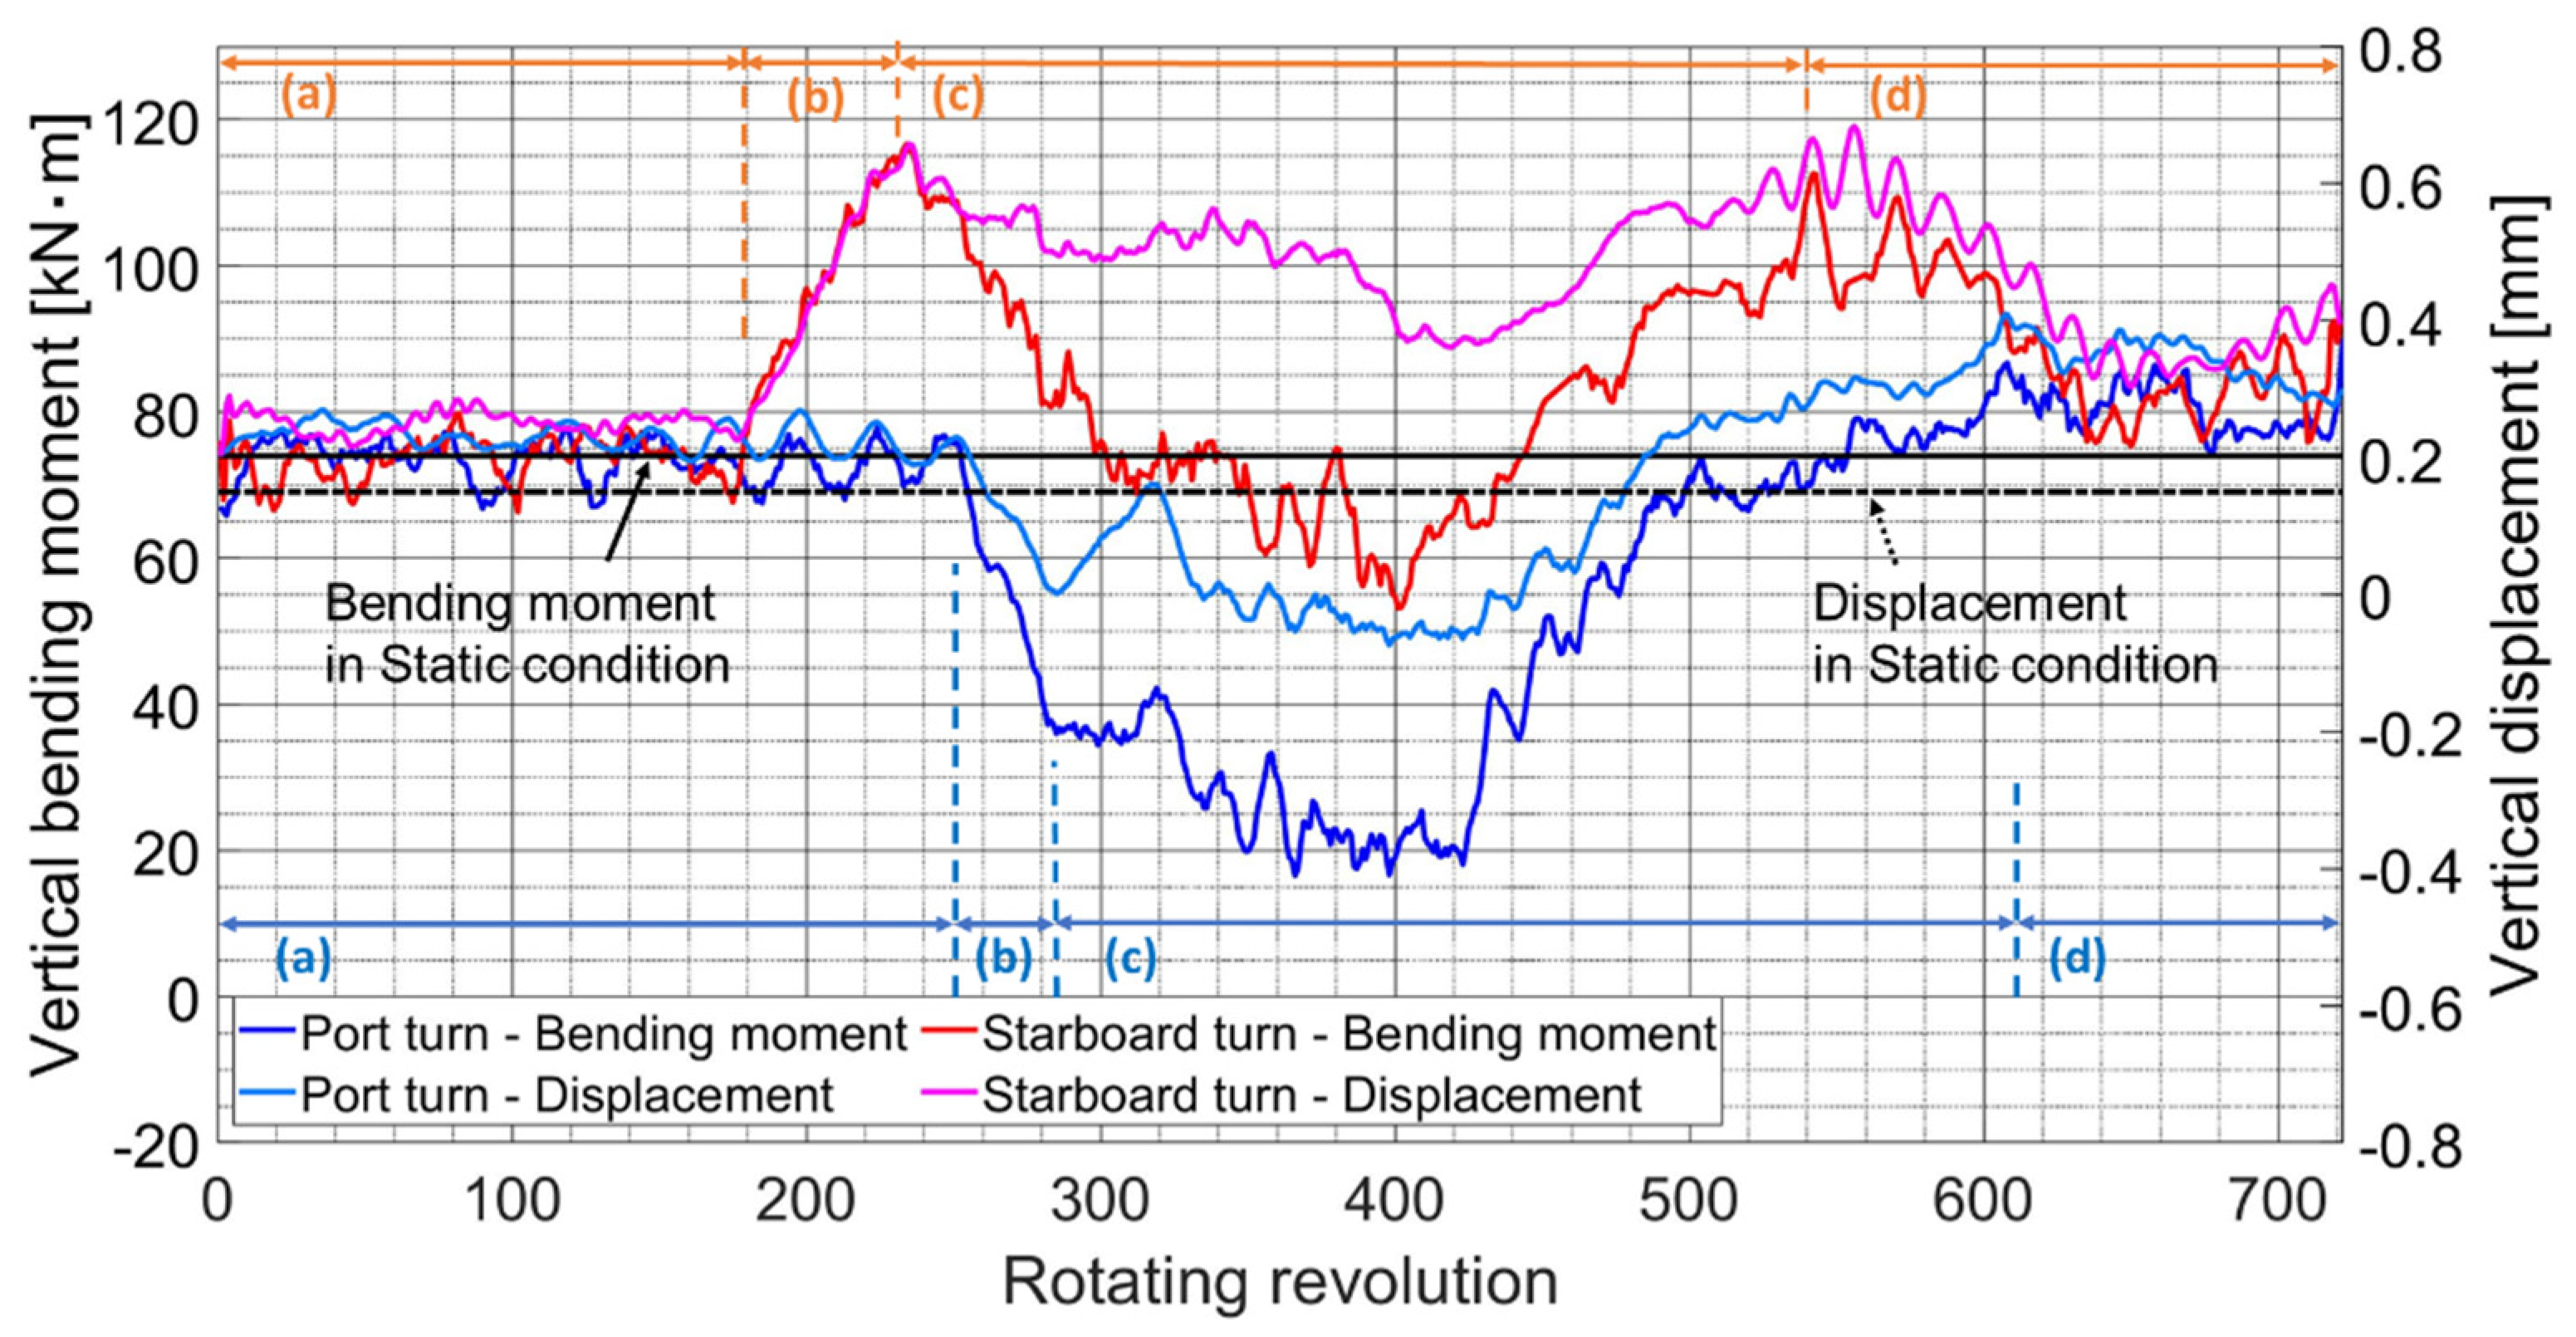
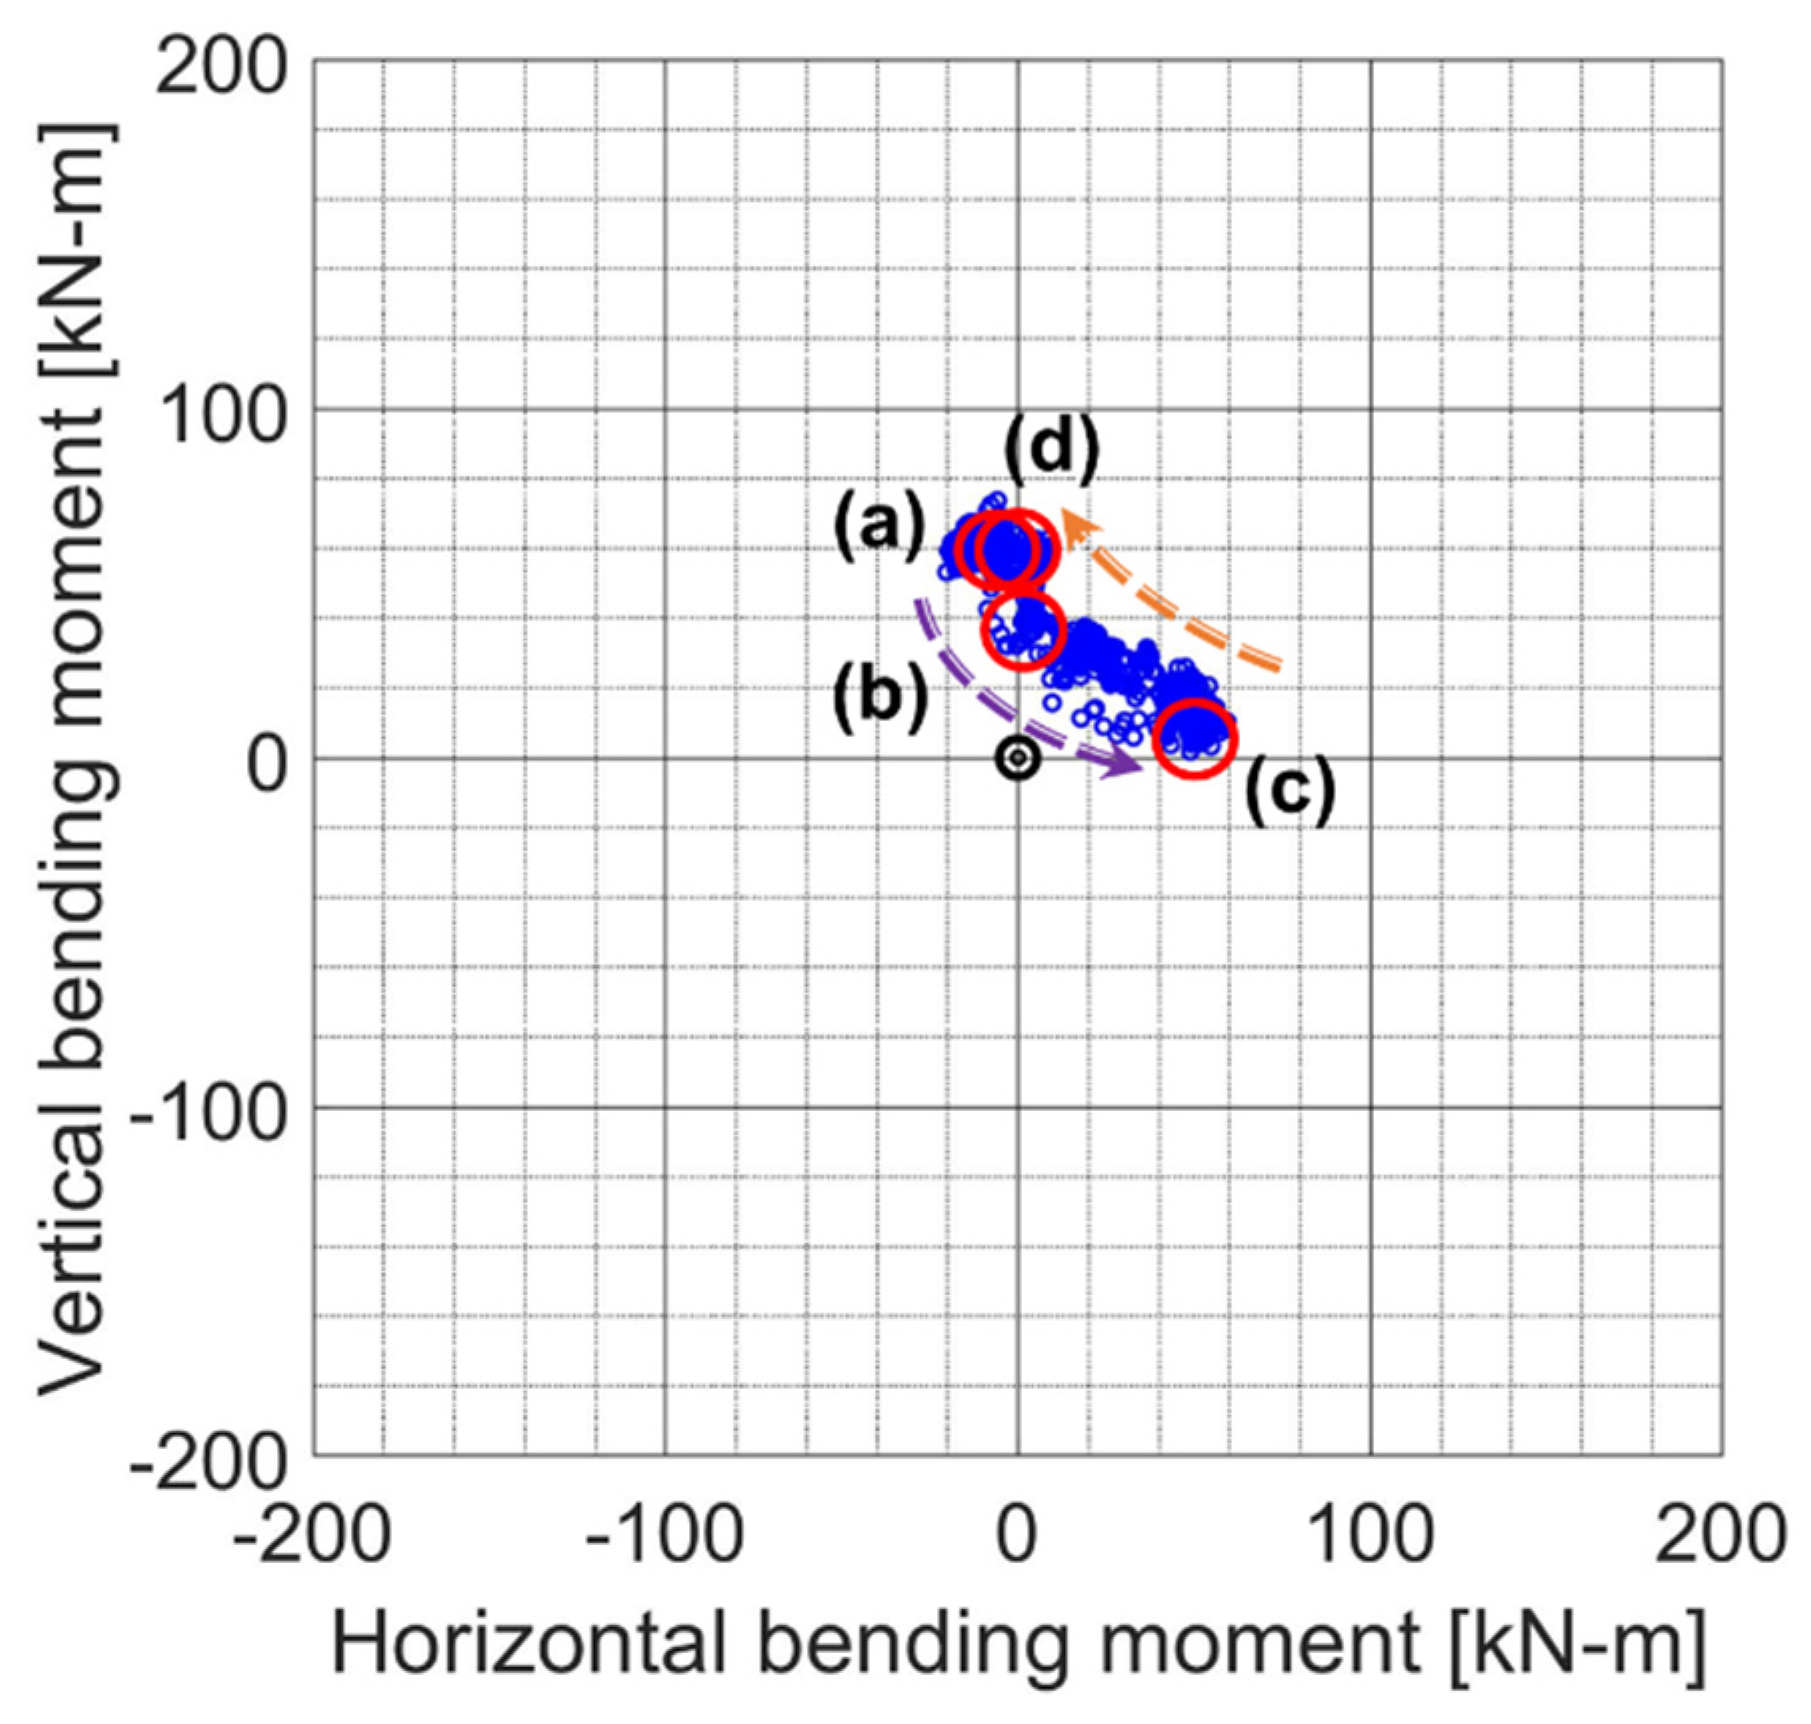
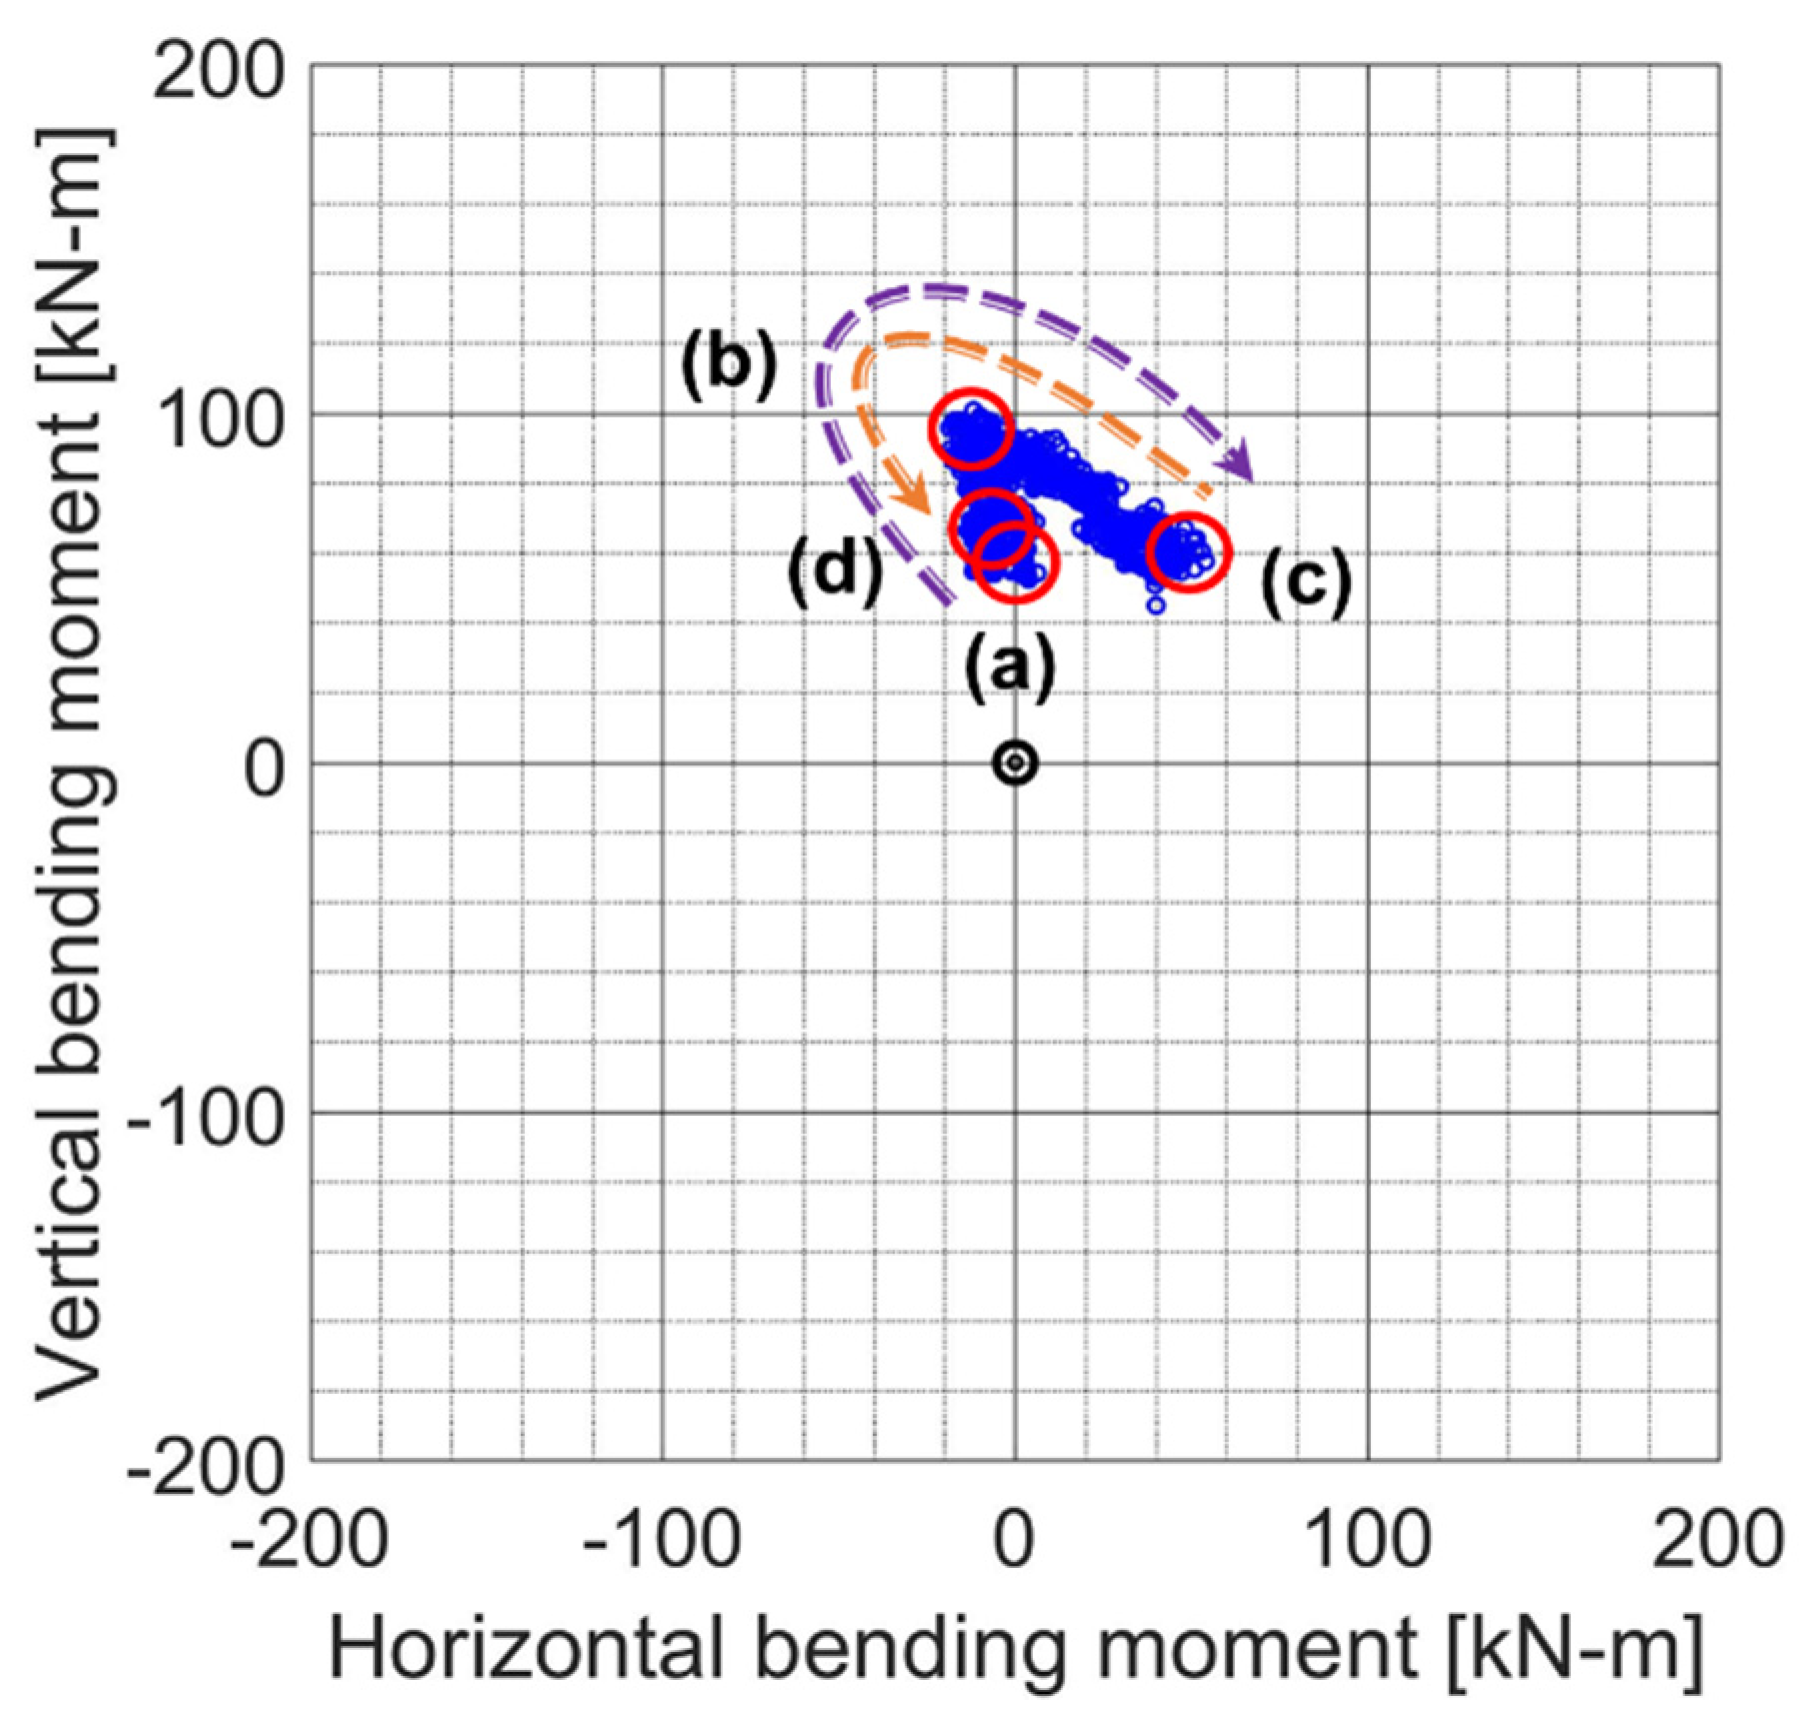
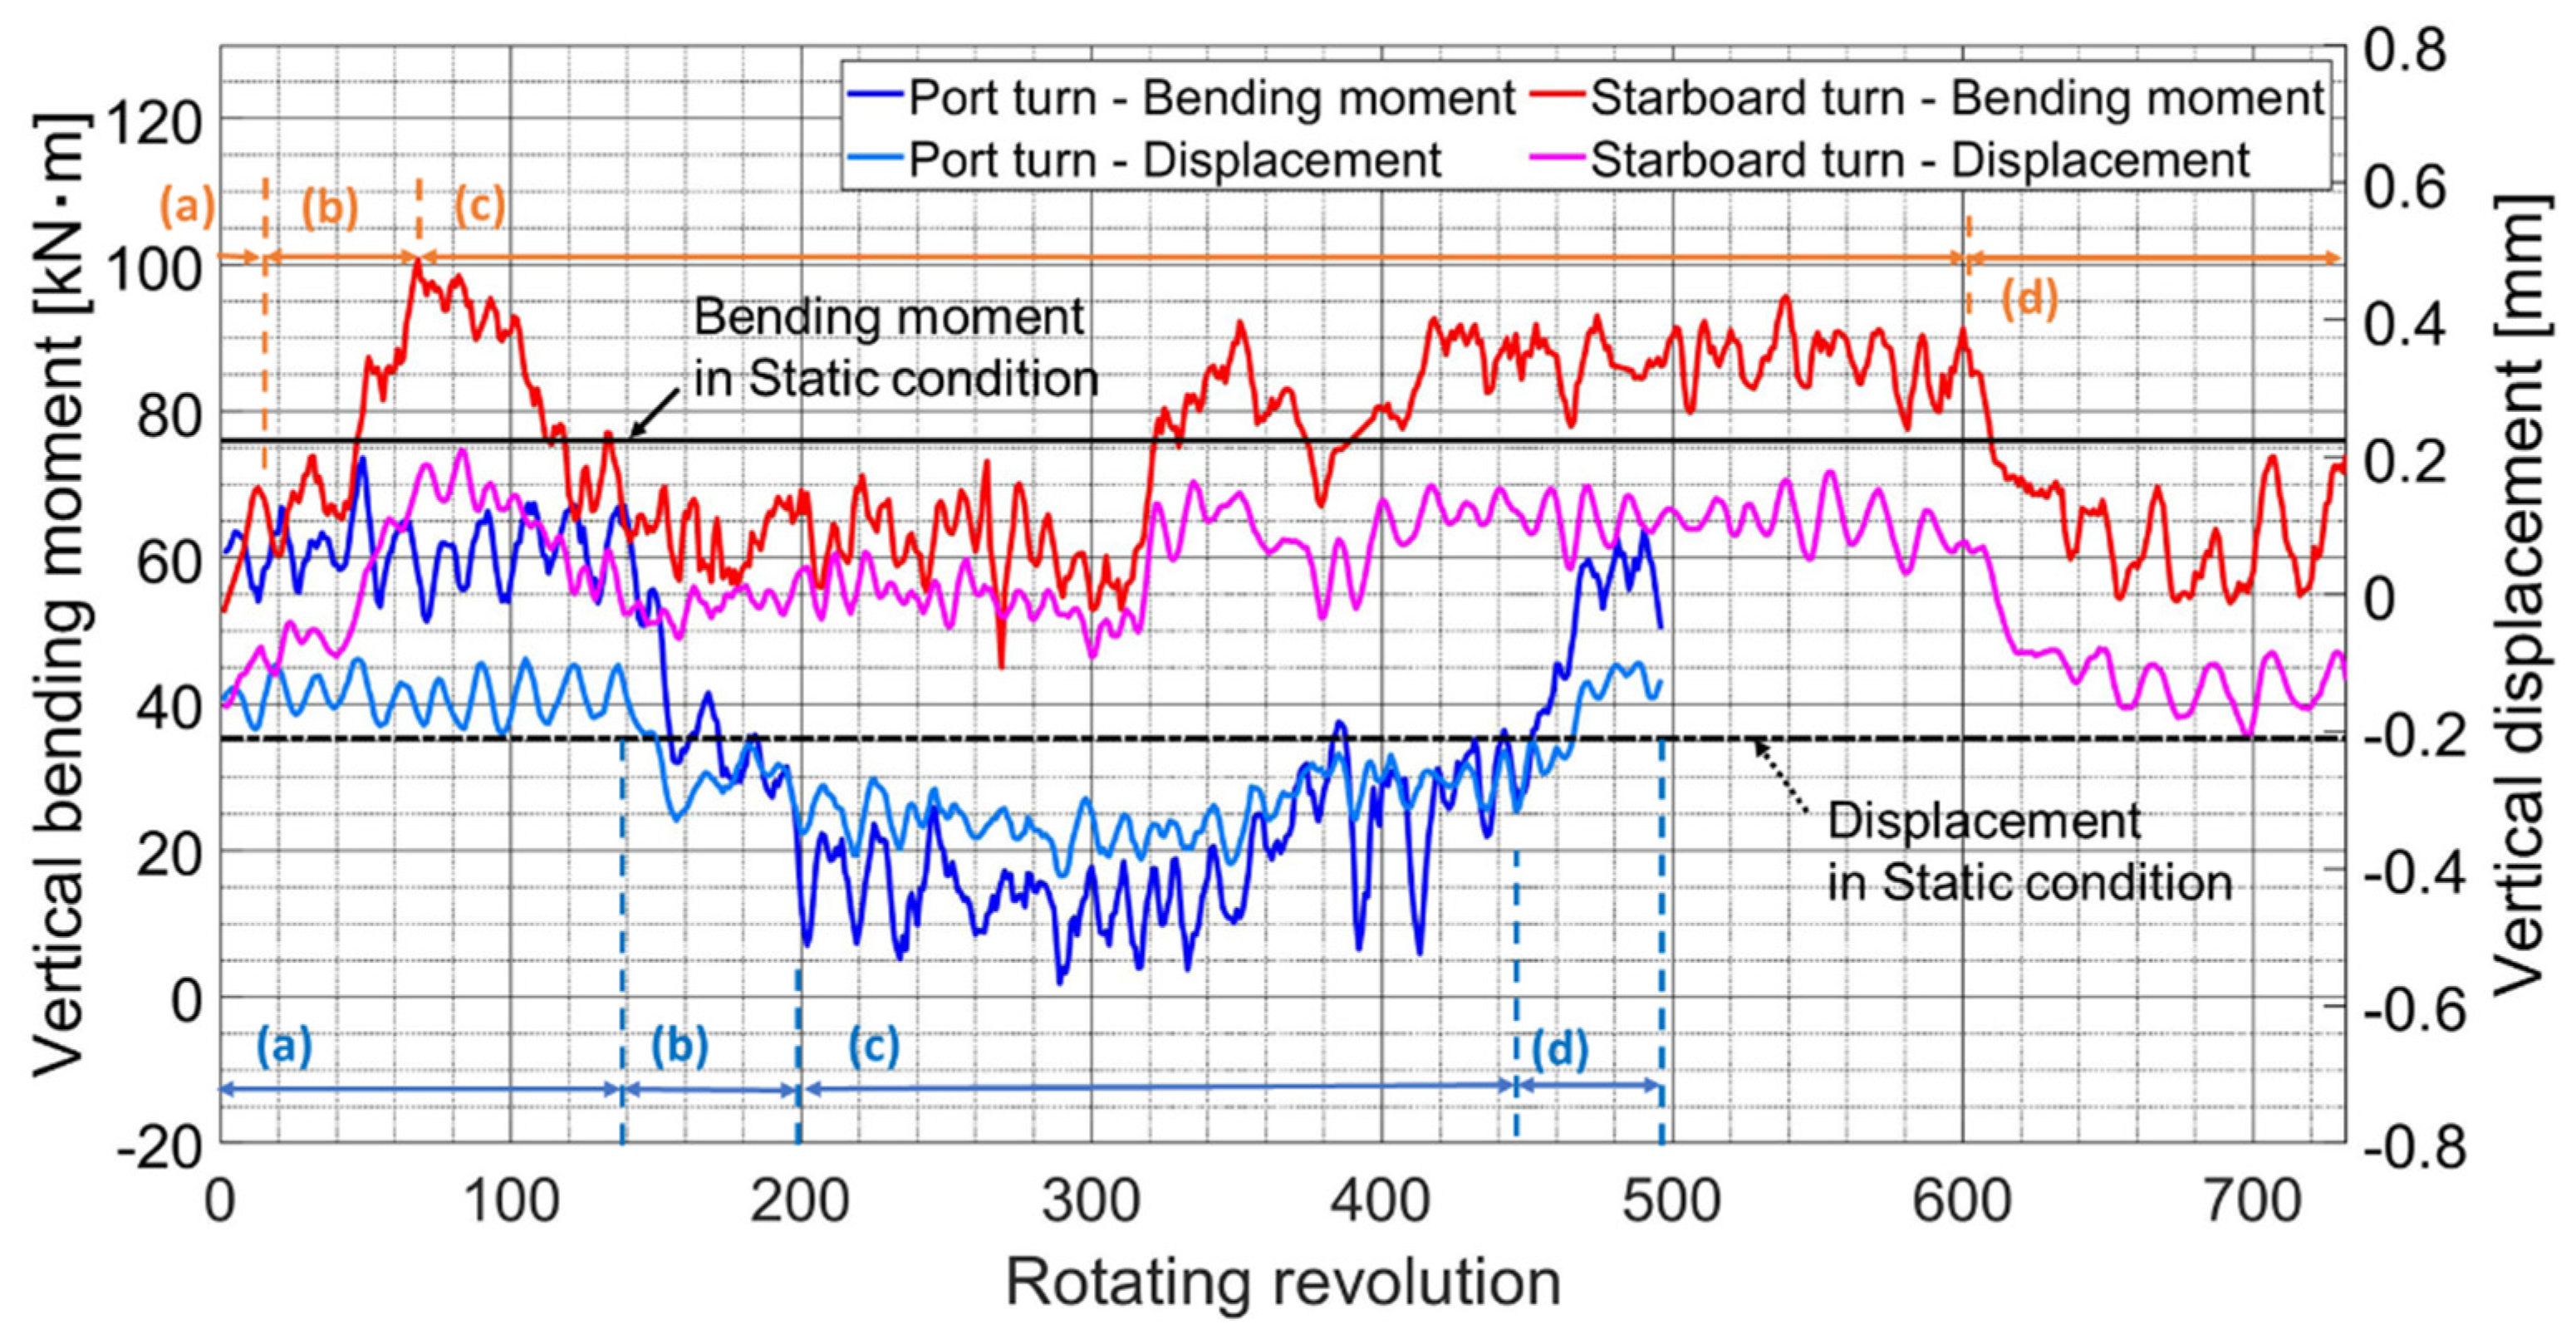
The moment behavior of the shaft shifted downward in the counterclockwise direction during the port turn compared with going straight ahead, while it shifted upward in the clockwise direction during the starboard turn, and the opposite trend could be observed.
  • The reason why the shaft behavior patterns were contrary to each other is that the formation of the wake field at the rear of the stern tube would be completely different depending on the rudder angle.
  • This was cross-validated using the shaft’s vertical displacement value obtained from the displacement sensor. However, we were unable to measure the vertical displacement due to the limited number of sensor applications. Given that the shaft’s moment behavior varies in the clockwise and anticlockwise directions, further studies with enhanced sensing applications should be performed to improve the accuracy.
(2)
The shaft continuously moved upward for a longer period of time under the normal ballast condition compared with the fully laden condition during starboard turns.
  • Therefore, we recommend that ships avoid rapid starboard turns under ballast draught conditions in terms of securing the stability of the shafting system.
  • Moreover, from a long-term perspective, we recommend that the research on evaluating the effect of the bearing force on the shafting system due to a non-uniform wake distribution be further extended.
(3)
The key finding of this study is that, even with the same starboard turn, a greater load is applied to the stern tube bearing under ballast conditions compared with fully laden conditions. This could be a significant contribution to the literature, as the conventional quasi-static analysis methods cannot yield these results.
In particular, this study offers a meaningful insight into the causes of the overload of bearing loads in the transient operating state as it reproduced the same situation at the time of the accident with the same type of vessel. Furthermore, we expect that the results of this study will be used in the development of the health monitoring algorithms required for autonomous ships in the future, and they may also help with the development of guidelines for improving the stability of systems in related industries.

Author Contributions

J.-W.L. and J.-u.L. contributed equally to this work. Conceptualization, J.-W.L. and J.-u.L.; methodology, J.-u.L. and Q.D.V.; software, Q.D.V.; validation, J.-W.L. and J.-u.L.; formal analysis, J.-W.L. and J.-u.L.; investigation, J.-W.L. and Q.D.V.; resources, J.-u.L.; data curation, Q.D.V.; writing—original draft preparation, J.-W.L., Q.D.V. and J.-u.L.; writing—review and editing, B.J. and J.-u.L.; visualization, Q.D.V. and J.-W.L.; supervision, B.J. and J.-u.L.; project administration, J.-u.L.; funding acquisition, J.-u.L. All authors have read and agreed to the published version of the manuscript.

Funding

This work was supported by a National Research Foundation of Korea (NRF) grant funded by the Korean government (MSIT) (No. NRF-2021R1F1A1047115). This research was supported by the ‘Development of Autonomous Ship Technology (20200615)’ project funded by the Ministry of Oceans and Fisheries (MOF, Korea).

Institutional Review Board Statement

Not applicable.

Informed Consent Statement

Not applicable.

Data Availability Statement

Not applicable.

Acknowledgments

This research was supported by the BB21plus project funded by Busan Metropolitan City and the Busan Institute for Talent and Lifelong Education (BIT).

Conflicts of Interest

The authors declare no conflict of interest.

References

  1. Michel, R. A quarter century of propulsion shafting design practice and operating experience in the US navy. J. Am. Soc. Nav. Eng. 1959, 71, 153–164. [Google Scholar] [CrossRef]
  2. Lehr, W.; Parker, E. Considerations in the design of marine propulsion shaft systems. Soc. Nav. Archit. Mar. Eng. 1961, 67, 555. [Google Scholar]
  3. Mann, G. Design of propulsion shaft systems using fair curve alignment theory. Nav. Eng. J. 1964, 76, 851–862. [Google Scholar]
  4. Mann, G. Analysis of shafting problems using fair curve alignment theory. Nav. Eng. J. 1965, 77, 117–133. [Google Scholar] [CrossRef]
  5. Mann, G. Shipyard alignment of propulsion shafting using fair curve alignment theory. Nav. Eng. J. 1965, 77, 651–659. [Google Scholar] [CrossRef]
  6. Jeon, H.-J.; Park, J.-G.; Choi, J.-S. Optimum alignment of marine engine shaftings by the finite element method. J. Korean Soc. Mar. Eng. 1978, 2, 3–14. [Google Scholar]
  7. Moon, D.; Jeon, H. A study on the propulsion shaft alignment calculation by the matrix method of three-moment theory. J. Korean Soc. Mar. Eng. 1981, 5, 20–27. [Google Scholar]
  8. Park, T.-I.; Lee, H.-Y. Alignment Calculation of Marine Engine Shafting System by Quadruple Integration Method. J. Korean Soc. Mar. Eng. 1979, 3, 32–39. [Google Scholar]
  9. Larsen, O. Some considerations of marine shafting design. Ind. Lubr. Tribol. 1981, 33, 164–171. [Google Scholar] [CrossRef]
  10. Class NK. Guidelines on Shafting Alignmen; Class NK: Tokyo, Japan, 2006. [Google Scholar]
  11. MAN Energy Solutions. Final Alignment of Engine on Board; MAN Energy Solutions: Augsburg, Germany, 2014; p. 5. [Google Scholar]
  12. MAN Energy Solutions. Bearing Load Measurement by Jacking Up; MAN Energy Solutions: Augsburg, Germany, 2012; p. 23. [Google Scholar]
  13. Shin, S.; Choe, I. Pressure Distribution Analysis for After Bush Bearing of Ship Propulsion Shaft. J. Soc. Nav. Archit. Korea 2004, 41, 35–40. [Google Scholar]
  14. Choung, J.-M.; Choe, I.-H. Development of elastic shaft alignment design program. J. Soc. Nav. Archit. Korea 2006, 43, 512–520. [Google Scholar]
  15. Kozousek, V.; Davies, P. Analysis and Survey Procedures of Propulsion Systems: Shaft Alignment; Lloyd’s Register’s Technical Association: London, UK, 2000; p. 5. [Google Scholar]
  16. DNV. DNVGL-RU-SHIP Pt. 4, Ch. 2, Sec. 4, 2.1.6 Aft Most Bearing Lubrication Criteria; DNV: Greater Oslo, Norway, 2021; pp. 36–40. [Google Scholar]
  17. Sun, J.-S.; Kim, Y.-G.; Kim, U.-K. Study on shaft alignment of propulsion shafting system depending on single reaction force supporting position of aft stern tube bearing. J. Mar. Sci. Technol. 2021, 26, 1340–1357. [Google Scholar] [CrossRef]
  18. Bureau Veritas. Elastic Shaft Alignment(ESA). In Sec 2. 5. Running Calculations; Bureau Veritas: Neuilly sur Seine, France, 2015; Volume NR 592, pp. 13–18. [Google Scholar]
  19. Park, G.; Koh, C.; Chung, J.; Nam, G.; Chae, J. A Study on the Stern Bearing Damage and Shaft Alignment for 37K DWT Product/Chemical Tanker. J. Soc. Nav. Archit. Korea 2021, 58, 97–104. [Google Scholar] [CrossRef]
  20. Saitoh, T. Dynamic alignment taking account of propeller forces and stern tube bearing performances. J. MESJ 1983, 18, 142–153. [Google Scholar] [CrossRef]
  21. Kuroiwa, R.; Oshima, A.; Nishioka, T.; Tateishi, T.; Ohyama, K.; Ishijima, T. Reliability improvement of stern tube bearing considering propeller shaft forces during ship turning. Mitshbishi Heavy Ind. Ltd. Tech. Rev. 2007, 44, 1–3. [Google Scholar]
  22. Sugimoto, I.; Baba, S.; Yatsuo, M.; Tanaka, H. Development of the criteria for crankshaft alignment in large 2-stroke marine diesel engines. In Proceedings of the Conference Publication of 23rd CIMAC World Congress on Combustion Engine Technology for Ship Propulsion, Power Generation, Rail Traction, Hamburg, Germany, 7–10 May 2001. [Google Scholar]
  23. Ortolani, F. Dubbioso, G. Experimental investigation of blade and propeller loads: Steady turning motion. Appl. Ocean. Res. 2019, 91, 101874. [Google Scholar] [CrossRef]
  24. Vartdal, B.J.; Gjestland, T.; Arvidsen, T.I. Lateral propeller forces and their effects on shaft bearings. In Proceedings of the First International Symposium on Marine Propulsors, Trondheim, Norway, 22–24 June 2009; pp. 475–481. [Google Scholar]
  25. Dubbioso, G.; Muscari, R.; Ortolani, F.; Di Mascio, A. Analysis of propeller bearing loads by CFD. Part I: Straight ahead and steady turning maneuvers. Ocean. Eng. 2017, 130, 241–259. [Google Scholar] [CrossRef]
  26. Muscari, R.; Dubbioso, G.; Ortolani, F.; Di Mascio, A. Analysis of propeller bearing loads by CFD. Part II: Transient maneuvers. Ocean. Eng. 2017, 146, 217–233. [Google Scholar] [CrossRef]
  27. Shin, S.-H. Effects of Propeller Forces on the Propeller Shaft Bearing during Going Straight and Turning of Ship. J. Soc. Nav. Archit. Korea 2015, 52, 61–69. [Google Scholar] [CrossRef] [Green Version]
  28. Lee, J.-U. Application of strain gauge method for investigating influence of ship shaft movement by hydrodynamic propeller forces on shaft alignment. Measurement 2018, 121, 261–275. [Google Scholar] [CrossRef]
  29. Choi, S.-P.; Lee, J.-U.; Park, J.-B. Application of Deep Reinforcement Learning to Predict Shaft Deformation Considering Hull Deformation of Medium-Sized Oil/Chemical Tanker. J. Mar. Sci. Eng. 2021, 9, 767. [Google Scholar] [CrossRef]
  30. Takahashi, S.; Matsumoto, S.; Tateishi, T.; Ohyama, K.; Kuroiwa, R.; Morohoshi, S. Study on oil film analysis of the stern tube bearing under the conditions of dynamic propeller shaft forces. Jpn. Soc. Mech. Eng. Trans. C 2009, 75, 3054–3061. [Google Scholar] [CrossRef] [Green Version]
  31. Song, G.; Park, H.; Lee, T. The Effect of Rudder Existence on Propeller Eccentric Force. J. Mar. Sci. Eng. 2019, 7, 455. [Google Scholar] [CrossRef] [Green Version]
  32. Lin, J.-F.; Zhao, D.-G.; Guo, C.-Y.; Su, Y.-M.; Zhong, X.-H. Comprehensive test system for ship-model resistance and propulsion performance in actual seas. Ocean. Eng. 2020, 197, 106915. [Google Scholar] [CrossRef]
  33. Wontka, L. In Service Diagnosing of a Marine Diesel Engine usion Mean Indicated Pressure. Sci. J. Gdyn. Marit. Univ. 2018, 108, 153–167. [Google Scholar] [CrossRef]
  34. Wróblewski, P.; Iskra, A. Problems of Reducing Friction Losses of a Piston-Ring-Cylinder Configuration in a combustion Piston Engine with an Increased Isochoric Pressure Gain. In SAE Technical Paper 2020-01-2227; 2020; Available online: https://saemobilus.sae.org/content/2020-01-2227/ (accessed on 9 May 2022).
  35. Forrest, A.W., Jr.; Labasky, R.F. Shaft Alignment Using Strain Gages. Mar. Technol. 1981, 18, 276–284. [Google Scholar] [CrossRef]
  36. ABS. Guide for Enhanced Shaft Alignment; American Bureau of Shipping: Houston, TX, USA, 2018; pp. 6–12. [Google Scholar]
  37. ABS. Guidance Notes on Propulsion Shafting Alignment; American Bureau of Shipping: Housto, TX, USA, 2019; pp. 107–110. [Google Scholar]
  38. Lee, J.-U. A study of the analysis of shaft alignment considering hull deflections for 50,000 DWT oil/chemical tankers. J. Korean Soc. Mar. Eng. 2016, 40, 191–197. [Google Scholar]
  39. Seo, C.-O.; Jeong, B.; Kim, J.-R.; Song, M.; Noh, J.-H.; Lee, J.-U. Determining the influence of ship hull deformations caused by draught change on shaft alignment application using FE analysis. Ocean. Eng. 2020, 210, 107488. [Google Scholar] [CrossRef]
  40. Shi, L.; Xue, D.; Song, X. Research on shafting alignment considering ship hull deformations. Mar. Struct. 2010, 23, 103–114. [Google Scholar] [CrossRef]
  41. Avgouleas, K.; Sarris, E.; Gougoulidis, G. Practical Aspects of Propulsion Shaft Alignment. In Proceedings of the SNAME 7th International Symposium on Ship Operations, Management and Economics, Athens, Greece, 2–3 April 2021. [Google Scholar]
  42. Lee, J.-U. A study on the analysis of bearing reaction forces and hull deflections affecting shaft alignment using strain gauges for a 50,000 DWT oil/chemical tanker. J. Korean Soc. Mar. Eng. 2016, 40, 288–294. [Google Scholar] [CrossRef]
  43. Lee, J.-U. Theoretical and experimental analysis of the lateral vibration of shafting system using strain gauges in 50,000-DWT oil/chemical tankers. J. Korean Soc. Mar. Eng. 2016, 40, 301–306. [Google Scholar]
Figure 1. Schematic diagram of the research.
Applsci 12 05041 g001
Figure 2. Shafting system of the case study ship (courtesy of the shipyard).
Applsci 12 05041 g002
Figure 3. Typical half-bridge strain gauge circuit configuration.
Applsci 12 05041 g003
Figure 4. Typical angle-domain shaft strain curve.
Applsci 12 05041 g004
Figure 5. Location of the strain gauge and laser sensor.
Applsci 12 05041 g005
Figure 6. Installation of the sensors and the telemetry system in the engine room. (a): Laser displacement sensor and strain gauge installation. (b): Strain gauge telemetry transmitter installation.
Applsci 12 05041 g006
Figure 7. Sea-trial procedure for the case study ship.
Applsci 12 05041 g007
Figure 8. Example of a measured bending moment at the position of the strain gauge and the vertical displacement before processing at the NCR going straight ahead.
Applsci 12 05041 g008
Figure 9. Example of a measured bending moment at the position of the strain gauge and the smoothed vertical displacement after processing at the NCR going straight ahead (filter type: moving average filter; span: 10).
Applsci 12 05041 g009
Figure 10. Bending moment during the port turn under the fully laden condition.
Applsci 12 05041 g010
Figure 11. Bending moment and displacement behavior in the vertical direction during the port turn under the fully laden condition.
Applsci 12 05041 g011
Figure 12. Bending moment in the horizontal direction during the port turn under the fully laden condition.
Applsci 12 05041 g012
Figure 13. Bending moment during the starboard turn under the fully laden condition.
Applsci 12 05041 g013
Figure 14. Bending moment and displacement behavior in the vertical direction during the starboard turn under the fully laden condition.
Applsci 12 05041 g014
Figure 15. Bending moment in the horizontal direction during the starboard turn under the fully laden condition.
Applsci 12 05041 g015
Figure 16. Plot of trajectories obtained during the port turn under the fully laden condition. Stage (a): Rudder angle 0-degree: NCR straight going (begin). Stage (b): Rudder angle changes from 0 to 12-degree (port). Stage (c): Rudder angle 12-degree: ship’s heading is gradually changing. Stage (d): Rudder angle 0-degree: NCR straight going (end).
Applsci 12 05041 g016
Figure 17. Plot of trajectories obtained during the starboard turn under the fully laden condition. Stage (a): Rudder angle 0-degree: NCR straight going (begin). Stage (b): Rudder angle changes from 0 to 12-degree (starboard). Stage (c): Rudder angle 12-degree: ship’s heading is gradually changing. Stage (d): Rudder angle 0-degree: NCR straight going (end).
Applsci 12 05041 g017
Figure 18. Comparison of behaviors between the port turn and the starboard turn under the fully laden condition. Stage (a): Rudder angle 0-degree: NCR straight going (begin). Stage (b): Rudder angle changes from 0 to 12-degree (port, starboard). Stage (c): Rudder angle 12-degree: ship’s heading is gradually changing. Stage (d): Rudder angle 0-degree: NCR straight going (end).
Applsci 12 05041 g018
Figure 19. Bending moment during the port turn under the normal ballast condition.
Applsci 12 05041 g019
Figure 20. Bending moment during the starboard turn under the normal ballast condition.
Applsci 12 05041 g020
Figure 21. Plot of trajectories obtained during the port turn under the normal ballast condition. Stage (a): Rudder angle 0-degree: NCR straight going (begin). Stage (b): Rudder angle changes from 0 to 12-degree (port). Stage (c): Rudder angle 12-degree: ship’s heading is gradually changing. Stage (d): Rudder angle 0-degree: NCR straight going (end).
Applsci 12 05041 g021
Figure 22. Plot of trajectories obtained during the starboard turn under the normal ballast condition. Stage (a): Rudder angle 0-degree: NCR straight going (begin). Stage (b): Rudder angle changes from 0 to 12-degree (starboard). Stage (c): Rudder angle 12-degree: ship’s heading is gradually changing. Stage (d): Rudder angle 0-degree: NCR straight going (end).
Applsci 12 05041 g022
Figure 23. Comparison of behaviors between the port turn and the starboard turn under the normal ballast condition. Stage (a): Rudder angle 0-degree: going straight ahead at the NCR (begin). Stage (b): The rudder angle changes from 0 to 12-degree (port, starboard). Stage (c): Rudder angle 12-degree: the ship’s heading is gradually changing. Stage (d): Rudder angle 0-degree: going straight ahead at the NCR (end).
Applsci 12 05041 g023
Figure 24. Rigid beam assumptions.
Applsci 12 05041 g024
Table 1. General arrangement and specifications of the case study ship (courtesy of the shipyard).
Applsci 12 05041 i001
Vessel type50,000 DWT medium-range oil/chemical tanker
L × B × D (m)174.0 × 32.2 × 19.1PropellerFour blades at a fixed pitch
Main engineType: MAN B&W 6G50ME-BDiameter: 6600 mm
MCR: 7700 kW × 93.4 rpmMaterial: Ni–Al–Bronze
NCR: 5344 kW × 82.7 rpmMass: 18,200 kg
FlywheelMass: 11,207 kgCap and nut mass: 1538 kg
L, length; B, breadth; D, depth; MCR, maximum continuous rate; NCR, nominal continuous rate.
Table 2. Sensor connections.
Sensor TypeSensor Name and Mounted Position
Laser sensorLA (in the vicinity of the forward-stern tube seal box)
VDM18-300/32/105/122 of PEPPERL+FUCHS.
Accuracy: ±0.2 mm.
Strain gaugeSG (in the vicinity of the forward-stern tube seal box)
WFLA-3 of the Tokyo Measuring Instrument Lab.
Gauge factor: 2122.12 ± 1%.
Table 3. Test conditions of the case study ship.
Test No.ConditionLoadRpm (Approximately)
1Static00
2Steady state25%57.3
3Steady stateNCR78.3
4Steady state85%90.3
5Steady stateMCR95
6Straight ahead (Midship 0°)NCR83.7
7Command rudder angle port 12°NCR84.9
8Ship turning (Rudder angle port 12° steady)NCR84.9
9Ship’s heading 90° (Then midship 0°)NCR84.9
10Straight ahead (Midship 0°)NCR84.9
11Command rudder angle starboard 12°NCR84.9
12Ship turning (Rudder angle starboard 12° steady)NCR84.9
13Ship’s heading 90° (Then midship 0°)NCR84.9
Publisher’s Note: MDPI stays neutral with regard to jurisdictional claims in published maps and institutional affiliations.

