1. Introduction
Health systems in both industrialized and developing countries are facing new challenges related to population aging, cost sustainability, and the management of critical events such as a pandemic. The COVID-19 emergency highlighted that most health systems were not prepared to overcome these new challenges. In this context, from a technological point of view, there is an enormous effort to develop engineering solutions that respond to the emerging needs of health systems. A common trend in healthcare is to develop smart sensors to collect daily-life real-world data (RWD) linked to patients’ risk factors, symptoms, performance, and psycho-physiological status. The integration of clinical data and daily-life RWD could provide crucial information on the outcome of medical treatments and for the development of innovative tools for patient management [
1,
2,
3]. In this context, it is essential to develop unobtrusive sensing technologies that enable transparent monitoring of individuals’ and patients’ physiological, environmental, and behavioral data related to specific health status and symptoms associated with potential health problems.
In this work, following the emerging approach of embedding sensors in daily-life objects, we describe the development and preliminary results of a textile-based pressure sensing matrix that can be integrated in the mattress of a smart-bed to detect parameters related to subjects’ sleep quality and physiological parameters such as breathing activity. The smart bed described in our previous works and reported in [
4,
5] was developed in the frame of the L.A.I.D project (Linking Automation to artificial Intelligence for revealing sleep Dysfunctions [
6]) and was designed for sleep analysis and extraction of physiological signals.
In our previous work reported in [
5], we demonstrated the capability of the smart bed to fuse all sensor data (pressure matrix, accelerometers, and environmental sensors) to perform automatic classification of sleep quality with performance comparable to standard polysomnography. In addition, in [
7], we showed the methods and results related to extraction of the heart rate through ballistocardiography applied on the signals of the set of accelerometers integrated in the smart bed. In this work, we focus on the pressure mapping layer designed as a two-dimensional array of 195 textile pressure sensors capable of detecting the distribution of pressure exerted by the subject sleeping on the mattress. The signals from the pressure sensors are processed to classify the posture and movements of the subjects and to extract respiratory activity. The classification of posture and movement are the basis for sleep analysis described in [
7] and could be also employed to give context to the acquisition of physiological signals (e.g., compensation of artifacts and optimal sensor selection). The respiratory signal in addition to the other sensors of the smart bed such as accelerometers and microphones could be exploited as part of an unobtrusive physiological acquisition system capable of detecting cardiopulmonary activity (including sleep apnea) and relevant respiratory symptoms such as cough and wheezing.
In the literature, several sensing solutions have been exploited for the in-bed monitoring of subjects’ physiological signals and sleeping posture/movements [
8,
9,
10,
11,
12,
13,
14,
15,
16,
17,
18]. A review by Schwarz-Pfeiffer et al. [
19] described the recent results obtained in noninvasive sleep monitoring technologies, focusing both on research and commercial products. The majority of the solutions exploit pressure mapping sensors that extract the distribution of the pressure of the subject sleeping on the mattress. Contact pressures are generally measured by using distributed sensors with high spatial resolution. Different sensing technologies were exploited: capacitive [
11,
12,
13], piezoresistive [
8], piezoelectric [
16], or optical [
14]. The information from the pressure transducers are exploited to extract the subject’s presence, sleeping posture/movements, or breathing activity. Yu-Wei Liu et al. [
8] proposed the WhizPAD pressure mapping system: a mattress (weight 6 kg) in which piezoresistive foam placed between two conductive fabrics was used as the sensing element. The WhizPAD is used in hospitals and detects user movements, breathing activity, and subject’s presence [
9] and can differentiate between sleep and awake phases [
10]. XSENSOR [
20] provides a mattress cover with pressure mapping that incorporates a large number of capacitive sensors. The system consists of two parts: the sensing mattress cover, which can be placed under the hospital linen, and an LCD monitor mounted on the head of the bed that displays information on the contact pressures on the mattress. Holly Wong et al. [
11] used the XSENSOR cover to prevent the onset of ulcers in hospitalized patients. A comparable capacitive technology was employed by Chang et al. [
12,
13] for movement and breathing monitoring. Similarly to the XSENSOR, the
SensorEdge [
21] and the BodyTrak [
22] are commercial products made up of pressure-sensitive covers designed for preventing pressure ulcers in hospital settings. Kortelainen et al. [
16] integrated a piezoelectric material into a multichannel pressure-sensing matrix that records the ballistocardiographic signal and breathing activity during sleep. Kozue Sakai et al. [
14] developed a mattress that aimed to prevent ulcers and that incorporates a pressure detection system (the Kinotex). In this case, the sensors are made with optical technology. The pressure is transduced into a change in the optical properties of a polymeric foam material. The light coming from the sensor is detected by a photodiode, and the external force is calculated by measuring the intensity of illumination. The same technology was employed by Gilakjani et al. for sleep assessment [
15].
Compared to the literature solutions described above, our pressure mapping layer is designed as a low-cost consumer product. We implemented a low-cost pressure mapping layer (in the order of a hundred euros) with a relatively low number of sensors (hundreds vs. thousands) which, thanks to the algorithms we developed, is able to detect posture, movement, and respiratory activity with satisfactory performance. We opted for the piezoresistive textile solution to build the pressure mapping layer as it is the simplest principle and less sensitive to external disturbances and with less complexity for the electronic circuit, as confirmed by a comparison of the existing technologies reported in Zhou et al. in [
23]. Existing examples in the literature have a greater number of sensors by at least a factor of 10. One of the advantages of our solution is being able to function correctly with a reduced number of sensors, thus reducing the cost of both the sensitive part and the electronic system. The pressure mapping layer was obtained starting from a classic multilayer architecture to avoid rigid metal wires on the sensing areas. However, we modified the classic multilayer solution by cutting the piezoresistive fabric into strips. This expedient has several advantages compared to the previous solutions: (i) reducing the sensor crosstalk due to parasitic resistances typical of piezoresistive multilayers, (ii) saving piezoresistive material (in the order of 30% less), and (iii) still being compatible with textile manufacturing.
In addition, with respect to the existing literature, we performed a robust validation and statistical analysis of the results obtained in posture/movement classification and in breathing rate extraction.
2. Materials and Methods
2.1. Pressure Mapping Layer
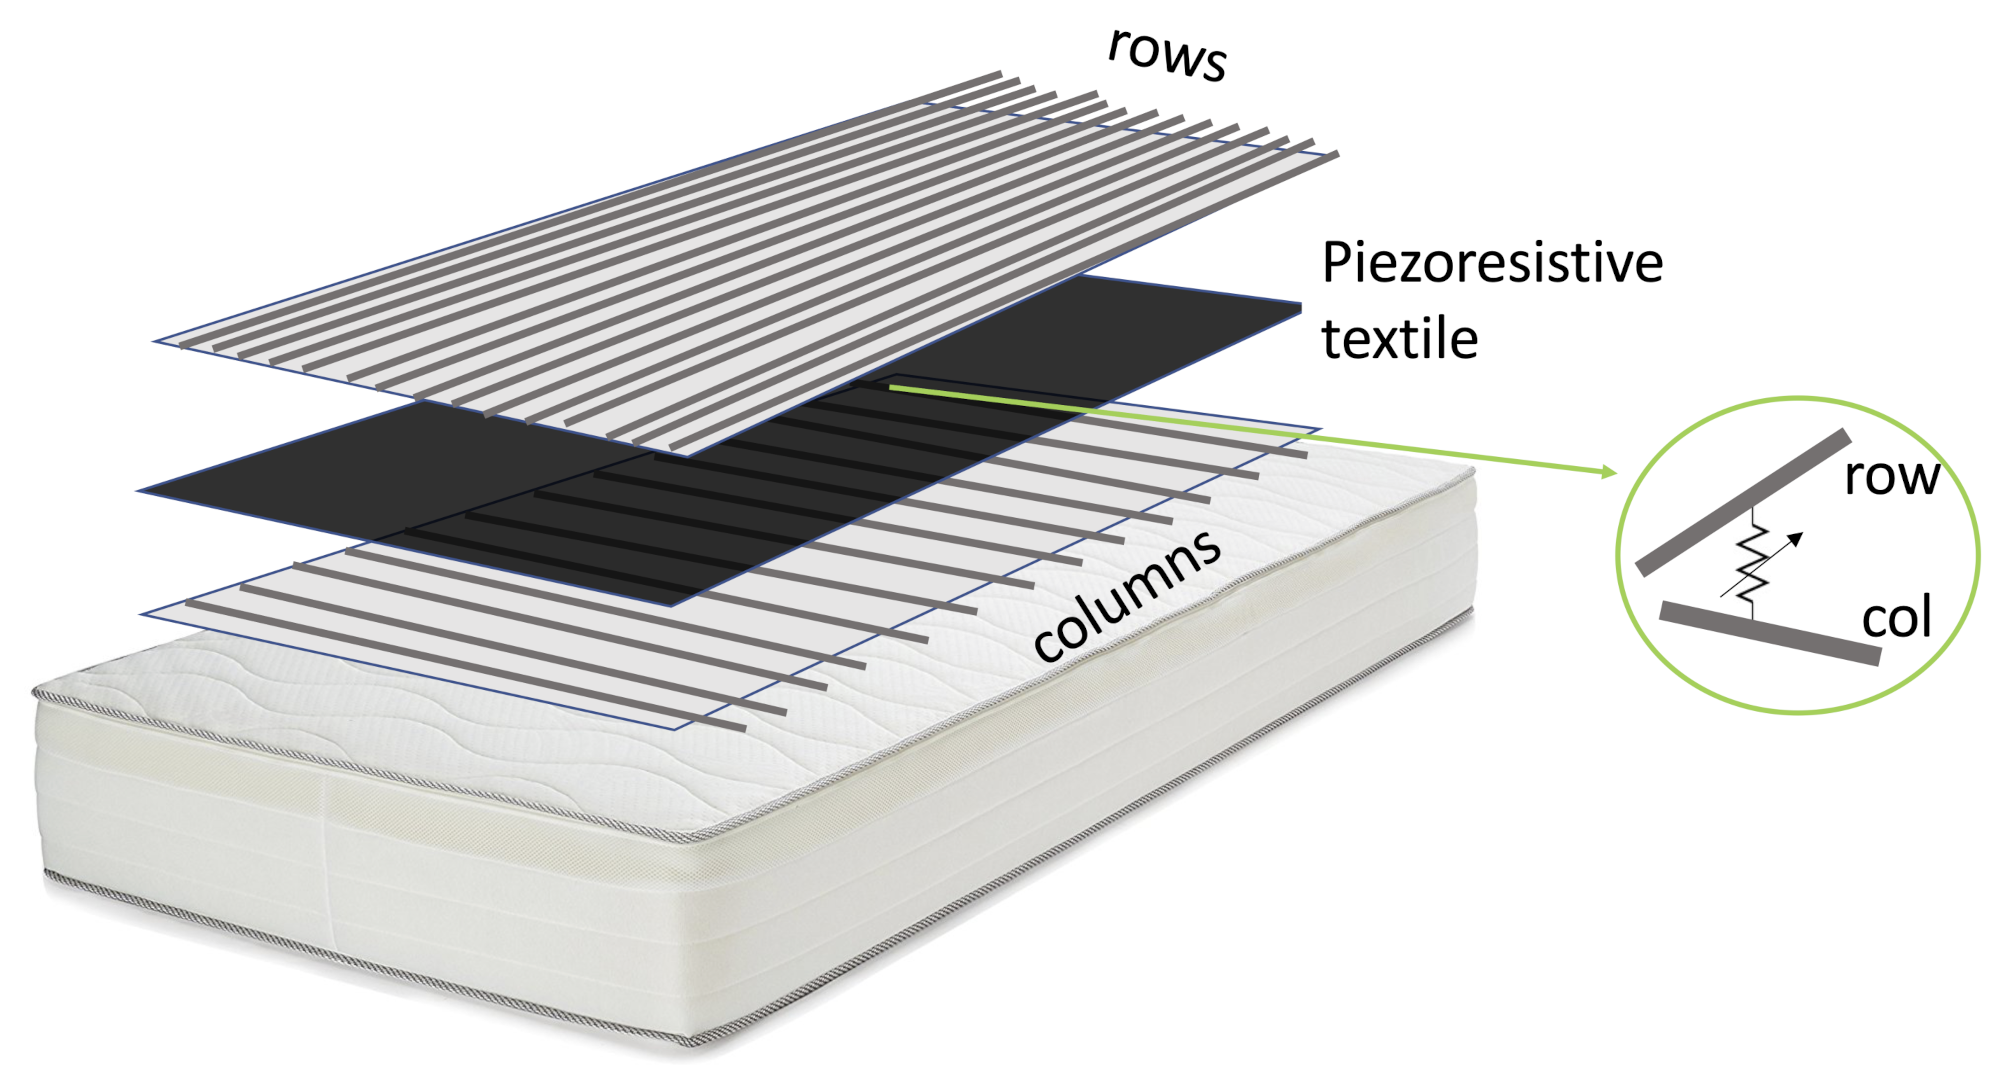
The pressure mapping layer (PML) was based on a piezoresistive fabric placed on the foam layer below the top cover of the mattress. We designed the PML as a bidimensional array of pressure sensors able to detect the pressure map of the subject sleeping on the mattress. The pressure map describes the topology of pressure exerted by the subject in multiple sensing areas on the mattress. The static information from the pressure map can be used to derive sleep posture (i.e., supine, prone, and lateral on the right or left sides), while the dynamic content of signals can be analyzed to extract the subject’s movement and respiratory activity. Movement of the subject, defined as the transition between consecutive sleeping postures, induces the change in outputs of most of the elements of the array. At the same time, chest expansion during breathing causes a small periodic variation in the output of the sensors that are distributed around the subject’s chest area. Note that the chest position over the mattress can change according to the sleeping posture of the subject. We built the PML as an array of 13 × 15 piezoresistive elements spread over an area of 125 × 75 cm. We applied the PML on a single mattress of 190 × 90 cm. The PML was centered on the mattress in such a way that the head and foot areas were excluded from the measurement. As shown in
Figure 1, the PML is made of three layers. The central layer is a piezoresistive fabric: the CARBOTEX 03-82 fabric produced by SEFAR AG (Heiden, Switzerland). The top and bottom layers are polyethylene terephthalate (PET) fabrics (produced by SEFAR AG) with integrated metallic threads that are woven to obtain conductive stripes (2 cm width). The stripes of the top layer (the row conductors) and the bottom layer (column conductors) are perpendicular. Following our design, in the top layer, the stripes are separated by 3 cm, while in the bottom layer, the separation is 8 cm.
The principle behind the PML is inspired by the work of Cheng et al. [
24]: each intersection between a row and a column is a sensing area (see the insert in
Figure 1) where the electrical resistance decreases when the applied pressure increases.
We performed a bench static characterization of the pressure sensor by applying known weights to a single active area when the sensor was stable on a flat surface. This basic characterization confirmed the nonlinear characteristic typical of textile-based piezoresistive sensors, in which the electrical resistance decreases nonlinearly depending on the applied pressure [
24,
25,
26]. We have not characterized the sensor hysteresis, but it is known that the textile-based piezoresistive sensors are affected by this phenomenon; see, for reference, the works reported in [
27,
28,
29]. Note that calibration of the sensors strictly depends on the substrate on which they are applied and should therefore be done when the PML has been inserted into the mattress, and this is very difficult in our application context. For this reason, we decided to apply the posture and movement recognition and respiratory activity extraction algorithms directly on the raw data extracted from the PML.
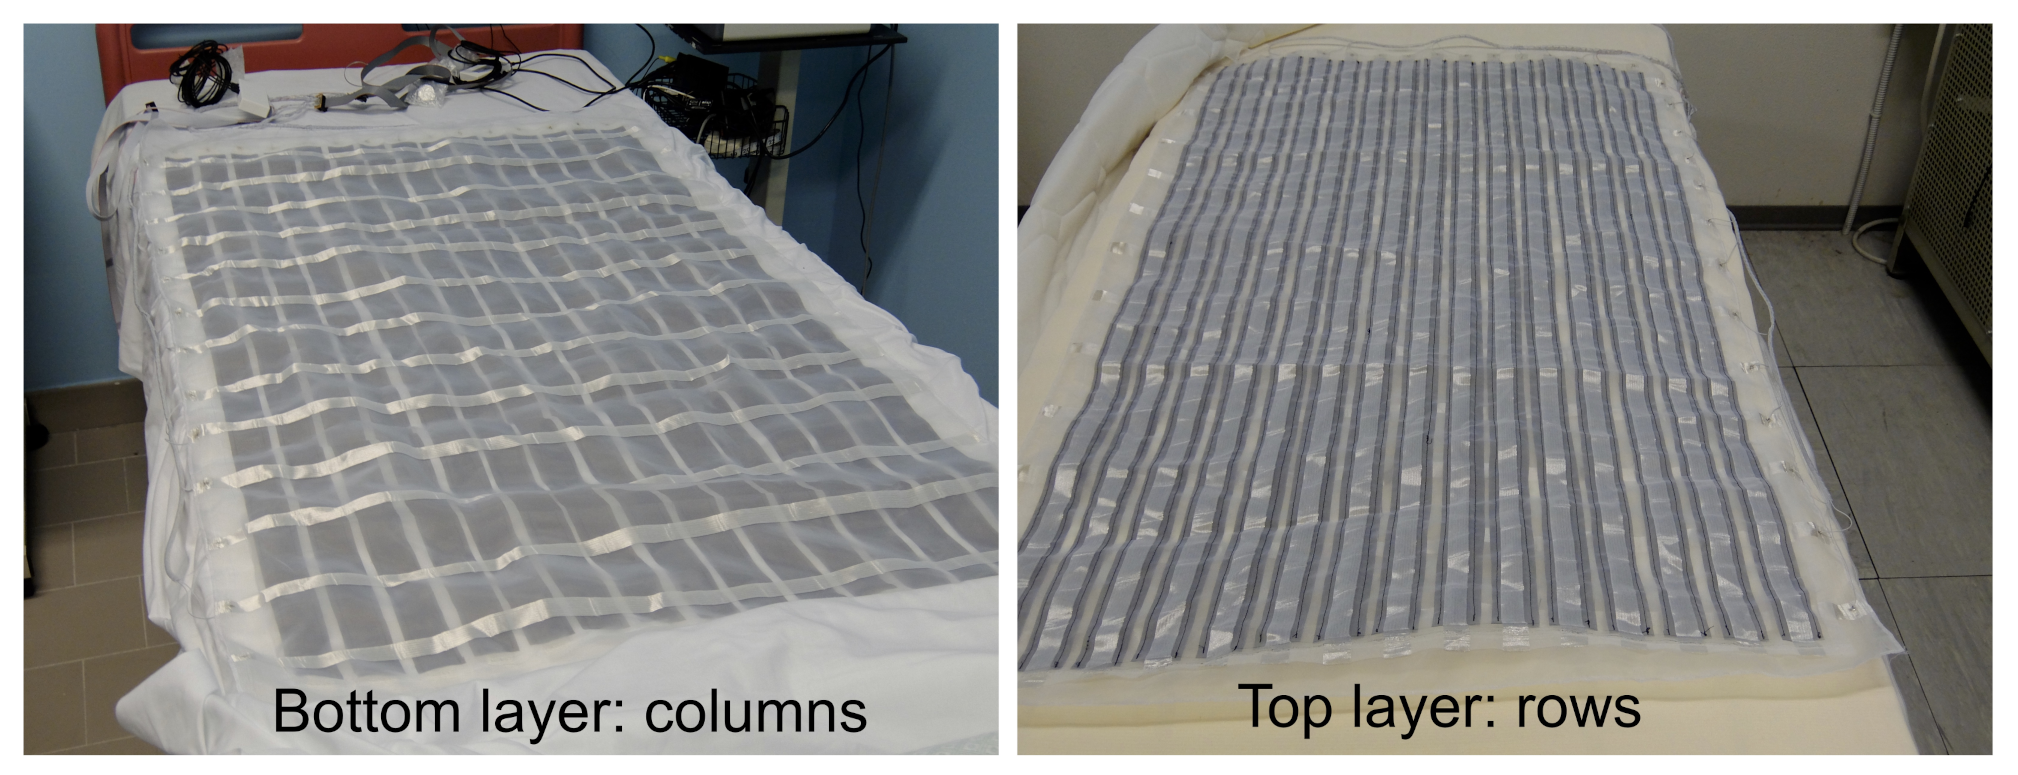
We modified the principle described in [
24] to reduce the effect of the parasitic electrical resistances and to save the amount of piezoresistive material used. As described in [
23], the effect of parasitic resistances is in fact a cross-talk between the sensors that share the same electrodes. To reduce the effect of parasitic electrical resistances in the transverse directions due to the surface conductivity of the piezoresistive layer [
23], we sliced the piezoresistive layer in strips parallel to the row direction (width of the strips is about 3.5 cm) and we sewed the strips onto the top layer aligned to the center of the row conductors. The amount of piezoresistive material saved is about the 30%. This solution is not optimal as we eliminated parasitic resistance only in the column direction. However, cutting the piezoresistive fabric into strips parallel to the row direction can be considered a good compromise between ease of construction and reduction of parasitic resistances. In fact, the long piezoresistive strips can be cut and sewn with techniques compatible with current textile production technology.
Figure 2 shows the top and bottom layers of the PML.
2.2. Electronic Unit
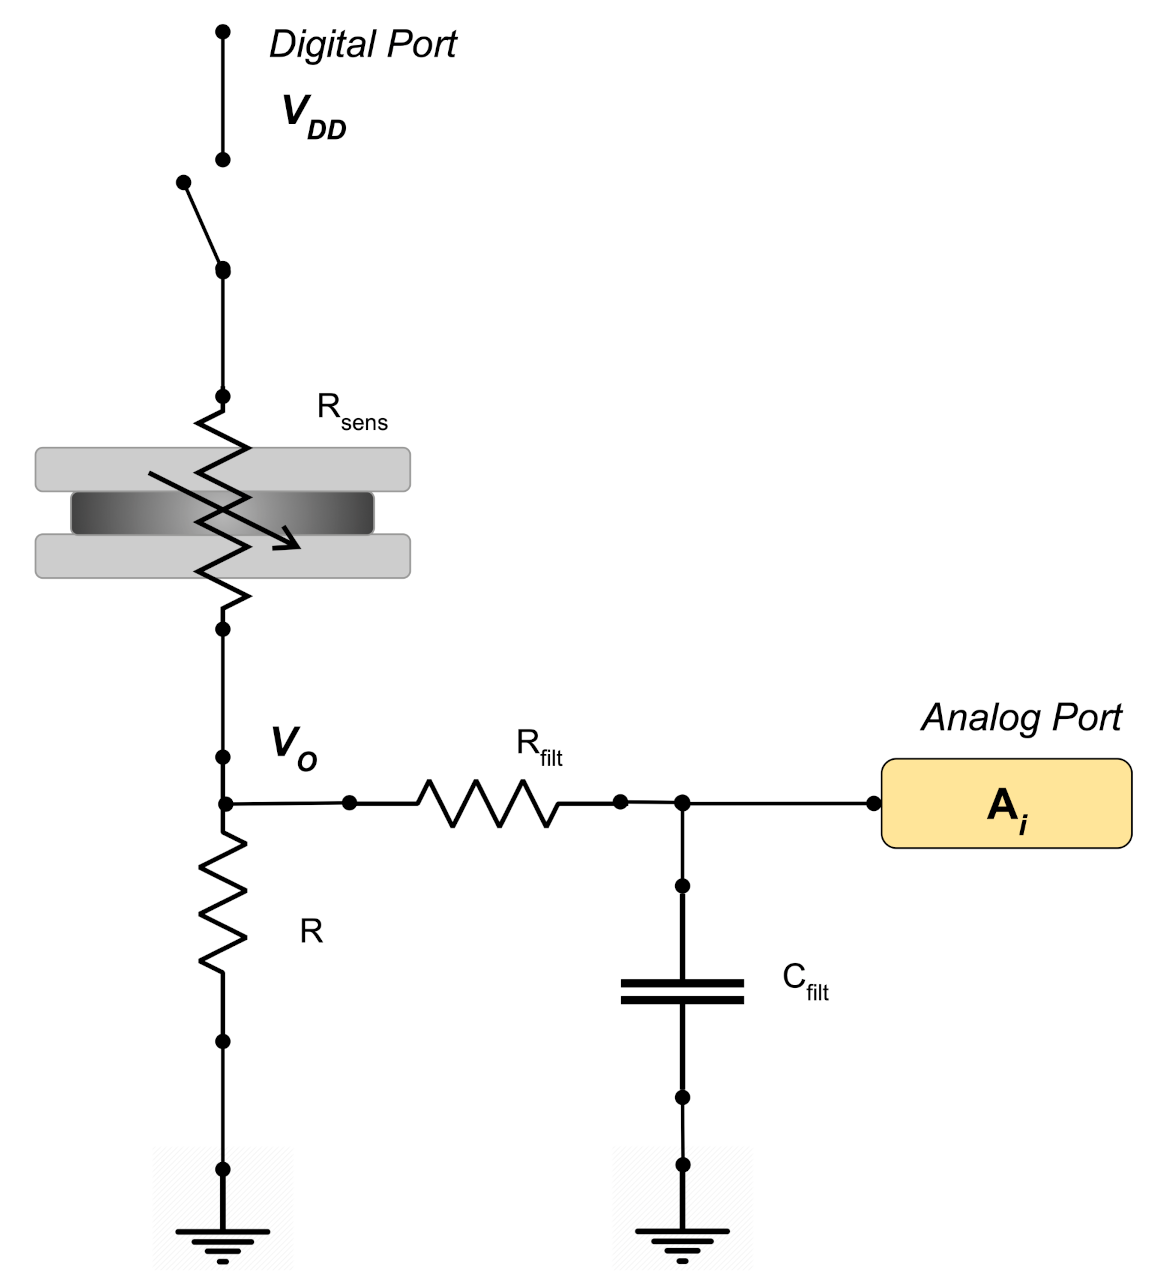
To obtain the raw signal associated with the pressures exerted by the subject’s body and consequently be able to extract information relating to movement and respiratory activity, it is necessary to acquire all the sensing areas of the PML. Each single sensing element can be electrically represented as a variable resistance. To determine signal variation over time, we designed a specific front-end unit. In particular, to acquire all the 195 sensing areas of the PML, we developed a multi-channel electronic able to sequentially activate each individual detection area through appropriate management of the rows and columns of the pressure matrix.
The front-end unit, as shown in
Figure 3, provides a voltage divider scheme, where
Rsens is the variable resistance of the single sensitive element to be determined while R is a pull-down resistor of known value. The resulting
V voltage is a function of the electrical resistance of the single sensing element. When a pressure is applied on the specific area, the
Rsens decreases while the
V increases accordingly. Then, the
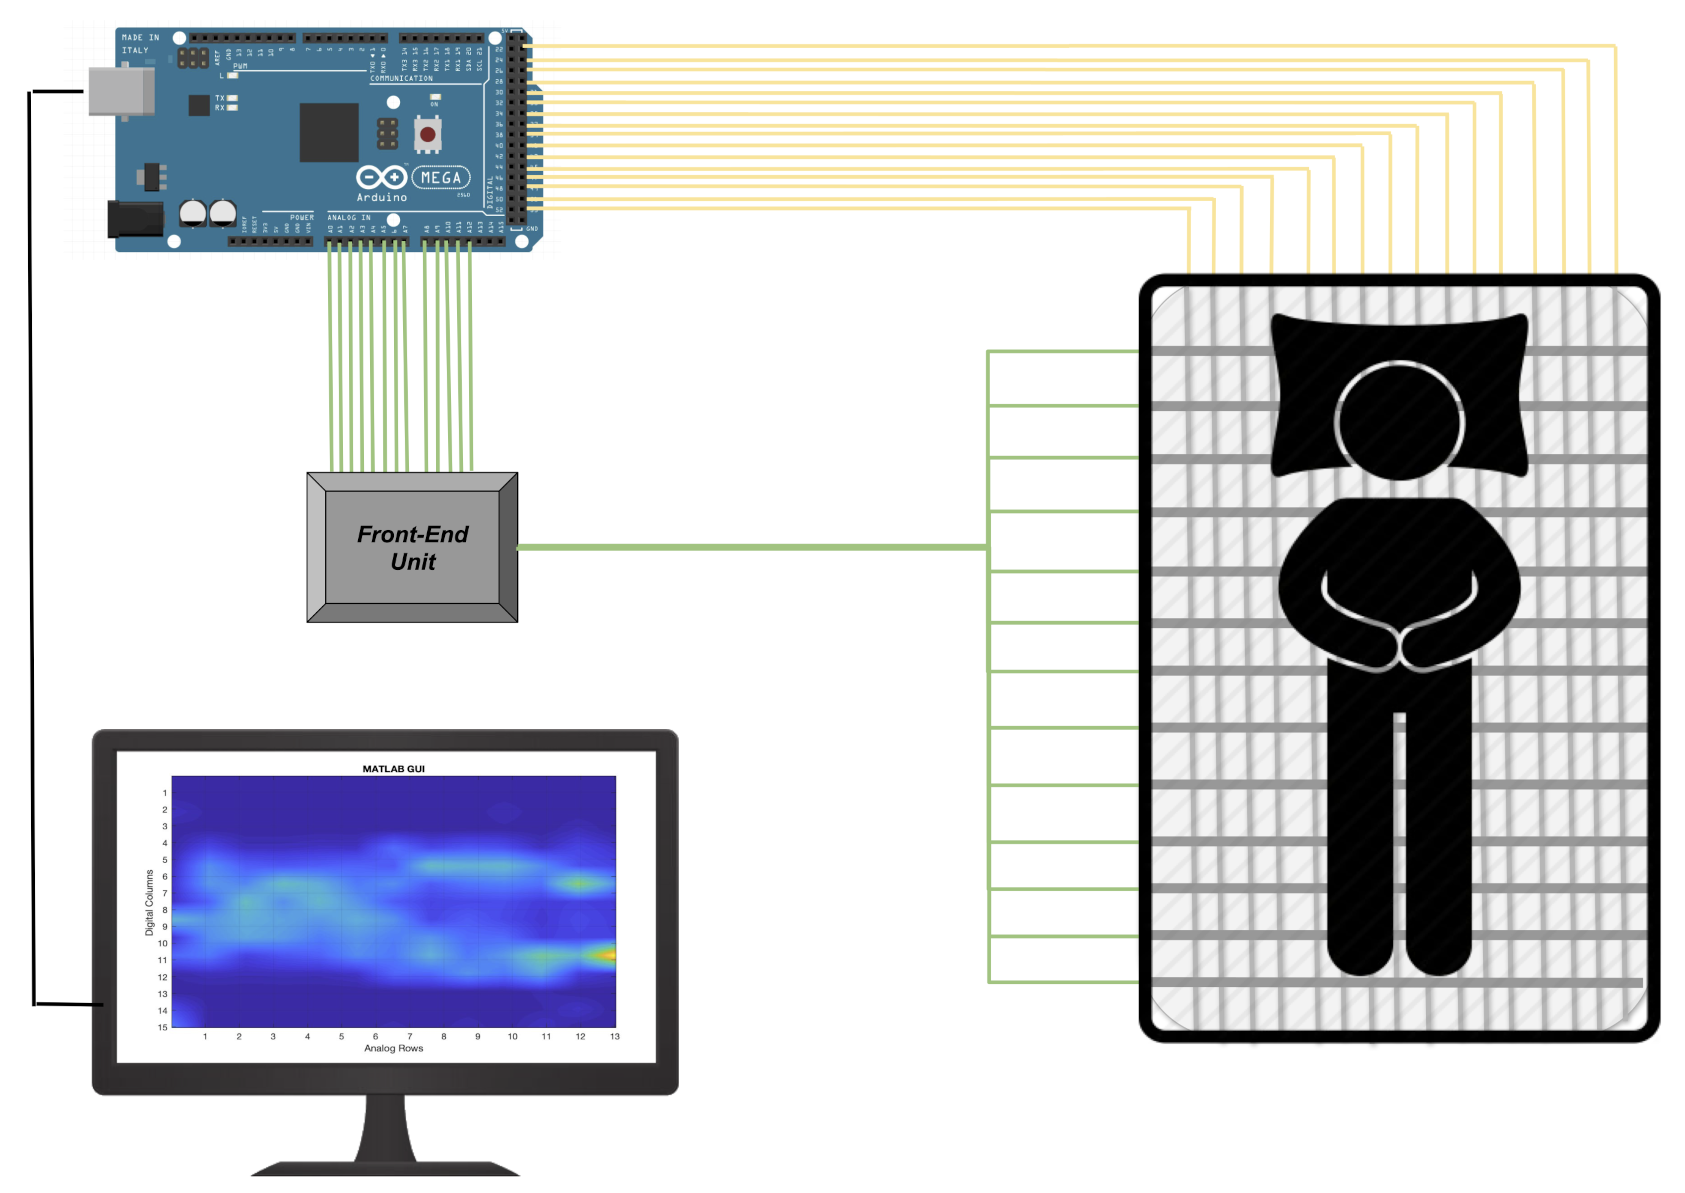
V is low-pass filtered and connected to the analog input port of the multi-channel electronics based on the Arduino Mega 2560 platform (see
Figure 4 ).
The PML is in fact made up of a matrix of 15 columns, each of which is connected to a digital channel and 13 lines each of which connected to one of the 14 analog channels available in the Arduino Mega. The reading of each single sensor is managed by activating the digital channels sequentially (switching from
GND to
VDD) and simultaneously acquiring all the 13 analog channels (see
Figure 4). The acquired PML data that will be elaborated by the algorithms described in
Section 2.4 and
Section 2.5 are expressed as the logical levels of the analog to digital converter of the Arduino board.
2.3. Data Collection and Preprocessing
We tested our algorithm with the data recorded from 7 healthy volunteers. All participants gave their informed consent for inclusion before they participated in the study. The study was conducted in accordance with the Declaration of Helsinki, and the protocol was approved by the Ethics Committee of the University of Pisa (0102206/2019).
We performed two experiments, the first dedicated to the extraction of sleep posture and the second oriented to respiratory activity.
In the first experiment, we asked the seven subjects to change their body position over the mattress in 4 predefined positions: supine position, lying on the left side, lying on the right side, and prone position. The data related to different positions were manually labeled during the data collection. For each participant, a minimum number of 15 repetitions for each predefined position was collected. During the sample collection, participants were asked to be silent and to maintain the position. In addition, also data about movements (i.e., transitions between static postures) and the absence of the subject over the smart bed were collected and labeled.
Overall, we gained 2076 samples during tests carried out on the different positions, movements, and absence of subjects. The numbers of samples for each position and condition were 118 “not on bed”, 179 “supine position”, 166 “lying on the left side”, 165 “lying on the right side”, 178 “prone position”, and 1270 “movement”.
In the second experiment, we collected data while the participants were over the sensing mattress in the supine position. We collected simultaneously the PML signals and a reference breathing rate signal obtained from a nasal cannula equipped with a thermistor. Both signals were acquired with a sampling frequency of 8 Hz. The use of thermistor and nasal cannula is a common method to extract breathing activity in polysomnography, as reported in [
30,
31,
32]. During data collection, participants were asked to be silent and steady for at least 3 min. The participants were also requested to voluntarily modulate their respiratory activity.
2.4. Sleeping Posture Classification
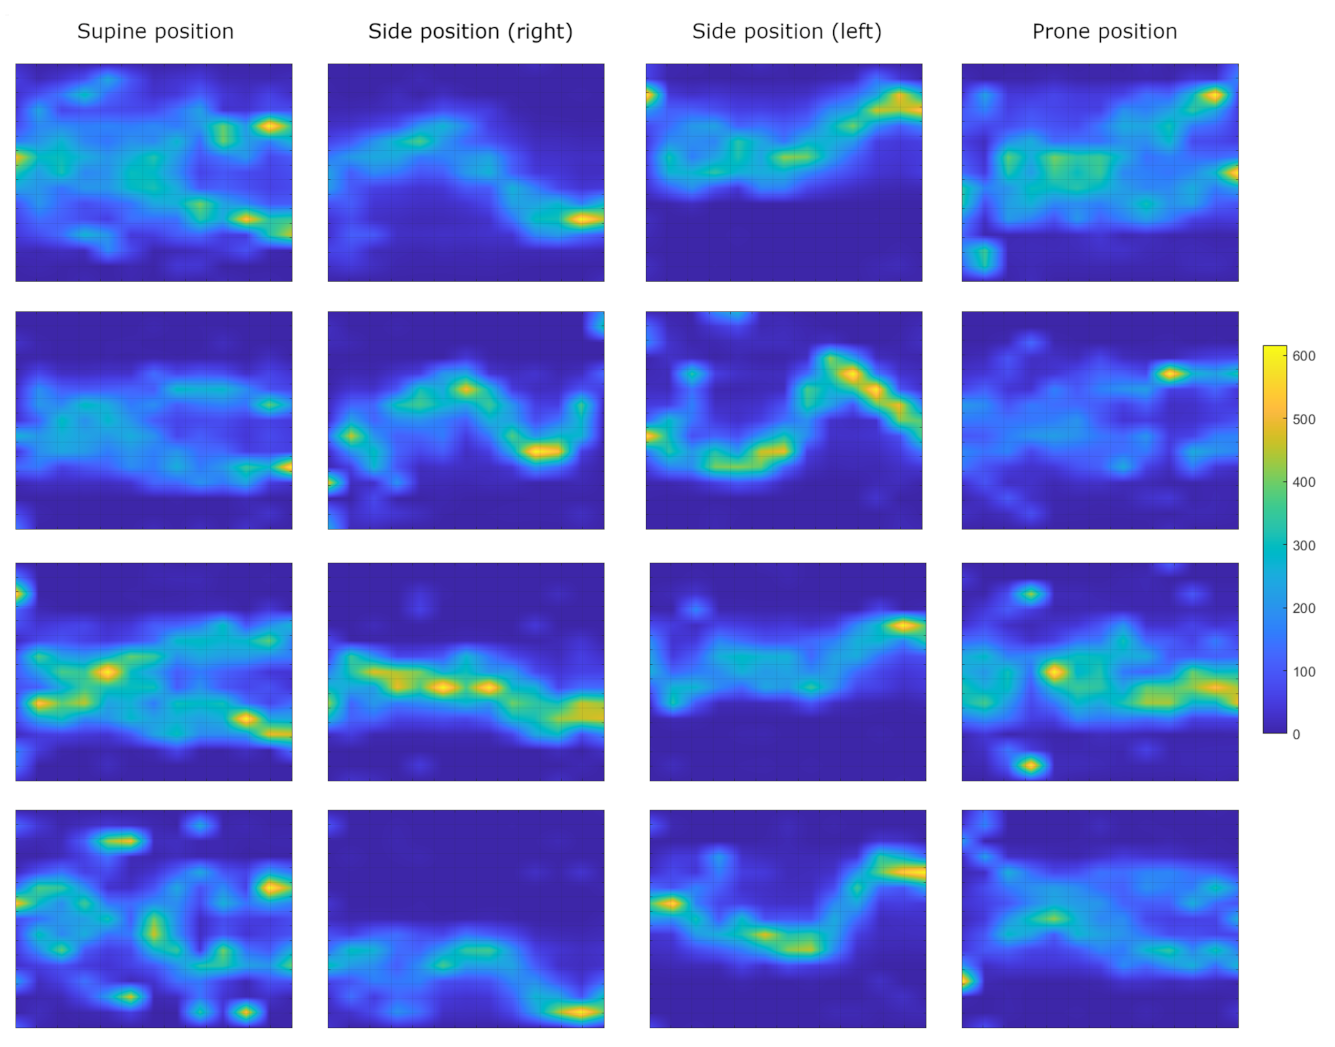
The pressure mapping system generates a image (800 × 600 pixels) in which each pixel is associated to the pressure applied to the specific area of the mattress. Starting from the 195 sensing areas of the PML, the pressure image is built by linear spatial interpolation of the values obtained in each sensing area.
Figure 5 shows the pressure image for typical sleeping postures of 4 of the 7 available subjects.
To perform automatic classification of the sleeping postures, we extracted a set of 9 features obtained by reducing the sensing area density from to by topological averaging. The reduced 9 topological area were obtained linearly by diving each axes of a sensing area in 3 intervals. The 9 features associated with each reduced topological area are the average values of the subtended PML signals.
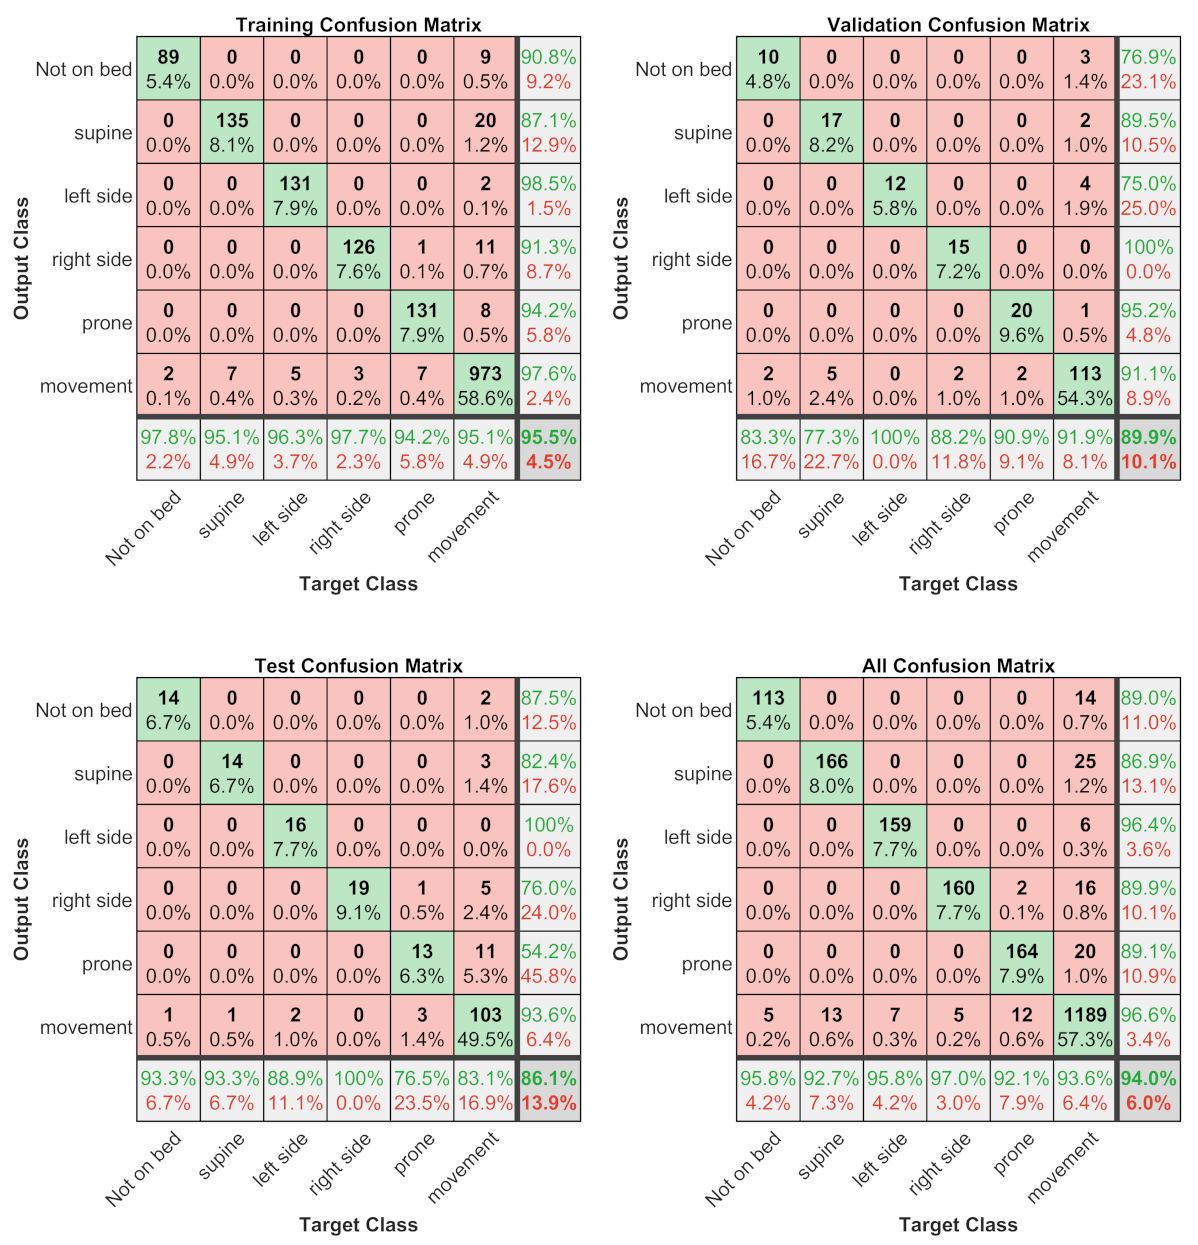
The position feature vectors obtained (9 elements) are the input of the machine learning classifiers with six predefined classes associated with six typical sleeping conditions: (i) not on bed, (ii) supine position, (iii) lying on the left side, (iv) lying on the right side, (v) prone position, and (vi) movement. We used of the sample for training, for thev alidation set, and for testing. We tested the following five classifiers:
Artificial Neural Network (ANN): We employed a two-layer ANN; the size of the hidden layer was set to 10. For the training process, we applied a backward propagation algorithm with the scaled conjugate gradient method.
K-nearest neighbors (KNN): we set the number of neighbors (k) to 5 and the distance metric as Euclidean.
Support Vector Machines (SVM): a Gaussian kernel function was set for the SVM.
Decision Tree: a decision tree algorithm with Adaptive Boosting (AdaBoost).
Naive Bayes: a Kernel-based naive Bayes with Gaussian kernel.
2.5. Breathing Rate Estimation
We proposed an algorithm for estimating respiratory rate from the analysis of PML signals in the frequency domain. The underlying hypothesis is that breathing-related chest movements induce small periodic changes in signals associated with specific detection areas in relation to the subject’s position on the bed.
The PML signals were linear detrended and averaged to obtain a discrete time mean signal
. The mean signal
was splitted in
n epochs (
) of 10 s time duration, and the epochs were overlapped of
. The first and last epochs (
and
) were zero-padded to obtain the same length as that of the other epochs. We estimated the power spectral density (PSD) of each linear detrended
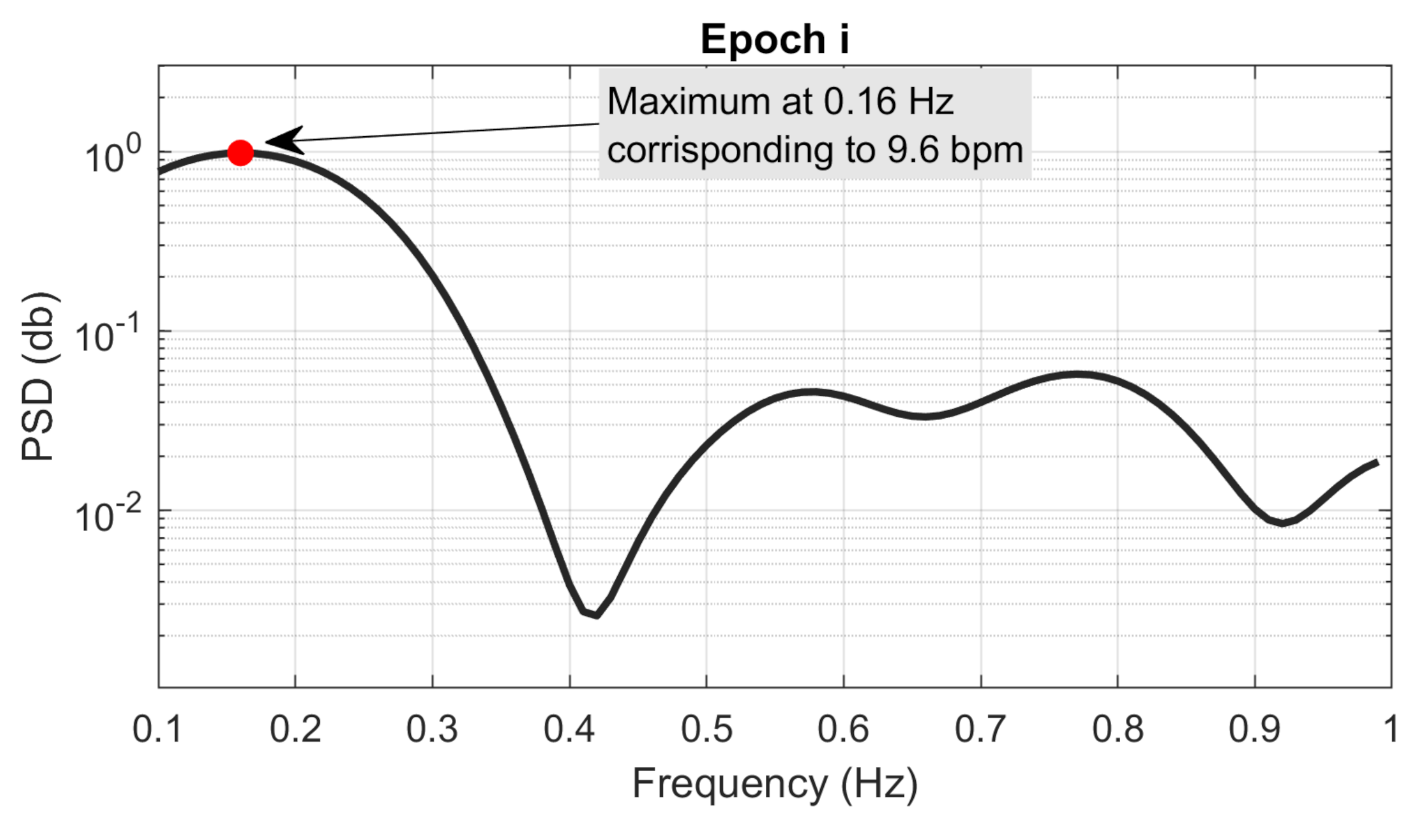
i epoch multiplied by a Hamming window by means of a Welch’s estimator with a length of 400 time points (the length of each epoch multiplied for 10). The obtained PSD (
) had a frequency resolution of 0.01 Hz. Then, the local maximum (
) of each
was detected in the frequency range between
Hz to 1 Hz, as it corresponds to the frequency interval of breathing rate, which can be estimated (i.e., 6–60 bpm).
Figure 6 shows an example of a PSD estimated from an
i epoch and the associated local maximum in the frequency range 0.1–1 Hz.
Finally, the frequency
of local maximum
was estimated, and the breathing rate (
) associated with
i epoch was evaluated as follows:
Finally, the estimated breathing rate sequences were filtered with a five-order one-dimensional median filter to remove possible outliers.
2.6. Breathing Rate Validation Procedure
The breathing rates of each epoch estimated from the PML were compared with the reference breathing rates from the sensorized nasal cannula. The comparison was performed with the root mean squared error (RMSE), the correlation coefficients of Pearson (R), and the p-valueues (p-value) of Pearson’s correlation. The BR estimation of each epoch () was considered the statistical unit of statistical analysis estimated subject-by-subject. To evaluate the inter-rater assessment, the Bland–Altman plot of BR estimations pooled over all the subjects was evaluated. The following parameters describing the inter-rater assessment were estimated: reproducibility coefficient (RPC), percent coefficient of variation (CV), root mean squared error (RMSE), and squared Pearson r-value ().
The signal processing and all the analysis were performed by using Matlab (R2020a, Mathworks, Natick, MA, USA).
4. Discussion
In the current study, the experimental tests showed that the proposed in-bed solution allows us to obtain a robust estimation of both subject position and breathing rate that are estimated by using the signals of the PML combined with tailored algorithms. It is important to note that our approach is completely nonobtrusive and transparent for the subject. In addition, the proposed PML and electronic platform is a low-cost system and is suitable for large distribution and massive use in general population.
Regarding subject position/motion classification, this study found that the best automatic classifiers was a ANN with an overall accuracy of for the test set and considering all the datasets. The most critical condition to recognize is the prone position (with a sensitivity of and precision of ); for the other conditions, the sensitivity and precision are greater than and , respectively. Contrary to expectations, the movements of the subject are well recognized, with a sensitivity of and precision of . This finding was unexpected because the movements are the sequence of several different positions, and we have supposed that this could cause critical issues for the ANN classifier.
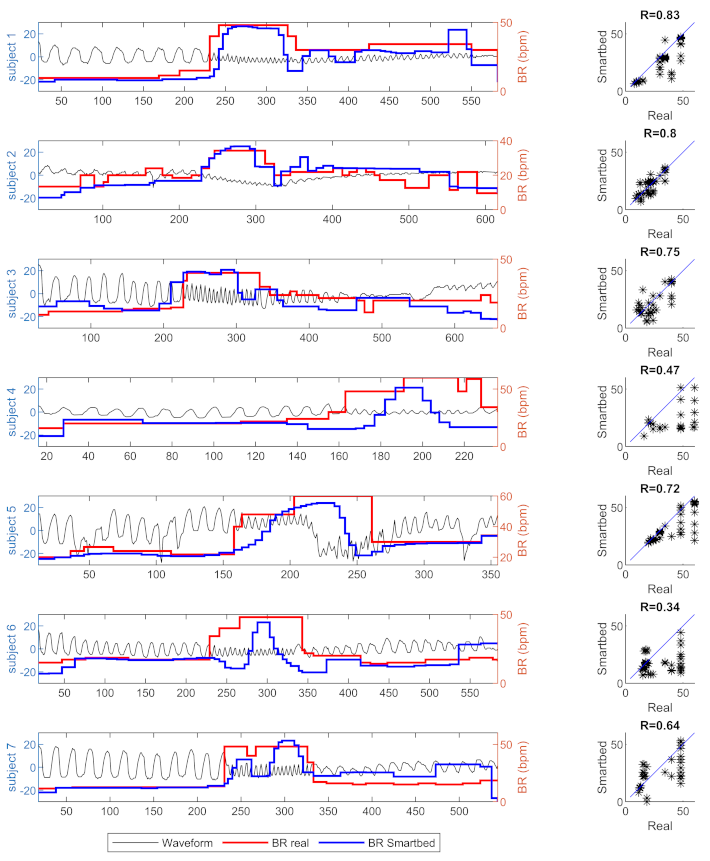
With regards to the breathing rate, the PML combined with the proposed algorithm show qualitative and quantitative results with respect to the reference estimation obtained with a nasal cannula. In
Figure 8, in which the estimated breathing rate waveforms obtained from the reference and mattress are shown, it is possible to note that the baseline breathing rate are always the same for the reference and mattress for all the subjects involved in the tests. In the case of variation in the breathing rate, the PML combined with the proposed algorithm is able to evaluate the variation even with a slightly different trend with respect to the reference. A possible explanation for this might be that the proposed algorithm needs a pseudo-stationary window of the signal, in which the PML signal does not have significant variations. In any case, the linear regressions between the reference and PML breathing rate estimations are significant (
p-value
) for all the subject and the coefficients of regression are lower than
for only two out of seven. Considering the pooling dataset of breathing rate estimations, the squared Pearson
r-value is
and almost all estimation differences between PML and reference are within the
limits of agreement.
The present study raises the possibility to robustly estimate the position and breathing rate of a subject lying over a bed by using a nonobtrusive and low-cost system based on a textile pressure mapping layer placed over a mattress. The position and breathing rate are key information to evaluate the quality of sleep of a subject. Hence, the proposed method associate to PML and other sensors of the smart bed will be an important element in future home-automated environments for the evaluation of sleep quality, health, and more in general the quality of life of the entire population. Furthermore, the proposed system could be very useful also in a clinical context to allow for a continuous and nonobtrusive monitoring of vital parameters for each patient. The main limitations of our study are the restricted number of healthy subjects tested and the absence of long-time duration test (i.e., full night recordings). We plan to significantly increase the test population targeting both healthy subjects and patients with specific clinical conditions (e.g., vegetative or minimally conscious states) and with chronic multi-morbid diseases such as chronic obstructive pulmonary disease.


 ,
, 


