Article

QuEChERS-Based Methodology for the Screening of Alkylphenols and Bisphenol A in Dairy Products Using LC-LTQ/Orbitrap MS

by
Vasiliki Boti
*,
Vasiliki Kobothekra
,
Triantafyllos Albanis
and
Ioannis Konstantinou
Department of Chemistry, University of Ioannina, 45110 Ioannina, Greece
*
Author to whom correspondence should be addressed.
Appl. Sci. 2021, 11(20), 9358; https://doi.org/10.3390/app11209358
Submission received: 9 September 2021 / Revised: 3 October 2021 / Accepted: 4 October 2021 / Published: 9 October 2021
(This article belongs to the Special Issue Analysis of Contaminants and Residues in Food)

Abstract

:
A simple methodology was developed for the determination of four Endocrine Disrupting Chemicals (EDCs) in dairy products. The EDCs included alkylphenols (4-tert-octylphenol, technical nonylphenol isomers, 4-nonylphenol) and bisphenol-A. The methodology consisted of a quick, easy, cheap, effective, rugged and safe (QuEChERS) extraction followed by liquid chromatography (LC) coupled to the hybrid LTQ/Orbitrap mass spectrometer (MS). The high resolution (HR) analysis provided the required selectivity demonstrating excellent sensitivity and enabled the high-mass accuracy of the analytes within short time of analysis, after a chemometric optimization of the instrument parameters. An experimental design was employed for the estimation of the effect of different parameters on the QuEChERS extraction efficiency to obtain the optimum conditions. Method validation proved that analysis exhibited excellent linearity (R2 > 0.9966), low enough precision (0.6 to 13.3%) and recoveries in the range of 91 to 108%. Limits of detection (LOD < 6.5 ng g−1) and quantification (LOQ < 20 ng g−1) as well as matrix effects (ME) were also evaluated. The optimized method was successfully applied to analyze dairy commodities varying in fat content and packaging material including milk, yogurts and infant formulae. Detected concentration levels (MDL-10.4 ng g−1) for bisphenol-A BPA in milk samples resulted in 0.36% of TDI for the medium case (average BPA concentrations) and 1.15% of TDI for the worst case (maximum BPA concentration).

1. Introduction

Over the last few years, the exposure levels and the associated effects of endocrine disrupting chemicals (EDCs) on the environment, wildlife and humans has received increased awareness [1,2]. The long overdue list of EDCs includes estrogen mimic compounds such as bisphenol A (BPA), 4-tert-octylphenol (OP) and nonylphenol isomers, known widely as industrial chemicals. They present multiple modes of endocrine disruption activity, with the most emphasized being the binding to the estrogen receptors (estrogen receptors α and β) and acting competitively towards regular hormones (e.g., 17 β–estradiol). The alkylphenols (APs) [3,4,5], including NP isomers and OP as well as BPA, have shown to mimic the actions of the natural estrogen estradiol, with their biological effects being regulated by interactions with the cellular estrogen receptor.
4-t-OP and NP isomers are both degradation products of alkyl phenol ethoxylates (APEOs, non-ionic detergents) and intermediates in APEOs and phenolic resins production processes. Since 2000, they have been included in the list of priority hazardous substances by Directive 2000/60/EC [6], while since 2003 a reduction policy has been implemented in the E.U. for NP [7]. Nevertheless, 4-t-OP and NP isomers are still widespread and broadly detected in environmental compartments, such as wastewaters, potable water, rivers, biota and consequently also in food commodities [8,9,10,11]. Concerning BPA, it is a high-production volume chemical mainly used as an important precursor for the production of several resins and polymers also used in food packing materials. As a result, BPA can migrate into foodstuffs and beverages from packing of products, including dairy ones [12,13,14,15], while oral intake has been considered as the main route of exposure for BPA [16]. In addition, one of the main sources of exposure to BPA and APs for newborns and infants derive from migration from the lining of cans into infant formulas (IF) and from the polycarbonate baby bottles [9].
Bearing in mind that dairy food products are essential to the human diet and since their consumption is increasing worldwide, it is important to assure the safety of them in terms of the presence and levels of toxic compounds such as EDCs. Thus, the development of analytical methodologies that combine short time of analysis, simple operation steps, low consumption of reagents and possibility of multi-sample preparation that can be combined to selective and sensitive instrumentation such as chromatography-mass spectrometry instruments, is of primary interest. In this sense, a QuEChERS-based analytical methodology has been investigated in several food commodities and environmental matrices. It has been employed in the analysis of the target EDCs in a wide variety of substrates as well [17,18,19]. However, it has not been tested for the simultaneous extraction of these EDCs from dairy products in combination with high resolution and accurate mass detection using an LC-LTQ/Orbitrap MS system.
LC–MS/MS, applying electron spray ionization ESI techniques, provides clear advantages in terms of achieving high sensitivity and low detection limits without tedious derivatization steps for the separation, identification and quantification of BPA and APs than other common methods of analysis such as GC-MS or HPLC-UV/FLD [20,21]. Recent efforts have also been made to employ tandem-MS systems as triple quadrupole [22,23]. However, the Orbitrap technology is proven to enable fast, sensitive and reliable detection and identification of these contaminants since high resolution and accurate mass measurements have become the reference technique for obtaining information on complex mixtures' composition, such as food samples [24]. Based on the above, the purpose of this study was the optimization, validation and feasibility of application of a sensitive and reproducible QuEChERS/LC-LTQ/Orbitrap MS analytical methodology for the simultaneous determination of selected EDCs in dairy commodities at trace levels.

2. Materials and Methods

2.1. Standards and Materials

Analytical grade standards of bisphenol A (BPA), nonylphenol technical mixture, 4-n-nonylphenol and 4-tert-octylphenol (purity greater than 99%) were obtained from Dr. Ehrenstorfer GmbH (Augsburg, Germany). All solvents used were of high purity (LC-MS grade), including acetonitrile, methanol and water, purchased from Fisher Scientific (Leicester, UK) and dichloromethane from Labscan (Dublin, Ireland). Individual stock solutions were prepared at 1000 μg mL−1 in methanol and stored at −20 °C. Further dilutions and mixtures of them were prepared in methanol/water (50:50) or in the sample extract to appropriate concentration levels. All working solutions were stored in amber glassware at 4 °C. To perform QuEChERS extraction, Teflon centrifuge tubes of 15 mL and 50 mL were used while the salt-sorbent materials included anhydrous magnesium sulphate (MgSO4), LiChroprep RP-18 (40–64 μm) and tri-sodium citrate dehydrate purchased from Merck KGaA (Darmstadt, Germany); sodium acetate and sodium chloride (NaCl) of analytical reagent grade from Riedel de Haën (Hannover, Germany); sodium citrate dibasic sesquihydrate from Sigma-Aldrich (Bellefonte, PA, USA); bondesil-primary secondary amine (PSA; 40 μm) and SampliQ Carbon SPE (GCB, graphitized carbon black) from Agilent Technologies (Waldbronn, Germany). Ammonia solution (25%) was purchased from Riedel de Haën (Hannover, Germany) while Millex-HV (PVDF, 0.45 μm) syringe filters were purchased from Millipore (Cork, Ireland).

2.2. Dairy Samples

Fresh full-fat (3.5% fat) milk was used during the optimization and validation of the QuEChERS. The performance of the improved method was investigated analyzing a variety of dairy commodities. A total of 27 samples (Table S1) of dairy products were selected to monitor the target EDCs. All dairy samples were purchased from several local markets and supermarkets in Ioannina, Epirus region, NW Greece. They included milk, yogurts and yogurt desserts, beverages, creams, ice creams as well as infant formulas, considering the diverse diet types, fat content and other parameters. An additional purpose of the sampling was the investigation of the possible relation of the packaging materials of the commodities (paper–plastic–aluminum) with the concentration levels of the target analytes. It should be noted that packaging material described as “paper” were Tetra Pak® cartons, made up of six layers that mainly consists of plastic (polyethylene), paper board, adhesive polymer and aluminum foil. Prior to extraction, the sampling and preparation of the dairy products were performed according to the related legislation [25]. The homogenized subsamples were stored in darkness at −20 °C until analysis.

2.3. Sample Preparation

Fresh milk samples (10 g) fortified with all compounds at the relevant concentrations, were used for optimization and validation purposes. The homogenized mixture was submitted then to QuEChERS extraction: acetonitrile acidified with acetic acid was added and the centrifuge tube was tightly capped and vigorously mixed for 1 min using a vortex at 3000 rpm. Appropriate amounts of anhydrous MgSO4 and NaCl were added to the tube and immediately mixed with a vortex for 1 min. The sample was centrifuged for 5 min at 3000 rpm. Next, 1 mL aliquot of the upper acetonitrile layer was transferred into a 15 mL centrifuge tube containing MgSO4, PSA and C18. The tube was vigorously mixed for 1 min and centrifuged again for 5 min at 3000 rpm. An aliquot from the upper layer, in which 0.1% ammonia solution was added, was finally transferred to an autosampler vial for LC-LTQ /Orbitrap MS analysis. Quantification was carried out using matrix-matched calibration curves generated from previously analyzed blank extracts showing the non-detection of the studied compounds.

2.4. LC-LTQ/Orbitrap MS Conditions

Chromatographic separations were performed on an Accela LC system (Thermo Fisher Scientific, Inc. GmbH, Bremen, Germany) consisted of an Accela AS autosampler model 2.1.1 and an Accela quaternary gradient LC-pump. The LC system was coupled to an LTQ-FT Orbitrap XL 2.5.5 SP1 mass spectrometer (Thermo Fisher Scientific, Inc. GmbH, Bremen, Germany). The linear ion trap (LTQ) part of the hybrid MS system was equipped with an Ion Max Electrospray Ionization (ESI) probe, operating in negative ionization mode while LC-MS instrument control and data processing were carried out by Xcalibur 2.1 software (Thermo Electron, San Jose, CA, USA).
The target EDCs were separated on a reversed phase analytical column Hypersil GOLD PFP (50 mm × 2.1 mm i.d., 1.7 μm particle size, Thermo Fisher Scientific, Inc. GmbH, Bremen, Germany) maintained at 20 °C. Chromatographic analyses were carried out using a gradient mobile phase consisting of water and methanol both containing 0.1% ammonia at a stable flow rate of 0.3 mL min−1. Gradient elution was performed by increasing the percentage of methanol in water from 30 to 95% over the first 4.5 min and then to 100% over a 2 min period. This composition was maintained for 1 min, after which the initial solvent conditions were restored. The column was equilibrated for another 2 min before the next sample injection. The optimum injection volume was found to be 20 μL. BPA, OP and NP isomers were adequately separated in 9 min and were detected as [M-H] pseudo-molecular ions. The mass range selected for BPA and APs full-scan spectrum acquisition was within m/z 150–250 amu. The instrument main operational parameters were optimized either at the instrument tuning sections or via experimental design in terms of the maximum signal-to-noise ratio (S/N values). Quantification was performed post-acquisition using an isolation window of ±2 mmu. The ESI source values and the MS parameters after optimization were as follows: spray voltage 3.5 V, sheath gas 40, aux gas 10 and sweep gas 0 arbitrary units, capillary temperature 320 °C, capillary voltage −35 V, tube lens −90 V as well as AGC target 1 × 10⁶ at resolution 60,000.

2.5. Statistics

The experimental design matrix as well as ANOVA tables; Pareto and response surface charts were all generated using STATISTICA 7.0 (version 7.0, StatSoft, Inc., Tulsa, OK, USA).

3. Results and Discussion

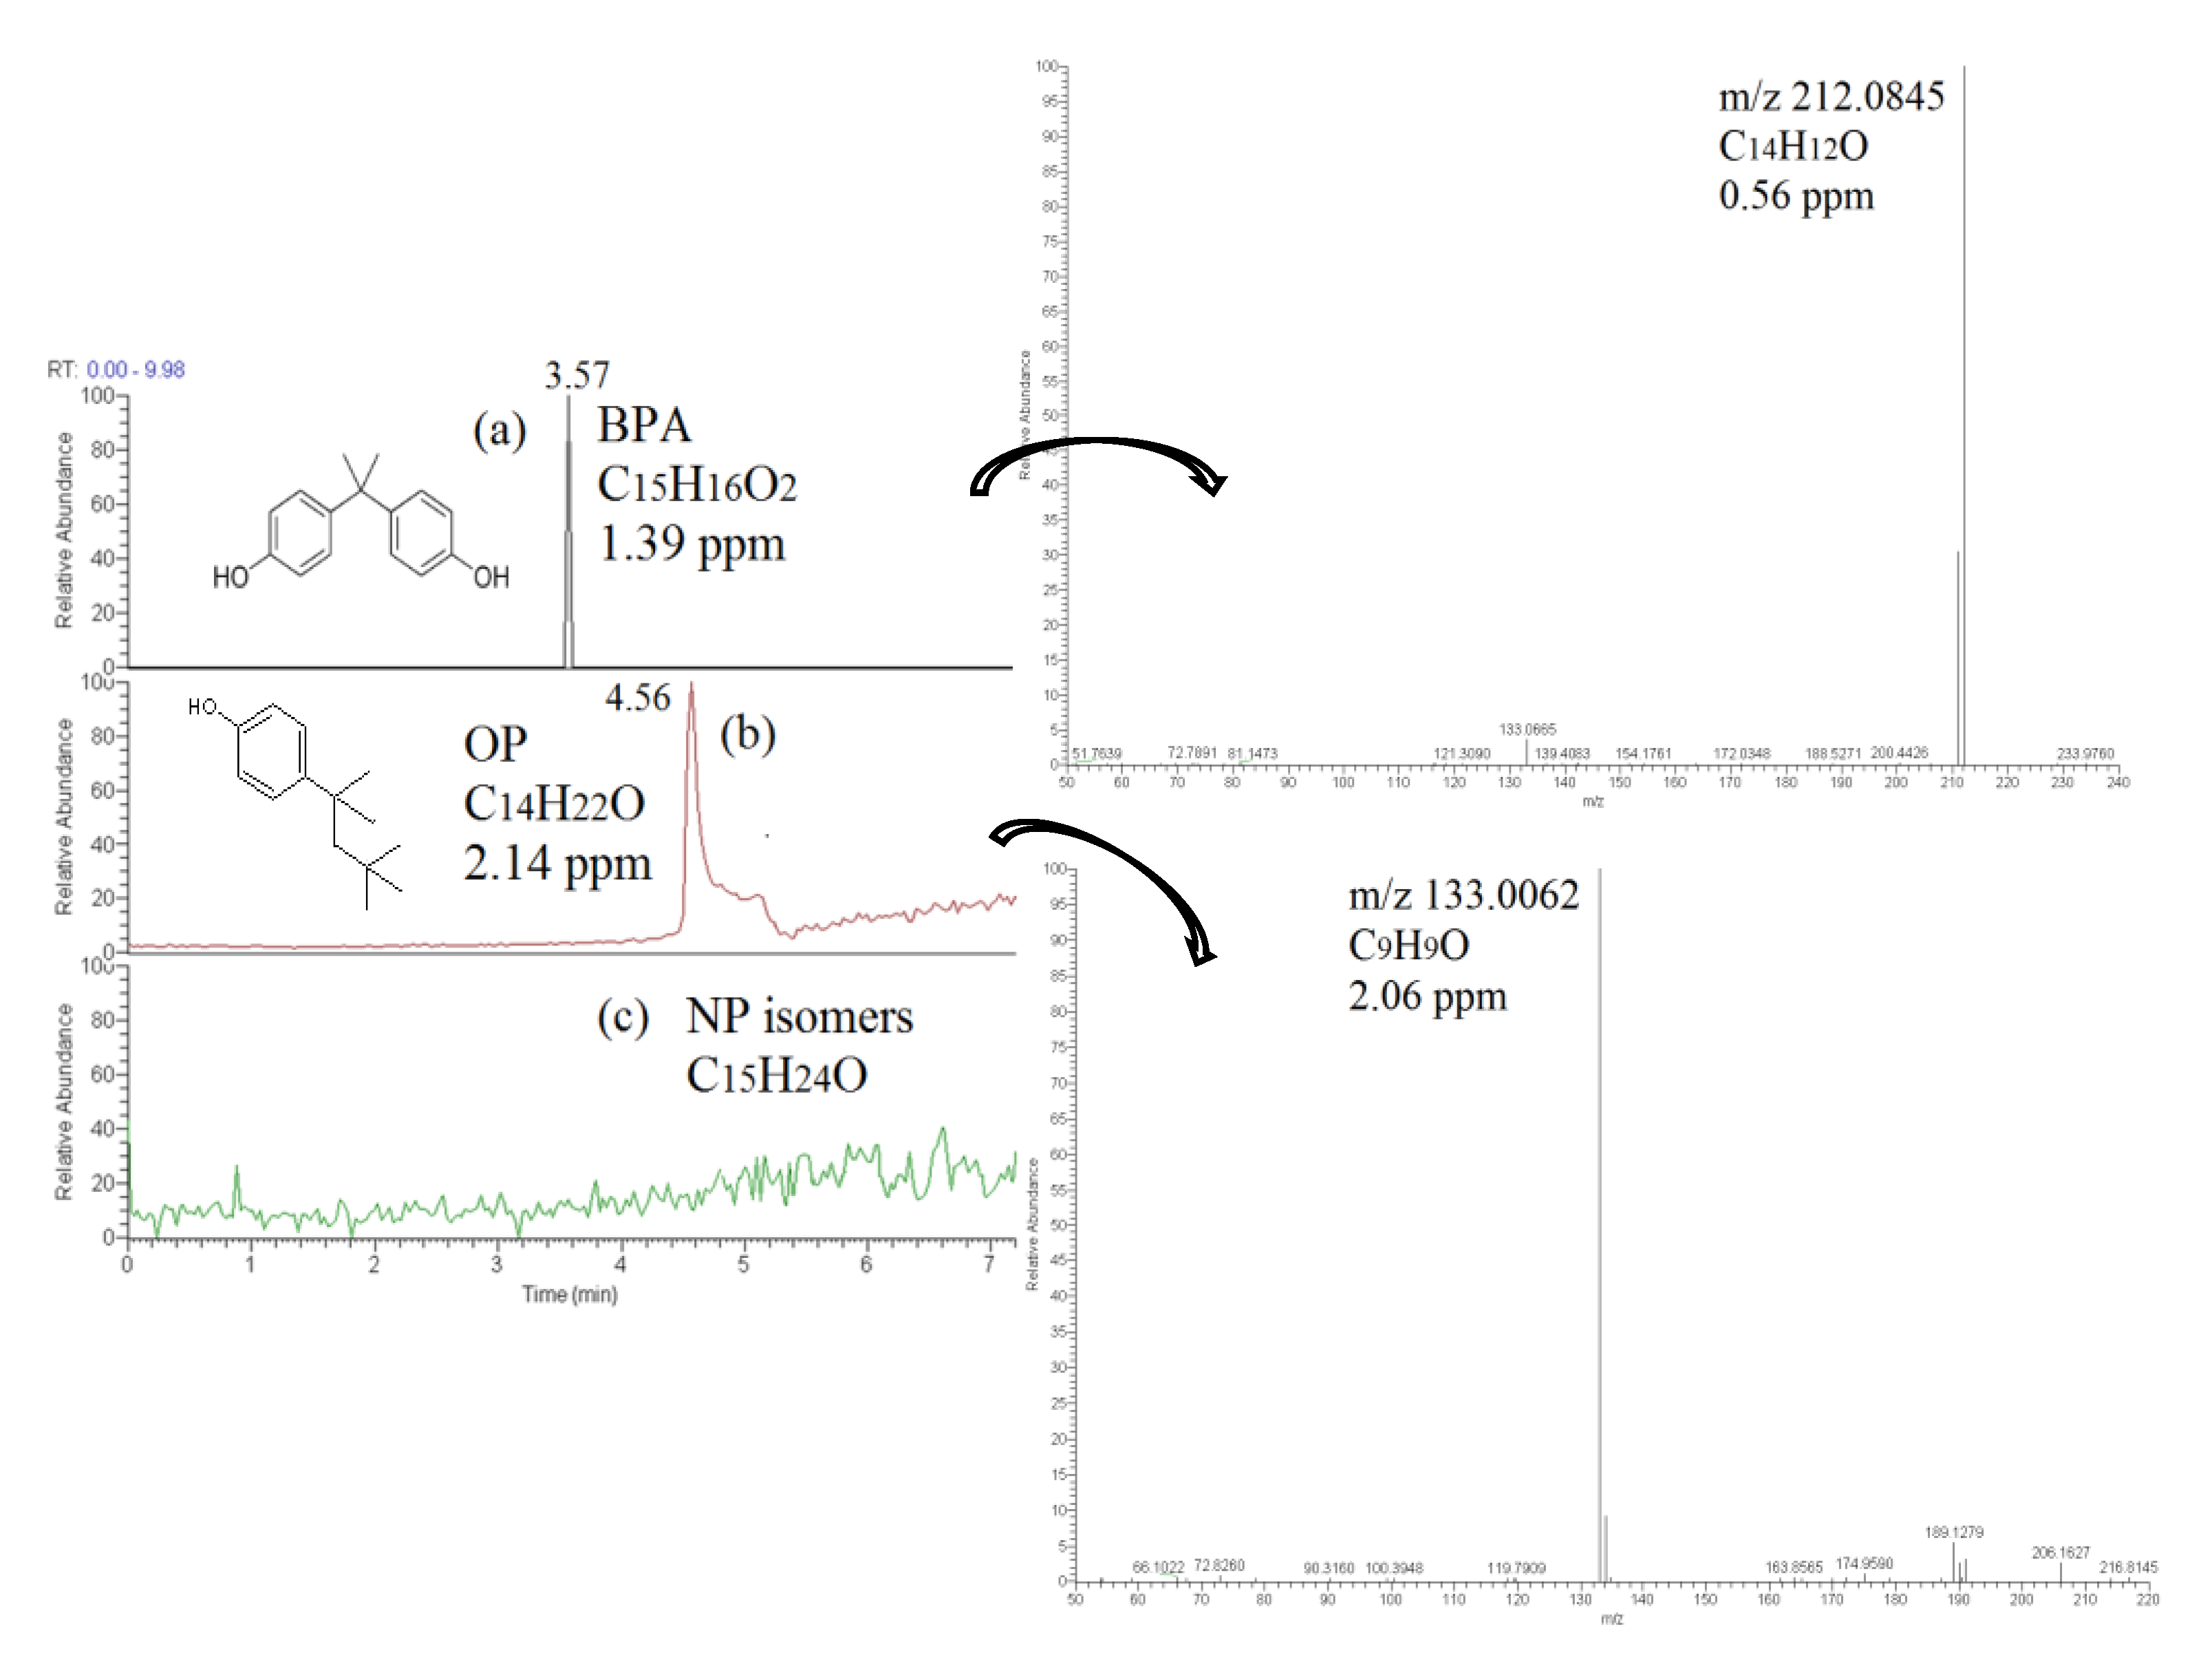
3.1. LC Separation-LTQ/Orbitrap MS Determination

Analytes of interest were satisfactorily separated using a methanol based gradient elution program in 9 min. It is noteworthy that injection of the analytes dissolved in methanol: water (1:1) allowed us to obtain better-defined chromatography peaks while the addition of 0.1% ammonia solution to all samples prior to analysis produced the best result concerning peak intensity and morphology (Figure S1). Identification of the target EDCs was based on their retention time in combination with the identified parent deprotonated [M-H] ion with excellent mass accuracy (<2 ppm at 50 ng mL−1, Table S2) at high resolution. The LC system proved indispensable for accurate mass measurements since discrimination of the two nonylphenol isomers is mandatory. In this case, structural isomers with the same accurate mass required a satisfactory separation, based on their different retention time rather than the exact mass (NP: 4.98 min and 4NP: 5.17 min; both accurate masses at m/z = 219.1754). Moreover, a resolution of 60,000 proved to be the best compromise between peak shape and width, mass deviation and data points over the chromatographic peak for this application. In the case that concerns complex matrices such as food of animal origin, an increased resolution power is suggested due to the reduction in the chemical noise [26].
As already mentioned, many parameters have to be considered for tuning when a new LC/MS method is developed for the quantitative analysis of known compounds. In the first set of screening experiments, as many parameters of the acquisition method as possible were optimized in the tuning sections of the instrument by direct infusion of known concentrations of the target EDCs, in order to achieve the maximum sensitivity and selectivity. The common tuning parameters for an ESI interface, i.e., tube lens and ion optics voltages, which depend mainly on the molecular structure of the analytes, as well as the capillary voltage, were optimized automatically. In order to simplify the statistical design and minimize the number of experiments, variables that were already automatically tuned or those deemed to have a negligible impact on tuning optimization for the target analytes were held constant (e.g., sheath and auxiliary gas flow rates that depend on the column flow rate and parameters already set such as tube lens). However, it was observed that the value of some parameters, such as the spray voltage, considerably contributed to the signal of the monitoring ions, thus it was selected as a parameter requiring further optimization. The ionization by ESI source occurs at the solution state; therefore, the mobile phase composition may affect the sensitivity of the analyte. To achieve the highest sensitivity, different modifiers were assayed in mobile phase such as ammonia and ammonium formate at pH values from 6.3 to 10.8. In this study, the best option proved to be ammonia rather than ammonium formate addition. Therefore, the percentage content of ammonia in the mobile phase was also subjected to further optimization. Along with spray voltage and ammonia content in the mobile phase, injection volume and oven temperature values were found to be of critical concern for the analytes’ chromatographic performance in terms of their peak signal-to-noise ratio (S/N). Then, a fractional factorial design 3(4−1) was employed in order to efficiently optimize the four most pronounced parameters affecting the LC-LTQ/Orbitrap MS analysis of BPA, OP and NP isomers and to determine whether a global maximum for S/N was within the experimental design region. In this design, 27 runs were randomly carried out (Table S3). The signal-to-noise ratio (S/N) of [M-H] pseudomolecular ions obtained from each run was used as the response, as a measure of sensitivity. The normality assumption was satisfied as the residual plot approximated along a straight line (Figure S2). According to the global desirability profile (Figures S3 and S4); the final optimum values for the studied parameters were as follows: injection volume 20 μL, spray voltage 3.5 V, percent content in NH3 0.1% and oven temperature 20 °C. Mass accuracy of measured ions (vs. theoretical) was <2 ppm in all cases (Table S2).
Further confirmation of the analytes residues was achieved through their main product ion under Collision Induced Dissociation (CID 45%) fragmentation process (Data-Dependent mode). The fragment ions produced were m/z 227.2006 → 212.0845 for BPA, m/z 205.1598 → 133.0662 for OP and m/z 219.1754 → 106.0431 for NP isomers, in accordance with existing literature (Table S2) [13,27].
Using the optimized conditions, seven-point calibration curves, in the range of 0.05–200 ng mL−1, were constructed using the peak areas corresponding to each analyte. The calibration graphs were constructed from three replicate measurements per point of the peak area. In all cases, experimental points fit a linear model with relative standard deviation (RSDs) lower than 4%. Excellent linearity in detector response was observed for all target compounds (>0.9994) while the instrument LOQs ranged from 0.05 ng mL−1 for BPA to 2.5 ng mL−1 for 4-NP.

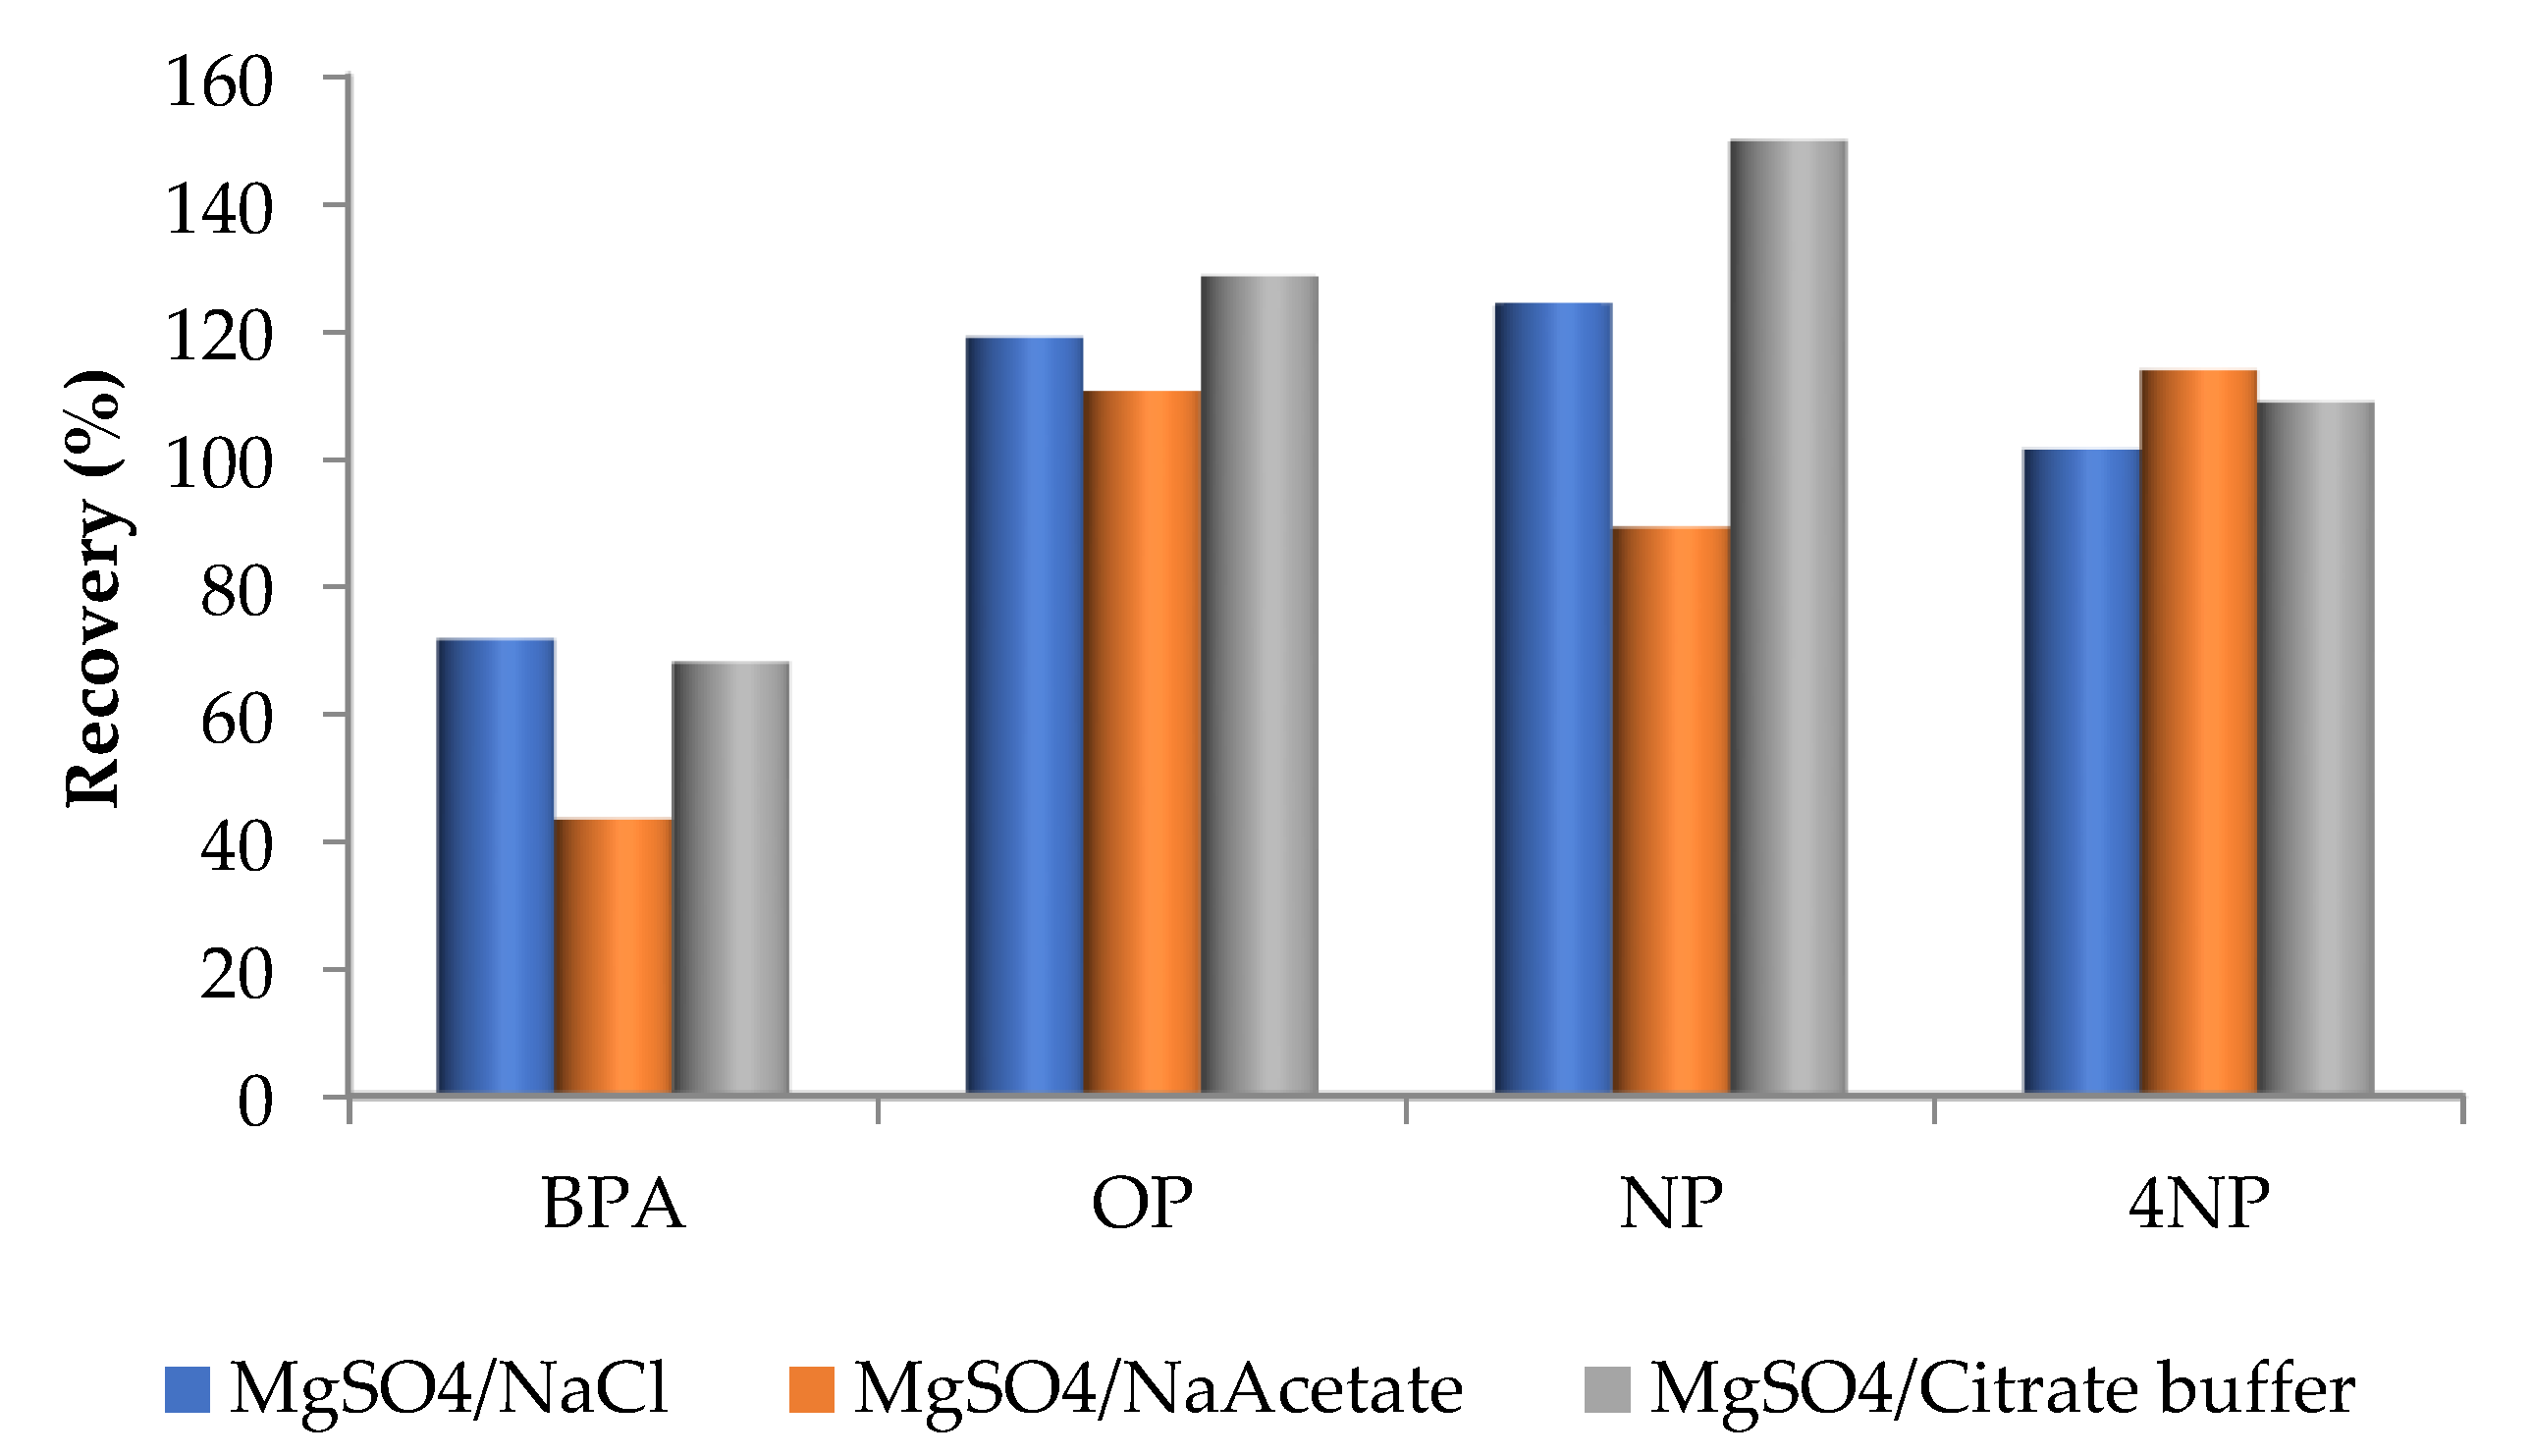
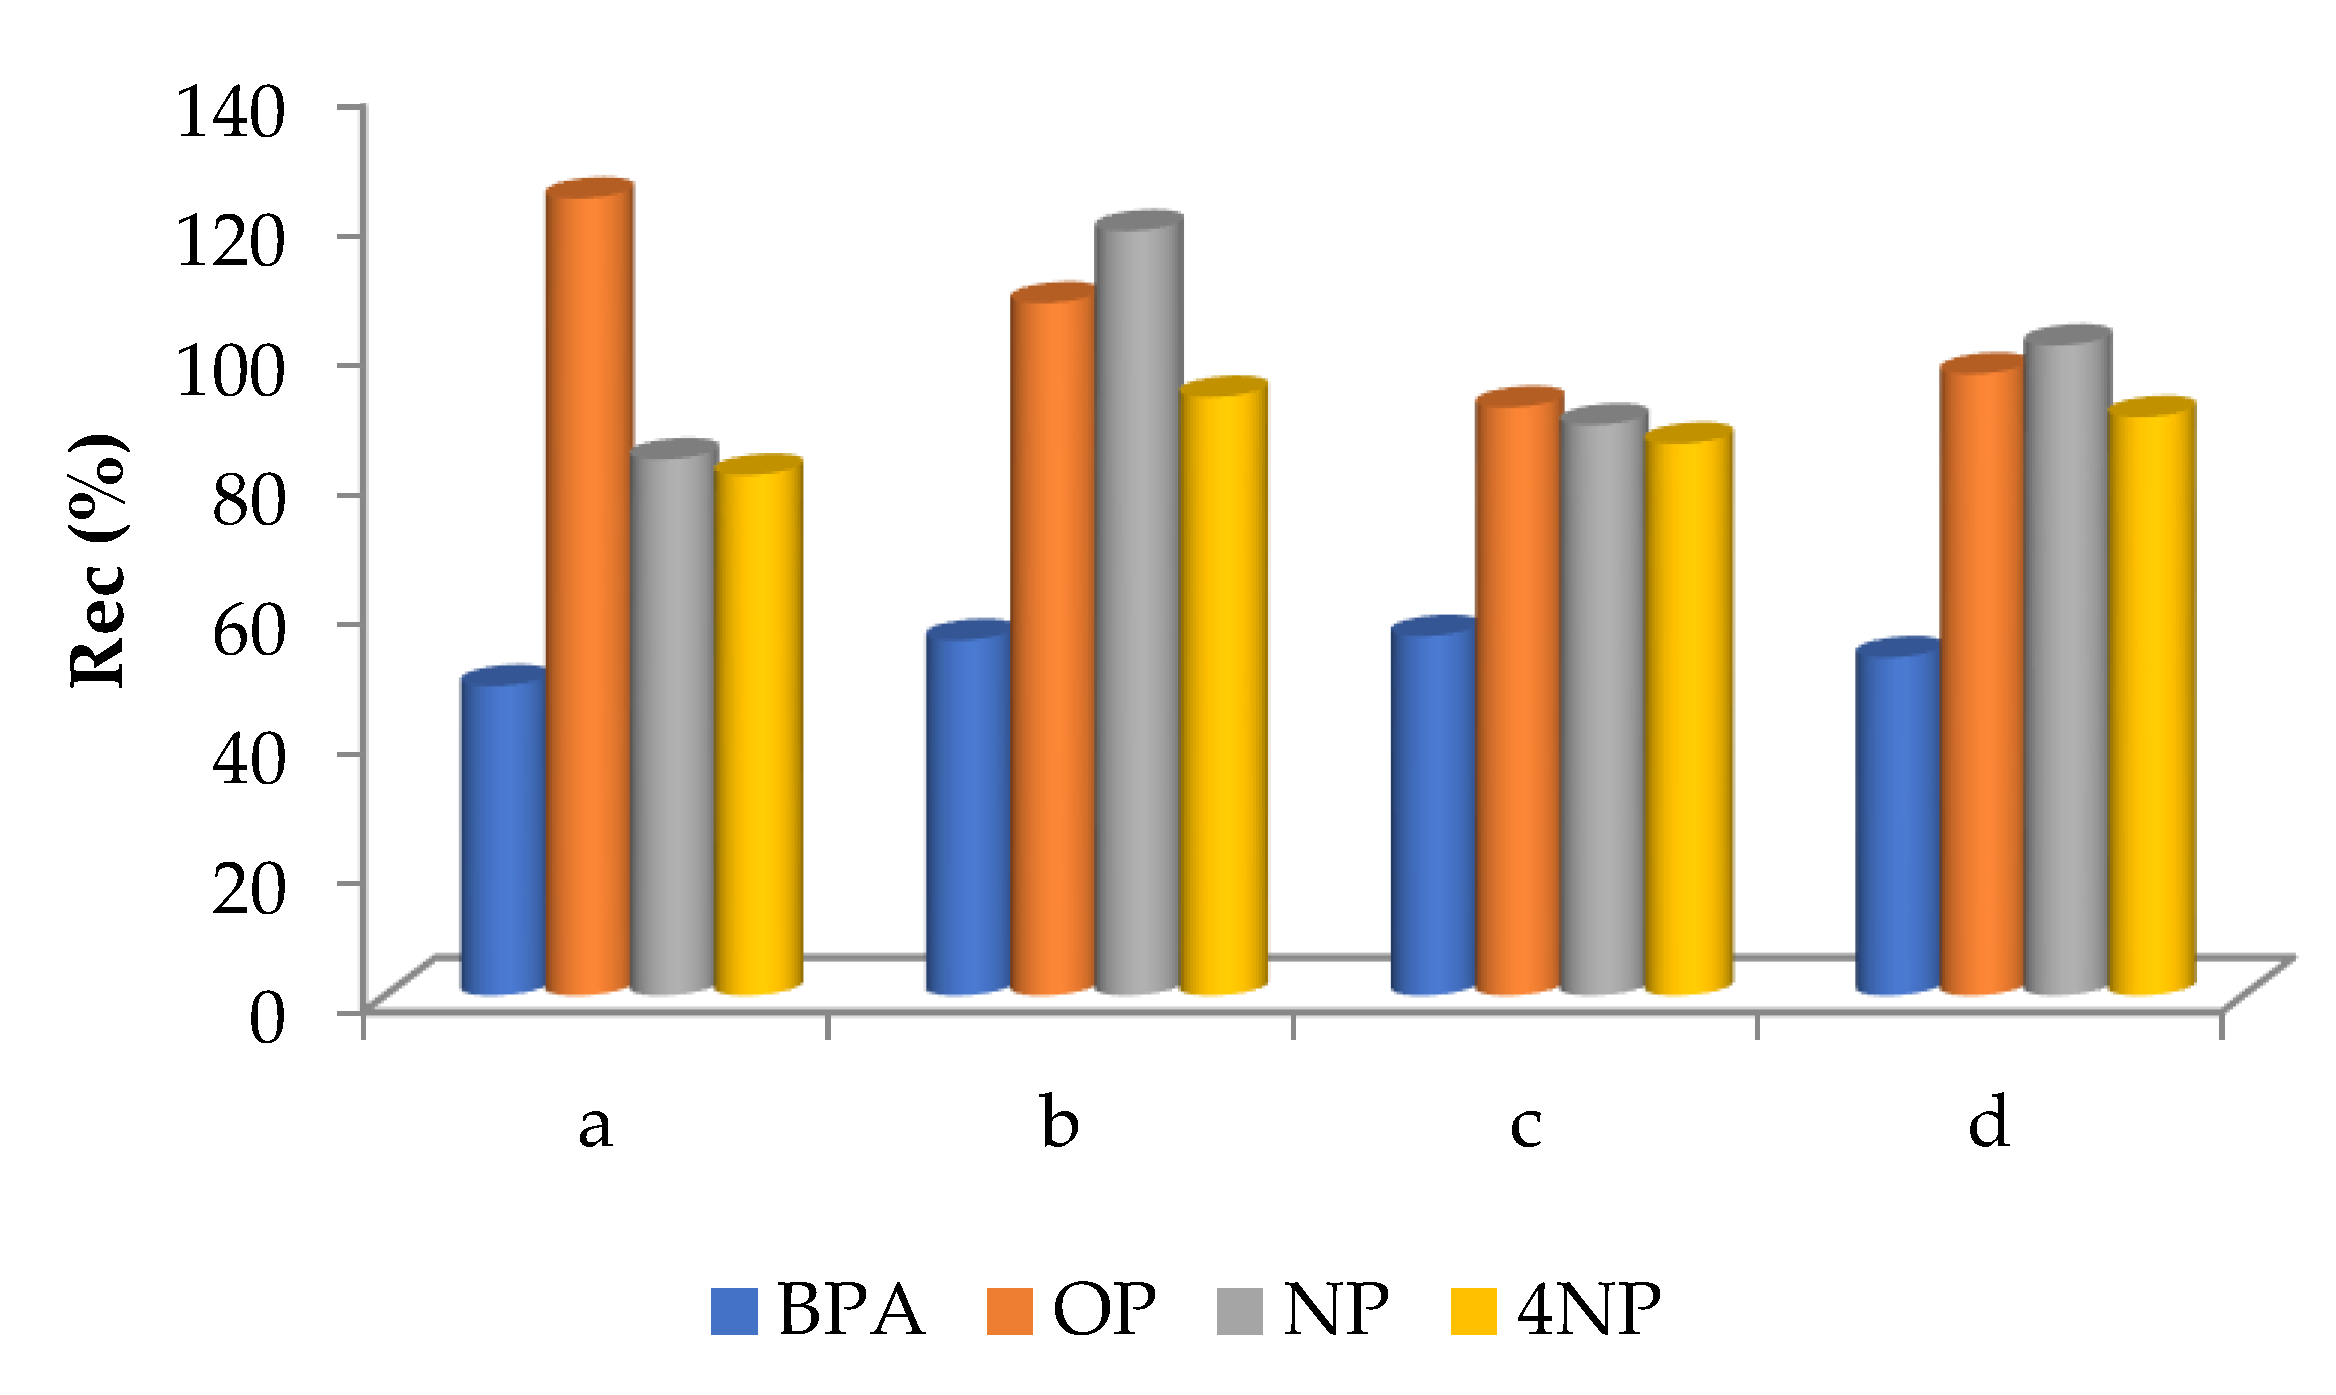
3.2. Optimization of QuEChERS Extraction Conditions

3.2.1. Preliminary Experiments

Due to the complex samples’ matrix (dairy products) and the analytes variety, investigation of the critical extraction method’s parameters was necessary. Preliminary experiments aimed at the selection of the appropriate extraction solvent as well as the suitable combination of the extraction and clean up sorbents. All parameters were studied in milk samples spiked with the EDCs mixture at a concentration level of 100 ng g−1. In detail, acetonitrile, acetonitrile/methanol (1:1), methanol/dichloromethane (1:1) and methanol were tested as extraction solvents. However, acetonitrile was found to be the most suitable since the extracts contained less interfering compounds and as expected it was easily separated from the aquatic phase [28]. On the contrary, methanol alone as well as methanolic mixtures produced cloudy and dirty extracts, being difficult to separate from the milk substrate along with extremely low recoveries observed for all analytes.
As far as the QuEChERS sorbents concerns, three basic extraction salt combinations were tested: (a) the original method using 4g MgSO4/1 g NaCl [29], (b) the official AOAC 2007.01 method using 6 g MgSO4/1.5 g NaAcetate [30] and (c) the official European CEN 15662/2008 method using 4 g MgSO4/1 g NaCl/ 1 g C6H5Na3O7•H2O and 0.5 g C6H6Na2O7•1.5H2O (citrate buffer) [31]. The first combination was found to be the most appropriate for the simultaneous bisphenol A and APs extraction from milk (Figure 1).
In the final step, the cleanup salts’ combination was studied as follows: (a) MgSO4/PSA, (b) MgSO4/PSA/C18, (c) MgSO4/PSA/GCB and (d) MgSO4/PSA/C18/GCB. As illustrated in Figure 2, the (b) salt combination was selected for the analysis of the target analytes since the first one exhibited lower recovery for BPA and NP isomers while at the same time producing quite enhanced (>120%) recovery for OP. The last two combinations, both containing graphitized carbon black (GCB) were rejected because recoveries were slightly reduced in all cases, whereas extracts were cloudy and tedious to separate.

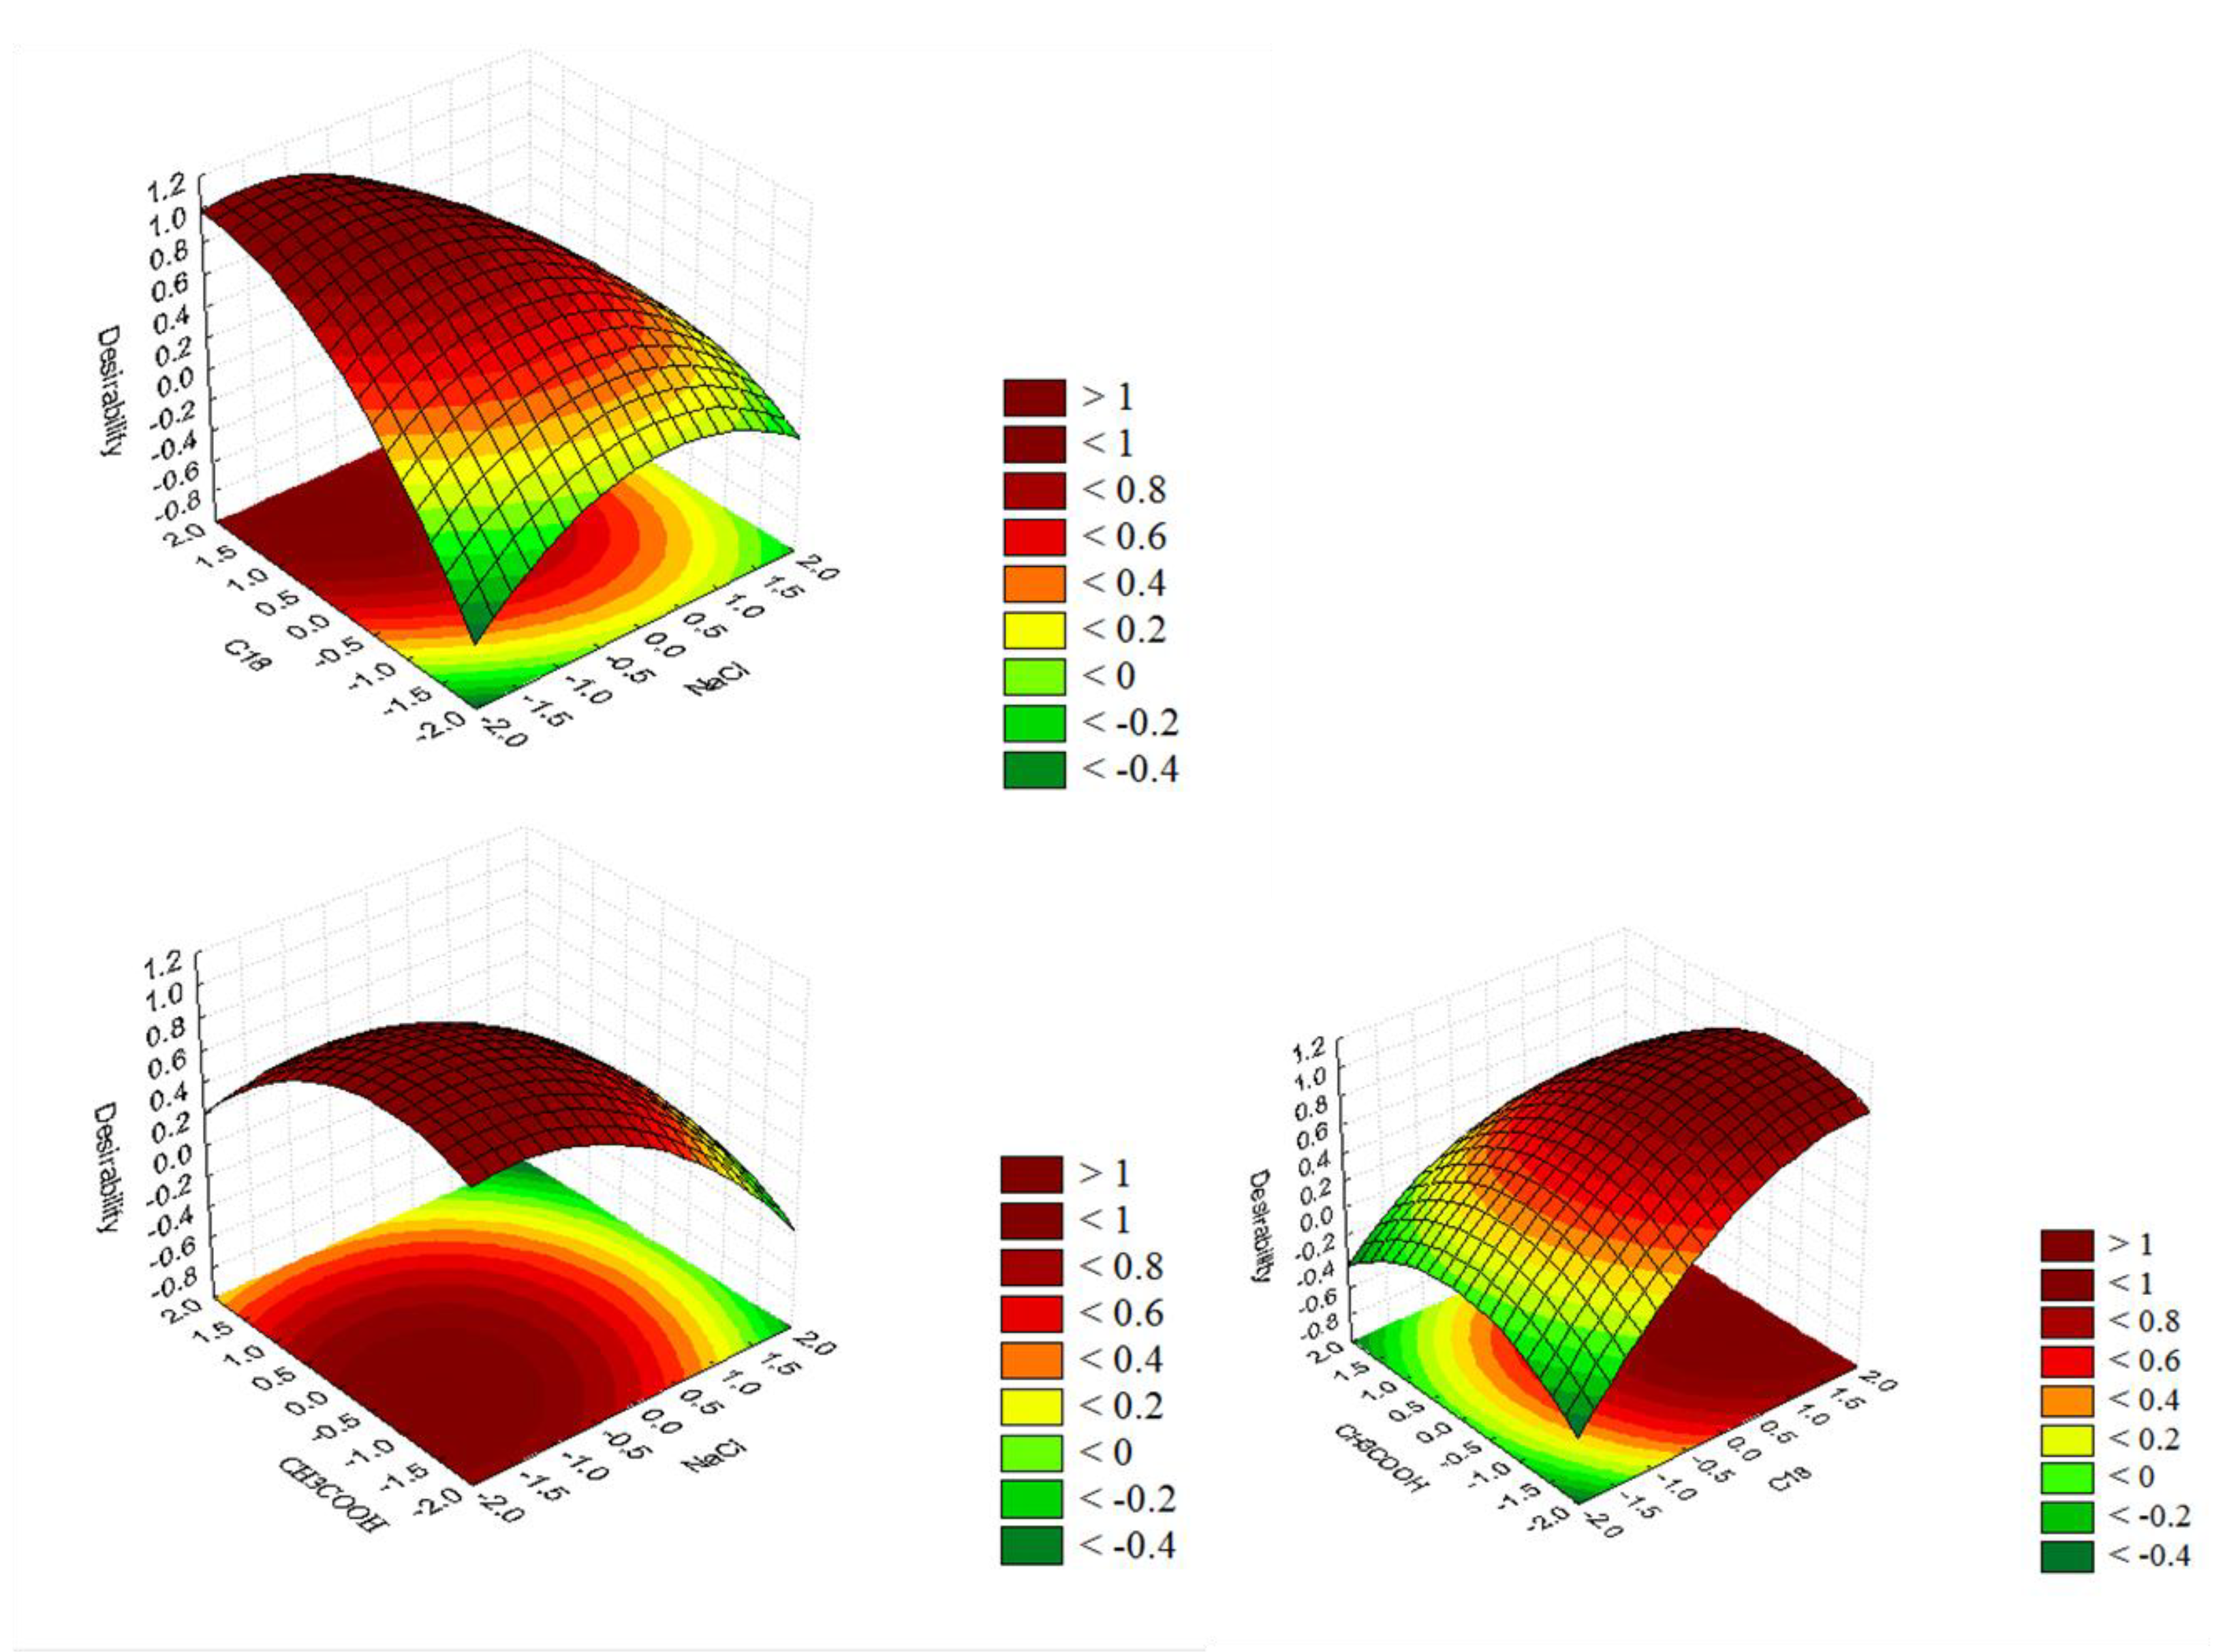
3.2.2. Multivariable Method

After having concluded in the extraction solvent (acetonitrile) and the suitable salts combination for the extraction and the cleanup steps of the QuEChERS method, more specific parameters should be checked: the sample amount, the sorbents amount, the solvent volume and the percent (%) content of acetic acid in the extraction solvent. For that purpose and since the parameters were satisfactory (7), a screening experimental design was employed in order to evaluate their effect on the analytes’ recoveries. The parameters were: (x1) the sample amount (mL), (x2) the solvent volume (ACN) (mL), (x3) the quantity of MgSO4 (g), (x4) the quantity of NaCl (g), (x5) the quantity of PSA (mg), (x6) the quantity of C18 (mg) and (x7) the percent content of CH3COOH (%). Thus, a 27−4 Plackett–Burman design was employed, and each of the seven parameters were investigated at two levels, a high (−1) and a low (+1). Eight runs in total were generated, plus three central points (0) (Table S4), and the measured response of each run was the mean recovery of the target EDCs. QuEChERS extraction was performed in milk fortified at the same concentration level, 100 ng g−1. An effect was considered significant when it was above the standard error at the 95% confidence level (p < 0.05), which is denoted by the vertical line on the Pareto chart. Positive signs indicate that increasing the value of this variable there is also an enhancement in the measured response, being in this case the mean recovery of the target EDCs. Negative signs indicate, respectively, a negative correlation with the measured response. In the studied experimental domain (see Pareto chart in Figure S5), all factors proved to be statistically significant at a 95% confidence level except the amount of MgSO4 which was excluded from the study (Table S5). The effect of the acetonitrile volume and the sample amount were found to be significant; however, these variables were not taken into consideration for further investigation since it was found from previous experiments that the optimum solvent-to-sample amount ratio would be 1:1. Moreover, using a small volume of solvent (e.g., 5 mL) resulted in various practical problems (e.g., difficulty in the organic phase separation) during the experimental setup. Three parameters remained as the most crucial ones and were subjected to further study via a central composite design (CCD): the amounts of NaCl and C18 and the percent (%) content of acetic acid in the extraction solvent.
CCD was a fractional factorial 23 design which included six-star points in the distance α (α = 1.682) from the central point. Seventeen experiments were run in total in random order and three variables were checked, each one at five levels (−α, −1, 0, 1, +α) and three central points (0) (Table S6). The main effects, interaction effects, as well as quadratic effects were evaluated through analysis of variance (ANOVA) at spiking concentration level of 100 ng g −1 (Table S7). Lack of fit was also checked and was shown to be not significant relative to the pure error, indicating a good response to the model (Table S7). The normality assumption was satisfied as the residual plot approximated along a straight line (Figure S6). Pareto chart (Figure S7) indicated the linear (L), quadratic (Q) as well as the interaction effects on the method performance. The following second-order polynomial equation describes the proposed model:
Y = 104.8 (±1.82) − 5.8x1 (±0.86) + 6.8x2 (±0.86) − 6.2x12 (±0.94) − 5.2x22 (±0.94)−5.5x32 (±0.94) − 6.2x1x2 (±1.1)
where, x1 the amount of NaCl (g), x2 the amount of C18 (mg), x3 the % amount of CH3COOH and x12, x22 and x32 and x1x2 the interactions between the corresponding factors x1, x2 and x3.
The NaCl and C18 amounts’ interaction proved to be statistically significant, exhibiting a negative sign which asserts the antagonistic interaction among these factors. Figure 3 (response surface plots) is indicative of the fact that the combination of both high and low values of the above-mentioned factors leads to decreased QuEChERS performance (R < 56%). In general, NaCl is added to control selectivity by reducing polar interference and water in acetonitrile-phase. On the other hand, C18 addition removes long chain fatty compounds, sterols and other non-polar interference. According to the desirability profile (Figure S8), the optimized parameter values were determined at the optimum value of the mean recovery being 113%.
In conclusion, the overall optimum values of the QuEChERS parameters were: 10 g of milk sample, 10 mL of extraction solvent (ACN), 6 g MgSO4 and 1.04 g NaCl (extraction salts), 150 mg MgSO4, 50 mg PSA and 52.3 mg C18 (cleanup salts) and 1.1% CH3COOH in the extraction solvent. The adequacy of the predicted optimization model was also checked by performing analysis with the optimum conditions and was found to be well-fitted to real experimental conditions with the analytical method exhibiting excellent performance.

3.3. Analytical Performance of the Method

The analytical performance of the optimized QuEChERS methodology was evaluated in terms of linearity, precision, accuracy expressed as recovery, limits of detection and quantification (Table 1) in accordance with the Documents N° SANTE/11813/2017 and N° SANTE/12682/2019 [32,33] while the matrix effect was also investigated.
Matrix effect was evaluated as it is well known that co-extracted and co-eluting matrix substances can seriously affect the analyte signals, by enhancing or suppressing the analyte responses. For this purpose, the slopes of (a) the calibration curve of the analytes spiked in milk extracts (matrix-matched standards) and (b) the analytes standard solutions were compared. The ratio (a/b × 100) is defined as the matrix effect (ME %). A value of 100% means that there is no matrix effect. There is an enhancement if the value is >100% and signal suppression if the value is <100%. Matrix effect results (Figure S9) demonstrated that bisphenol A exhibited relatively low ionization suppression while both nonylphenol isomers and octylphenol showed a quite strong ionization enhancement. Therefore, matrix-matched calibration curves were used in the quantification to compensate for the matrix effect observed.
The method linearity was evaluated by constructing method calibration curves (n = 2), after milk extraction under the optimum conditions, in the range of 0.1–200 ng g−1. Good linearity was observed in the studied concentration range with correlation coefficients varying from 0.9966 to 0.9999. The precision determines the analytical deviation and is one of the most important criteria for evaluating analytical method performance. The intra-assay precision (repeatability) was determined within the same day and consisted of two series, and six replicates at the concentration level of 100 ng g−1. Inter-assay precision (reproducibility) was calculated in two series, and six replicates at the same concentration within three different days. The repeatability and reproducibility of the target chemicals, both expressed as relative standard deviation, ranged from 0.6 to 13.3% and from 4.7 to 23.2%, respectively. Detection and quantification limits of the whole method were calculated as signal-to-noise ratios of 3 and 10, respectively. LOQs and LODs achieved were low enough in the range of 0.1–20 ng g−1 and 0.05–5 ng g−1 as expected when the analysis is carried out by HR instruments.
To estimate the extraction method accuracy in terms of recoveries, milk samples previously fortified with the target analytes at two concentration levels, 5 and 50 ng g−1, were extracted and analyzed in triplicates. Recovery values obtained for each analyte were high over the range of 91% (OP) to 108% (4NP). Additionally, yogurt samples spiked at two concentration levels (10 and 50 ng g−1), were also extracted with the optimized method in order to investigate its applicability to other dairy products (Table S8). Good recoveries (73.8-105.4%) were obtained, indicating the feasibility of the suggested QuEChERS-based methodology to the analysis of different types of dairy products.

3.4. Application to Real Samples

In order to demonstrate the applicability of the proposed QuEChERS- LC-LTQ/Orbitrap MS methodology, twenty-seven (27) representative dairy commodity samples were analyzed (see Section 2.2). The results are summarized in Table 2.
The mean concentration values of the EDCs determined were calculated from the samples where analytes were detected at concentrations above the method quantification limits (>LOQs). Generally, 96.3% of the samples analyzed contained the target analytes while in only 3.7% of them no residues were found, which is mainly attributed to the positive detections of octylphenol. A characteristic Extracted Ion (EI) Chromatogram of a yogurt sample found to contain both BPA and OP residues after being subjected to QuEChERS extraction followed by LC-LTQ/Orbitrap MS analysis is shown in Figure 4. The Data Dependent Orbitrap FT spectrum that confirms the identity of BPA and OP residues detected is illustrated. Low mass deviation (<2.14 ppm) was observed for both parent and fragment ions.
The detailed results from the dairy commodities’ analysis are depicted in Figure S10. According to the results, 4-t-OP has been the most frequently detected compound. It is followed by the NP isomers and lastly BPA, for which the lower detection frequency rate was observed (31.0%). Overall results (patterns and levels) were within the range reported in previous publications for the corresponding matrices [9,34,35,36,37,38,39], which indicate the undoubting presence of these compounds in dairy commodities, even when infant formulas are concerned. However, no Maximum Residue Limits (MRLs) have been established for these industrial chemicals. Nevertheless, along with the need for further toxicity studies and food monitoring, the European Food Safety Authority (EFSA) completed its first full risk assessment of BPA in 2006 [40], which established a Tolerable Daily Intake (TDI) of 50 ng g-1 (body weight), with exposure below this level. Since then, EFSA has reviewed new scientific information on BPA several times. Based on EFSA opinion of 2015 [15], the TDI—however, temporary (t)—was lowered to 4 ng g−1 of bw/day. Furthermore, BPA dietary intake can be calculated based on the recommended t-TDI using the following formula:
Daily   intake = C * d I R B W
where C is the average or maximum BPA concentration (μg kg−1) found across the analyzed milk samples; dIR is the daily ingestion rate (daily consumption of milk in Greece) and BW is the corresponding average Body Weight of consumers. Similarly to other studies [41,42], the dIR used in the above equation is the average daily consumption of milk in Greece for adults, estimated to be 264.9 g /day according to the National Dietary Guidance for adults [43]. Bw is the corresponding average body weight of 60 kg for Greek consumers. Detected concentration levels (MDL-10.4 ng g−1) for BPA in milk samples resulted in 0.36% of TDI for the medium case (average BPA concentrations) and 1.15% of TDI for the worst case (maximum BPA concentration).
Based, also, on some uncertainty in the meantime [44], a ban was placed upon the use of BPA in polycarbonate infant feeding bottles based on the precautionary principle. Moreover, a specific migration limit (SML), expressed in mg of substance per Kg of food (mg Kg−1), was established for BPA at 0.05 mg of BPA per Kg of food (mg Kg−1) [45]. According to the above report, BPA levels, do not exceed in any case the above-mentioned migration level of food packaging materials. Even though octylphenol was detected in almost all analyzed samples, concentration levels were quite low in milk (<4.5 μg Kg−1) whereas in other dairy products and the infant ones were found to range from 169.1 to 301.4 μg Kg−1. The opposite was observed for nonylphenol isomers that were detected mostly in milk samples (<428.7 μg Kg−1) while other dairy products (mostly yogurts) rarely contained NP residues. A possible explanation is the relation of these results to the industrial processes of these co-products from milk and yogurt and their packaging material. For example, milk samples were mostly in paper packaging, while other commodities were in aluminum or plastic ones. Figure S11 illustrates the positive detections according to the type of packaging material.
Moreover, the classification of the samples according to the fat content and its relation to the detected residues would be of particular interest (Figure 5). Despite the strong lipophilic properties of NPs expressed by the logarithm of the octanol/water partition coefficient of 4.2, higher percent concentrations of NPs were found in low-fat dairy products, e.g., chocolate milk of 1% fat (428.7 μg Kg−1 of 4NP) contrary to unexpected low concentrations found in high-fat dairy foodstuffs, e.g. condensed milk of 7% fat (49.3 μg Kg−1 of NP). This observation is in agreement with other studies where results showed that the concentrations of NPs did not correlate with the food fat content [34]. As far as the less lipophilic BPA (Kow of 2.2–3.4) is concerned, it seems that it is equally detected in all food commodities, and its appearance is not related to the fat content of foodstuffs. The same pattern was observed in the case of 4-tert-OP.

4. Conclusions

QuEChERS-based extraction methodology combined with LC-LTQ/Orbitrap MS has been optimized by chemometric approaches, with the significant factors determined using a P–B screening design and subsequently optimized using CCD combined with DF, for the determination of the selected EDCs, BPA, OP and NP isomers in dairy matrices. The methodology was validated fulfilling the requirements of performance characteristics. The successful application of the developed method to dairy samples confirmed its reliability and efficacy as a method of choice for routine analysis of a wide variety of dairy products for the selected EDCs residues. Detected concentration levels are not related to the fat content of foodstuffs while no clear trends can be concluded in relation to the packing material. Finally, for BPA the detected concentration levels in milk samples resulted in less than 1.15% of the tolerable daily intake.

Supplementary Materials

The following are available online at https://www.mdpi.com/article/10.3390/app11209358/s1, Table S1: Characteristics of the selected dairy products; Table S2: Data from LC-Orbitrap/MS2 analysis of the target EDCs; Table S3: LC-Orbitrap MS parameters under investigation using a fractional factorial design 3(4-1) and their coded values; Table S4: Plackett–Burman design with the selected factors and their coded values; Table S5: ANOVA table generated from the Plackett–Burman design; Table S6: The Central Composite Design (CCD) including the selected factors after screening design and the mean recovery (%) used as optimal response; Table S7: ANOVA table generated from the Central Composite Design (CCD); Table S8: Mean recoveries obtained from the optimized QuEChERS extraction of the target EDCs from yogurt samples at 10 and 50 ng g−1 fortification levels; Figure S1: LC-LTQ/Orbitrap MS extracted ion (EI) chromatogram of a standard solution of the selected compounds at a concentration level of 100 μg L−1. Peaks are assigned as follows: (1) BPA, (2) OP, (3) NP (t), (4) 4NP; Figure S2: Normal probability plot of the studentized residuals (normality test curve for the fractional factorial design 3(4-1)); Figure S3: Profile of the predicted values and desirability function of the analytes response (S/N). Optimum values are designated by dotted lines; Figure S4: Response surface plots for the fractional factorial design 3(4-1); Figure S5: Standardized main effect Pareto chart for the Plackett–Burman design of the screening experiment. Vertical line in the chart defines 95% confidence level; Figure S6. Normal probability plot of the studentized residuals (normality test curve for the central composite design 23); Figure S7: Pareto chart for the Central Composite Design (CCD). Vertical line in the chart defines 95% confidence level; Figure S8: Profile of the predicted values and desirability function of the analytes’ response (mean recovery %) after CCD employment. The optimal values are designated by dotted lines; Figure S9: Matrix effect of the EDCs under study, calculated from the slopes of the calibration curves; Figure S10: (a) Concentration levels of EDCs residues; (b) percentage concentration patterns in all dairy commodities analyzed by QuEChERS coupled to LC-Orbitrap MS. Numbers of the commodities are assigned according to Table S1; Figure S11: Mean concentrations (μg kg−1) of the detected EDCs in relation to the type of the packaging material of the analyzed dairy commodities.

Author Contributions

Conceptualization, V.B. and T.A.; data curation, V.B. and V.K.; formal analysis, V.B., V.K. and I.K.; funding acquisition, T.A. and I.K.; investigation, V.B. and V.K.; methodology, V.B., V.K. and I.K.; resources, T.A.; software, V.B. and V.K.; supervision, T.A.; validation, V.B. and V.K.; visualization, V.B. and V.K.; writing—original draft, V.B., V.K. and I.K.; writing—review and editing, V.B. and I.K. All authors have read and agreed to the published version of the manuscript.

Funding

This research was funded by “FoodOmicsGR Comprehensive Characterisation of Foods” (MIS 5029057) which is implemented under the Action “Reinforcement of the Research and Innovation Infrastructure”, funded by the Operational Programme “Competitiveness, Entrepreneurship and Innovation” (NSRF 2014-2020) and co-financed by Greece and the European Union (European Regional Development Fund).

Institutional Review Board Statement

Not applicable.

Informed Consent Statement

Not applicable.

Data Availability Statement

Not applicable.

Acknowledgments

The authors would like to acknowledge the support by the project “FoodOmicsGR Comprehensive Characterisation of Foods” (MIS 5029057). The authors would also like to thank the Unit of Environmental, Organic and Biochemical high-resolution analysis–Orbitrap-LC–MS of the University of Ioannina for providing access to their facilities.

Conflicts of Interest

The authors declare no conflict of interest.

References

  1. Colborn, T.; Dumanoski, D.; Myers, J.P. Our Stolen Future: Are We Threatening our Fertility, Intelligence and Survival? A Scientific Detective Story; Dutton: New York, NY, USA, 1997. [Google Scholar]
  2. Guillete, L.; Crain, D.A. Environmental Endocrine Disrupters: An Evolutionary Perspective; Taylor & Francis, Inc.: Abingdon, UK, 2000. [Google Scholar]
  3. Shelby, M.D. NTP-CERHR monograph on the potential human reproductive and developmental effects of bisphenol A. NTP CERHR MON. 2008, 22, vii–ix, 1–64. [Google Scholar]
  4. Zhou, R.Z.; Jiang, J.; Mao, T.; Zhao, Y.S.; Lu, Y. Multiresidue analysis of environmental pollutants in edible vegetable oils by gas chromatography–tandem mass spectrometry. Food Chem. 2016, 207, 43–50. [Google Scholar] [CrossRef] [PubMed]
  5. Vazquez-Duhalt, R.; Marquez-Rocha, F.; Ponce, E.; Licea, A.F.; Viana, M.T. Nonyphenol, an integrated vision of a pollutant. Appl. Ecol. Environ. Res. 2005, 4, 1–25. [Google Scholar] [CrossRef]
  6. Commission Directive 2013/39/EU amending Directives 2000/60/EC and 2008/105/EC as regards priority substances in the field of water policy. Off. J. Eur. Union 2013, L226, 1–17.
  7. Commission Directive 2003/53/EC. Amending for the 26th time the Council directive 76/769/EEC relating to restrictions on the marketing and use of certain dangerous substances and preparations (nonylphenol, nonylphenol ethoxylate and cement). Off. J. Eur. Union 2003, L178, 24–27.
  8. Chevolleau, S.; Debrauwer, L.; Stroheker, T.; Viglino, L.; Mourahib, I.; Meireles, M.H.; Grimaldi, M.; Balaguer, P.; Di Gioia, L. A consolidated method for screening the endocrine activity of drinking water. Food Chem. 2016, 213, 274–283. [Google Scholar] [CrossRef]
  9. Ferrer, E.; Santoni, E.; Vittori, S.; Font, G.; Mañes, J.; Sagratini, G. Simultaneous determination of bisphenol A, octylphenol, and nonylphenol by pressurised liquid extraction and liquid chromatography–tandem mass spectrometry in powdered milk and infant formulas. Food Chem. 2011, 126, 360–367. [Google Scholar] [CrossRef]
  10. Fairbairn, D.J.; Arnold, W.A.; Barber, B.L.; Kaufenberg, E.F.; Koskinen, W.C.; Novak, P.J.; Rice, P.J.; Swackhamer, D.L. Contaminants of Emerging Concern: Mass Balance and Comparison of Wastewater Effluent and Upstream Sources in a Mixed-Use Watershed. Environ. Sci. Technol. 2016, 50, 36–45. [Google Scholar] [CrossRef]
  11. Salgueiro-González, N.; Turnes-Carou, I.; Besada, V.; Muniategui-Lorenzo, S.; López-Mahía, P.; Prada-Rodríguez, D. Occurrence, distribution and bioaccumulation of endocrine disrupting compounds in water, sediment and biota samples from a European river basin. Sci. Total Environ. 2015, 529, 121–130. [Google Scholar] [CrossRef]
  12. Albero, B.; Sánchez-Brunete, C.; Miguel, E.; Tadeo, J.L. Application of matrix solid-phase dispersion followed by GC–MS/MS to the analysis of emerging contaminants in vegetables. Food Chem. 2017, 217, 660–667. [Google Scholar] [CrossRef]
  13. Chen, M.; Fan, Z.; Zhao, F.; Gao, F.; Mu, D.; Zhou, Y.; Shen, H.; Hu, J. Occurrence and Maternal Transfer of Chlorinated Bisphenol A and Nonylphenol in Pregnant Women and Their Matching Embryos. Environ. Sci. Technol. 2016, 50, 970–977. [Google Scholar] [CrossRef]
  14. Cunha, S.C.; Fernandes, J.O. Assessment of bisphenol A and bisphenol B in canned vegetables and fruits by gas chromatography-mass spectrometry after QuEChERS and dispersive liquid-liquid microextraction. Food Control 2013, 33, 549–555. [Google Scholar] [CrossRef]
  15. Khedr, A. Optimized extraction method for LC–MS determination of bisphenol A, melamine and di(2-ethylhexyl) phthalate in selected soft drinks, syringes, and milk powder. J. Chromatogr. B 2013, 930, 98–103. [Google Scholar] [CrossRef]
  16. EFSA Panel on Food Contact Materials, Enzymes, Flavourings and Processing Aids (CEF), Scientific Opinion on the risks to public health related to the presence of bisphenol A (BPA) in foodstuffs. EFSA J. 2015, 13, 3978. [CrossRef]
  17. Chen, J.; Mullin, C.A. Determination of nonylphenol ethoxylate and octylphenol ethoxylate surfactants in beehive samples by high performance liquid chromatography coupled to mass spectrometry. Food Chem. 2014, 158, 473–479. [Google Scholar] [CrossRef]
  18. Fasano, E.; Cirillo, T.; Esposito, F.; Lacorte, S. Migration of monomers and plasticizers from packed foods and heated microwave foods using QuEChERS sample preparation and gas chromatography/mass spectrometry. Food Sci. Technol. 2015, 64, 1015–1021. [Google Scholar] [CrossRef]
  19. Munaretto, J.S.; Ferronato, G.; Ribeiro, L.C.; Martins, M.L.; Adaime, M.B.; Zanella, R. Development of a multiresidue method for the determination of endocrine disrupters in fish fillet using gas chromatography–triple quadrupole tandem mass spectrometry. Talanta 2013, 116, 827–834. [Google Scholar] [CrossRef]
  20. Pastor-Belda, M.; Viñas, P.; Campillo, N.; Hernández-Córdoba, M. Magnetic solid phase extraction with CoFe2O4/oleic acid nanoparticles coupled to gas chromatography-mass spectrometry for the determination of alkylphenols in baby foods. Food Chem. 2017, 221, 76–81. [Google Scholar] [CrossRef]
  21. Wu, H.; Li, G.; Liu, S.; Hu, N.; Geng, D.; Chen, G.; Sun, Z.; Zhao, X.; Xia, L.; You, J. Monitoring the contents of six steroidal and phenolic endocrine disrupting chemicals in chicken, fish and aquaculture pond water samples using pre-column derivatization and dispersive liquid–liquid microextraction with the aid of experimental design methodology. Food Chem. 2016, 192, 98–106. [Google Scholar]
  22. Shao, B.; Han, H.; Tu, X.; Huang, L. Analysis of alkylphenol and bisphenol A in eggs and milk by matrix solid phase dispersion extraction and liquid chromatography with tandem mass spectrometry. J. Chromatogr. B 2007, 850, 412–416. [Google Scholar] [CrossRef]
  23. Gallart-Ayala, H.; Moyano, E.; Galceran, M.T. Analysis of bisphenols in soft drinks by on-line solid phase extraction fast liquid chromatography–tandem mass spectrometry. Anal. Chim. Acta 2011, 683, 227–233. [Google Scholar] [CrossRef]
  24. Perez, S.; Eichhorn, P.; Barcelo, D. Applications of Time-of-Flight and Orbitrap Mass Spectromentry in Environmental, Food, Doping and Forensic Analysis. In Wilson and Wilson’s Comprehensive Analytical Chemistry; Damia Barcelo, Ed.; Elsevier: Amsterdam, The Netherlands, 2016; Volume 71. [Google Scholar]
  25. Commission Directive 2002/63/EC establishing Community methods of sampling for the official control of pesticide residues in and on products of plant and animal origin and repealing Directive 79/700/EEC. Off. J. Eur. Communities 2002, L187, 30.
  26. Yan, H.; Liu, X.; Cui, F.; Yun, H.; Li, J.; Ding, S.; Yang, D.; Zhang, Z. Determination of amantadine and rimantadine in chicken muscle by QuEChERS pretreatment method and UHPLC coupled with LTQ Orbitrap mass spectrometry. J. Chromatogr. B 2013, 938, 8–13. [Google Scholar] [CrossRef]
  27. Zhao, H.; Xiang, L.; Li, J.; Yang, Z.; Fang, J.; Zhao, C.; Xu, S.; Cai, Z. Investigation on fragmentation pathways of bisphenols by using electrospray ionization Orbitrap mass spectrometry. Rapid Commun. Mass Spectrom. 2016, 30, 1901–1913. [Google Scholar] [CrossRef]
  28. Paíga, P.; Morais, S.; Oliva-Teles, T.; Correia, M.; Delerue-Matos, C.; Duarte, S.C.; Pena, A.; Lino, C.M. Extraction of ochratoxin A in bread samples by the QuEChERS methodology. Food Chem. 2012, 135, 2522–2528. [Google Scholar] [CrossRef] [Green Version]
  29. Anastassiades, M.; Lehotay, S.J.; Stajnbaher, D.; Schenck, F.J. Fast and easy multiresidue method employing acetonitrile extraction/partitioning and dispersive solid-phase extraction for the determination of pesticide residues in produce. J. AOAC Int. 2003, 86, 412–431. [Google Scholar] [CrossRef] [Green Version]
  30. Lehotay, S.J. Determination of pesticide residues in foods by acetonitrile extraction and partitioning with magnesium sulfate: Collaborative study. J. AOAC Int. 2007, 90, 485–520. [Google Scholar] [CrossRef] [Green Version]
  31. CEN. Foods of Plant Origin—Determination of Pesticide Residues Using GC-MS and/or LC-MS/MS Following Acetonitrile Extraction/Partitioning and Clean-Up by Dispersive SPE. QuEChERS-Method, EN 15662; British Standards: London, UK, 2008. [Google Scholar]
  32. European Commission. Guidance Document on Analytical Quality Control and Method Validation Procedures for Pesticides Residues Analysis in Food and Feed. SANTE/11813/2017. European Commission Directorate-General for Health and Food Safety; European Commission: Brussels, Belgium, 2017; pp. 1–46. [Google Scholar]
  33. European Commission. Analytical Quality Control and Method Validation for Pesticide Residues Analysis in Food and Feed (SANTE/12682/2019); European Commission: Brussels, Belgium, 2019; pp. 1–48. [Google Scholar]
  34. Guenther, K.; Heinke, V.; Thiele, B.; Kleist, E.; Prast, H.; Raecker, T. Endocrine Disrupting Nonylphenols are ubiquitous in food. Environ. Sci. Technol. 2002, 36, 1676–1680. [Google Scholar] [CrossRef]
  35. Raecker, T.; Thiele, B.; Boehme, R.M.; Guenther, K. Endocrine disrupting nonyl- and octylphenol in infant food in Germany: Considerable daily intake of nonylphenol for babies. Chemosphere 2011, 82, 1533–1540. [Google Scholar] [CrossRef]
  36. Casajuana, N.; Lacorte, S. New Methodology for the Determination of Phthalate Esters, Bisphenol A, Bisphenol A Diglycidyl Ether, and Nonylphenol in Commercial Whole Milk Samples. J. Agric. Food Chem. 2004, 52, 3702–3707. [Google Scholar] [CrossRef] [PubMed]
  37. Mezcua, M.; Martınez-Uroz, M.A.; Gomez-Ramos, M.M.; Gomez, M.J.; Navas, J.M.; Fernandez-Alba, A.R. Analysis of synthetic endocrine-disrupting chemicals in food: A review. Talanta 2012, 100, 90–106. [Google Scholar] [CrossRef] [PubMed]
  38. Niu, Y.; Zhang, J.; Duan, H.; Wub, Y.; Shao, B. Bisphenol A and nonylphenol in foodstuffs: Chinese dietary exposure from the 2007 total diet study and infant health risk from formulas. Food Chem. 2015, 167, 320–325. [Google Scholar] [CrossRef] [PubMed]
  39. Mercogliano, R.; Santonicola, S. Investigation on bisphenol A levels in human milk and dairy supply chain: A review. Food Chem. Toxicol. 2018, 114, 98–107. [Google Scholar] [CrossRef]
  40. EFSA. Opinion of the Scientific Panel on Food Additives, Flavourings, Processing Aids and Materials in Contact with Food on a request from the Commission related to 2,2-bis(4-hydroxyphenyl)propane (bisphenol A). EFSA J. 2006, 428, 1–75. [Google Scholar]
  41. Santonicola, S.; Carmela Ferrante, M.; Genni di Leo, N.; Murru, A.; Anastasio, R. Mercogliano Study on endocrine disruptors levels in raw milk from cow’s farms: Risk assessment. Ital. J. Food Saf. 2018, 7, 7668. [Google Scholar]
  42. Santonicola, S.; Carmela Ferrante, M.; Murru, N.; Galloand, R.P. Mercogliano Hot topic: Bisphenol A in cow milk and dietary exposure at the farm level. J. Dairy Sci. 2019, 102, 1007–1013. [Google Scholar] [CrossRef] [Green Version]
  43. National Dietary Guidelines for Adults. Institute of Preventive Medicine Environmental & Occupational Health; Prolepsis: Athens, Greek, 2014; ISBN 9789605035594. (In Greek) [Google Scholar]
  44. EFSA Panel on Food Contact Materials Enzymes Flavourings and Processing Aids (CEF), Scientific Opinion on Bisphenol A: Evaluation of a study investigating its neurodevelopmental toxicity, review of recent scientific literature on its toxicity and advice on the Danish risk assessment of Bisphenol, A. EFSA J. 2010, 8, 1829.
  45. Regulation (EU) 2018/213 of 12 February 2018 on the Use of Bisphenol A in Varnishes and Coatings Intended to Come into Contact with Food and Amending Regulation (EU) No 10/2011 as Regards the Use of that Substance in Plastic Food Contact Materials; EU Comission: Brussels, Belgium, 2018.
Figure 1. The effect of the extraction salts from a milk sample fortified at 100 ng g−1 on the analytes’ recovery.
Applsci 11 09358 g001
Figure 2. Influence of the different salts’ combination of the dSPE cleanup step on the analytes recovery from a milk sample spiked at 100 ng g−1: (a) MgSO4/PSA; (b) MgSO4/PSA/C18; (c) MgSO4/PSA/GCB and (d) MgSO4/PSA/C18/GCB.
Applsci 11 09358 g002
Figure 3. Response surface plots for the 23 central composite design (CCD).
Applsci 11 09358 g003
Figure 4. LC-LTQ/Orbitrap MS Extracted Ion Chromatogram (EIC) of a strained yogurt sample where BPA and OP were detected at the concentration of 9.1 and 215.4 ng g−1, respectively: (a) BPA; (b) OP; (c) nonylphenol isomers (NP, 4NP) were not detected.
Applsci 11 09358 g004
Figure 5. Illustration of the percent (%) occurrence of the detected EDCs in relation to the percent (%) fat content of the analyzed food commodities.
Applsci 11 09358 g005
Table 1. QuEChERS-based analytical method performance in milk samples fortified with the target EDCs at two concentration levels.
EDCsLinearity Range (ng g−1)R2 Rec ± RSD (%)
5 ng g−1
Rec ± RSD (%)
50 ng g−1
LOQ
ng g−1
LOD
ng g−1
BPA0.1–2000.9987101 ± 4.297 ± 0.90.10.05
OP0.1–10/10–2000.9998101 ± 11.791 ± 6.30.10.05
NP5–2000.996699 ± 6.796 ± 251.5
4NP20–2000.9999108 ± 6.4100 ± 3205
Table 2. Detected target EDCs residues in 27 samples of dairy products.
EDCsAverage Concentration a
(μg Κg−1) (±SD)
Concentration Range
(μg Kg−1)
Positive Detections b
(n) c
n.d.%
BPA9.4 (±4.2)9.1–10.47 (0)74.1
OP174.1 (±128.0)0.5–301.426 (1)3.7
NP137.7 (±93.0)36.7–398.88 (0)70.4
4NP296.7 (±130.3)66.1–428.75 (3)70.4
a Only concentrations above the limit of quantification were considered; b number of samples where the analytes were detected above the limit of quantification; c number of samples with analytes below limit of quantification.
Publisher’s Note: MDPI stays neutral with regard to jurisdictional claims in published maps and institutional affiliations.

