Article

Surface Plasmon Resonance Sensor of CO2 for Indoors and Outdoors

1
Optics Department, University of Granada, 18071 Granada, Spain
2
Indra Systems S.A., 28108 Alcobendas, Madrid, Spain
3
Civil Engineering Department, University of Granada, 18071 Granada, Spain
*
Author to whom correspondence should be addressed.
Appl. Sci. 2021, 11(15), 6869; https://doi.org/10.3390/app11156869
Submission received: 22 June 2021 / Revised: 19 July 2021 / Accepted: 23 July 2021 / Published: 26 July 2021
(This article belongs to the Special Issue Optical Sensors and Gauges Based on Plasmonic Resonance)

Abstract

:
The ability to detect CO2 with the smallest possible devices, equipped with alarms and having great precision, is vital for human life, whether indoors or outdoors. It is essential to know if we are being subjected to this gas to establish the level of ventilation in factories, houses, classrooms, etc., and to be protected against viruses or dangerous gas concentrations. Equally, when we are in the countryside, it is useful to be able to evaluate if the greenhouse effect, caused by this gas, is increasing. We propose a surface plasmon resonance (SPR) sensor for the measurement of CO2 concentrations taking into account that the refractive index of carbon dioxide depends on temperature, humidity, pressure, etc. With our sensor we can measure (in air) in any type of environment and concentration. Our sensor has a resolution of 5.15 × 10⁻⁵ RIU and a sensitivity of 19.4 RIU−1 for 400 ppm.

1. Introduction

One of the principal problems of CO2, besides being one of the main causes of the greenhouse effect, is its presence indoors. The variation in the carbon anhidric quantity has fluctuated in a cyclical way since 420,000 years ago and, in the last 100,000 years, at a rate of between 180 ppm and 290 ppm. In the 1950’s, the rate of increase was 0.7 ppm per year and in the last 10 years it has increased to 2.1 ppm. Since the end of the industrial revolution, we have reached a global average of 400 ppm, i.e., an increment of 36% in the last century and a half based on data from the Global Monitoring Division of NOAA’s Earth System Research Laboratory in Boulder, Colorado [1].
Carbon dioxide affects animals in a harmful way (humans, pets, farm and wild animals, etc.) it affects our homes, workplaces, schools or any other indoor place. CO2 levels between 2000–5000 ppm produce a diminishing level of concentration, headaches, an increase in cardiac rhythm, somnolence, etc.; however, if levels are increased to 100,000 ppm, humans will lose consciousness and at higher levels of 250,000 ppm, death occurs [2]. The Occupational Safety and Health Administration (OSHA) limits the continuous exposure of CO2 to 5000 ppm for eight continuous hours, 30,000 ppm in short periods, and 40,000 ppm instantly to cause as little damage as possible [3]. As a quick and first conclusion of the above information it is evident that it is essential to have a sensor which is able to measure both indoors and outdoors without having to modify it in any way.
There are sensors with alarms for gases (CO y CO2) produced for indoor fires for different concentrations [4], although, there are others which detect only CO2.
Not all sensors are able to measure all ranges of concentrations, for instance, there is an autoclavable CO2 sensor which measures concentrations between 0–20%, the average time of the response is 0.7 s, and it needs a recuperation time of approximately 2.0 min [5].
In 2014, Gorma et al. [6] designed and optimized an integrated hybrid surface plasmon biosensor and simulated the results for a medium with refractive indexes between 1.33–1.34. It had a very high sensitivity of around 3000 nm/RIU and a resolution of 3.34 × 10⁻⁶ RIU.
There is also an optical spectroscopic sensor based on reflectivity for CO2 [7] which measures concentrations of between 0.8–44.6%.
In 2016, two sensors were designed for the detection of CO2. The first one measures concentrations in the range 0–500 ppm with a sensitivity of 6 × 10⁻⁹ RIU/ppm and an uncertainty of 20 ppm. It uses the refractometry principle and has the lowest uncertainty of the market [8]. The second one uses a micro-cantiliver structure made of ZnO to detect the CO2. This sensor is based on the former. The foundation is a crystalline structure of ZnO nanorods. The response to the gas is produced when the resonance frequency of the microcantiliver vibration is increased. It takes approximately 3 min for the gas desorption. This sensor only measures the presence/no presence of CO2 [9].
As for planar waveguide optical sensors, there is one made of planar waveguides with a cladding made of extract of Alstonia Scholaris leaves. It takes 4–5 s for the measurement and needs a period of about 5 s to measure again. The range of measurement is 0–62,500 ppm and it has a lifetime of 25–30 days. It is not able to measure with humidity above 70% [10].
Another sensor is made of an ellipsoidal planar waveguide with which it is possible study the dependence of the concentration and temperature. It has been demonstrated that an increase of 80 °C produces a standard deviation of 5%. This sensor has a range of 0–3000 ppm [11].
An optical fiber sensor has been developed for detecting concentrations of CO2 in oceans. It requires a stabilization time of 5 min and has a sensitivity of 0.2371 RIU−1 [12].
Another optical fiber sensor is based on fluorescence. It works in the mid-infrared range and considers a minimum of CO2 in 400 ppm (atmospheric average). The range is 500–3000 ppm and the resolution is 5% [13].
The next sensor is based on the absorption of transmitted light for an optical fiber. The response time varies between 20 s and 100 s, depending on the thickness of the layer [14].
Based on the principle of the Fabry-Perot interferometer (with optical fiber), a CO2 sensor was constructed to measure concentrations of 0–700 ppm [15].
There is another optical fiber sensor which measures a range of 0–75% of CO2 and has a dynamic response of 6.1 min and 8 min when the up time is 2.12 min and the down time is 2.95 min [16].
In 2009, the first sensor plasmon resonance (SPR) was introduced and it operated in the mid-infrared range to detect CO2. It is based on the model of Kretschmann, with a glass prism of CaF2 and a layer of Ti and another of Au. The sensitivity is so far the highest of all the CO2 sensors, 10−5 RIU−1 [17].
Another SPR with a mixture of polymer is able to trap CO2 in a reversible way. It works with a wavelength of 640 nm and measures CO2 dissolved in synthetic air. The limit of concentration is 10 ppm [18].
In 2015, Nuryadi et al. manufactured a gas sensor with the Kretschmann configuration, modifying the hemiprism, and after the layer of Au, they used a ZnO layer in a cylindrical way where the CO2 circulates. This is a sensor of presence; it is not able to measure quantities [19].
It is interesting to mention some plasmonic optical fiber sensors as well, since they are currently attracting a large amount of research interest for the detection of gases [20,21].
Table 1 summarizes the key characteristics of the studied sensors so that they can be compared easily and quickly. The number in brackets corresponds to the reference number of the paper.
In view of all the limitations of the sensors described above, we propose a CO2 sensor able to detect very high, high, normal, low and very low concentrations which could work both indoors and outdoors without any modification of the structure, wavelength, etc.

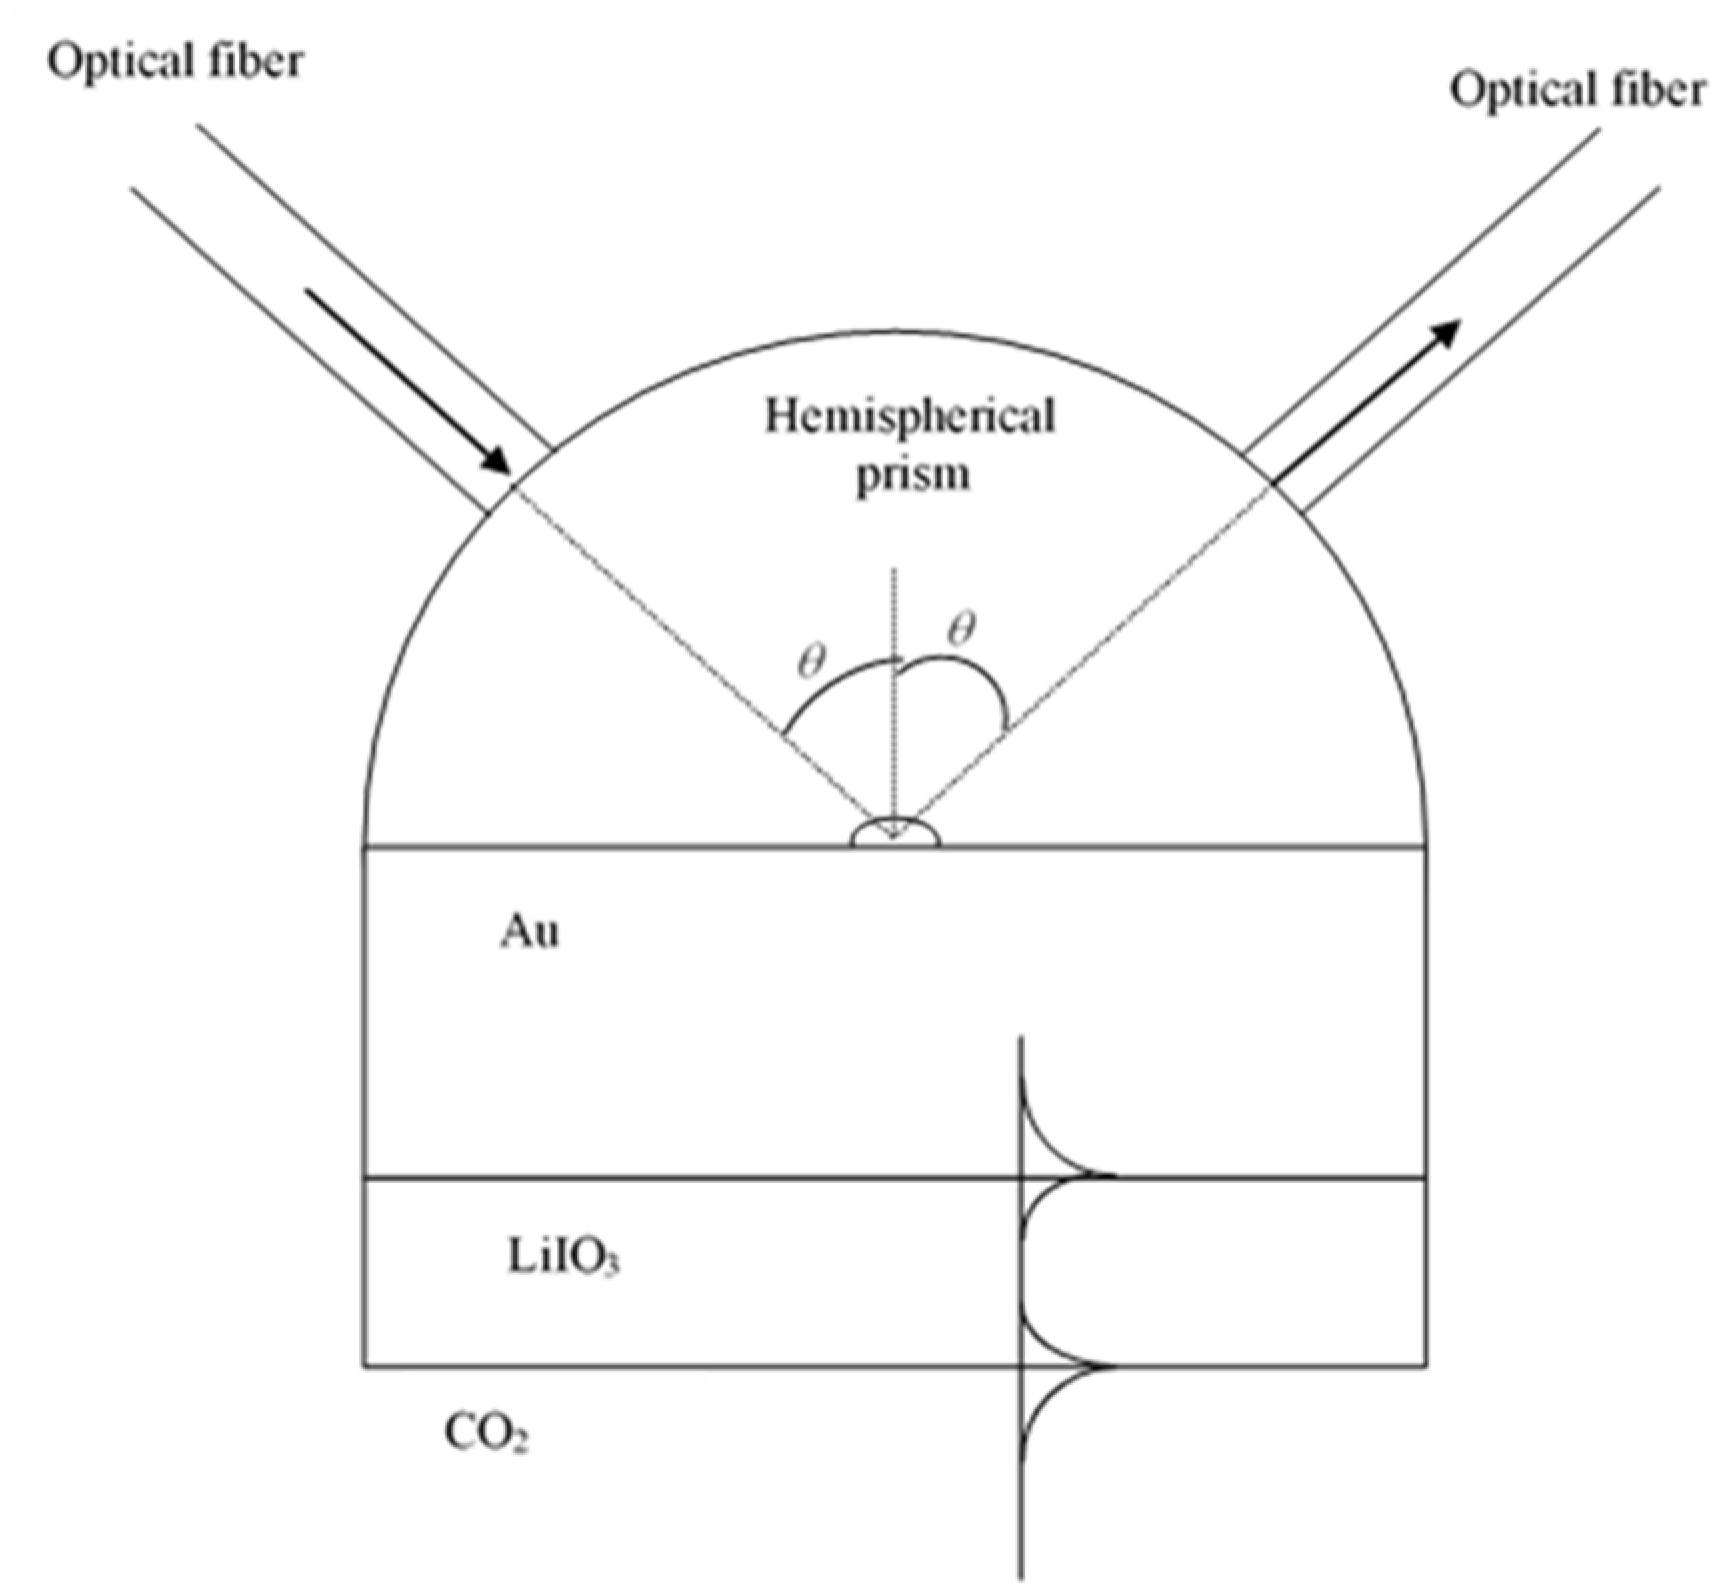
2. Design of the Plasmonic Sensor

The operational principle is based on SPR [22,23].
Figure 1 shows a diagram of the sensor for the measurement of the concentration of CO2. The experimental set up is schematically illustrated in Figure 1.
It can be considered that the standard air is a mixture of 78% of N2, 21% of O2 and 1% of Ar, CO2 (0.04%) and H2O.
As we can measure the concentration of CO2 both indoors and outdoors, we have to know the variation of the refractive index of the carbon dioxide with atmospheric pressure, temperature, height above the sea level, concentration, etc.
A slight variation in humidity of 2 mb may cause a variation of 14% in relative humidity. This affects the eighth-decimal place of the refractive index of CO2 in concentrations of 200–400 ppm.
The difference between the refractive indexes of the CO2 when the atmospheric pressure varies from 0.5 atm to 1 atm is 1.00025 to 1.0005, respectively, if we consider an atmospheric pressure in the middle, 0.74 atm, the refractive index is 1.000375 [24].
From the Edlén equations, we can calculate the dispersion of the refractive index of the carbonic anhydride for dry air, 1 atm, 15 °C and 300 ppm in volume. This variation is around 10–8 from 200 nm up to the infrared.
Another parameter which provokes variations in the refractive index is the temperature. For 1 atm and 20 °C, (n − 1) = 0.000271786 (a variation to the fourth decimal place which we have to take into account). The variation in the refractive index with the water vapour can be calculated with the correction of Birch and Downs [25].
The effects of other gases, such as Ar, N2 and O2, have no effect on the change in the refractive index of carbon dioxide.
Due to all of the above, our sensor would be able to measure the refractive index for different concentrations of CO2. As the variation of the refractive index with pressure is very great, these sensors have to be designed taking into account the height above sea level where they are going to be used.
The hemispheric prism is made of glass SUMITA (CaFK) (n = 1.4333) [26]. The dielectric layer is lithium iodate (LiIO3) with a thickness of 37.26 nm, and the refractive index is 1.8807 [27]. The Au layer has a thickness of 51.48 nm and a refractive index of (n = 0.12517 + 3.3326i) [28].
The hemispherical prism has a radius of 1 cm.
The laser used is a continuous emission (to minimize consumption), with polarization p and a wavelength of 632.8 nm. It strikes the spherical part of the hemiprism with a normal incidence. The light is conducted from the laser to the prism by means of an optical fiber and its endface is glued to the surface of the hemiprism. The incidence angle, compared to the normal, in the LiIO3 is θ (greater than the critical angle) (see Figure 1). The reflected light in the interface prism-LiIO3 reaches the other optical fiber and it transports the light to the photodetector.
When the laser strikes the interface prism-Au with an angle greater than the critical angle, an evanescent wave is produced on the surface. If both the thickness of the layers and the geometry of the sensor are adequate, it is possible to excite two superficial plasmons propagating through the surfaces.
The sensor we have designed is based on intensity interrogation. This allows us to differentiate the refractive index of the medium with which our sensor is in contact. The principal advantage this sensor offers, compared to the others which work with angle interrogation, is that ours has no mobile parts, no friction hysteresis and backlash are eliminated, the response time is minimized and we save energy. For the theoretical model of surface plasmon resonance reflectance, the transfer matrix method was used to solve the Fresnel equations for the multilayer [29,30] with the WinSpall software package.
This sensor has been designed to differentiate the quantity of CO2 in ppm in air. For a given angle of incidence θ, we obtain different reflectances for different concentrations of carbon dioxide. These values are sufficiently different from one another to effectively differentiate the reflectance with the photodetector in the endface of the optical fiber.
We know that the concentration of carbon dioxide is not distributed homogeneously all over the planet. Our sensor is able to measure the concentration of CO2 each instant, it can measure the concentration at the moment of the installation to know the level of CO2 and decide from what amount of carbon dioxide the alarm signal will be given, either indoors or outdoors. We do not need a sensor of reference.

3. Results and Discussion

Figure 2 shows the graphic for different concentrations of CO2 for an incidence angle close to 84° and, as for example, for 1000 m above sea level.
Depending on the reflectance in the photodetector, we can detect the concentration of CO2 in real time. It is essential to know the relative humidity and pressure of the air to know the refractive index of the mixture of the air (therefore the CO2 concentration) so that the plasmonic sensor can accurately measure the refractive index and then know the CO2 concentration.
The sensitivity of our sensor can be calculated from the change in reflectance per unit of change in refractive index (see Table 2 with more detail and data).
The sensor resolution depends upon the accuracy with which the monitored SPR parameter can be determined by the specific sensing device and, as such, is limited by sensor-system noise [31]. To calculate the resolution of the sensor, we divide the accuracy of the photodetector by its sensitivity. Considering an accuracy of 0.1% in the signal registered by the photodetector [32,33], we achieve resolutions of 5.15 × 10⁻⁵ RIU, 4.02 × 10⁻⁵ RIU, 4.54 × 10⁻⁵ RIU and 6.05 × 10⁻⁵ RIU for concentrations of 400 ppm, 450 ppm, 500 ppm, 550 ppm and 600 ppm respectively. This resolution is more than adequate to accurately measure the CO2 concentration. With a variation of the fifth decimal place, we can assure that the measurements of the refractive indexes are reliable, taking into account that the variations of the refractive indexes due to pressure, temperature, humidity and concentration are to the third decimal place. The sensor of Herminjard et al. [17] has a resolution similar to ours, but uses infrared while our laser is in the range of the visible; it is also cheaper and more commercially viable.
The effect of the thickness of the Au and LiIO3 layers and the wavelength of the laser influences the reflectance, sensitivity and the distance between the curves of each of the concentrations.
The photodetector, which is at the end of the output optical fiber, has a reference signal. This reference is the laser that has passed through all the optical media in the total absence of CO2. We will therefore have the response of the photodetector at a concentration of 0 ppm.
The refractive index of CO2 increases concomitantly with increasing concentration. As the concentration of CO2 in the medium increases, the reflected radiation that is injected into the output optical fiber and reaches the photodetector will decrease. When the refractive index increases, the reflectivity decreases and we will get closer to the formation of the SPR [22,23]. By comparing this photodetector output signal with the 0 ppm, we are able to calculate the reflectivity. Once the reflectivity is known, as we see in the curves in Figure 2, we are able to know the CO2 concentration at each moment.
The sensor of Mi et al. [8] has a better resolution than ours, however, the range is only 0–500 ppm and our sensor has more range than the others [5,8,11,15,16].
The sensor measures continuously and there is no waiting time between measurements as in the others [5,9,10,12,14,16,34].
The sensitivity of our sensor is greater than sensors which have satellites NOAA and Aqua Terra [4,12,34,35] and the plasmonic sensors [8].
Our sensor is smaller than the UV Strip Resistive Thick GEM (S-RETGEM) [8] and measures concentrations of carbon dioxide instead of measuring presence of this gas [9,19] and is able to measure with any value of the humidity unlike the sensor of Vijayan et al. [10].
The sensor of Gorma et al. [6] had a very high sensitivity, of around 3000 nm/RIU and a resolution of 3.34 × 10⁻⁶ RIU, better results than ours, however, this design works in wavelength interrogation, so we were unable to compare.
If we are measuring concentrations of CO2 in a controlled ambient, it is not necessary to take into account the variations of humidity, temperature or pressure because these are minimum, therefore the results obtained from the sensor can be used without having to take into account the Edlén or modified Birch and Downs equations. Therefore, our sensor could measure concentrations of CO2 indoors (houses, factories, motors, etc.) without applying the Edlén and Birch and Downs equations.
If we are measuring outdoor CO2 concentrations, as the variations of the variables are not controlled, the changes in the refractive indices will vary with humidity, pressure, temperature, etc. After using the sensor, very simple software modifies the measured refractive indices based on these parameters and will give us the real concentration of the gas based on the Birch and Downs equations.

4. Conclusions

We have designed an SPR sensor for the detection of concentrations of CO2 which works both indoors and outdoors. The sensor has a sensitivity of almost 25 RIU−1 and a resolution of 5.15 × 10⁻⁵ RIU. It could have better sensitivity if the ambient conditions are known because the refractive index of this gas depends on pressure, temperature, humidity and concentration. This is an improvement compared to other SPR sensors designed to work indoors and outdoors.
Measurements are made continuously and no time is needed to achieve the measurement, and there is no time lapse between measurements.
Today, it is vital to ventilate closed spaces to avoid the spread of COVID-19. We cannot be sure if the ventilation time is correct or if a building is well ventilated because we do not have sensors that measure the presence of the virus in the air, but we can indirectly know the correct ventilation of the rooms from the measurement of CO2 expelled by humans, so we can know the distribution of this residual CO2. By placing our sensors in the right places, we can know if the ventilation is adequate and, therefore, we will know if the ventilation time is adequate. As our sensor is so tiny, many can be placed and at any point in a room to see the data of concentration of CO2 in real time.
The overall system can be connected to a 5G module to send data to a remote point and there is an alarm if the data is superior and potentially damaging for health, the environment, etc.
Finally, it is not necessary to carry out periodic calibrations.

Author Contributions

Conceptualization, A.M.P. and F.P.-O.; methodology, J.C.; software, J.C. and O.R.; validation, A.M.P. and F.P.-O.; formal analysis, J.C.; investigation, A.M.P., F.P.-O., J.C. and O.R.; resources, A.M.P., F.P.-O., J.C. and O.R.; data curation, J.C. and O.R.; writing—original draft preparation, F.P.-O.; writing—review and editing, A.M.P., J.C. and O.R.; visualization, A.M.P., F.P.-O., J.C. and O.R.; supervision, A.M.P. and F.P.-O. All authors have read and agreed to the published version of the manuscript.

Funding

This research received no external funding.

Institutional Review Board Statement

Not applicable.

Informed Consent Statement

Not applicable.

Data Availability Statement

Not applicable.

Acknowledgments

The authors wish to thank Angela L. Tate, a native English speaker and expert in translations of scientific papers, for her assistance with the English version.

Conflicts of Interest

The authors declare no conflict of interest.

References

  1. Butler, J.H. CO2 at NOAA’s Mauna Loa Observatory Reaches New Milestone: Tops 400 ppm, Global Monitoring Division—ESRL-GMD. Available online: http://www.esrl.noaa.gov/gmd/ccgg/trends/weekly.html (accessed on 24 June 2021).
  2. Satish, U.; Mendell, M.J.; Shekhar, K.; Hotchi, T.; Sullivan, D.; Streufert, S.; Fisk, W.J. Is CO2 an Indoor Pollutant? Direct Effects of Low-to-Moderate CO2 Concentrations on Human Decision-Making Performance. Environ. Health Perspect. 2012, 120, 1671–1677. [Google Scholar] [CrossRef] [Green Version]
  3. Chemical Sampling Information|Carbon Dioxide|Occupational Safety and Health Administration. 2018. Available online: https://www.osha.gov/dts/chemicalsampling/data/ (accessed on 20 June 2021).
  4. Chen, S.J.; Hovde, D.C.; Peterson, K.A.; Marshall, A.W. Fire Detection using Smoke and Gas Sensors. Fire Safety. J. 2007, 42, 507–515. [Google Scholar] [CrossRef]
  5. Ge, X.D.; Kostov, Y.; Rao, G. High-stability Non-invasive Autoclavable Naked Optical CO2 Sensor. Biosens. Bioelectron. 2003, 18, 857–865. [Google Scholar] [CrossRef]
  6. Gorman, T.; Haxha, S. Design and Optimization of Integrated Hybrid Surface Plasmon Biosensor. Opt. Commun. 2014, 325, 175–178. [Google Scholar] [CrossRef]
  7. Salim, M.R.; Yaacob, M.; Ibrahim, M.H.; Azmi, A.I.; Ngajikin, N.H.; Dooly, G.; Lewis, E. An Optical Spectroscopic Based Reflective Sensor for CO2 Measurement with Signal to Noise Ratio Improvement. J. Optoelectron. Adv. Mater. 2015, 17, 519–525. [Google Scholar]
  8. Mi, J.G.C.; Horvath, C.; Aktary, M.; Van, V. Silicon Microring Refractometric Sensor for Atmospheric CO2 gas Monitoring. Opt. Express 2016, 25, 1773–1780. [Google Scholar] [CrossRef]
  9. Nuryadi, R.; Aprilia, L.; Gustiono, D. CO Gas Response of ZnO Nanostructures using Microcantilever in Dynamic Mode Operation. In Proceedings of the 7th IEEE International Nanoelectronics Conference, Chengdu, China, 9–11 May 2016; Available online: https://ieeexplore.ieee.org/stamp/stamp.jsp?tp=&arnumber=7589337 (accessed on 20 June 2021).
  10. Vijayan, A.; Fuke, M.V.; Karekar, R.N.; Aiyer, R.C. Planar Optical Waveguide Evanescent Wave CO2 Sensor based on a Clad of Alstonia Scholaris Leaf Extract. IEEE Sens. J. 2009, 9, 13–19. [Google Scholar] [CrossRef]
  11. Yi, S. Temperature Compensation Methods of Nondispersive Infrared CO2 gas Sensor with Dual Ellipsoidal Optical Waveguide. Sensors Mater. 2017, 29, 243–252. [Google Scholar] [CrossRef] [Green Version]
  12. Bao, B.; Melo, L.; Davies, B.; Fadaei, H.; Sinton, D.; Wild, P. Detecting Supercritical CO2 in Brine at Sequestration Pressure with an Optical Fiber Sensor. Environ. Sci. Technol. 2013, 47, 306–313. [Google Scholar] [CrossRef]
  13. Starecki, F.; Charpentier, F.; Doualan, J.L.; Quetel, L.; Michel, K.; Chahal, R.; Troles, J.; Bureau, B.; Braud, A.; Camy, P.; et al. Mid-IR Optical Sensor for CO2 Detection based on Fluorescence Absorbance of Dy3+: Ga5Ge20Sb10S65 fibers. Sens. Actuators B Chem. 2015, 207, 518–525. [Google Scholar] [CrossRef]
  14. Wysokinski, K.; Napierała, M.; Stanczyk, T.; Lipinski, S.; Nasiłowski, T. Study on The Sensing Coating of The Optical Fibre CO2 Sensor. Sensors 2015, 15, 31888–31903. [Google Scholar] [CrossRef] [Green Version]
  15. Ma, W.W.; Xing, J.X.; Wang, R.H.; Rong, Q.Z.; Zhang, W.L.; Li, Y.C.; Zhang, J.Y.; Qiao, X.G. Optical Fiber Fabry–Perot Interferometric CO2 gas Sensor using Guanidine Derivative Polymer Functionalized Layer. IEEE Sens. J. 2018, 18, 1924–1929. [Google Scholar] [CrossRef]
  16. Wu, J.S.; Yin, M.J.; Seefeldt, K.; Dani, A.; Guterman, R.; Yuan, J.Y.; Zhang, A.P.; Tam, H.Y. In Situ Mu-printed Optical Fiber-tip CO2 Sensor using a Photocross Linkable Poly (ionic liquid). Sens. Actuators B Chem. 2018, 259, 833–839. [Google Scholar] [CrossRef]
  17. Herminjard, S.; Sirigu, L.; Herzig, H.P.; Studemann, E.; Crottini, A.; Pellaux, J.P.; Gresch, T.; Fischer, M.; Faist, J. Surface Plasmon Resonance Sensor showing Enhanced Sensitivity for CO2 Detection in the Mid-infrared Range. Opt. Express 2009, 5, 293–303. [Google Scholar] [CrossRef]
  18. Lang, T.; Hirsch, T.; Fenzl, C.; Brandl, F.; Wolfbeis, O.S. Surface Plasmon Resonance Sensor for Dissolved and Gaseous Carbon Dioxide. Anal. Chem. 2012, 84, 9085–9088. [Google Scholar] [CrossRef]
  19. Nuryadi, R.; Mayasari, R.D.; Aprilia, L.; Yuliarto, B. Fabrication of ZnO/Au/prism-based Surface Plasmon Resonance Device for Gas Detection. Presented at International Conference on Quality in Research (QiR), Lombok, Indonesia, 10–13 August 2015. [Google Scholar] [CrossRef]
  20. González-Vila, A.; Ioannou, A.; Loyez, M.; Debliquy, M.; Lahem, D.; Caucheteur, C. Surface Plasmon Resonance Sensing in Gaseous Media with Optical Fiber Gratings. Opt. Letters 2018, 43, 2308–2311. [Google Scholar] [CrossRef]
  21. Yao, Q.F.; Ren, G.H.; Xu, K.; Zhu, L.; Khan, H.; Mohiuddin, M.; Khan, M.W.; Zhang, B.Y.; Jannat, A.; Haque, F.; et al. 2D Plasmonic Tungsten Oxide Enabled Ultrasensitive Fiber Optics Gas Sensor. Adv. Opt. Mater. 2019, 7. [Google Scholar] [CrossRef]
  22. Pozo, A.M.; Pérez-Ocón, F.; Rabaza, O. A Continuous Liquid-level Sensor for Fuel Tanks based on Surface Plasmon Resonance. Sensors 2016, 16, 724. [Google Scholar] [CrossRef] [Green Version]
  23. Pérez-Ocón, F.; Pozo, A.M.; Serrano, J.M.; Rabaza, O. Continuous Measurement with Three-in-one Plasmon Sensor in Sucrose Solutions. IEEE Sens. J. 2020. (In Press) [Google Scholar] [CrossRef]
  24. Sang, B.H.; Jeon, T.I. Pressure-dependent Refractive Indices of Gases by THz Time-domain Spectroscopy. Opt. Express 2016, 24, 29040–29047. [Google Scholar] [CrossRef]
  25. Birch, K.P.; Downs, M.J. The results of a Comparison between Calculated and Measured Values of The Refractive Index of Air. J. Phys. E Sci. Instrum. 1988, 21, 694–695. [Google Scholar] [CrossRef]
  26. Optical Glass|Sumita Optical Glass. Available online: http://www.sumita-opt.co.jp/en/products/optical (accessed on 20 June 2021).
  27. Choy, M.M.; Byer, R.L. Accurate Second-order Susceptibility Measurements of Visible and Infrared Nonlinear Crystals. Phys. Rev. B 1976, 14, 693–706. [Google Scholar] [CrossRef]
  28. Babar, S.; Weaver, J.H. Optical Constants of Cu, Ag, and Au Revisited. Appl. Opt. 2015, 54, 477–481. [Google Scholar] [CrossRef]
  29. Heavens, OS Thin Films Optics. Optical Properties of Thin Solid Films; Dover Books on Physics: New York, NY, USA, 2011; pp. 45–96. [Google Scholar]
  30. Ohta, K.; Ishida, H. Matrix Formalism for Calculation of Electric Field Intensity of Light in Stratified Multilayered Films. Appl. Opt. 1990, 29, 1952–1959. [Google Scholar] [CrossRef]
  31. Homola, J.; Yee, S.S.; Gauglitz, G. Surface Plasmon Resonance Sensors: Review. Sens. Actuators B Chem. 1999, 54, 3–15. [Google Scholar] [CrossRef]
  32. Ronot-Trioli, C.; Trouillet, A.; Veillas, C.; Gagnaire, H. Monochromatic Excitation of Surface Plasmon Resonance in an Optical Fibre Refractive-index Sensor. Sens. Actuators A Phys. 1996, 54, 589–593. [Google Scholar] [CrossRef]
  33. Derbel, F. Performance Improvement of Fire Detectors by Means of Gas Sensors and Neural Networks. Fire Safety, J. 2004, 39, 383–398. [Google Scholar] [CrossRef]
  34. Fraser, R.H.; Li, Z.; Cihlar, J. Hotspot and NDVI Differencing Synergy (HANDS): A new Technique for Burned Area Mapping Over Boreal Forest. Remote Sens. Environ. 2000, 74, 362–376. [Google Scholar] [CrossRef]
  35. Mu, M.; Randerson, J.T.; Van der Werf, G.R.; Giglio, L.; Kasibhatla, P.; Morton, D.; Collatz, G.J.; De Fries, R.S.; Hyer, E.J.; Prins, E.M.; et al. Daily and 3-hourly Variability in Global Fire Emissions and Consequences for Atmospheric Model Predictions of Carbon Monoxide. J. Geophys. Res. 2011, 116, 1–19. [Google Scholar] [CrossRef]
Figure 1. Diagram of the plasmonic sensor. On the left of the hemispherical prism, the optical fiber transports the incident radiation and, on the right, another optical fiber collects the reflected radiation. The SPR are also shown propagating through the LiIO3-Au and Au-medium interfaces.
Applsci 11 06869 g001
Figure 2. Reflectance curves as a function of the angle of incidence of the light in the prism and different concentration of CO2. The height above sea level is 1000 m. The sensor works with an incidence angle of 83.67°.
Applsci 11 06869 g002
Table 1. Summary table with the essential characteristics of the sensors studied.
IndoorOutdoorMultigasOnly CO2Wide Dynamic RangeShort Dynamic Range
[4][12,19][20,21][5,6,7,8,9,10,11,12,13][7,11,16][5,6,8,13,15,18]
Waveguide/Optical fiber sensorPlasmonic sensorOthersInstant response timeFast response timeSlow response time
[10,11,12,13,14,15,16,20,21][6,17,18,19][5,7,8,9][6,17,18,19][5,10][9,14,16]
High resolutionLow resolutionHigh sensitivityLow sensitivity
[17][13][8,17,20][12]
Table 2. The sensitivity and resolution values of the sensor as a function of altitude and gas concentration change.
Altitude (m)Sensitivity (RIU−1) and Resolution (RIU)400–450 ppm450–500 ppm500–550 ppm550–600 ppm
0Sensitivity17.1822.0719.5314.71
Resolution × 10−55.804.555.106.80
500Sensitivity13.3920.5420.7617.28
Resolution × 10−57.454.854.805.80
1000Sensitivity19.3724.8922.0316.59
Resolution × 10−55.154.024.546.05
1500Sensitivity7.5116.5420.6520.16
Resolution × 10−41.330.610.490.50
2000Sensitivity6.0114.7519.7020.45
Resolution × 10−41.670.680.510.49
2500Sensitivity6.6814.3718.9820.12
Resolution × 10−41.500.700.530.50
3000Sensitivity5.0912.5317.6819.82
Resolution × 10−41.970.800.570.51
3500Sensitivity3.8810.9116.2819.16
Resolution × 10−42.580.920.620.52
4000Sensitivity3.029.5614.9218.28
Resolution × 10−43.311.050.670.55
4500Sensitivity2.598.6213.7917.37
Resolution × 10−43.871.160.730.58
5000Sensitivity2.367.8912.7916.43
Resolution × 10−44.241.270.780.61
5500Sensitivity2.417.4712.0415.62
Resolution × 10−44.161.340.830.64
Publisher’s Note: MDPI stays neutral with regard to jurisdictional claims in published maps and institutional affiliations.

