Article

Terahertz and Microwave Optical Properties of Single-Crystal Quartz and Vitreous Silica and the Behavior of the Boson Peak

National Physical Laboratory, Teddington TW11 0LW, UK
*
Author to whom correspondence should be addressed.
Appl. Sci. 2021, 11(15), 6733; https://doi.org/10.3390/app11156733
Submission received: 10 June 2021 / Revised: 15 July 2021 / Accepted: 19 July 2021 / Published: 22 July 2021
(This article belongs to the Special Issue State-of-the-art Terahertz Science and Technology)

Abstract

:

Featured Application

Z-cut quartz is confirmed as a suitable reference material for measurements of complex permittivity at terahertz and microwave frequencies, and data between 0.2 and 6 THz are provided. Silica glass has also been evaluated.

Abstract

Z-cut single-crystal quartz and vitreous silica (silica glass or fused silica) were evaluated for use as reference materials for terahertz and microwave measurements of complex permittivity, with Z-cut quartz confirmed as being suitable. Measurements of refractive indices and absorption coefficients for o-ray and e-ray in quartz and for vitreous silica are reported at frequencies between 0.2 and 6 THz and at 36 and 144 GHz, and compared with data reported in the literature. A previously unreported broad band was seen in the extraordinary absorption of quartz. The Boson peak in silica glass absorption was examined, and for the first time, two negative relationships have been observed: between the refractive index and the Boson peak frequency, and between the Boson peak height and its frequency.

1. Introduction

The aim of this work was twofold. First, to evaluate the suitability of Z-cut single-crystal quartz and glassy silica as reference materials for terahertz (THz) and microwave (MW) measurements. The current lack of reference materials suitable for calibrating and testing measurements of complex permittivity at THz and MW frequencies is an acknowledged and pressing issue that requires being addressed [1,2]. Quartz and silica appear to be good candidate materials due to their wide availability and affordability, standard fabrication techniques, and high chemical purity. A reference material for spectroscopy should have highly reproducible properties that vary less than typical measurement uncertainty, and that are constant among all reputable manufacturers and production batches. To verify this, we examined five samples of Z-cut quartz and seven samples of vitreous silica. We report our findings in detail, confirming that Z-cut quartz is a good reference material. However, silica glass of nominally the same grade exhibits significant variations in both refractive index and absorption at THz frequencies, although the refractive indices at 36 GHz show negligible variation.
The second aim of this work, which is directly related to establishing reference materials, was to obtain accurate data on the complex permittivity of quartz and silica. Although there is extensive literature on both quartz [3,4,5,6,7,8,9,10,11,12,13,14] and vitreous silica [15,16,17,18,19,20,21,22,23,24,25,26], the reported data vary significantly. If quartz and/or silica are to serve as reference materials, their complex permittivities must be accurately known. We report values of the refractive index and absorption coefficient for the o-ray in quartz between 0.2 and 6 THz, for the e-ray in quartz between 0.2 and 5 THz, and for vitreous silica between 0.2 and 4.5 THz. We also report measurements at 36 GHz for the o-ray in quartz and for all silica glass samples. In addition, we have examined variations in the Boson peak in silica glass, and report for the first time a negative relationship between refractive index and Boson peak frequency.

2. Materials and Methods

2.1. Material Samples

To study single-crystal quartz, five samples of Z-cut quartz and one sample of Y-cut quartz were used. α-Quartz is a uniaxial crystal and, therefore, birefringent. In a Z-cut crystal the transmitted beam travels parallel to the crystal axis; therefore, measurements on Z-cut quartz yield optical parameters for the ordinary ray. In a Y-cut crystal, the beam travels normal to the crystal axis; therefore, if the beam is polarized, both ordinary and extraordinary optical parameters may be measured. All Z-cut quartz crystals were approximately 4 mm in thickness; the Y-cut crystal was 16.9 mm thick.
Seven samples of fused silica (Heraeus Spectrosil 2000) were obtained. All were approximately 2 mm thick.
All samples had their thickness measured with a micrometer that had 1 μm resolution.

2.2. Terahertz Time-Domain Spectroscopy Measurements

THz time-domain spectroscopy (TDS) measurements were carried out using a TeraFlash pro spectrometer from Toptica Photonics set up in a standard optical configuration with four F/2 parabolic mirrors [27,28]. The THz beam path was purged with dry air to eliminate absorption from atmospheric water vapor. Samples were placed in the collimated section of the beam, and laser alignment was used to ensure that they were positioned normal to the THz beam.
The frequency resolution was 5 GHz for quartz samples, and 10 GHz for silica glass samples. The THz beam was 98% polarized, making possible o-ray and e-ray measurements on the Y-cut quartz sample.
The frequency-dependent (ν) refractive index (n(ν)) and absorption coefficient (α(ν)) of each sample were calculated by the standard method of applying Fourier transform to the time-domain data to obtain the frequency-dependent field amplitude (E(ν)) and phase (ϕ(ν)), and using the equations [27]:
n ν = 1 + ϕ s ν ϕ r e f ν c 2 π ν d
α ν = 2 d   l n n + 1 2 4 n   E s ν E r e f ν
where c is the speed of light, d is the sample thickness, and the subscripts s and ref refer to the sample and reference data, respectively. THz TDS has an important advantage in measurements of THz optical properties of materials, in that it enables unambiguous, straightforward determination of refractive index and absorption coefficient [27,28].
The measurement uncertainty had two main components: uncertainty in sample thickness; and measurement repeatability. The thickness of each sample was measured using a precision micrometer (Mitutoyo 340–711) in 10 different locations on the sample area, and the standard deviation was taken as the thickness uncertainty. The contribution of thickness uncertainty was frequency-independent. Repeatability uncertainty was evaluated by multiple measurements of a sample, removing and re-positioning it in the beam four times, and calculating the standard deviation of refractive index and absorption coefficient. Repeatability uncertainty decreases with the signal-to-noise ratio (SNR), and is larger at low frequencies (<0.5 THz) and at high frequencies (>5 THz); however, in the region of high SNR, it is lower than thickness uncertainty. The dominant contribution was used as an estimate of the uncertainty in the obtained values of refractive index and absorption coefficient.

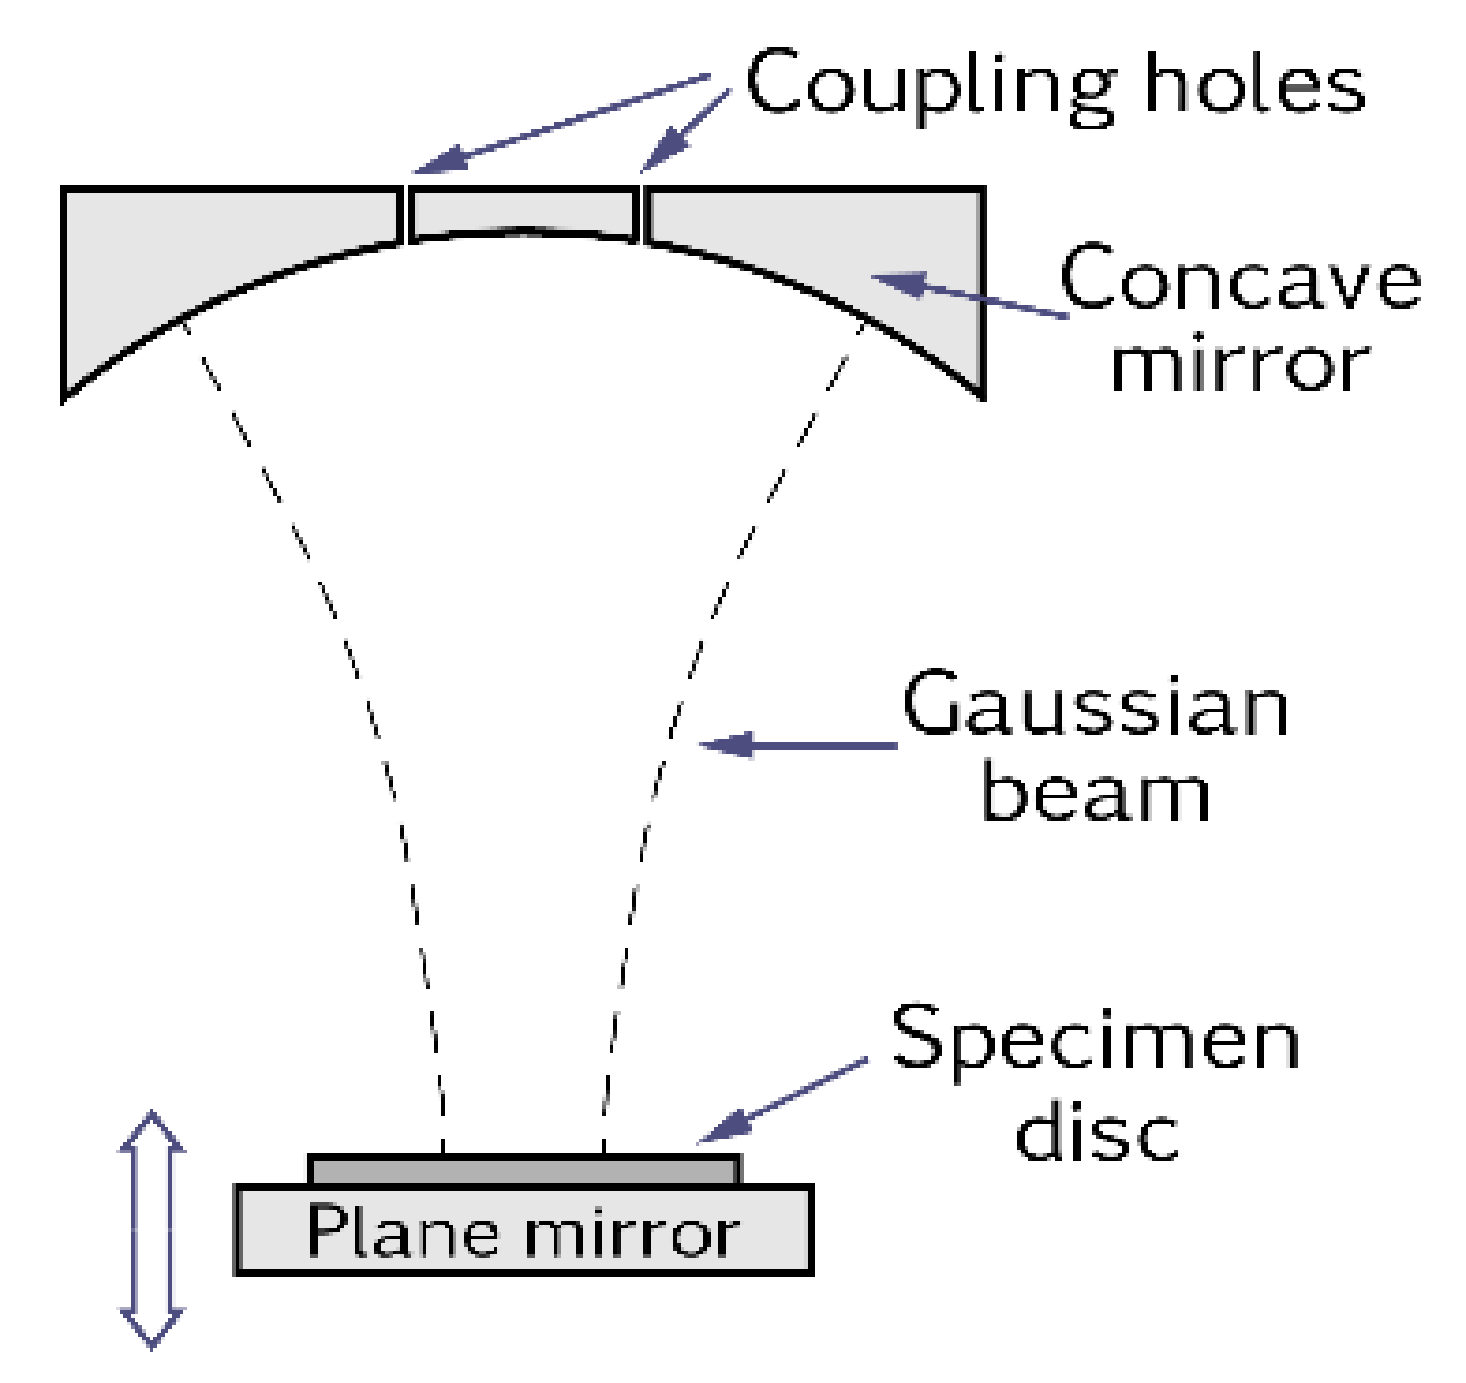
2.3. Open Resonator Measurements

MW measurements were performed using the open resonator technique, which utilizes the fact that the resonance frequency and the Q-factor of a resonator are affected in a known way by the presence of a dielectric material in the resonant cavity.
The open resonator employed was of the plano-concave type, shown in Figure 1, which uses fundamental-mode Gaussian beam resonances for measurement. Samples were positioned on the plane mirror, and a Vector Network Analyzer (VNA) (Rohde and Schwarz ZVA50) was used to record the complex transmission coefficient. The Q-factors and resonant frequencies were then obtained by fitting a resonance model to the data. Measurements of permittivity and loss angle were obtained by the fixed-frequency tunable length method [29]. For each sample, measurements were made at three resonant modes close to 36 GHz, set by changing the VNA frequency, to check that measurements are not affected by coincident higher-order modes. The Q-factor of the empty cavity was approximately 130,000. The technique requires that sample thickness be approximately an integer number of half wavelengths in the medium of the material. Uncertainties were evaluated from contributions associated with dimensions, Q-factors, and theory. The Gaussian beam is highly polarized, which allows the two axes of uniaxial Y-cut quartz crystals to be measured at different specimen rotations. For Z-cut quartz, measurements are expected to be independent of the specimen rotation.
Note that MW measurements typically yield values of real permittivity ε′ and loss angle δ, whereas THz TDS measures refractive index n and absorption coefficient α. The two sets of parameters can be inter-converted by using the relations:
ε = n 2 k 2
ε = 2 n k
tan δ = ε / ε
k = α c / 4 π ν
where k is extinction and ε″ is the imaginary part of complex permittivity.
For low-loss materials, such as those studied here, permittivity ε′ at MW frequencies is expected to have negligible dispersion. This is because the Kramers-Kronig relationship between the real and imaginary parts of the refractive index (n and k) requires that d n / d ν k (except in the vicinity of an absorption peak) [30]. When n>>k, n has negligible dispersion, and so does ε′.

3. Results and Discussion

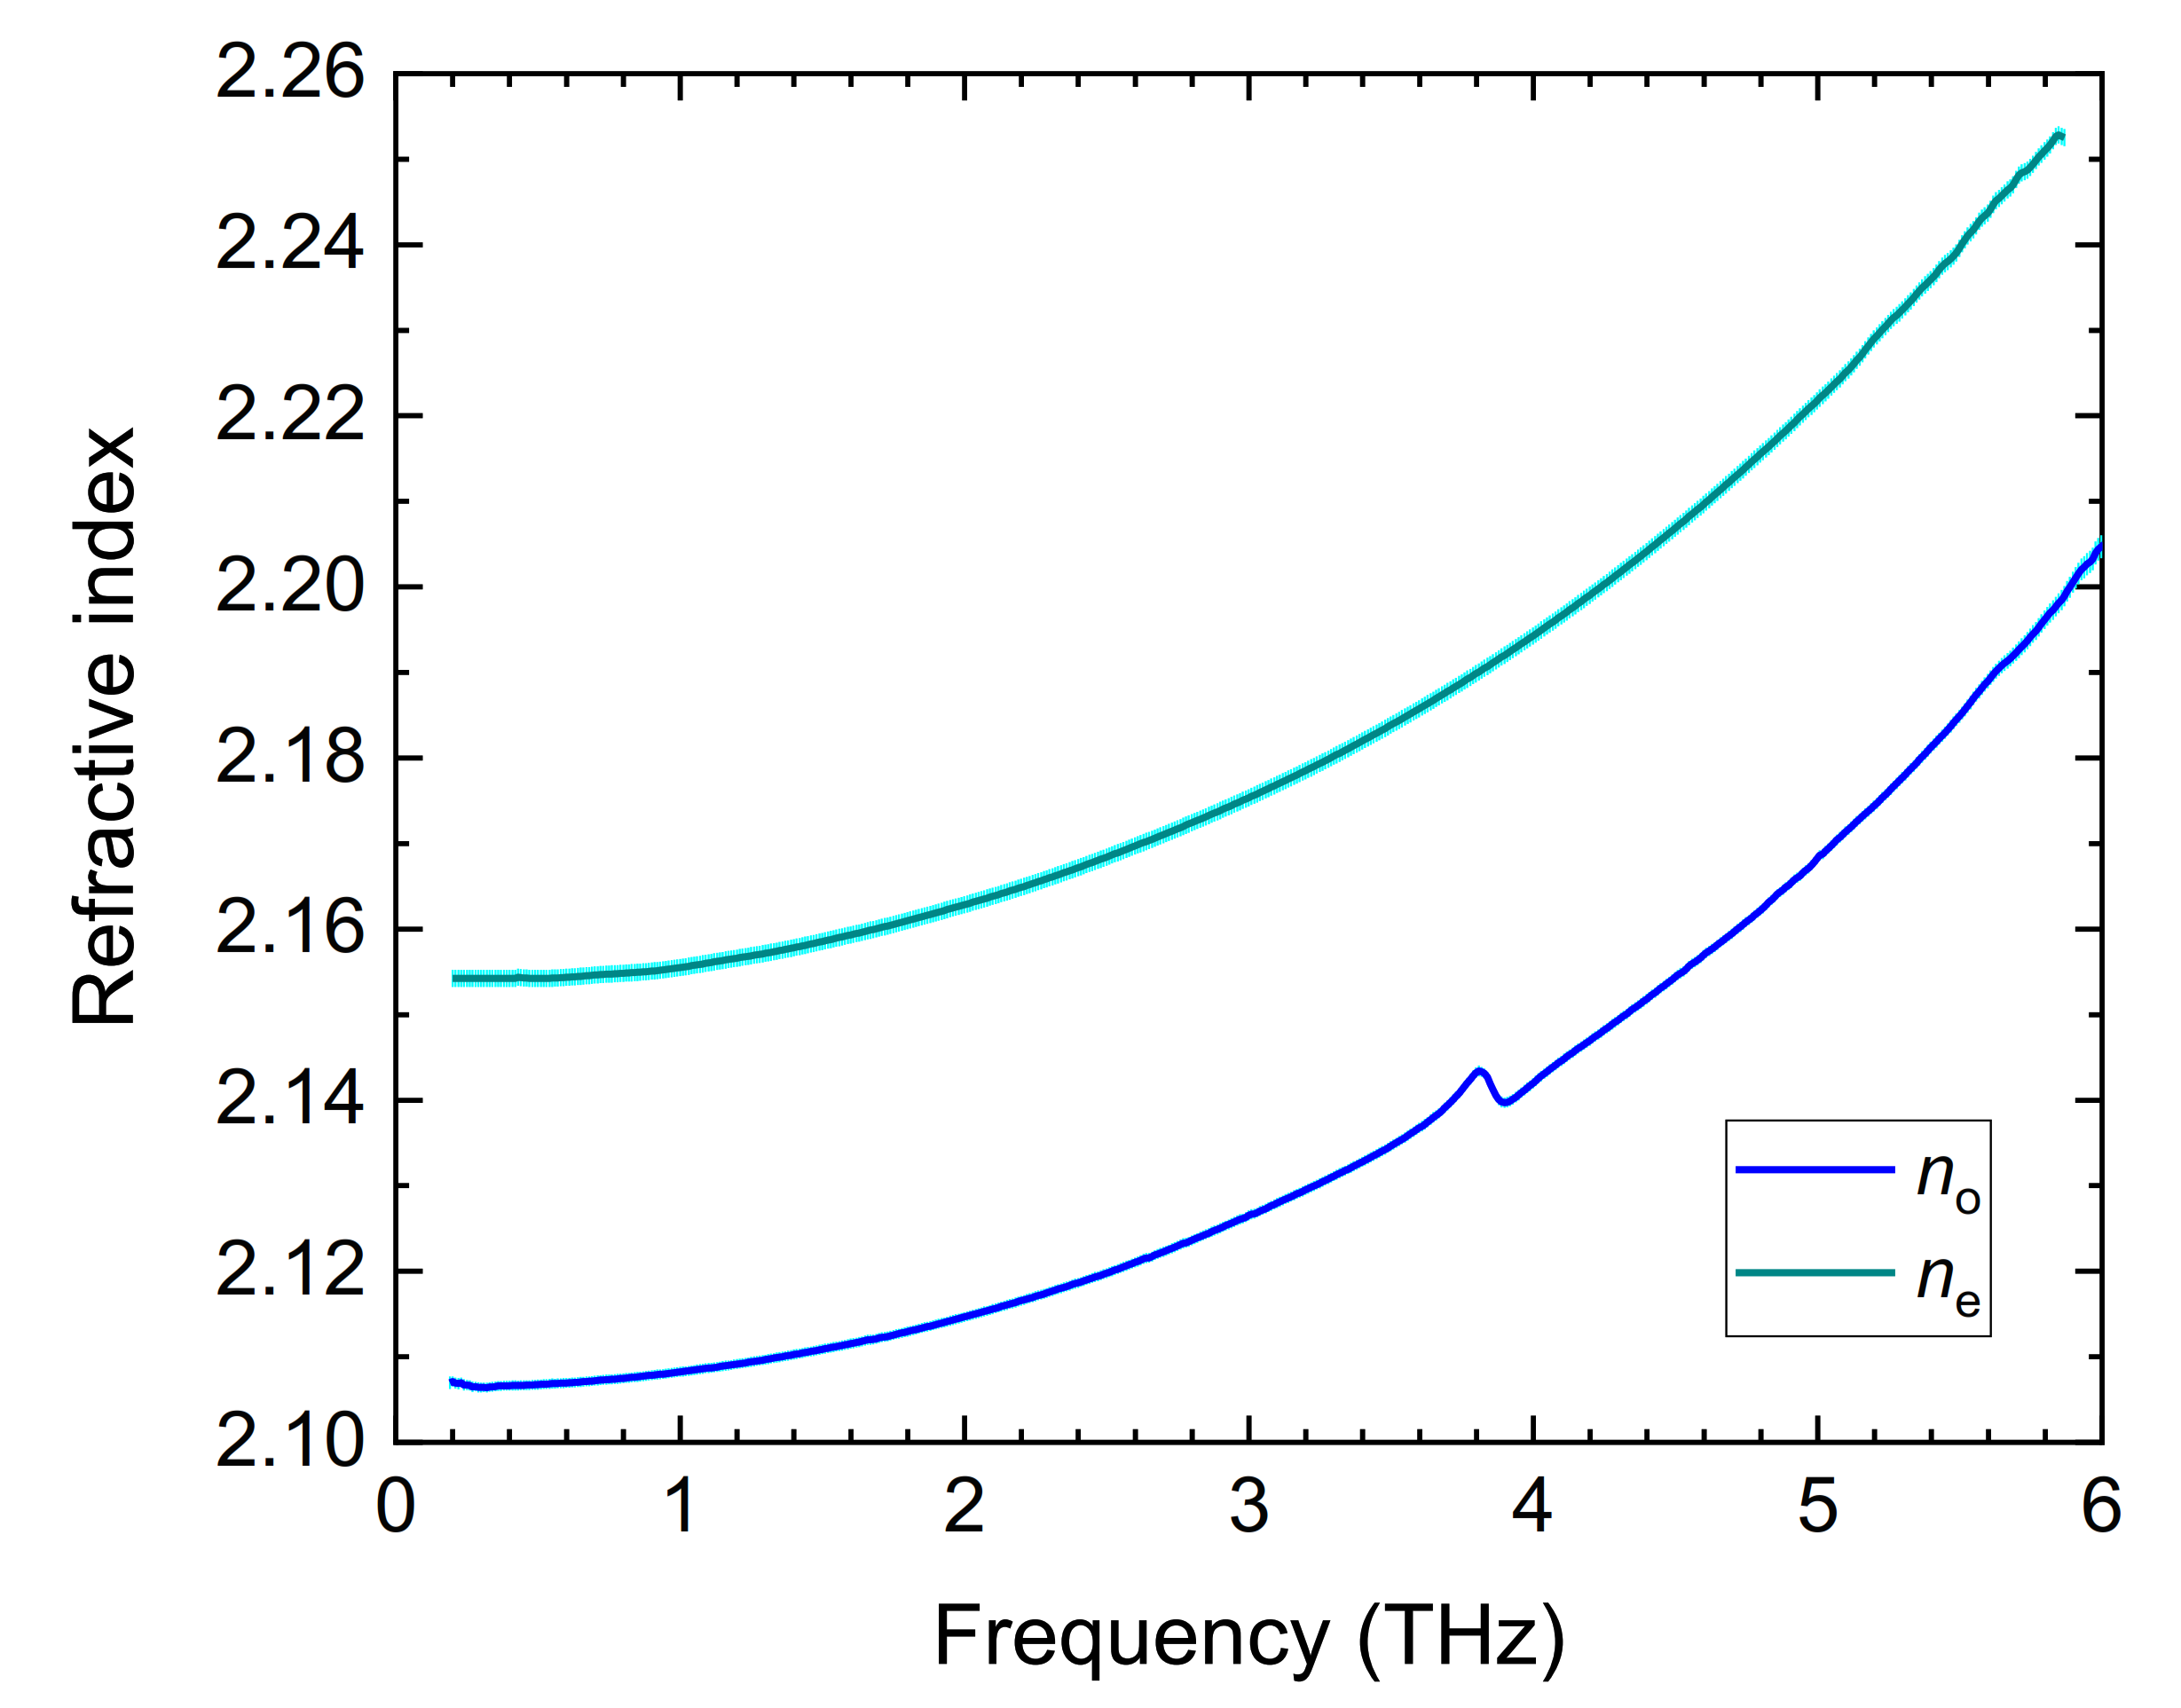
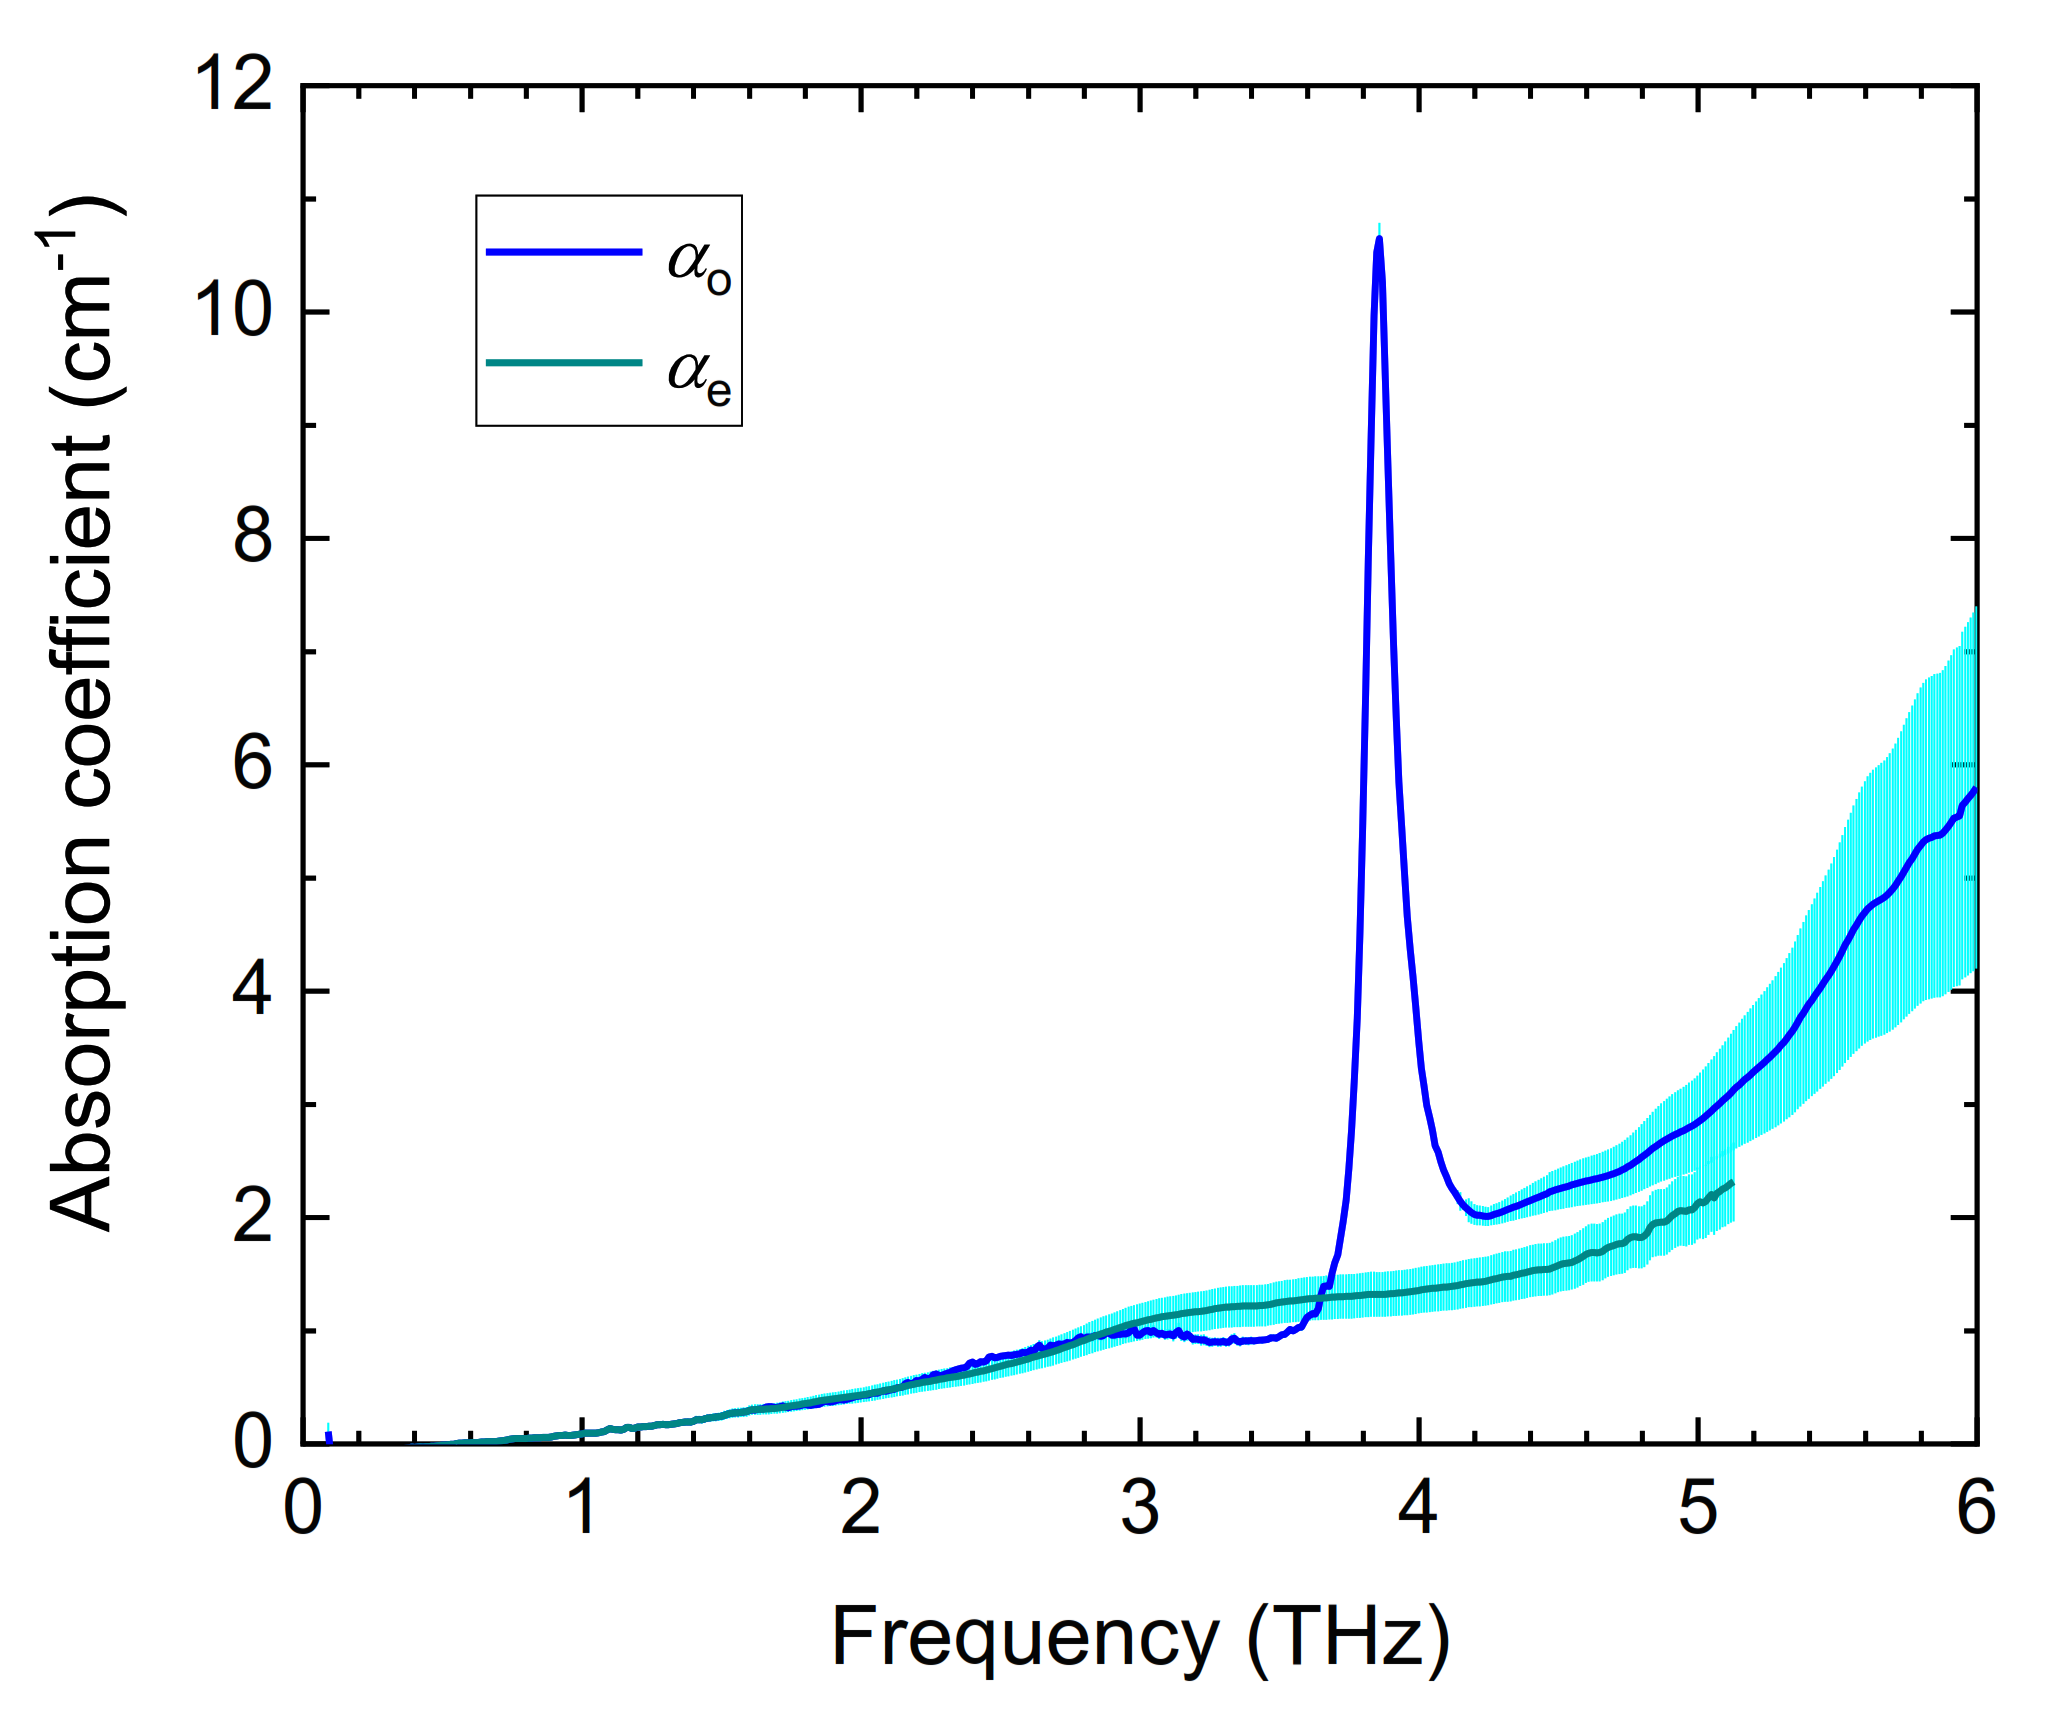
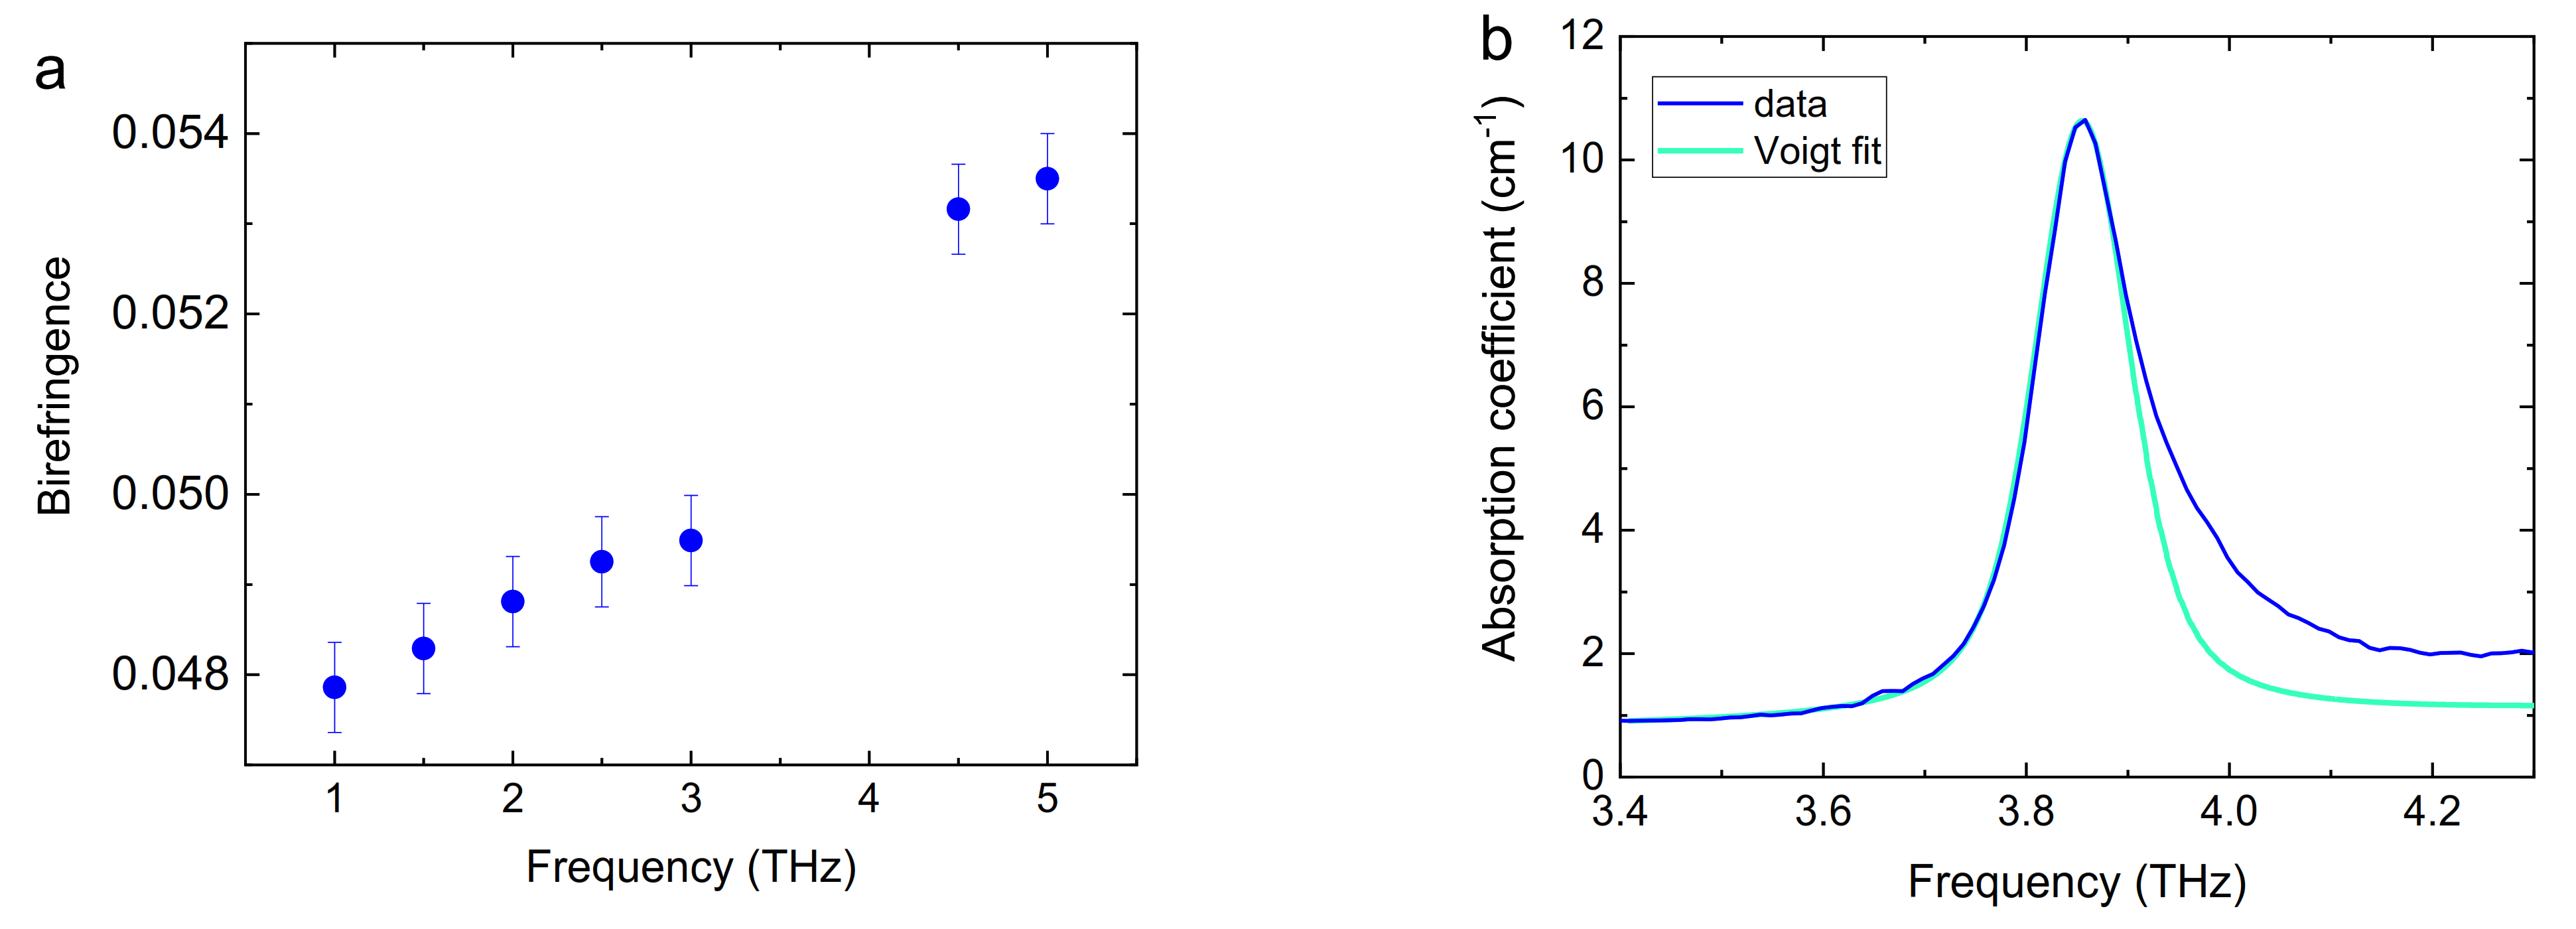
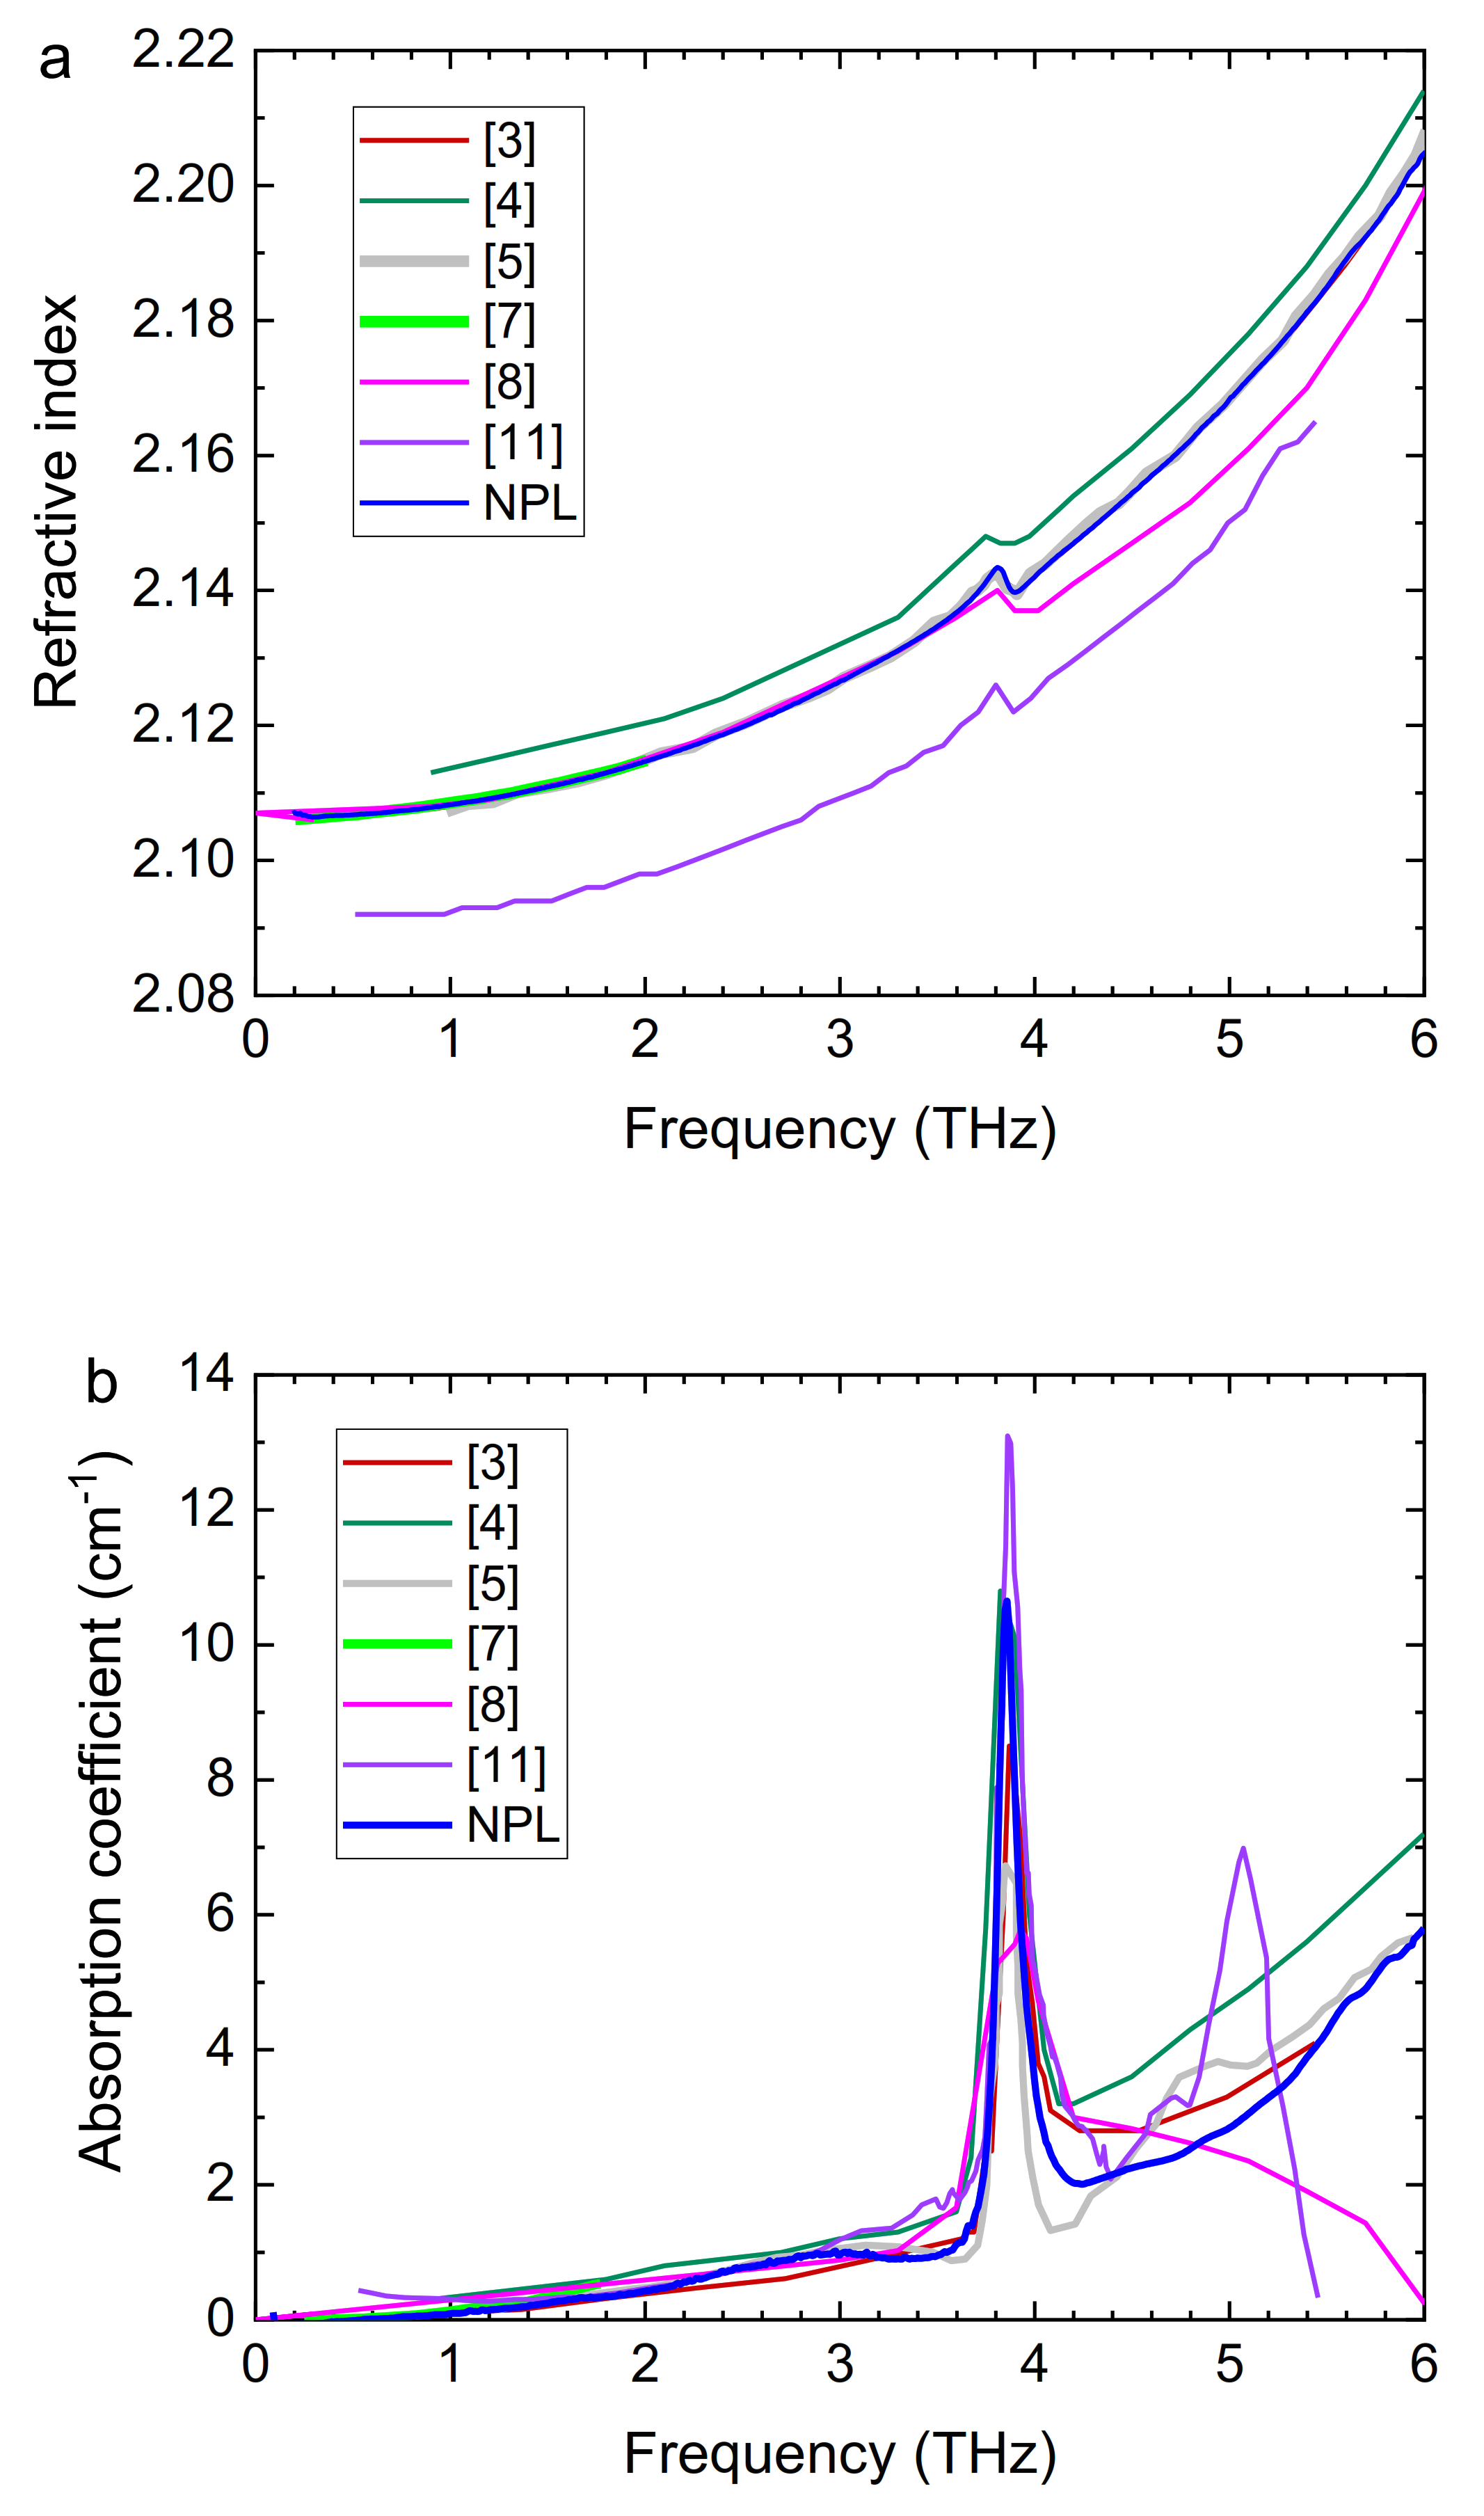
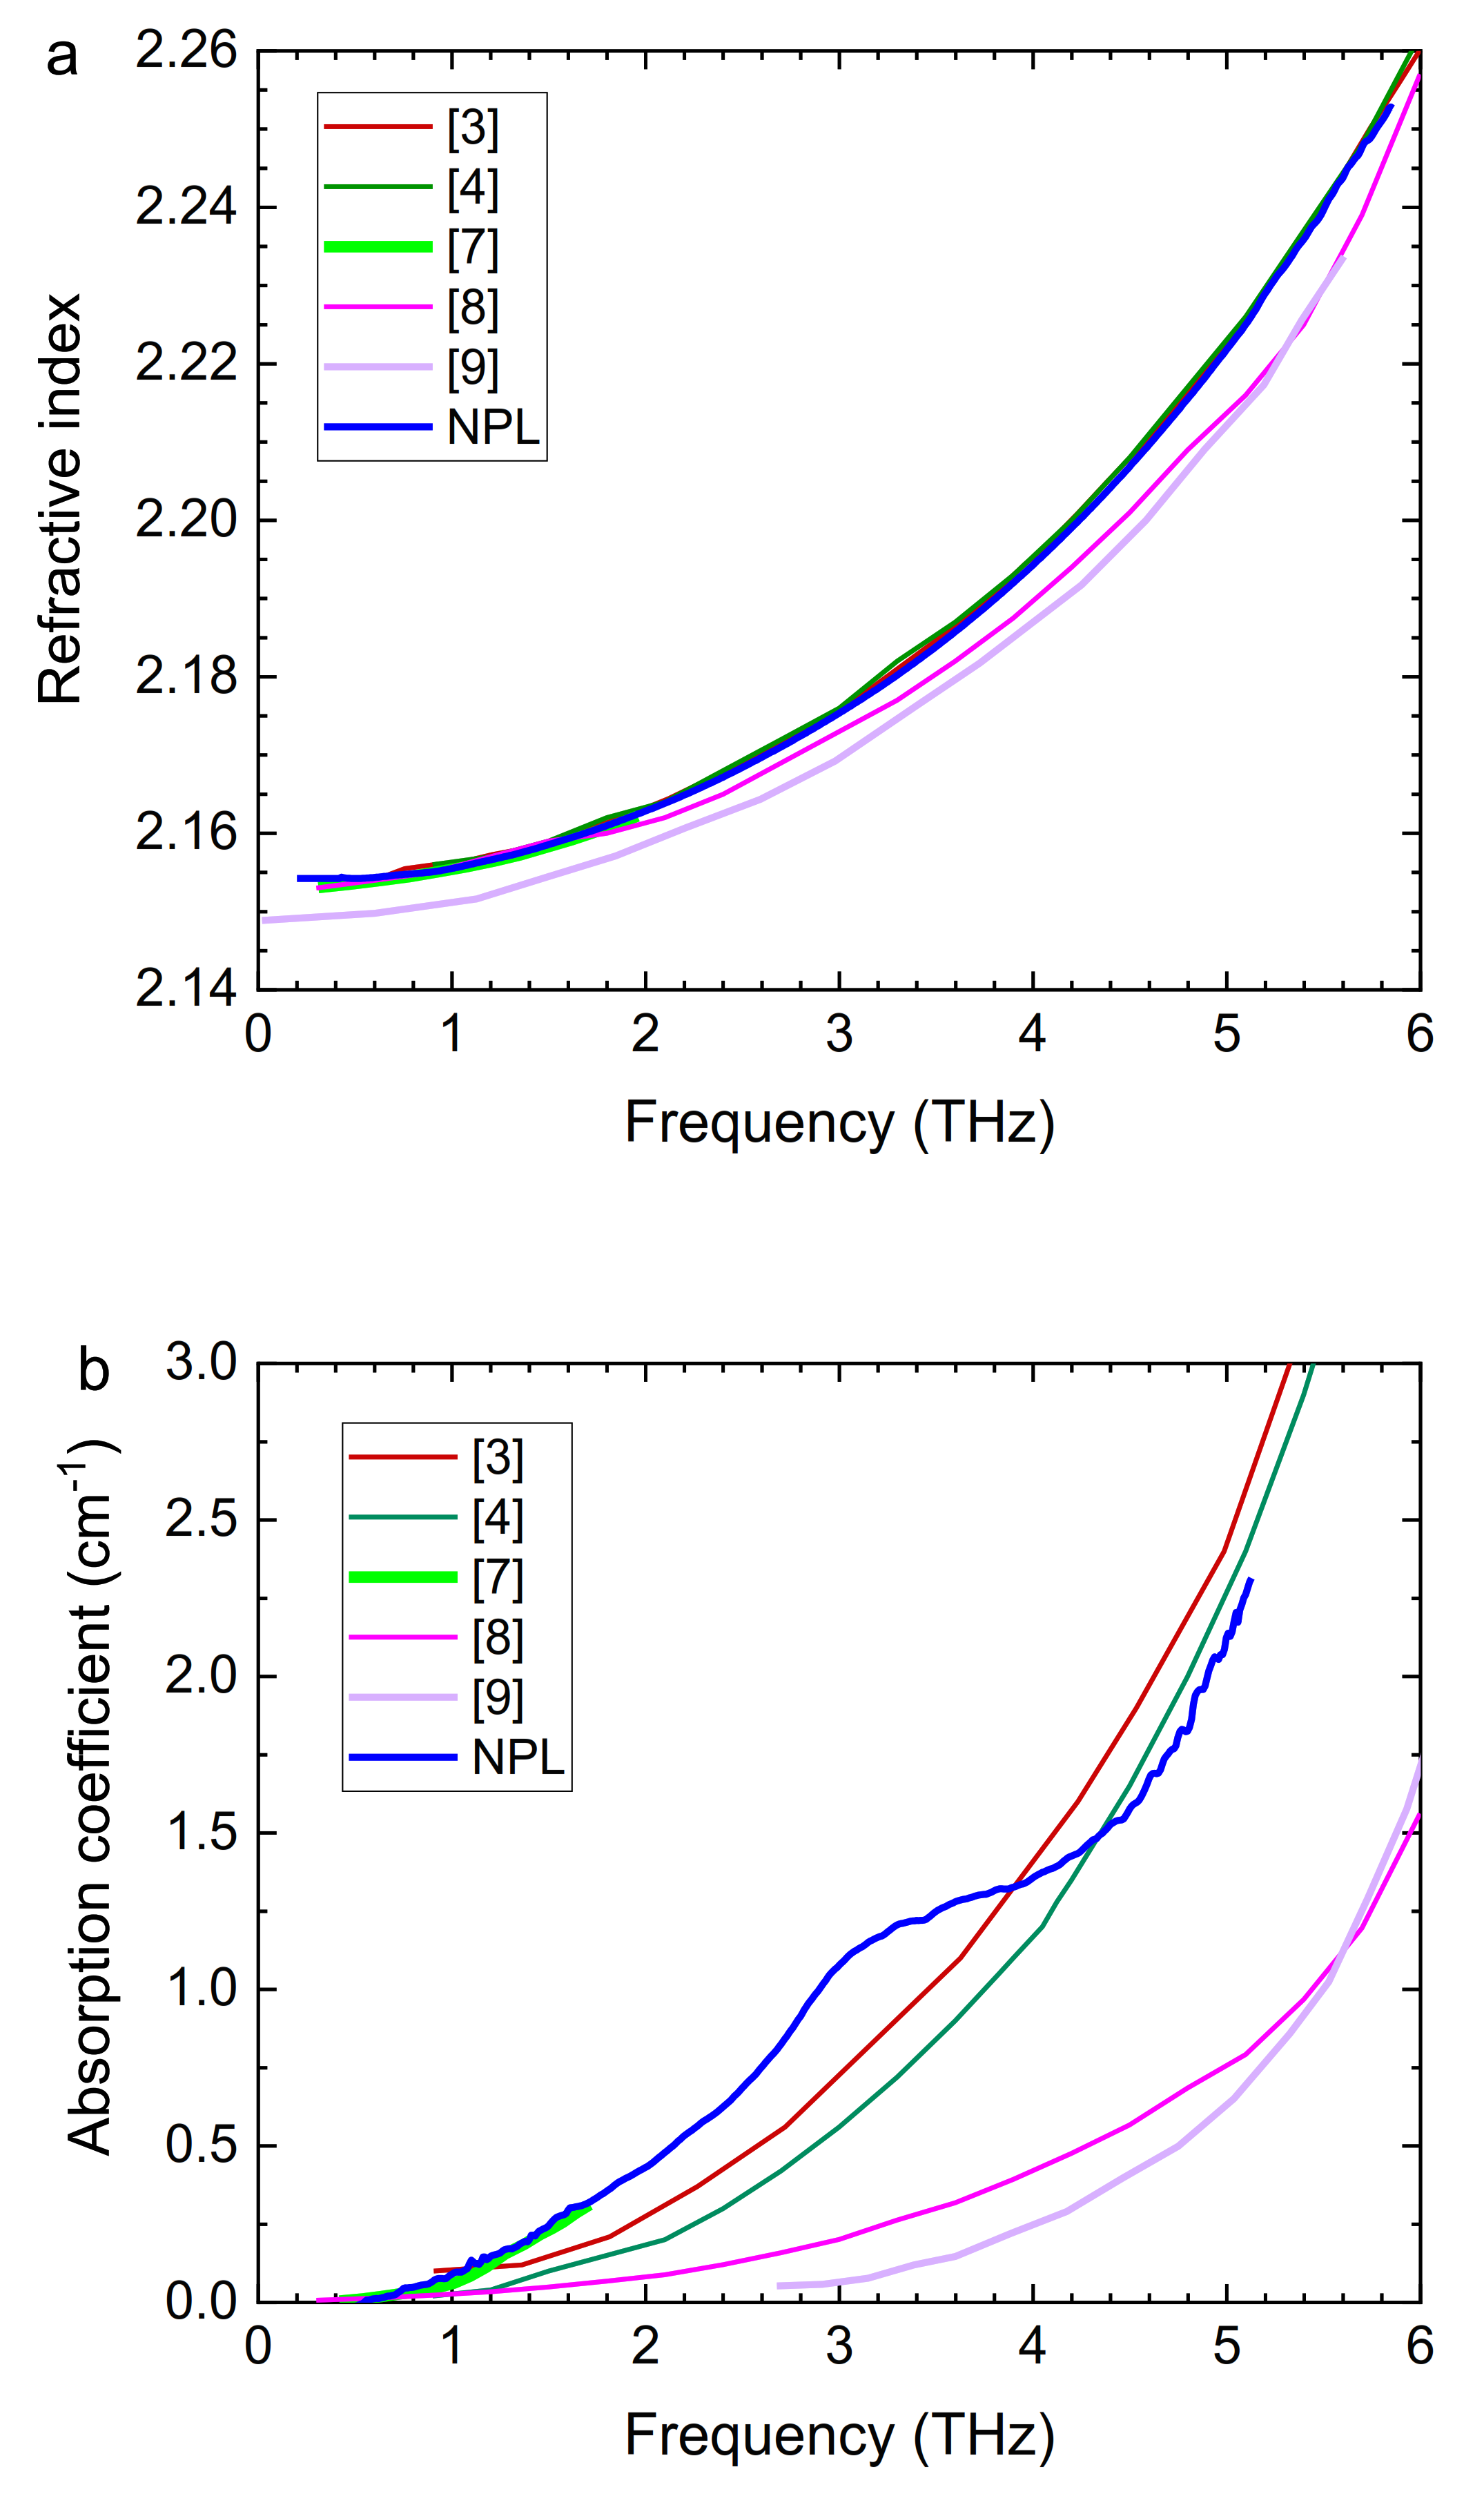
3.1. Single-Crystal Quartz

Five quartz samples cut normal to the crystal axis (Z-cut) were measured, yielding THz optical parameters for the ordinary ray (o-ray, traveling parallel to the crystal axis) transmission. Excellent reproducibility among tested samples was seen: variation in obtained optical parameters was found to be comparable with the measurement uncertainty. In addition, one Y-cut crystal was also measured (cut parallel to the crystal axis) in order to obtain the optical parameters for the extraordinary ray (e-ray, traveling normal to the crystal axis) transmission.
The refractive indices for ordinary and extraordinary rays in quartz crystal are presented in Figure 2, and the absorption coefficients in Figure 3. Quartz is a trigonal uniaxial crystal, and therefore birefringent and dichroic.
Birefringence is defined as the difference between extraordinary and ordinary refractive indices, and it is evident in Figure 2 that it is positive and increasing with frequency. The values of birefringence at a few selected frequencies are given in Figure 4a, where it is seen to rise from 0.048 at 1 THz to 0.054 at 5 THz (the values at 3.5 THz and 4 THz are omitted due to anomalous dispersion in the o-ray data). In contrast, in the visible range, the birefringence of quartz is 0.009, i.e., a factor of five smaller than at THz frequencies.
The well-known optical phonon resonance [3,8,11] in the ordinary ray spectrum is seen to be at 3.855 ± 0.005 THz. The absorption maximum is 10.7 ± 0.1 cm−1, and the peak FWHM (full width at half-maximum) is 145 ± 5 GHz. Figure 4b shows a Voigt fit to the absorption peak. The Voigt function accounts for the broadening that may arise due to the presence of crystal defects. It is seen that the peak is asymmetric: whereas on the low-frequency side the fit is good, on the high-frequency side there is an additional broad wing, caused by the rising edge of the strong optical phonon at 11.8 THz.
An important motivation for this work was to establish accurate values of THz and MW optical parameters for quartz and silica, in the light of significant variation found in the published data. This variation is especially large in the case of absorption coefficients, as seen in the figures below. Figure 5 and Figure 6 present the results of this work together with the data reported in the literature [3,4,5,6,7,8,9,10,11,12]. Different types of instrumentation were used for these measurements. Early workers employed Fourier Transform spectrometers (FTS) [3,4,5,6,11], and a grating spectrometer [7,8]; in recent years, THz TDS has dominated the field [7,10,11,12].
Our refractive index data and the values of birefringence show excellent agreement with the majority of published results. In the case of ordinary absorption, our data are in good agreement with the literature at frequencies up to about 4 THz. However, there is considerable variability in the reported intensity of the phonon resonance at 3.855 THz, which varies from 5.8 cm−1 [8] to 13.1 cm−1 [11], whereas our value is 10.7 cm−1. Some of the variation may be attributable to differences in the quality of the quartz crystals studied: crystals with low concentrations of defects and impurities exhibit stronger and narrower phonon resonances [31]. At frequencies above 4 THz, there are large inconsistencies in the published data, precluding comparison. Impurities may be responsible for some of the variations in the published data at both THz and MW frequencies (see below).
In contrast, our data for extraordinary absorption disagrees with the majority of literature. It is, however, consistent with the work of [7]. Our e-ray data indicates that there is a weak and broad absorption band centered at 3.2 THz, previously unreported at room temperature. Notably, [9] observed a weak resonance at 3.9 THz at 10 K.
A Z-cut quartz crystal (designated Q1) with thickness 4.118 ± 0.003 mm was measured in the open resonator at 36 GHz. The results were ε′ = 4.435 ± 0.007 and tanδ = (37 ± 6) × 10−6. The measured ε′ is consistent with the results published by other workers [13,29], although the tanδ is higher than the value given in [13].
Our measurements confirm that Z-cut single-crystal quartz is an excellent reference material for THz and MW measurements. However, care must be taken in selecting samples of suitable thickness for THz TDS measurements [32]: between 2 and 5 mm is preferred.

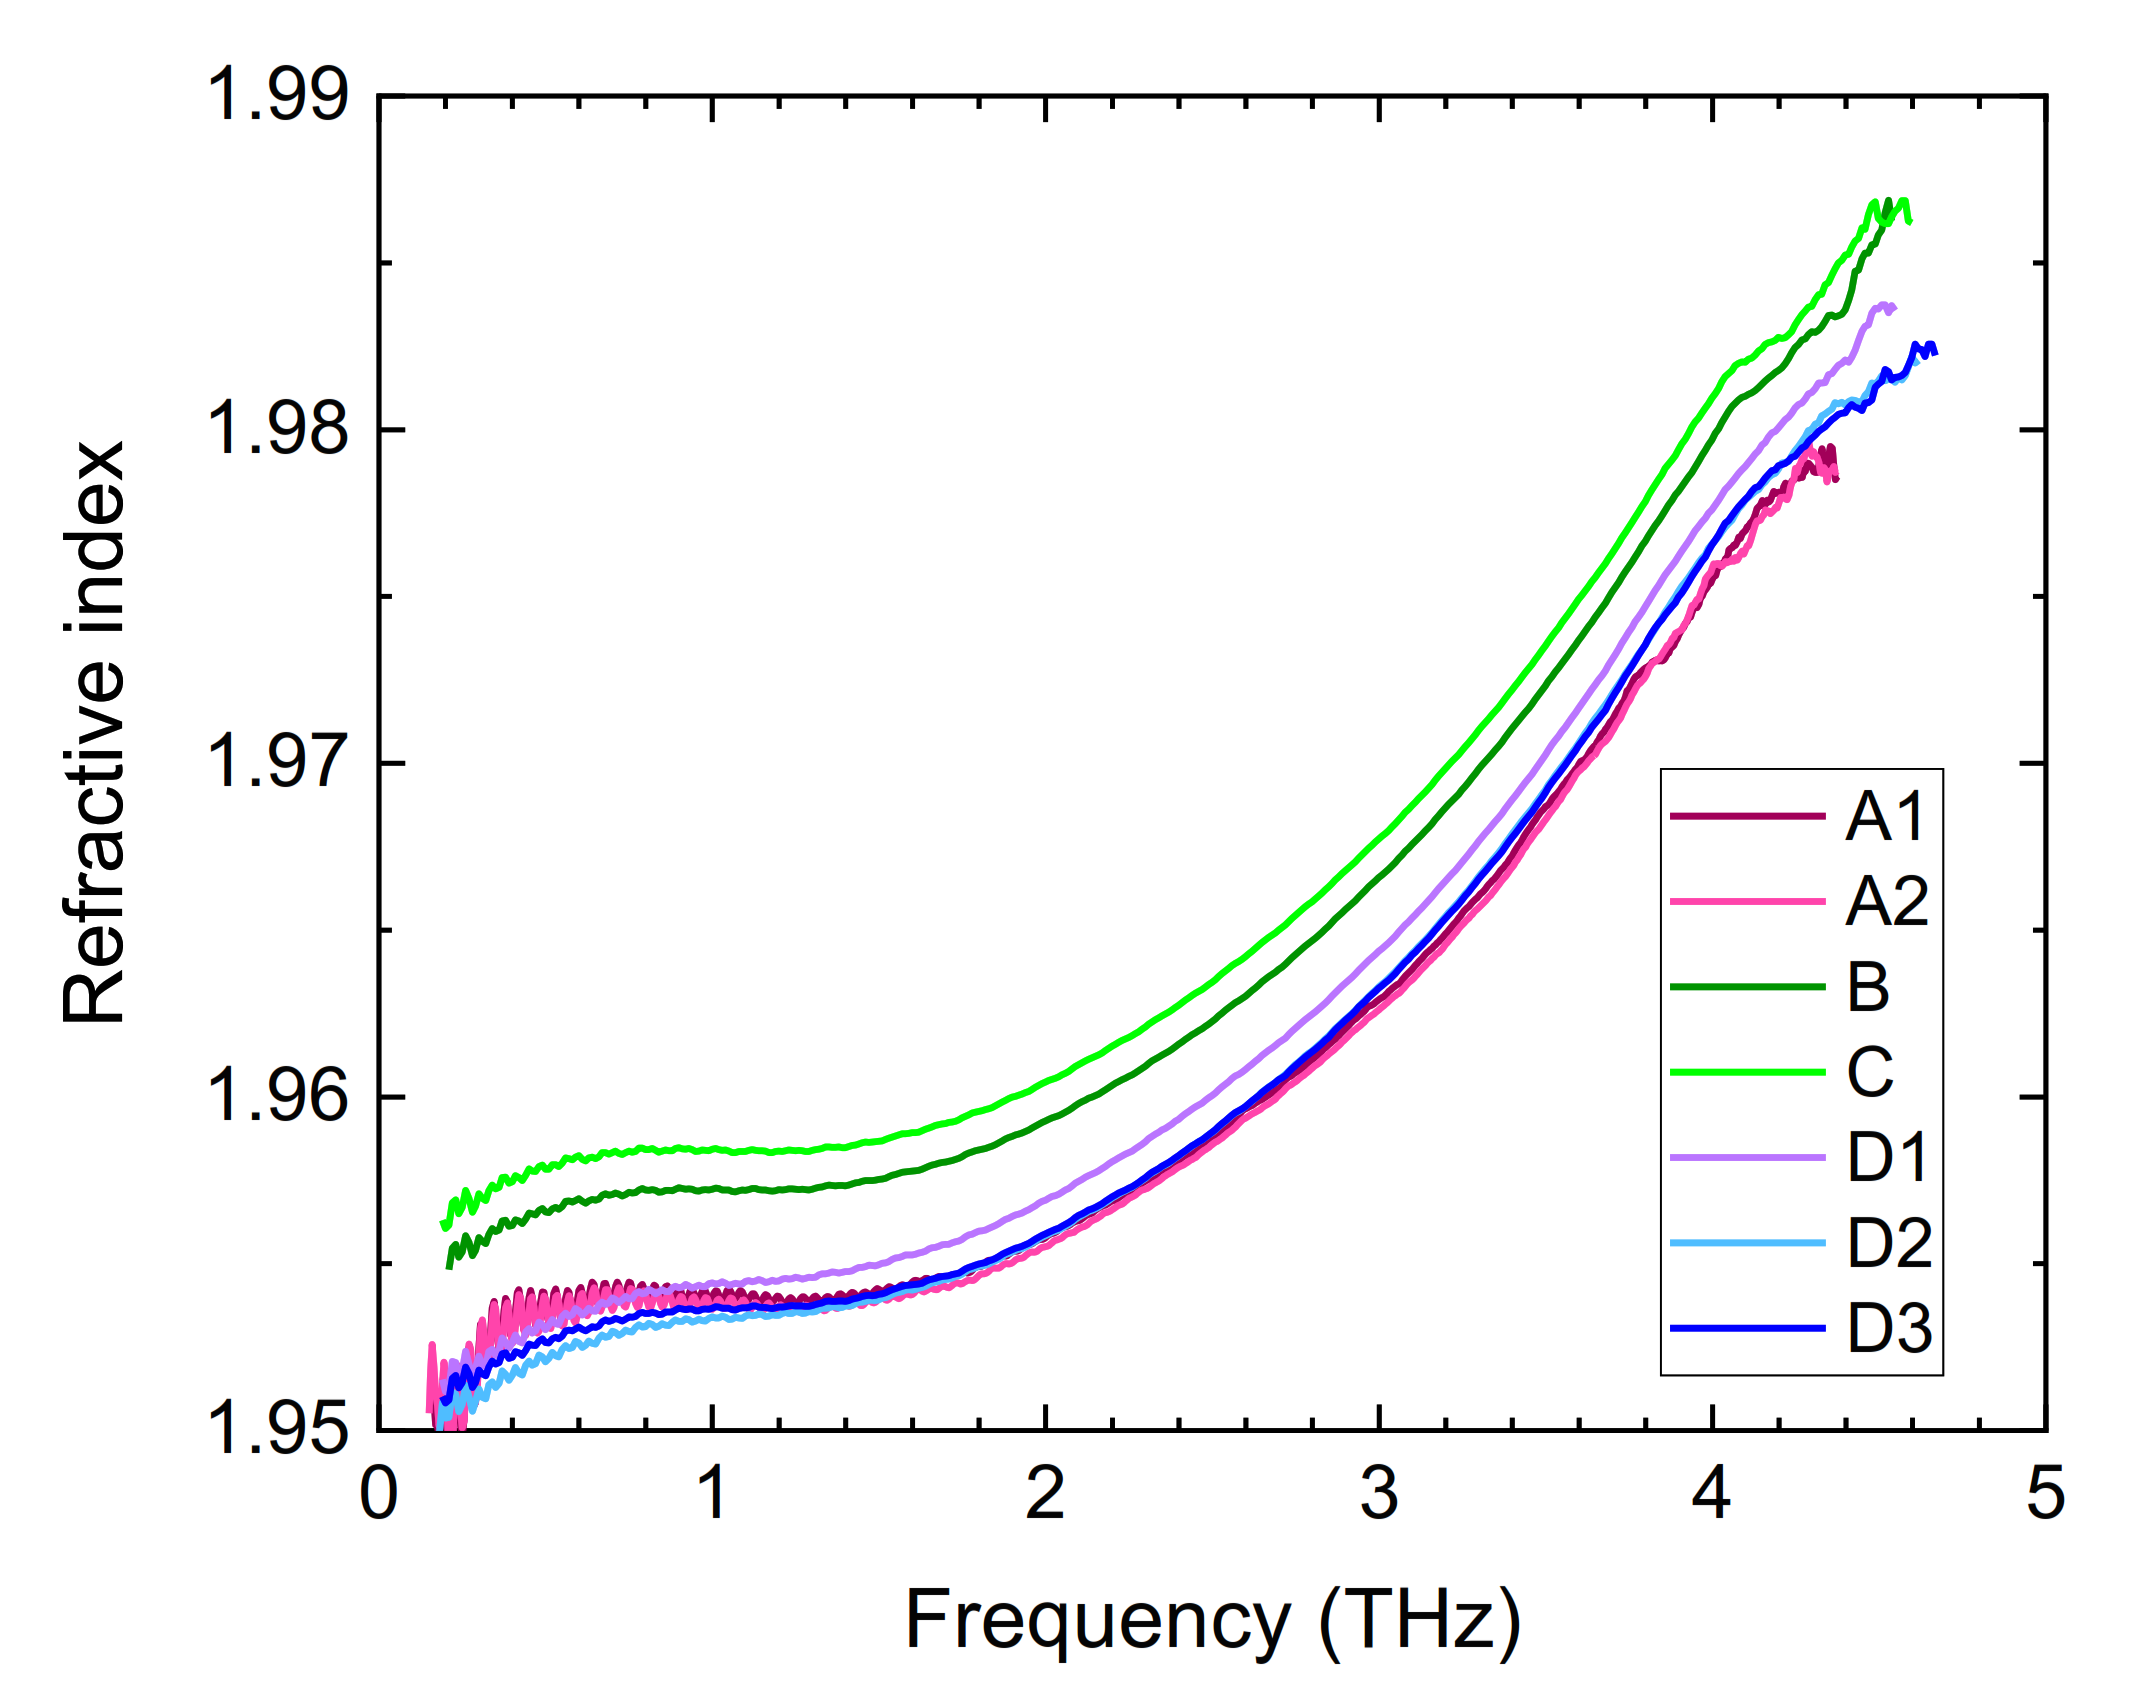
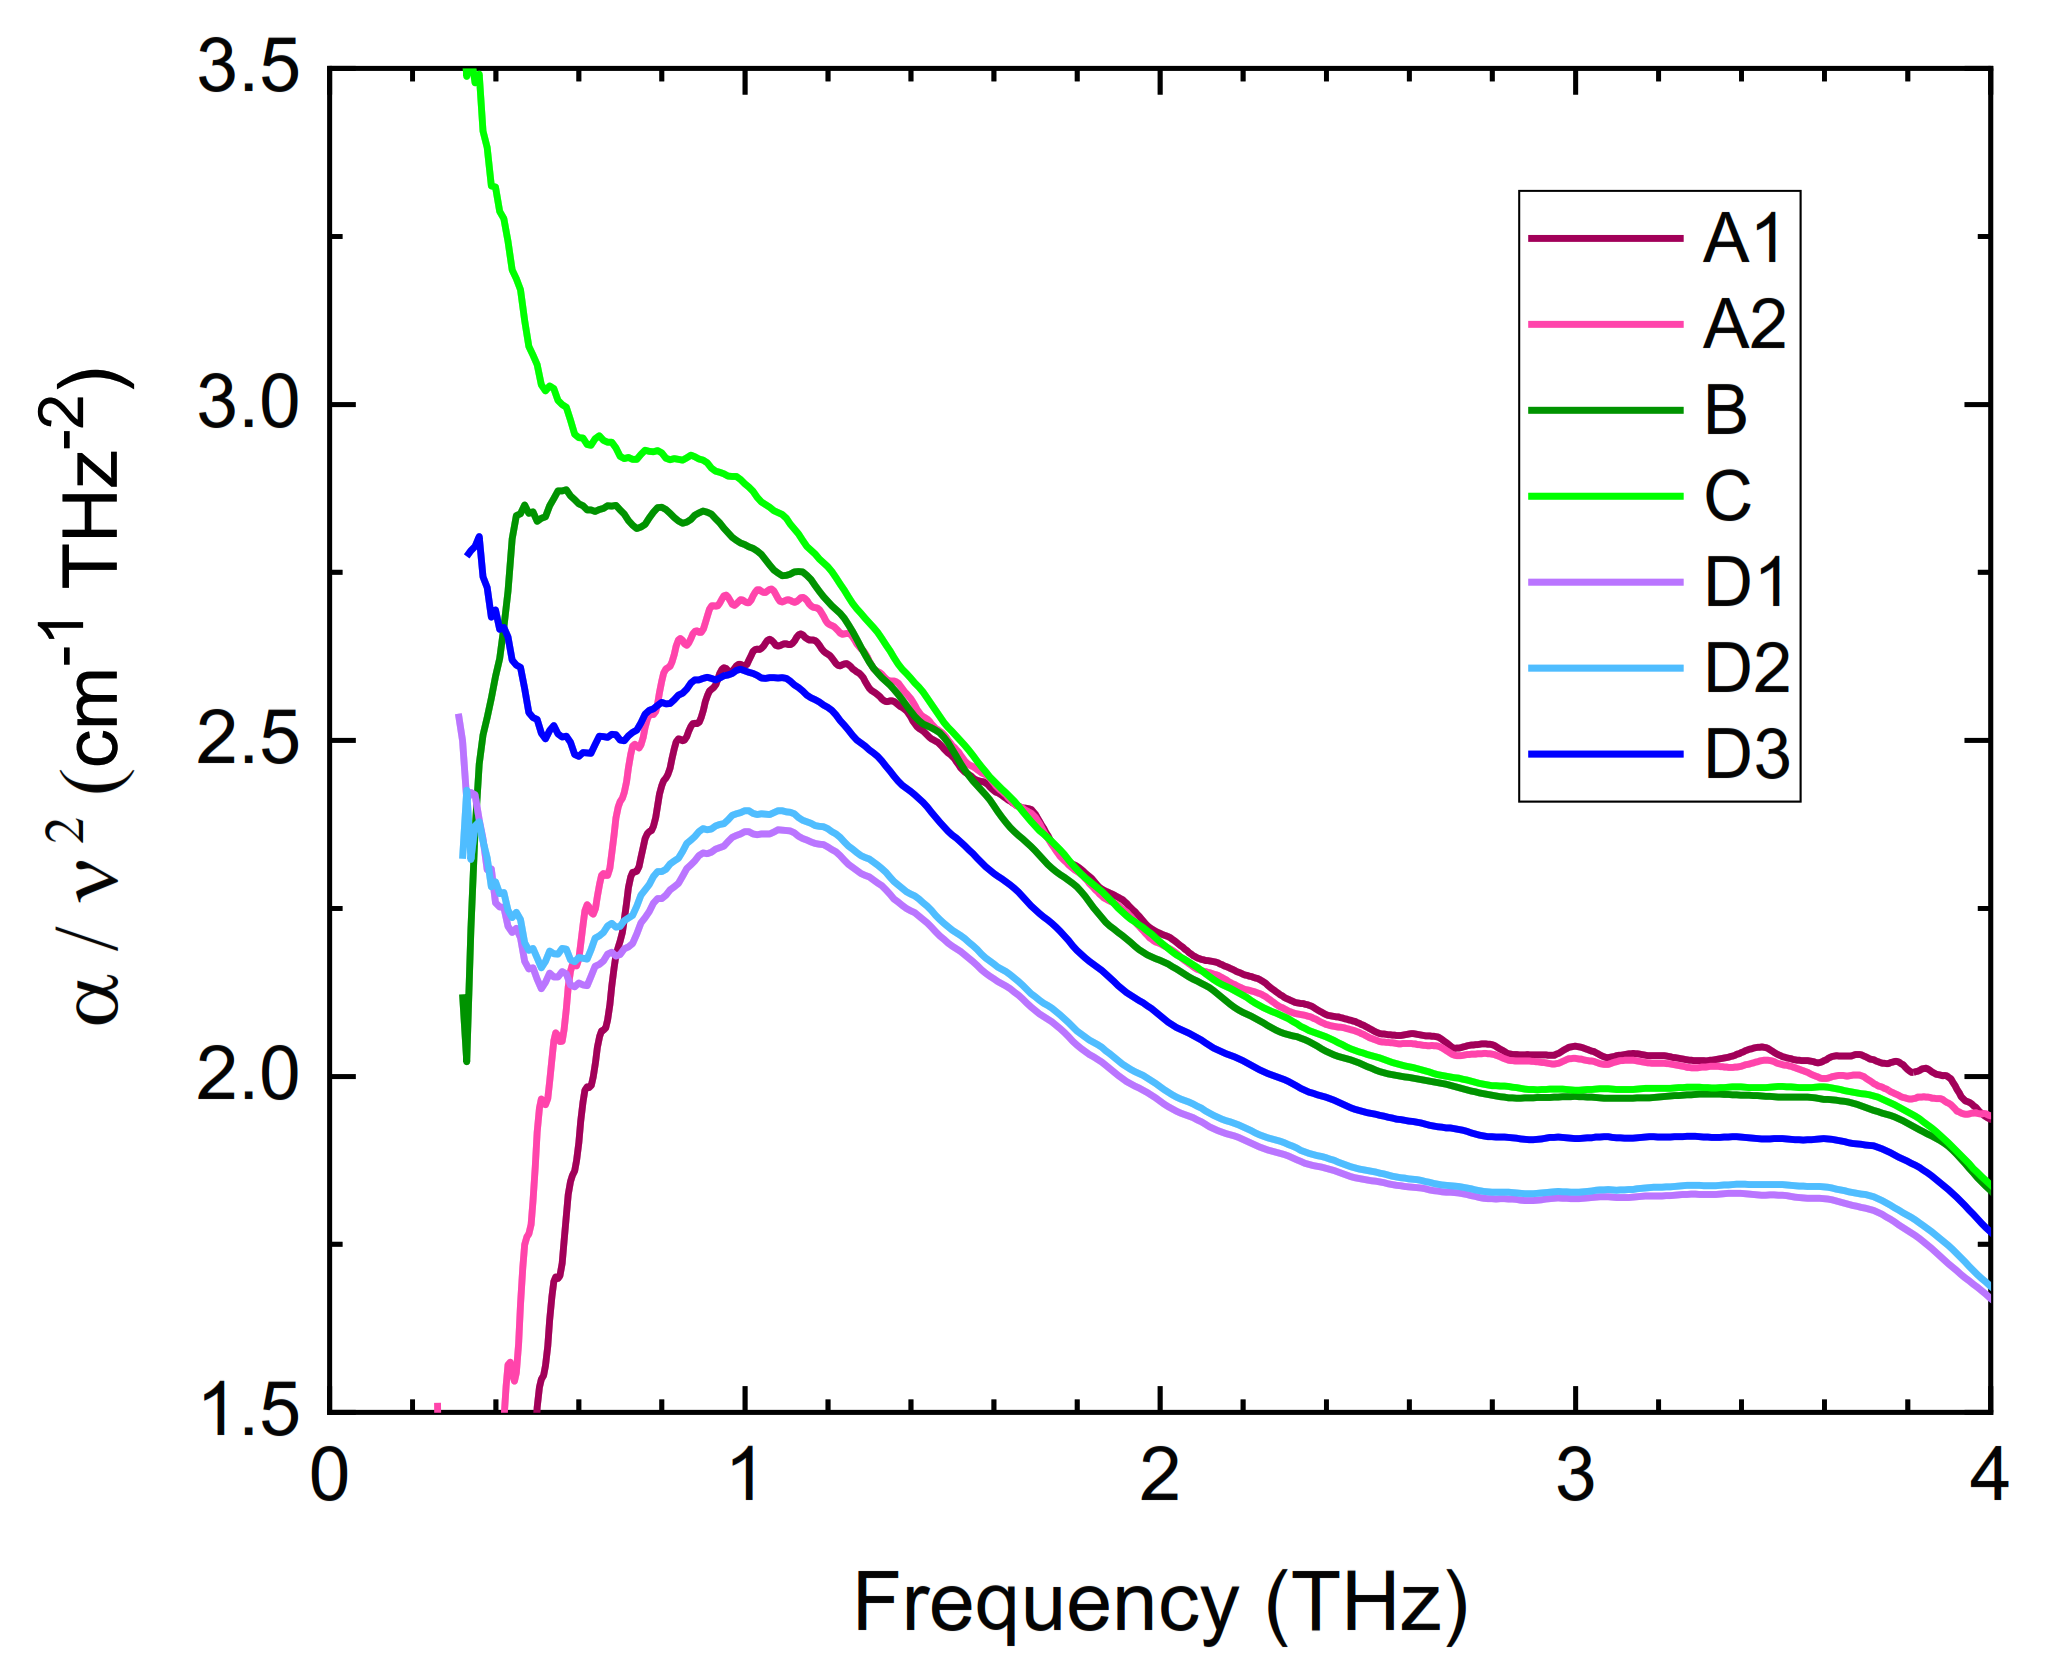
3.2. Vitreous Silica

It is known that different grades of silica glass have slightly different THz optical properties. In this work, we aimed to test variability among different batches of the same nominal grade and among different samples fabricated from the same batch. Glasses from four different batches of Spectrosil 2000 were examined, designated A, B, C, D. Batch A had two samples; batch D had three samples; batches C and D had one sample each. Their THz optical properties are shown in Figure 7 and Figure 8; their MW properties are listed in Table 1.
Significant differences are evident among the THz refractive indices of the glasses examined (Figure 7). There is a high consistency between samples A1 and A2; whereas they differ from samples B and C. Samples B and C are closer to each other than they are to samples A1 and A2. Samples D1, D2, and D3 are very similar to samples A1 and A2. Samples D2 and D3 are identical within measurement uncertainty to samples A1 and A2. However, sample D1 differs slightly from D2 and D3. These results, based on the limited number of samples examined, indicate that there is a good consistency between glass samples from the same batch, but that inter-batch variability may be significant in some cases. These should be taken into consideration in employing silica glass as a reference material for THz measurements. The THz absorption coefficients (Figure 8) of all glasses are similar up to about 2 THz, with increasingly significant differences appearing above 3 THz.
At THz frequencies absorption in amorphous materials approximates the Debye vibrational density of states (VDOS), described by the relationship α ν 2 . In terms of MW loss, this translates into δ ν (see Equations (3)–(6)), which is a well-known behavior in MW measurements [33]. However, it is well known that glasses exhibit low-frequency vibrational modes in excess of the Debye VDOS, termed the Boson peak [34,35]. The Boson peak can be revealed by plotting α/ν2 as a function of frequency, where it appears as a broad band. It has been shown that in silica glass the Boson peak occurs at around 1 THz [34,35,36,37,38] and that it is very sensitive to small variations in the glass properties, and in particular to the presence of OH groups [35,36,37,38,39].
Figure 9 depicts the Boson peak in the glasses studied, revealing variations in glass absorption properties that cannot be easily distinguished in Figure 8. As in the case of the refractive indices in Figure 7, the glass pair A1 and A2 are very similar; while B and D are close to each other but differ from A1 and A2. However, batch D differs significantly from the other glasses; moreover, unlike the refractive indices, glasses D1 and D2 are very similar, while D3 differs from them.
It appears in Figure 9 that the Boson peak height is correlated with its frequency: in glasses where the peaks are at a higher frequency, their heights are reduced. This is consistent with data reported in the literature [35,36,37,38,39]. Moreover, by considering Figure 9 together with the refractive indices in Figure 7, it appears that glasses with lower refractive indices have Boson peaks shifted to higher frequencies. To examine these correlations, Figure 10a plots the relationship between the refractive index at 2 THz and the Boson peak frequency (the value at 2 THz was chosen because it is the region with a low slope and high signal-to-noise ratio). Figure 10b likewise plots the relationship between the Boson peak height and its frequency, where the peak height is calculated as the difference between peak maximum and the baseline at 3 THz. In addition to the seven samples studied in detail above, data from another seven samples are included in Figure 10. The provenance and grade of these samples were not known; therefore, they were not included in the main study. However, the relationships in Figure 10 are made apparent due to the fact that data from a relatively large number of samples (14 in total) are included, unlike previous work where only two to three samples were examined. Figure 8 confirms the existence of strong negative correlations between (a) refractive index and Boson peak frequency, and (b) Boson peak height and its frequency. To our knowledge, this is the first explicit report of these relationships using multiple samples of silica glass. Although it is outside the scope of this work to attempt to explain this behavior, it may be speculated that it arises from polarizability, which is affected by material microstructure and impurities, and in turn, determines the refractive index and influences absorption.
As in the case of single-crystal quartz, it is important to compare our data on THz optical parameters of silica with those reported in the literature. Figure 11 presents the data reported in the literature [15,16,17,18,19,20,21,22,23,24] together with the results of this work, shown as the mean and standard deviation of the samples studied. The reported data that falls outside the shown range are excluded. Unlike the case of quartz, the great majority of these results were obtained using FTS [13,14,15,16,17,18,22], while two used TDS [19,21]; a review of all published data was reported in [20].
Our results are seen to be in good agreement with the majority of the reported data. However, it is evident that large variations exist in the reported values of both refractive index and absorption coefficient, confirming the necessity for accurate measurements.
The open resonator measurements on the seven silica glass samples gave values of refractive index that were consistent within uncertainty. The measured loss of Spectrosil 2000 is noted as being particularly low in comparison with other grades of fused silica [26]. The absorption coefficient, however, is seen to vary by a factor of two between batches. It must, therefore, be concluded that this material is not suitable as a reference material for dielectric loss at microwave and millimeter-wave frequencies. At MHz frequencies, Spectrosil 2000 can be useful as a reference material for dielectric loss because, despite the observed variability, its loss is far below the resolution of typical experiments.

4. Conclusions

Single-crystal quartz and vitreous silica were evaluated for use as reference materials for MW and THz measurements of complex permittivity. A secondary aim of this work was to produce a set of accurate data in order to clarify the large variations in the data reported in the literature.
Single-crystal Z-cut quartz was confirmed as a highly reproducible material suitable for use as a reference. Ordinary and extraordinary refractive indices and absorption coefficients were measured between 0.2 and 6 THz. The optical phonon resonance in the ordinary ray spectrum was determined to be at 3.855 ± 0.005 THz, with the absorption maximum at 10.7 ± 0.1 cm−1 and the FWHM of 145 ± 5 GHz. The results were compared with the published literature. The ordinary refractive index at 36 GHz was found to be equal within measurement uncertainty to that at 1 THz, indicating a flattening of dispersion at frequencies below 1 THz.
Silica glass samples from four different batches were examined and had their refractive indices and absorption coefficients measured between 0.2 and 4.5 THz. Variability among samples was found to be sufficiently significant to render silica glass unsuitable as a reference material. The results were compared with the published literature. As in quartz, the refractive index at 36 and 144 GHz was found to be equal within measurement uncertainty to that at 1 THz, indicating a flattening of dispersion at frequencies below 1 THz. In order to examine in more detail variations in absorption behavior, the value of α(ν)/ν2 was plotted vs. frequency, revealing large differences in the Boson peak profiles. By studying multiple glass samples, it was possible for the first time to observe the negative relationships between refractive index and Boson peak frequency, and between Boson peak height and its frequency.

Author Contributions

Conceptualization, M.N. and A.G.; methodology, M.N. and A.G.; formal analysis, M.N. and A.G.; investigation, M.N. and A.G.; writing—original draft preparation, M.N.; writing—review and editing, M.N. and A.G. All authors have read and agreed to the published version of the manuscript.

Funding

This work was supported by the project TEMMT, grant number 18SIB09, under the EMPIR H2020 program of the European Union, and by the National Measurement System Programs Unit of the UK Department for Business, Innovation, and Skills.

Institutional Review Board Statement

Not applicable.

Informed Consent Statement

Not applicable.

Conflicts of Interest

The authors declare no conflict of interest.

References

  1. Dhillon, S.S.; Vitiello, M.S.; Linfield, E.H.; Davies, A.; Hoffmann, M.; Booske, J.; Paoloni, C.; Gensch, M.; Weightman, P.; Williams, G.P.; et al. The 2017 terahertz science and technology roadmap. J. Phys. D Appl. Phys. 2017, 50. [Google Scholar] [CrossRef]
  2. Clarke, R.N.; Gregory, A.P.; Cannell, D.; Patrick, M.; Wylie, S.; Youngs, I.; Hill, G. Guide to the Characterisation of Dielectric Materials at RF and Microwave Frequencies; The Institute of Measurement and Control and The National Physical Laboratory: Teddington, UK, 2003; ISBN 0904457389. [Google Scholar]
  3. Russell, E.E.; Bell, E.E. Measurement of the Optical Constants of Crystal Quartz in the Far Infrared with the Asymmetric Fourier-Transform Method *. J. Opt. Soc. Am. 1967, 57, 341–348. [Google Scholar] [CrossRef]
  4. Loewenstein, V.E.; Smith, D.R.; Morgan, R.L. Optical constants of far infrared materials. 2: Crystalline solids. Appl. Opt. 1973, 12, 398–406. [Google Scholar] [CrossRef] [PubMed]
  5. Passchier, W.F.; Honijk, D.D.; Mandel, M.; Afsar, M.N. A new method for the determination of complex refractive index spectra of transparent solids in the far-infrared spectral region: Results of pure silicon and crystal quartz. J. Phys. D Appl. Phys. 1977, 10, 509–517. [Google Scholar] [CrossRef]
  6. Cummings, K.D.; Tanner, D.B. Far-infrared ordinary-ray optical constants of quartz. J. Opt. Soc. Am. 1980, 70, 123–126. [Google Scholar] [CrossRef]
  7. Grischkowsky, D.; Keiding, S.R.; Van Exter, M.; Fattinger, C. Far-infrared time-domain spectroscopy with terahertz beams of dielectrics and semiconductors. J. Opt. Soc. Am. B 1990, 7, 2006–2015. [Google Scholar] [CrossRef]
  8. Brehat, F.; Wyncke, B. Measurement of the optical constants of crystal quartz at 10 K and 300 K in the far infrared spectral range: 10–600 cm−1. Int. J. Infrared Millim. Waves 1997, 18, 1663–1679. [Google Scholar] [CrossRef]
  9. Wyncke, B.; Brehat, F.; Kharroubi, H. Spectroscopic studies of optical materials in the far infrared: The case of crystal quartz. Int. J. Infrared Millim. Waves 1997, 18, 475–489. [Google Scholar] [CrossRef]
  10. Castro-Camus, E.; Johnston, M.B. Extraction of the anisotropic dielectric properties of materials from polarization-resolved terahertz time-domain spectra. J. Opt. A Pure Appl. Opt. 2009, 11. [Google Scholar] [CrossRef] [Green Version]
  11. Davies, C.L.; Patel, J.B.; Xia, C.Q.; Herz, L.M.; Johnston, M.B. Temperature-Dependent Refractive Index of Quartz at Terahertz Frequencies. J. Infrared Millim. Terahertz Waves 2018, 39, 1236–1248. [Google Scholar] [CrossRef] [Green Version]
  12. Takeya, K.; Ishizuki, H.; Taira, T. Quantitative Evaluation of Birefringence of Quartz Crystal in Terahertz Region. In Laser Applications Conference; Optical Society of America: Washington, DC, USA, 2020; p. JTh6A-20. [Google Scholar]
  13. Krupka, J.; Derzakowski, K.; Tobar, M.; Hartnett, J.; Geyer, R.G. Complex permittivity of some ultralow loss dielectric crystals at cryogenic temperatures. Meas. Sci. Technol. 1999, 10, 387–392. [Google Scholar] [CrossRef]
  14. Jones, R.G. The measurement of dielectric anisotropy using a microwave open resonator. J. Phys. D Appl. Phys. 1976, 9, 819–827. [Google Scholar] [CrossRef]
  15. Randall, C.M.; Rawcliffe, R.D. Refractive Indices of Germanium, Silicon, and Fused Quartz in the Far Infrared. Appl. Opt. 1967, 6, 1889–1895. [Google Scholar] [CrossRef]
  16. Bagdad, W.; Stolen, R. Far infrared absorption in fused quartz and soft glass. J. Phys. Chem. Solids 1968, 29, 2001–2008. [Google Scholar] [CrossRef]
  17. Wong, P.T.T.; Whalley, E. Infra-red and Raman spectra of glasses. Part 2—Far infra-red spectrum of vitreous silica in the range 100–15 cm–1. Discuss. Faraday Soc. 1970, 50, 94–102. [Google Scholar] [CrossRef]
  18. Parker, T.; Ford, J.; Chambers, W. The optical constants of pure fused quartz in the far-infrared. Infrared Phys. 1978, 18, 215–219. [Google Scholar] [CrossRef]
  19. Zhilinskii, P.A.; Gorchakov, A.P.; Egorova, T.S.; Miskinova, N.A. Optical characteristics of fused quartz in the far IR range. Opt. Spectrosc. 1987, 62, 783–784. [Google Scholar]
  20. Koike, C.; Hasegawa, H.; Asada, N.; Komatuzaki, T. Optical constants of fine particles for the infrared region. Mon. Not. R. Astron. Soc. 1989, 239, 127–137. [Google Scholar] [CrossRef] [Green Version]
  21. Kojima, S.; Kitahara, H.; Nishizawa, S.; Yang, Y.; Takeda, M.W. Terahertz time-domain spectroscopy of low-energy excitations in glasses. J. Mol. Struct. 2005, 744–747, 243–246. [Google Scholar] [CrossRef]
  22. Kitamura, R.; Pilon, L.; Jonasz, M. Optical constants of silica glass from extreme ultraviolet to far infrared at near room temperature. Appl. Opt. 2007, 46, 8118–8133. [Google Scholar] [CrossRef]
  23. Tsuzuki, S.; Kuzuu, N.; Horikoshi, H.; Saito, K.; Yamamoto, K.; Tani, M. Influence of OH-group concentration on optical properties of silica glass in terahertz frequency region. Appl. Phys. Express 2015, 8, 72402. [Google Scholar] [CrossRef]
  24. Cataldo, G.; Wollack, E.; Brown, A.D.; Miller, K.H. Infrared dielectric properties of low-stress silicon oxide. Opt. Lett. 2016, 41, 1364–1367. [Google Scholar] [CrossRef] [Green Version]
  25. Afsar, M.N.; Kenneth, J.B. Precise Millimeter-Wave Measurements of Complex Refractive Index, Complex Dielectric Permittivity and Loss Tangent of GaAs, Si, SiO2, A12O3, BeO, Macor, and Glass. IEEE Trans. Microw. Theory Tech. 1983, 31, 217–223. [Google Scholar] [CrossRef]
  26. Mollá, J.; Ibarra, A. Radiation effects on the dielectric properties of fused silica. Nucl. Instrum. Methods Phys. Res. Sect. B Beam Interact. Mater. At. 2004, 218, 189–193. [Google Scholar] [CrossRef]
  27. Jepsen, P.U.; Cooke, D.G.; Koch, M. Terahertz spectroscopy and imaging-Modern techniques and applications. Laser Photon- Rev. 2010, 5, 124–166. [Google Scholar] [CrossRef]
  28. Neu, J.; Schmuttenmaer, C.A. Tutorial: An introduction to terahertz time domain spectroscopy (THz-TDS). J. Appl. Phys. 2018, 124, 231101. [Google Scholar] [CrossRef] [Green Version]
  29. Jones, R. Precise dielectric measurements at 35 GHz using an open microwave resonator. Proc. Inst. Electr. Eng. 1976, 123, 285. [Google Scholar] [CrossRef]
  30. Peiponen, K.-E.; Saarinen, J.J. Generalized Kramers–Kronig relations in nonlinear optical- and THz-spectroscopy. Rep. Prog. Phys. 2009, 72. [Google Scholar] [CrossRef]
  31. Fletcher, J.; Naftaly, M.; Molloy, J.; Andreev, Y.M.; Kokh, K.; Lanskii, G. Measurement of a phonon resonance in a GaSe crystal using THz free induction decay. Vib. Spectrosc. 2017, 92, 169–172. [Google Scholar] [CrossRef]
  32. Fox, M. Optical Properties of Solids; Oxford University Press: Oxford, UK, 2002; pp. 1269–1270. [Google Scholar]
  33. Withayachumnankul, W.; Fischer, B.M.; Abbott, D. Material thickness optimization for transmission-mode terahertz time-domain spectroscopy. Opt. Express 2008, 16, 7382–7396. [Google Scholar] [CrossRef] [PubMed] [Green Version]
  34. Baker-Jarvis, R.J.; Janezic, M.D.; Riddle, B.F.; Johnk, R.T.; Holloway, L.C.; Richard, G.G.; Chriss, A.G. Measuring the permittivity and permeability of lossy materials: Solids, liquids, metals, and negative-index materials. NIST Technol. Note 2005, 1536, 2004. [Google Scholar]
  35. Nakayama, T. Boson peak and terahertz frequency dynamics of vitreous silica. Rep. Prog. Phys. 2002, 65, 1195–1242. [Google Scholar] [CrossRef] [Green Version]
  36. Hutt, K.W.; Phillips, A.W.; Butcher, R.J. Far-infrared properties of dilute hydroxyl groups in an amorphous silica matrix. J. Phys. Condens. Matter 1989, 1, 4767–4772. [Google Scholar] [CrossRef]
  37. Ohsaka, T.; Oshikawa, S. Effect of OH content on the far-infrared absorption and low-energy states in silica glass. Phys. Rev. B 1998, 57, 4995–4998. [Google Scholar] [CrossRef]
  38. Ohsaka, T.; Shoji, T. Effect of OH Content on the Far-Infrared Absorption and Nature of the Boson Peak in Silica Glass. J. Phys. Soc. Jpn. 1999, 68, 2664–2668. [Google Scholar] [CrossRef]
  39. Mori, T.; Masubuchi, M.; Fujii, Y.; Kitani, S.; Kohara, S.; Hirata, A.; Tokoro, H.; Ohkoshi, S.-I.; Koreeda, A.; Kawaji, H.; et al. Boson Peak Investigation of Unusually Disproportionated Amorphous Silicon Monoxide via Terahertz Spectroscopy. In Proceedings of the 2020 45th International Conference on Infrared, Millimeter, and Terahertz Waves (IRMMW-THz), Buffalo, NY, USA, 8–13 November 2020; IEEE: New York City, NY, USA, 2020; pp. 1–2. [Google Scholar]
Figure 1. Fabry-Perot open resonator used for MW measurements.
Applsci 11 06733 g001
Figure 2. The ordinary (no) and extraordinary (ne) refractive indices of quartz crystal. The uncertainties are shown by light blue shading.
Applsci 11 06733 g002
Figure 3. The ordinary (αo) and extraordinary (αe) absorption coefficients of quartz crystal. The uncertainties are shown by light blue shading. The optical phonon resonance in the ordinary spectrum is at 3.855 ± 0.005 THz.
Applsci 11 06733 g003
Figure 4. (a) Birefringence of quartz, defined as neno. (b) Voigt fit to the phonon resonance peak at 3.855 ± 0.005 THz.
Applsci 11 06733 g004
Figure 5. THz optical parameters for the ordinary ray transmission in quartz crystal. Data reported in the literature are shown together with the results of this work. (a) refractive index; (b) absorption coefficient.
Applsci 11 06733 g005
Figure 6. THz optical parameters for the extraordinary ray transmission in quartz crystal. Data reported in the literature are shown together with the results of this work. (a) refractive index; (b) absorption coefficient.
Applsci 11 06733 g006
Figure 7. Refractive indices of Spectrosil 2000 silica glass samples.
Applsci 11 06733 g007
Figure 8. Absorption coefficients of Spectrosil 2000 silica glass samples.
Applsci 11 06733 g008
Figure 9. The Boson peak in Spectrosil 2000 silica glass samples.
Applsci 11 06733 g009
Figure 10. (a) Relationship between the refractive index of silica glasses at 2 THz and their Boson peak frequency. (b) Relationship between the Boson peak height and its frequency in silica glasses. The peak height is measured as the difference between peak maximum and its base at 3 THz (see Figure 7).
Applsci 11 06733 g010
Figure 11. THz optical parameters of Spectrosil 2000 silica glass, shown as the mean (heavy blue line) and standard deviation (light blue shading) of the seven samples examined. Data reported in the literature are shown together with the results of this work. (a) refractive index; (b) absorption coefficient.
Applsci 11 06733 g011
Table 1. Permittivity, loss, refractive index, and absorption coefficient of quartz and silica samples were measured using the open resonator at 36 GHz and 144 GHz, and using time-domain spectroscopy at 1 THz.
Material36 GHz144 GHz1 THz
ε
±0.012
δ
(μrad)
RI
±0.003
Abs (cm−1)
× 10−3
ε
±0.012
δ
(μrad)
RI
±0.003
Abs (cm−1)
× 10−3
RI
±0.001
Abs (cm−1)
Q1 (o-ray)4.43537 ± 122.1050.6 ± 0.1 2.1080.15 ± 0.08
A13.830510 ± 401.9577.6 ± 0.63.8371370 ± 1101.95978 ± 61.9532.5 ± 0.2
A23.830520 ± 401.9577.7 ± 0.63.8301400 ± 1201.95780 ± 61.9532.7 ± 0.2
B3.834426 ± 301.9586.3 ± 0.4 1.9572.7 ± 0.2
C3.834435 ± 301.9586.4 ± 0.4 1.9582.9 ± 0.2
D13.817255 ± 201.9543.8 ± 0.3 1.9542.3 ± 0.2
D23.821258 ± 201.9553.8 ± 0.3 1.9532.5 ± 0.2
D33.826356 ± 201.9565.3 ± 0.3 1.9532.6 ± 0.2
Publisher’s Note: MDPI stays neutral with regard to jurisdictional claims in published maps and institutional affiliations.

