Abstract
With more than a half-century in operation, the industrial chemical complex of Estarreja (ICCE) in northern Portugal has left serious environmental liabilities in the region. Although protective measures were implemented, soils, surface, and groundwater contamination caused by persistent pollutants are still prevalent. This study presents data from several geophysical and hydrochemical campaigns carried out to monitor groundwater contamination in the Estarreja region over a period of 30 years. Both geophysical and hydrochemical data showed a good agreement and revealed an important anomaly caused by groundwater contamination (high levels of Na, Cl, SO4, and Fe, among others) in 2006–2007, likely caused by the remobilization of waste pollutants (roasted pyrites, soils, and sludge) during their deposition in a sealed landfill (operating between 2003 and 2005). More recently, in 2016, this impact persists, but was more attenuated and showed a general migration pattern from E to SW according to one of the main groundwater flow paths. Groundwater flow in this region has a local radial behaviour. Drainage effluent systems, such as ditches and buried pipes formerly used by ICCE, are also likely to contribute to some contamination “hotspots”. Finally, the results obtained by the combined use of these two approaches allowed for the delineation of the contamination plume for future monitoring.
1. Introduction
Chemical industry can cause severe environmental damages, especially those that operated in the past when environmental protection measures were scarce or absent. This degradation is often not limited to the area next to the industries themselves, but instead is likely to affect a much larger area. This is particularly relevant when saturated media is affected, since its limited adsorption capability and continuous movement result in the subsurface migration and easy dispersion of contaminants.
In aquifers, particularly those formed by unconsolidated materials, which are highly porous and permeable, diffusion is the most important process in contaminant migration [1]. Once in the saturated media, pollutants move according to groundwater flow paths, unless physicochemical interactions with sediments affect their mobility.
Contamination effects can persist over long periods, even after their sources are isolated or removed. This can be instigated by back diffusion processes, i.e., the reverse diffusion of pollutants from low permeability layers (e.g., clayey formations, where contaminants were preferably adsorbed during high polluting water periods) to high permeability zones [2]. On the other hand, the persistence of a pollutant is also a factor of its intrinsic characteristics. Unlike several hazardous organic constituents, metal(loid)s cannot be degraded [3,4], while there are cases of non-biodegradable organic compounds [4] and others that exhibit half-lives of hundreds to thousands of years, depending on the hydraulic behaviour [5]. The low microbial activity in groundwater is also a factor limiting biodegradation processes. Furthermore, the characteristics of many degradation products formed are still poorly understood and can present different reactivity under field conditions [5].
Although technical advances, environmental laws, and public awareness have imposed new procedures and legal restrictions to industry operations, the environmental legacy of the past is frequently difficult to overcome. That is why, in several cases, monitoring natural attenuation is the more reliable alternative to groundwater decontamination [5,6]. A complete study of groundwater contamination requires the investigation of larger areas (i.e., not only the immediate vicinity of known pollution sources), through the evaluation of relevant physical and chemical properties and parameters, as well as their variation in time throughout the region. In this sense, geophysical exploration methods have been applied with great success in the investigation of environmental problems [7,8]. These methods are particularly suited to produce fast and reliable spatial maps of physical properties related with groundwater contamination issues, but they are unable to identify the contaminant. Electrical resistivity or its inverse, electrical conductivity, is an important physical property and there are many examples and case studies in the literature regarding the use of resistivity-based methods for aquifer characterization. Typically, resistivity can vary from 1 to 10 for contaminated and pristine groundwater, respectively, [9] and, therefore, resistivity can be used to map contaminated areas.
Traditional resistivity methods using DC currents, or galvanic methods, have long been used for this purpose. At first, conventional resistivity soundings (VES) were used, but they provide 1D information [7]. Contamination plumes have a 3D character and the combination of traditional electrode arrays (Schlumberger, Wenner, dipole-dipole and others) along lines, electrical resistivity tomography (ERT), and grids provide 2D and 3D images of the areas under investigation [7,10]. However, resistivity methods imply physical contact with the ground, requiring the use of electrodes to pass current into the ground, and the setup of a complete field apparatus usually takes considerable time and effort. Furthermore, places with high contact or superficial resistivity, such as dry conditions, sand, rock outcrops, and paved areas, will cause additional field problems.
Alternatively, electromagnetic methods using AC currents, or induction methods, do not require physical contact with the ground and measurements can be done as the operator walks. These methods can also be adapted for airborne use [10]. They are fast and easy to operate and can provide 2D and 3D images of the area under investigation with less field effort. However, if there are sources of electrical noise in the area, such as power lines, they can provide unstable, if not completely improper, data.
Groundwater contamination is a dynamic phenomenon. Thus, if reliable information is to be obtained, a 4D approach, namely, time-lapse studies, are required.
The use of time-lapse resistivity in groundwater contamination, as well as algorithms for inversion and model resistivity data, have long been discussed [11,12]. These problems have been recently addressed by a number of authors [13,14,15,16,17].
However, if data from different epochs are to be used, they must be compared and normalized to a known background, so that resistivity variations can be attributed solely to the variation of groundwater contamination.
The apparent electrical conductivity of sediments and soil layers is complex due to the interaction of several factors, such as pore-water salinity, water content, and particle size distribution [18]. Hydrochemical parameters are a useful and complementary tool for assessing environmental aquifer conditions by providing information about chemical signatures of groundwater, distinguishing geological formations with similar hydrogeochemical characteristics, and understanding element mobility and dispersion patterns [19].
Therefore, the use of both electrical exploration methods, to delimit contaminated areas as well as to estimate their temporal and spatial evolution, and hydrochemical parameters, to access the level and type of groundwater contamination, have been applied with success in several studies [20,21,22,23].
The industrial chemical complex of Estarreja (ICCE) in northern Portugal has been operating for almost 70 years. During this period, environmental laws have evolved from non-existent to strict regulations in accordance with the EU regulations. Thus, in the past, effluents were discharged in local streams, man-made ditches, and buried metal pipes, which were easily corroded, playing a major role in the contamination of local aquifers and soils. Approximately 70% of the population living near the ICCE has water wells that are widely used for agriculture (~81%) and domestic (about 24% for drinking) supplies [24]. For this reason, the understanding of the spatiotemporal groundwater contamination is of paramount interest for the population, as well as for authorities and technicians in charge of remediation operations.
Since there is a large volume of geophysical and hydrochemical data acquired over several decades in the region, this study integrated such information to investigate temporal (a time span of about 30 years) groundwater contamination in the ICCE region in order to:
- (a)
- Map contamination plume(s) and evaluate its/their progression;
- (b)
- Estimate the propagation velocity of plume(s) and its/their variation during the study period;
- (c)
- Investigate the sources of contamination and their evolution (type and intensity);
- (d)
- Carry out an assessment of the remediation works implemented in the early 2000s;
- (e)
- Evaluate the benefits of this joint approach in future monitoring and remediation operations, so that the findings of this work can have a wider use and applicability to other case studies.
2. Site Characterisation
2.1. The Industrial Study Site
The industrial chemical complex of Estarreja (ICCE) occupies an area of approximately 2 km2 (Figure 1), and is located 1 km east of Estarreja and 20 km north of Aveiro city in northern Portugal.
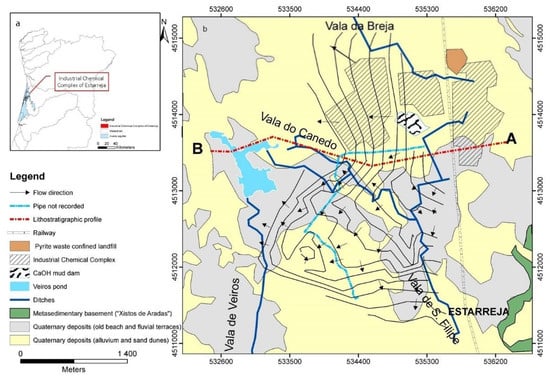
Figure 1.
(a) Location of the Aveiro aquifer boundary and the industrial chemical complex of Estarreja, northern Portugal; (b) Simplified geological map of the study area (adapted from Teixeira and Zbyszewski [38]) and main groundwater flow paths (compiled data from measurements made in 2015 and from Ordens [33]); map coordinates: UTM; WGS84—29N zone.
This industrial complex started operations in the 1950s and, since then, has gone through different production cycles. The more relevant products have been [25]: ammonium sulphate (1952–1990s) manufactured from sulphuric acid (obtained by pyrite roasting) and ammonia; nitric acid and ammonium nitrate (1974–1990s); nitric acid, aniline, and nitrobenzene (1978–present); sodium and chlorate compounds using mercury cathodes (1956–2002); polyvinyl chloride—PVC (1963–1983); and isocyanide polymers of aromatic base (1978–present). Consequently, large amounts of solid wastes, some enriched in metal(loid)s (e.g., As, Cu, Pb, Hg, and Zn) were produced, which were latter deposited in a sealed landfill, while others were deposited in a calcium hydroxide mud dam (Figure 1). In addition, effluents are also responsible for a high pollution load containing organic compounds (namely, aniline, benzene, monochlorobenzene, and mononitrobenzene) as well as metal(loid)s (e.g., As, Hg, Pb and Zn). Until 1975, these effluents were transported by artificial (open and permeable) ditches (Vala de S. Filipe, Vala da Breja, and Vala do Canedo), which discharged into the natural surface water streams [25]. In the present, they are transported by an emissary pipe to a water treatment plant and only then discharged into natural water systems.
The main environmental remediation interventions were undertaken from 1994 onwards by a joint effort of the local council, industries, and national environmental authorities. Since that time, chemical plants have also adopted procedures to control the emission of effluents and solid wastes to reduce their environmental impacts. Examples of the interventions carried out at the ICCE include the replacement of Hg cells with membrane cells in 2002 and the containment of about 300,000 tons of waste and contaminated soils in a confined landfill (2003–2005), supported by the ERASE project, an association between industry and local authorities [26].
Groundwater contamination studies in the ICCE started in the last quarter of the 20th century [27,28,29], and since then many other works have been carried out, devoted either to the environmental impacts [25,30,31,32,33,34] or to the potential associated health risks [35,36,37].
However, in parallel to the intense industrial activity, agriculture and farming have also been intensive and must be accounted for in terms of the contamination process in the area. In fact, these activities exert further pressure on local ecosystems because of the widespread use of agrochemicals and the effluents from cattle breeding.
2.2. Geology and Hydrogeology
The study area is part of the so-called Aveiro sedimentary basin, located in the northern sector of the western Meso-Cenozoic Margin. The stratigraphic sequence of this basin is discontinuous, consisting mainly of Holocene-Pleistocene units and, with less representation, Cretaceous and Triassic formations. These sedimentary units are deposited on a substrate of Neoproterozoic age, the Aradas shales formation, mainly composed of fine-grained metapelites of low metamorphic grade, which constitutes the Hercynian basement (Figure 1) [38].
In detail, the sedimentary sequences (from bottom to top) begin with a red-coloured polygenic conglomerate superimposed by Triassic fine and red sandstones. The Cretaceous units show a greater development towards the Atlantic coast and are deposited over Triassic materials or directly on the Hercynian bedrock. The predominant lithology of this sequence are sandstones with depositional characteristics that vary in depth, allowing for the individualization of different formations. Thus, the base of the sequence is composed of sandstones of variable grain size interbedded with clays and superimposed by a thick clayey layer. Covering this there is a white sandstones sequence, interspersed with clays and conglomerates, and an uppermost layer containing sandstones and clay-silt lagoon facies. Finally, the Quaternary deposits include Pleistocene beach and fluvial deposits related to two sedimentary cycles: (a) the lower unit shows a coarsening downward sequence, with coarse sands and pebbles at the base; and (b) the upper sequence is composed mainly of organic muds, clays, and clayey sands. The most recent Holocene sedimentary units include alluvium and sand-dunes.
Based on the texture and structure of different sedimentary sequences, two main aquifer systems are defined in this region: the Aveiro Cretaceous confined multilayer aquifer system, and the Aveiro Quaternary unconfined (locally semi-confined) multilayer aquifer system [39]. In the studied area, only the Aveiro Quaternary aquifer system is of interest, since the Cretaceous sequences are only expressed to the west of this location (Figure 2). The Aveiro Quaternary aquifer system comprises of three hydrogeological units [39]. The uppermost unit consists of a Holocene shallow unconfined aquifer with thickness varying between 8 and 10 m. This aquifer is highly permeable and shows a main flow path from east to west. Below this exists a semi-confined aquifer, composed of coarse and permeable sediments (sand and gravel), with groundwater flowing from east to west. The top of this aquifer consists of a low permeability mud and fine silt layer that constitutes the top of the Plio-Pleistocene sequence. Lastly is a semi-confined aquifer, formed by old beach and alluvial coarse, permeable sediments (sands, gravel, and pebbles), with groundwater flowing from west to east in opposition to the previous aquifers.
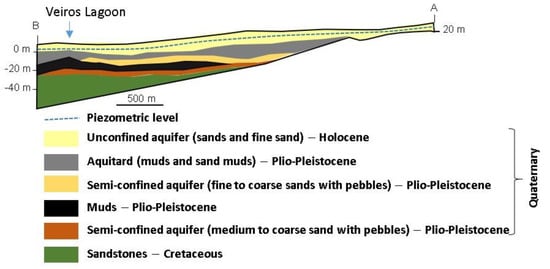
Figure 2.
Simplified vertical profile (section AB marked in Figure 1) of the main units of the Quaternary aquifer system in the Estarreja region (adapted [33]). The vertical-to-horizontal scale ratio is 10:1.
It should be noted that recharge of this aquifer system is done mainly by rainfall infiltration and irrigation return. In Estarreja, the annual average precipitation is about 1050 mm, the annual average evapotranspiration is 650 mm, and the annual average bulk runoff (including surface runoff and aquifer recharge) is 400 mm [40]. The high permeability and porosity of the aquifer layers favours recharge and the groundwater flow gradient, but this also represents a potential contamination risk since the ICCE is in direct contact with the unconfined aquifer, which facilitates contaminants migration.
3. Materials and Methods
3.1. Antecedents
Over a period of almost 30 years, several geophysical and hydrochemical surveys, aimed at studying contamination and pollutants dispersion in the ICCE, were conducted in the Estarreja region.
Geophysical mapping of the area to investigate groundwater contamination started in 1975 [27] and continued later [31], but the density of observations was low and is not suitable to compare with later, denser observations or with hydrochemical data. Therefore, in order to obtain the best temporal and spatial representation of groundwater contamination in the ICCE area, several geophysical and hydrochemical campaigns were selected. The campaigns were those that best fit in terms of the area covered and those representing the pre- and post-environmental remediation operation periods, that is, before and after 2003–2005.
3.2. Geophysical Survey
The use of electromagnetic methods (EM) in the study of environmental problems have proved very suitable at identifying the boundaries of contamination plumes and their transport pathways in the saturated zone. There are numerous equipment and field strategies that can be used to carry out such an investigation [41]. Since the studied area has about 25 km2, EM methods, being fast and reliable, were selected to map the electrical conductivity. The extensively tested EM34 was used by repeating the measurements in the same position and measuring both vertical fields (VF) with horizontal coils, and horizontal fields (HF) with vertical coils. Measurements were taken along local pathways with a 20 m interval, or inter coil spacing.
Over the period of ICCE area monitoring, several geophysical field surveys were conducted via resistivity, frequency domain electromagnetics, seismic refraction, and ground probing radar methods. In this work, frequency domain measurements from three surveys, Taunt [42], Ordens [33], and Marques [34], were chosen to evaluate the electrical conductivity evolution in the area surrounding the ICCE, and to compare with the hydrochemical findings gained in field campaigns. The choice of these surveys is justified as they covered the whole area in a very similar way. Furthermore, in 2016, two EM campaigns were carried out, one at the end of the wet season (February) and another at the end of the dry season (September) to investigate seasonal changes caused by the precipitation regime and subsequent groundwater level oscillations.
3.3. Hydrochemical Survey
Three groundwater sampling campaigns (1989, 2007, and 2016), carried out in the same area as that of the geophysical surveys, were considered in this study. Groundwater hydrochemical data of the selected campaigns were obtained from Barradas [43], Ordens [33], and Marques [34] in 1989, 2007, and 2016, respectively. Groundwater samples were collected in both holes and pumping wells. It should be noted that some of these wells are now abandoned due to unsafe levels of contamination.
The physicochemical parameters (temperature, electrical conductivity, and pH) were measured in situ using specific electrodes for each parameter. For chemical analysis, the water samples were filtered through a 0.45 μm pore size filter and stored in high-density polyethylene bottles, which were kept refrigerated in coolers during transport to the laboratory.
The analyses of chloride (Cl−) and sulphate (SO42−) were done by ion chromatography, while major cations and trace elements were determined by atomic absorption spectrometry (after a pre-concentration of waters by lyophilisation) for the 1989 sampling campaign, and by inductively coupled plasma mass spectrometry (ICP-MS) for the samples collected in 2007 and 2016.
4. Results and Discussion
4.1. Geophysical Survey
4.1.1. Influence of Seasonal Variations on Geophysical Data
The rainfall distribution in the region includes a rainy season from November to March (values over 150 mm/month) and a dry season from July to September (values less than 20 mm/month) [40]. These data, in conjunction with the high porosity and permeability of shallow geological formations, induce changes in the unconfined aquifer storage and groundwater quality. Therefore, it was necessary to investigate seasonal effects in shallow geophysical measurements if readings taken at different times of the year are to be compared.
The electrical conductivity measurements for two profiles (1 and 2; Figure 3A) obtained in the dry (September 2016) and in the wet (February 2016) seasons at sites with distinct features (south of the mud dam and close to the ditch Vala da Breja, respectively) and with different directions (W-E and NW-SE, respectively) are shown in Figure 3B.
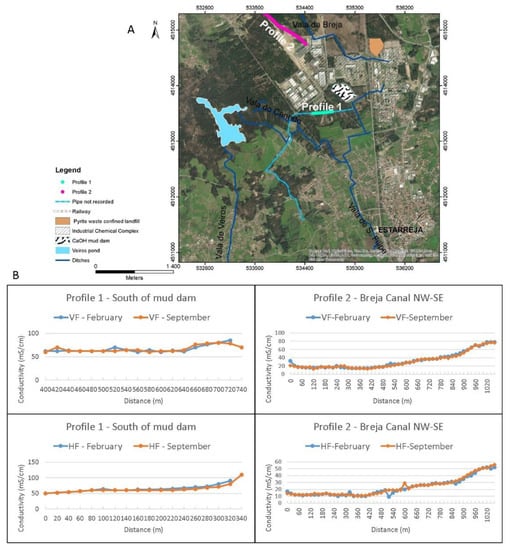
Figure 3.
(A) Location of profiles 1 and 2 (map coordinates: UTM; WGS84—29N zone); (B) Seasonal variation of electrical conductivity in profiles 1 and 2 in the dry (September) and wet (February) season of 2016 (HF—horizontal fields; VF—vertical fields).
Since the reported estimated depths of exploration for the vertical and horizontal coils surveys were 15 m and 30 m, respectively [44], data from the vertical coils survey was expected to be influenced by the unconfined aquifer, while data obtained from the horizontal coils survey should be related to a deeper area, including the semi-confined aquifer (Figure 2).
According to the data, no striking differences between the surveys carried out in February and September of 2016 were obtained, proving that geophysical data are not markedly influenced by seasonal variations in this area.
4.1.2. Temporal Variation of Conductivity in the Area
Considering that seasonal changes in the geophysical data are not significant for the EM34 geometry used, the spatial variations of electrical conductivity for the area in the vicinity of ICCE were compared for 2001, 2006, and 2016 (Figure 4) regardless of the period of the year the measurements were taken. As observed, for all the periods considered, the highest conductivity values were found near the ICCE with an overall gentle decrease as the distance from this site increases. In general, these values distribution over the area replicate the main groundwater flow paths (i.e., E-W and E-SW).
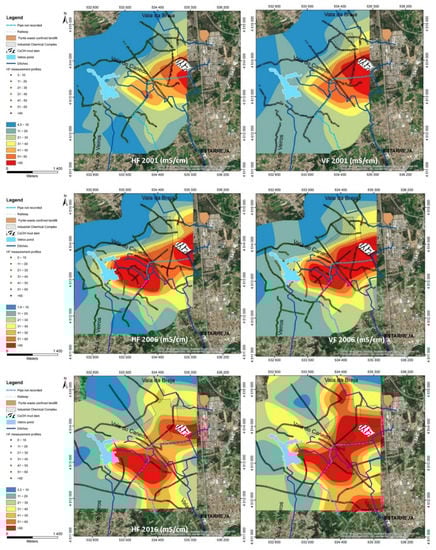
Figure 4.
Electrical conductivity maps from 2001, 2006, and 2016 obtained through electromagnetic (EM34) methods. (HF—horizontal fields on the left; VF—vertical fields on the right). Map coordinates: UTM; WGS84—29N zone.
In addition, data measured with vertical coils (referring to shallower investigation depths, corresponding to the unsaturated and saturated zones of the unconfined aquifer) and data obtained with horizontal coils (reaching deeper depths of the unconfined and semi-confined aquifers) showed similar locations for the main electrical conductivity hotspots (Figure 4). Thus, the most important hotspots were located: (a) in the vicinity of the mud dam (Figure 4, area A), at first to the southwest (maps representing 2001 data), and then to the west and south; (b) the region to the east of the Veiros pond (Figure 4, area B on the maps from 2006 and 2016), whose anomaly later extends to the east, towards the anomaly of the mud dam generating a large contaminated area; (c) anomalies located near the ditches that carried effluents away from the ICCE, (Figure 4, area C on the bottom maps); and (d) a linear anomaly to the south, located over the expected position of an old buried pipe also used to carry effluents away from the ICCE (Figure 4, area D on the maps representing data from 2016). Another important feature on the maps of Figure 4 is the low intensity anomaly just to the west of the sealed landfill. This anomaly is very weak in the earlier maps, but increases in intensity in the central maps (Figure 4, area E on the 2006 maps). Afterwards, this anomaly showed an evident decrease, both in intensity and spatially, proving the efficiency of the remediation works.
The differences in the hotspots for vertical coils (Figure 4; maps on the left) and horizontal coils (Figure 4; maps on the right), mostly refer to the intensity values. The horizontal fields showed lower conductivity values due to the greater relative representation that the non-saturated zone has at the depths reached by the vertical coils. Notwithstanding, both HF and VF maps showed that the unconfined and the semi-confined aquifers were impacted, which was particularly evident in the measurements for 2006 and 2016, and clearly revealed the extension and evolution of the contamination plume, providing a general qualitative image of the impacts near the ICCE. From 2006 onwards, data revealed remarkably high conductivity values just to the east of the Veiros pond, which were not observed in 2001, and thus must correspond to some event that subsequently occurred.
As several remediation actions took place and industrial processes altered over time, it is necessary to investigate the effects, if any, of these measures in the contamination process of the area.
The information provided by the maps in Figure 4 is qualitative and reveals contaminated areas, hotspots, and their general geographic extension. However, it is difficult to extract quantitative information concerning contamination spread. Therefore, further data analysis is required if detailed information on preferential paths, velocities, and contamination spread are to be obtained.
Locally, groundwater roughly follows a divergent radial flow from the ICCE to the west (Figure 1; [33]). In addition, to the east of the ICCE, the thickness of the Quaternary formations decreases (Figure 2), which means that the importance of the unconfined aquifer is limited and there are no pumping wells. Therefore, a good approach to investigate temporal and spatial variations of geophysical data can be accomplished by gathering information along the lines forming a radial network from the ICCE, as shown in Figure 5. In this figure, the yellow lines depict the directions from N30° W to N120° W (with a 15° angular spacing) used to evaluate the variation of the measured conductivity values. The E-W line was not included because it runs into the Veiros pond.
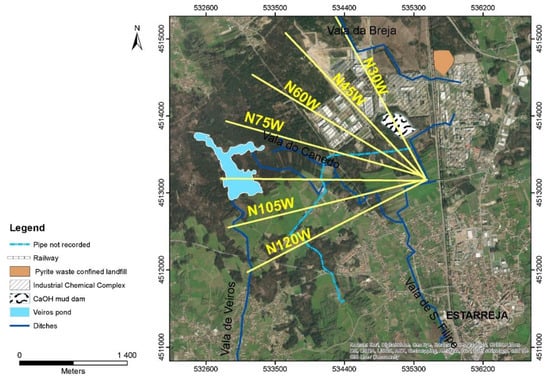
Figure 5.
Transects used to sample the shift of the conductivity contouring lines (map coordinates: UTM; WGS84—29N zone).
For two orientations, N75° W and N105° W, the spatiotemporal variations correspond to the areas depicting the highest conductivity values, as shown in Figure 6. This figure was constructed by plotting field conductivity values in accordance with the time of measurement and the distance from the beginning of the profiles near the ICCE. These two orientations were chosen to illustrate the procedure, but they also correspond to important directions of contamination propagation, which was obtained by crossing information from Figure 4 with the main local radial flow directions of groundwater presented in Figure 1.
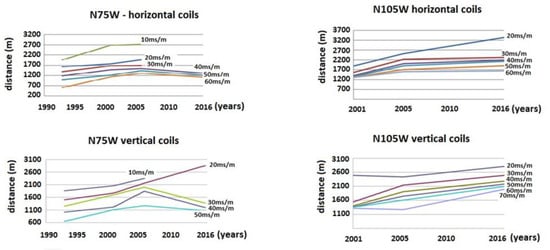
Figure 6.
Electrical conductivity variation along profiles N75° W and N105° W over time.
Data from orientation N75° W, on the left of Figure 6, showed an increase of conductivity with distance until 2006. Afterwards, VF data (Figure 6, top left) depicted a gradual decrease in conductivity values and, hence, an expected decrease in contamination as a result of the implemented remediation works. For HF (Figure 6, bottom left), or shallower information, a similar behaviour was observed, in particular for the higher conductive curves. Hence, it seemed that the contamination also decreased at shallower depths, but there were still some signs of progression at lower levels of conductivity. This could be explained by surface runoff or very shallow contamination from an origin other than industrial sources. Therefore, for this orientation, the 2003–2005 remediation works appear to have been effective.
On the right of Figure 6, data from orientation N105° W are depicted. In this case, for both horizontal and vertical fields, contamination is shown to progress as distance increases in both graphs. However, there is a distinct change in the dip of the lines. This dip is gentler after 2006, revealing a lower propagation velocity of contamination, both for shallower and deeper areas. Therefore, remediation works also showed some degree of efficiency, although lower than that observed for N75° W.
Data from all the orientations in Figure 5 are summarized in Table 1. Data analysis showed similar behaviour for both shallower and deeper investigations, suggesting there is a hydraulic connection between the upper unconfined aquifer and the deeper semi-confined aquifer. This can be explained by discontinuous mud layers or their disturbing by human intervention, such as through the opening of wells or boreholes.

Table 1.
Calculated dislocation of the conductivity (σ) contouring lines for vertical fields (VF) and horizontal (HF).
For particular directions, there was a difference before and after 2006, although the behaviour varies with orientation.
Thus, until 2001, there was a general decrease in curve displacements velocity in the direction N60° W, whereas for direction N75° W there was a general increase in contamination spread for both horizontal and vertical coils. Profile N120° W depicts residual displacements. Therefore, for this period, it seemed contamination receded to the northwest, but increased to the west of the mud dam. Geophysical data available for this period does not allow for any further discussion.
For 2001–2006, geophysical data provided a better scenario as measurements covered the area comprehensively. For this period, contamination spread was shown to recede for directions N30° W, N45° W, and N60° W, that is, the northern part of the area. This is particularly evident for the higher conductivity curves. Thus, if high conductivity values are attributed to contamination, it is likely that contamination receded during this period in this region. On the other hand, directions N75° W, N105° W, and N120° W showed a general increase in contamination spreading, thus the highest velocities were estimated and, furthermore, spreading affected all the conductivity curves in this region. In particular, values for horizontal coils, or data containing information from the deeper aquifer, depicted the highest calculated dislocations of conductivity curves.
From 2006 onwards, there was an increase in directions N30˚W, N45˚W, and N60˚W, possibly in association with the Vala da Breja ditch, which is in the northern part of the region. For all the other directions, for example to the west and southwest, spreading either receded or the calculated velocity decreased significantly, possibly because of the remediation works carried out in the 2003–2005 period.
4.2. Hydrochemical Surveys and Water Quality
The most relevant physicochemical parameter indicators of the main inorganic contamination processes, caused by ICCE in the groundwater from the topmost layers of the Aveiro Quaternary aquifer system (i.e., the unconfined aquifer), are shown in Table 2. As observed, mean and median values for the analysed parameters were considerable higher in the 2007 sampling campaign than in the others. The exception was pH, which exhibited a slight decrease in the 2007 campaign. It should be noted that the 2007 campaign also showed the highest data variation for several parameters such as pH (4.4–10.1), electrical conductivity (EC; 50–26,800 μS cm−1), Cl (8–14,840 mg L−1), Na (6.1–10,600 mg L−1), and Fe (10–167,000 μg L−1). Sulphate was the exception, showing an increase over the study period, with a maximum value (3037 mg L−1) in the 2016 campaign (Table 2).
Table 2.
For the selected periods (1989, 2007, and 2016), summary of statistics for analytical data and groundwater samples in the study area.
In general, the first campaign (1989) showed the lowest mean electrical conductivity value (574 μS cm−1), as well as the lowest concentration of the analysed ions (Cl− 89.65 mg L−1; SO42− 82.53 mg L−1; and Na+ 56.0 mg L−1). However, for Fe the highest mean value (9922.6 μg L−1) was recorded in the 2007 campaign. For the 1989 and 2016 campaigns, the mean and median pH values were almost the same (Table 2).
As expected, the EC and concentration variations of the analysed parameters were positively correlated, while pH values were inversely correlated. In addition, the temporal evolution of these parameters was in accordance with that obtained in the geophysical surveys, which showed a substantial increase in the spread of contamination in the period of 2001–2006, and a general attenuation of electrical conductivity from then onwards. However, there were new hotspots that emerged at different sites (mainly associated with deeper aquifer measurement or vertical fields), as depicted in Figure 6 and Table 1.
Considering that groundwater EC is the parameter that best reflects contamination, a spatial distribution map of this parameter, according to the range of values and including the data from the three campaigns, is presented in Figure 7. As can be observed, the areas showing higher EC values were located SW of ICCE, which is particularly evident for 2007 and 2016, and in agreement with the geophysical data (Figure 4). In general, the contamination plume was likely to have migrated from E to the SW, away from the ICCE, along one of the main groundwater flow paths, but it also showed some attenuation effects.
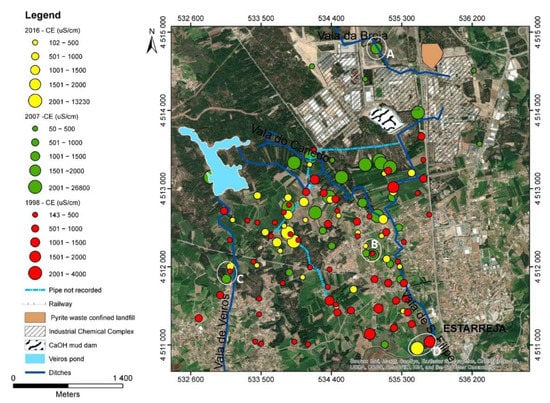
Figure 7.
Spatial distribution of electrical conductivity values in the studied area (map coordinates: UTM; WGS84—29N zone).
This suggests that contamination spreads by diffusion because of the main geological features hosting the aquifer system, namely, highly porous and permeable media. Nevertheless, significant changes in the EC values between nearby locations also occurred for measurements carried out in the 2007 and 2016 campaigns, which reinforces the combination of the local divergent radial flow (Figure 1) with local superficial contamination hotspots (Figure 7; A, B, and C sites). In addition, high EC values were also found to the south of the sampling area, particularly in 1989 and 2016, closer to the end portion of the industrial draining ditches (Figure 7, area D).
Considering the most important plume propagation path (E to SW), obtained by both geophysical (Figure 4) and hydrochemical approaches (Figure 7), a group of samples from each campaign along that path (Figure 8) were selected to illustrate the variation of hydrochemical parameters, either in terms of time or distance from the ICCE (Figure 9).
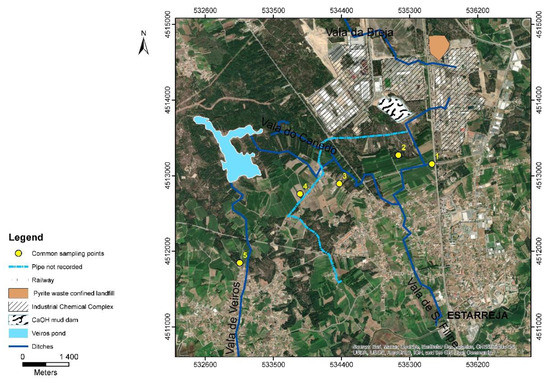
Figure 8.
Points defined by groups of samples in common for the three sampling campaigns, illustrating the transect of the main plume (E-SW) alignment (map coordinates: UTM; WGS84—29N zone).
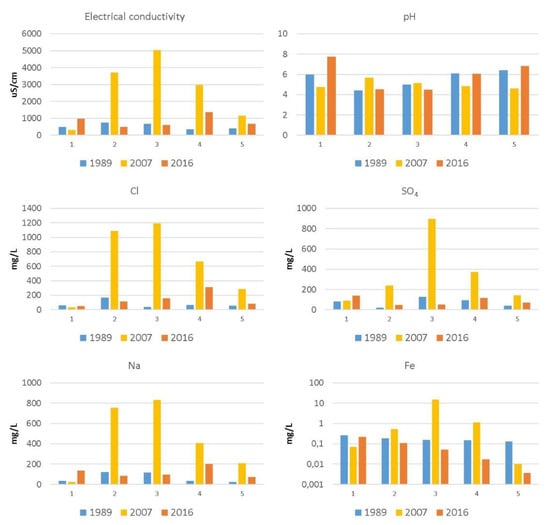
Figure 9.
For the 1989, 2007, and 2016 campaigns, variation of electric conductivity (EC), pH, Cl, Na, SO4, and Fe along the E-SW profile (displayed in Figure 8).
In Figure 9, each bar represents the element concentrations in the three different campaigns. Electrical conductivity, Cl, Na, and SO4 values showed a similar spatial trend for each sampling campaign, revealing that Cl, Na (likely related to brines), and SO4 (related to acid sulphuric production) were responsible for the EC changes. This is not evident for Fe, which had highly variable values among campaigns and locations. In 2007, Fe behaviour was similar to that found for Cl, Na, and SO4 for locations 2, 3, and 4. The pH was not a differentiating parameter for the spatial and temporal contamination evolution, which can be explained by different production processes over time that generated either acid effluents (e.g., H2SO4 production) or alkaline effluents as a result of sodium and chlorate compounds production.
The most relevant aspect evidenced by these pictures is the huge increase in EC, Cl, Na, SO4, and Fe values in 2007, in particular for points 2, 3, and 4. This is likely related to the construction of a sealed landfill in the period of 2003–2005, which served as a deposit of highly contaminated waste and soils. Operations associated with these works included mechanical relocation and remobilization of materials, likely promoting the oxidation and dissolution of contaminants hosted in those materials [25,45]. In 2016, this phenomenon was not observed and the values for these parameters were closer to those in the 1989 campaign. However, the areas corresponding to points 4 and 5 displayed higher values than those for points 2 and 3. This indicates that there was a dilution/attenuation of the contamination from 2007 to 2016, and, at same time, a migration of the plume to the SW, away from the ICCE.
5. Discussion
As demonstrated, geophysical methods provided an overall view of the area, but could not identify pollutants in groundwater or soils. On the other hand, hydrochemistry data could identify the pollutants present in the area. Before going into a more detailed discussion, it must be noted that the two methods were not used simultaneously and, hence, cannot be compared for the same fieldwork timeframe. Therefore, the discussion will be focused on temporal (multiannual) trends. It must also be noted, that, over the period under investigation, chemical plants changed production operations, while others closed down or started operations. Furthermore, analysis of contamination by organic material and by farming activities was not included because temporal data of these contaminants were not available.
Bearing in mind these points, it is clear that, according to the results obtained by both methodologies, ICCE activities have had a strong influence on the groundwater quality and have contributed to its degradation, as shown by both geophysical maps (Figure 4 and Figure 6; Table 1) and hydrochemical data (Figure 5 and Figure 9; Table 2).
Data from the pre-remediation period (before 2003–2005) showed lower levels of groundwater contamination, as revealed by smaller areas of higher conductivity in Figure 4, and some regression in contamination in some flow paths, but also a steady expansion of contamination in other paths (Table 1).
From 2001 to 2007, groundwater contamination peaked, as demonstrated by the larger high conductivity areas in Figure 4 and the increase in contamination velocity in Table 1, which was mainly due to higher concentrations of Cl, SO4, Na, and Fe (Figure 9 and Table 2). During this period, the increase in concentrations may be explained by the remobilization of highly contaminated waste and soils when the sealed landfill was constructed and then filled. After this period, data from Figure 4, Figure 5 and Figure 6 and Figure 9, as well as Table 1 and Table 2, show that contamination attenuated over time and some shifting in space occurred with groundwater flow. In addition, some hotspots showed a spatial distribution (Figure 5) linked to the old, but still operating drainage effluent systems (ditches and underground pipes) used by the ICCE.
In conclusion, geophysics delivered an overall qualitative picture of the region, while hydrochemistry allowed for the qualification of the contaminant species. Furthermore, geophysical data provided information on the contamination spread velocity and paths, as well as on the effectiveness of remediation works and the impacts caused by wastes remobilization. Both methods allowed for the division of contamination characteristics in three periods: pre-remediation, the critical period while remediation works were implemented, and the post-remediation period. Some hotspots were identified, even in the 2016 campaign, pointing to new contamination sources associated with old effluent drainage systems that must be monitored and possibly repaired to stem the migration of contaminants.
Therefore, this combined methodology proved suitable in order to provide key information to stakeholders, technicians, and authorities on the evaluation and remediation operations carried out and those yet to be implemented. Finally, even if the methods are not applied simultaneously, it is clear that the methodology proved to be effective, fast, and reliable to predetermine location sampling points, and, thus, has a general applicability that extends beyond this case study.
Author Contributions
Conceptualisation: M.S.M., C.P., and E.F.d.S.; geochemical sampling campaigns: C.P., E.F.d.S., T.M., and N.D.; geophysical campaigns: M.S.M. and T.M.; hydrochemical analysis: C.P., E.F.d.S., and N.D.; geophysical data processing: M.S.M. and T.M.; writing—original draft preparation: C.P., M.S.M., and N.D.; writing—review and editing: M.S.M., N.D., C.P., and E.F.d.S. All authors have read and agreed to the published version of the manuscript.
Funding
This research was funded by the Portuguese Foundation for Science and the Technology (FCT), UID/GEO/04035/2020, and by Labex DRIIHM/Estarreja OHMI-International Observatory Hommes-Milieux (OHMI-CNRS), through the project “Combining geochemistry, geophysics and geostatistics to assist the spatial and temporal evolution of organic contamination in the aquifers of the Estarreja region: repercussions on biodiversity, agricultural practices, human and animal dietary habits”.
Institutional Review Board Statement
Not applicable.
Informed Consent Statement
Not applicable.
Data Availability Statement
Geochemical and geophysical data presented in the paper can be found in the documents cited in the text with reference numbers [33,34,42,43].
Acknowledgments
N. Durães also thanks for his working support by national funds (OE), through FCT, in the scope of the framework contract foreseen in the numbers 4, 5 and 6 of the article 23, of the Decree-Law 57/2016, of August 29, changed by Law 57/2017, of July 19.
Conflicts of Interest
The authors declare no conflict of interest.
References
- Gillham, R.W.; Sudicky, E.A.; Cherry, J.A.; Frind, E.O. An advection diffusion concept for solute transport in heterogeneous unconsolidated geological deposits. Water Resour. Res. 1984, 20, 369–378. [Google Scholar] [CrossRef]
- Parker, B.L.; Chapman, S.W.; Guilbeault, M.A. Plume persistence caused by back diffusion from thin clay layers in a sand aquifer following TCE source-zone hydraulic isolation. J. Contam. Hydrol. 2008, 102, 86–104. [Google Scholar] [CrossRef] [PubMed]
- Pilon-Smits, E. Phytoremediation. Annu. Rev. Plant Biol. 2005, 56, 15–39. [Google Scholar] [CrossRef]
- Ibrahim, R.K.; Hayyan, M.; AlSaadi, M.A.; Hayyan, A.; Ibrahim, S. Environmental application of nanotechnology: Air, soil, and water. Environ. Sci. Pollut. Res. 2016, 23, 13754–13788. [Google Scholar] [CrossRef] [PubMed]
- Blotevogel, J.; Mayeno, A.N.; Sale, T.C.; Borch, T. Prediction of contaminant persistence in aqueous phase: A quantum chemical approach. Environ. Sci. Technol. 2011, 45, 2236–2242. [Google Scholar] [CrossRef]
- Khan, F.I.; Husain, T.; Hejazi, R. An overview and analysis of site remediation technologies. J. Environ. Manag. 2004, 71, 95–122. [Google Scholar] [CrossRef] [PubMed]
- Vogelsang, D. Environmental Geophysics, A Practical Guide; Springer: Berlin, Germany, 1995; 173p. [Google Scholar]
- Reynolds, J.M. An Introduction to Applied and Environmental Geophysics; Wiley Blackwell: Chichester, UK, 2011; 710p. [Google Scholar]
- Greenhouse, J.P.; Monier-Williams, M.E.; Ellert, N.; Slaine, D.D. Geophysical methods in groundwater contamination studies. Proc. Explor. 1989, 87, 666–677. [Google Scholar]
- BurVal Working Group. Groundwater Resources in Buried Valleys—A Challenge for Geosciences; Leibniz Institute for Applied Geosciences: Hannover, Germany, 2006; 303p. [Google Scholar]
- Barker, R.; Moore, J. The application of time-lapse electrical tomography in groundwater studies. Lead. Edge 1998, 17, 1454–1458. [Google Scholar] [CrossRef]
- Loke, M.H. Time-lapse resistivity imaging inversion. In Proceedings of the 5th EEGS-ES Meeting, Budapest, Hungary, 6–9 September 1999. [Google Scholar] [CrossRef]
- Kim, J.-H.; Yi, M.-J.; Park, S.-G.; Kim, J.G. 4-D inversion of DC resistivity monitoring data acquired over a dynamically changing earth model. J. Appl. Geophys. 2009, 68, 522–532. [Google Scholar] [CrossRef]
- Farzamian, M.; Monteiro Santos, F.A.; Khalil, M.A. Estimation of unsaturated hydraulic parameters in sandstone using electrical resistivity tomography under a water injection test. J. Appl. Geophys. 2015, 121, 71–83. [Google Scholar] [CrossRef]
- Ulusoy, I.; Dahlin, T.; Bergman, B. Time-lapse electrical resistivity tomography of a water infiltration test on Johannishus Esker, Sweden. Hydrogeol. J. 2015, 23, 551–566. [Google Scholar] [CrossRef]
- Cheng, P.-Y.; Chang, L.-C.; Hsu, S.-Y.; Tsai, J.-P.; Chen, W.-F. Estimating the hydrogeological parameters of an unconfined aquifer with the time-lapse resistivity-imaging method during pumping tests: Case studies at the Pengtsuo and Dajou sites, Taiwan. J. Appl. Geophys. 2017, 144, 134–143. [Google Scholar] [CrossRef]
- Jouen, T.; Clément, R.; Henine, H.; Chaumont, C.; Vicent, B.; Tournebize, J. Evaluation and localization of an artificial drainage network by 3D time-lapse electrical resistivity tomography. Environ. Sci. Pollut. Res. 2018, 25, 23502–23514. [Google Scholar] [CrossRef]
- Friedman, S.P. Soil properties influencing apparent electrical conductivity: A review. Comput. Electron. Agric. 2005, 46, 45–70. [Google Scholar] [CrossRef]
- Appelo, C.A.J.; Postma, D. Geochemistry, Groundwater and Pollution, 2nd ed.; CRC Press: London, UK, 2005; 683p. [Google Scholar] [CrossRef]
- Eissa, M.A.; Mahmoud, H.H.; Shouakar-Stash, O.; El-Shiekh, A.; Parker, B. Geophysical and geochemical studies to delineate seawater intrusion in Bagoush area, Northwestern coast, Egypt. J. Afr. Earth Sci. 2016, 121, 365–381. [Google Scholar] [CrossRef]
- Kotra, K.K.; Yedluri, I.; Prasad, S.; Pasupureddi, S. Integrated geophysical and geochemical assessment for the comprehensive study of the groundwater. Water Air Soil Pollut. 2016, 227, 211. [Google Scholar] [CrossRef][Green Version]
- Najib, S.; Fadili, A.; Mehdi, K.; Riss, J.; Makan, A. Contribution of hydrochemical and geoelectrical approaches to investigate salinization process and seawater intrusion in the coastal aquifers of Chaouia, Morocco. J. Contam. Hydrol. 2017, 198, 24–36. [Google Scholar] [CrossRef]
- Abbas, M.; Jardani, A.; Machour, N.; Dupont, J.-P. Geophysical and geochemical characterisation of a site impacted by hydrocarbon contamination undergoing biodegradation. Near Surf. Geophys. 2018, 16, 176–192. [Google Scholar] [CrossRef]
- Brouwer, R.; Ordens, C.M.; Pinto, R.; Condesso de Melo, M.T. Economic valuation of groundwater protection using a groundwater quality ladder based on chemical threshold levels. Ecol. Indic. 2018, 88, 292–304. [Google Scholar] [CrossRef]
- Costa, C.; Jesus-Rydin, C. Site investigation on heavy metals contaminated ground in Estarreja—Portugal. Eng. Geol. 2001, 60, 39–47. [Google Scholar] [CrossRef]
- ERASE. Estratégia de Redução dos Impactes Ambientais Associados aos Resíduos Industriais Depositados no Complexo Químico de Estarreja; Environmental Impact Study; ERASE: Aveiro, Portugal, 2000. [Google Scholar]
- ACAVACO. Geophysical Prospecting in Estarreja; Final Report; Process 1175; ACAVACO: Porto, Portugal, 1976. (In Portuguese) [Google Scholar]
- Lucas, M.F.; Caldeira, M.T.; Hall, A.; Duarte, A.C.; Lima, C. Distribution of mercury in the sediments and fishes of the Lagoon of Aveiro, Portugal. Water Sci. Technol. 1986, 18, 141–148. [Google Scholar] [CrossRef]
- Ferreira da Silva, E.A. Impacte Ambiental de Elementos Maiores e Vestigiais no Aquífero Superficial de Estarreja: Caracterização da zona Envolvente ao Complexo de Estarreja; Evidence of Scientific Aptitude and Pedagogical Proofs; University of Aveiro: Aveiro, Portugal, 1989. [Google Scholar]
- Barradas, J.M.; Cardoso Fonseca, E.; Ferreira da Silva, E.; Garcia Pereira, H. Identification and mapping of pollution indices using a multivariate statistical methodology, Estarreja, central Portugal. Appl. Geochem. 1992, 7, 563–572. [Google Scholar] [CrossRef]
- Matias, M.J.; Marques da Silva, M.A.; Carvalho, R.; Teles Roxo, G. Estudo Geofísico Preliminar dos Aquíferos Quaternários a Oeste de Estarreja; Atas da IV Conferência Nacional sobre a Qualidade do Ambiente: Lisboa, Portugal, 1994; pp. 184–198.
- Neves, C. Estudo da contaminação das águas subterrâneas e respectivos processos de atenuação natural na zona industrial de Estarreja. Ph.D. Thesis, University of Lisbon, Lisbon, Portugal, 2015. [Google Scholar]
- Ordens, C.M. Estudo da contaminação do aquífero superior na região de Estarreja. Master’s Thesis, Faculdade de Ciências e Tecnologia, University of Coimbra, Coimbra, Portugal, 2007. [Google Scholar]
- Marques, T.D.J. Estudo 4D da contaminação de aquíferos a oeste de Estarreja: Geoquímica e geofísica. Master’s Thesis, University of Aveiro, Aveiro, Portugal, 2017. [Google Scholar]
- Inácio, M.; Neves, O.; Pereira, V.; Silva, E.F. Levels of selected potential harmful elements (PHEs) in soils and vegetables used in diet of the population living in the surroundings of the Estarreja Chemical Complex (Portugal). Appl. Geochem. 2014, 44, 38–44. [Google Scholar] [CrossRef]
- Cabral Pinto, M.A.S.; Marinho-Reis, A.P.; Almeida, A.; Ordens, C.M.; Silva, M.M.V.G.; Freitas, S.; Simões, M.; Moreira, P.I.; Dinis, P.A.; Diniz, M.L.; et al. Human predisposition to cognitive impairment and its relation with environmental exposure to potentially toxic elements. Environ. Geochem. Health 2018, 40, 1767–1784. [Google Scholar] [CrossRef] [PubMed]
- Cabral Pinto, M.A.S.; Ordens, C.M.; Condesso de Melo, M.T.; Inácio, M.; Almeida, A.; Pinto, E.; Ferreira da Silva, E.A. An inter-disciplinary approach to evaluate human health risks due to long-term exposure to contaminated groundwater near a chemical complex. Expo. Health 2020, 12, 199–214. [Google Scholar] [CrossRef]
- Teixeira, C.; Zbyszewski, G. Carta Geológica de Portugal 1:50,000 & Notícia explicativa da Folha 16-A (Aveiro); Serviços Geológicos de Portugal: Lisboa, Portugal, 1976; 39p. [Google Scholar]
- Condesso de Melo, M.T.; Marques da Silva, M.A. The Aveiro Quaternary and Cretaceous Aquifers, Portugal. In Natural Groundwater Quality; Edmunds, W.M., Shand, P., Eds.; Blackwell Publishing: Chennai, India, 2008; pp. 233–262. [Google Scholar]
- Climate-Data.org. Available online: https://en.climate-data.org (accessed on 1 September 2020).
- Butler, D.K. Near-Surface Geophysics. Investigations in Geophysics; No. 13; Society of Exploration Geophysicists: Tulsa, OK, USA, 2005. [Google Scholar]
- Taunt, N. A Time-Lapse Electromagnetic Survey of a Contaminated Aquifer at Estarreja. Northern Portugal. Master’s Thesis, University of Leeds, Leeds, UK, 2001. [Google Scholar]
- Barradas, J.M. Geoquímica de Elementos Maiores e Vestigiais em Amostras de solos, Sedimentos de valas e Águas Subterrâneas. Contribuição para a Caracterização Ambiental da Zona Envolvente ao Complexo Químico de Estarreja. Ph.D. Thesis, University of Aveiro, Aveiro, Portugal, 1992. [Google Scholar]
- McNeill, J.D. Use of electromagnetic methods for groundwater studies. In Geotechnical and Environmental Geophysics; Ward, S.H., Ed.; Society of Exploration Geophysicists: Tulsa, India, 1990; Volume I, pp. 191–218. [Google Scholar] [CrossRef]
- Inácio, M.M.; Pereira, V.; Pinto, M.S. Mercury contamination in sandy soils surrounding an industrial emission source (Estarreja, Portugal). Geoderma 1998, 85, 325–339. [Google Scholar] [CrossRef]
Publisher’s Note: MDPI stays neutral with regard to jurisdictional claims in published maps and institutional affiliations. |
© 2021 by the authors. Licensee MDPI, Basel, Switzerland. This article is an open access article distributed under the terms and conditions of the Creative Commons Attribution (CC BY) license (https://creativecommons.org/licenses/by/4.0/).