


Abstract
This paper presents a fully integrated, four-stack, single-ended, single stage power amplifier (PA) for millimeter-wave (mmWave) wireless applications that was fabricated and designed using 45 nm complementary metal oxide semiconductor silicon on insulator (CMOS SOI) technology. The frequency of operation is from 20 GHz to 30 GHz, with dB of maximum gain. The maximum RF (radio frequency) output power (Pout), power-added efficiency (PAE) and output 1 dB compression point are dBm, 29% and dBm, respectively, achieved at 24 GHz. The error vector magnitude (EVM) of % was measured at an average channel power of dBm at the center of the the 3GPP/NR (third generation partnership project/new radio) FR2 band n258—i.e., 26 GHz—using a 100 MHz 16-quadrature amplitude modulation (QAM) 3GPP/NR orthogonal frequency division modulation (OFDM) signal.
1. Introduction
Worldwide digitalization has led to an explosion of mobile data traffic within the recent fourth generation (4G) and long term evolution (LTE) telecommunication generations. To ensure the enormous user experience demands for future digital systems and services are met, 5G/6G is expected to provide 1000× more capacity [1]. To achieve this enormous increase in data rates, several wideband millimeter-wave (mmWave) frequency bands between 24–53 GHz for 5G commercial wireless telecommunication have been allocated by the third generation partnership project (3GPP) new radio (NR) standard [2], and frequencies above 100 GHz for 6G are being discussed [3,4]. However, at mmWave frequencies, we must overcome not only the increasing path losses but also the decreased antenna size. In fact, it has been proposed that large phased arrays with RF beamformers are needed to provide enough antenna gain and spatial coverage [5,6,7,8]. This results in a dramatic change in the transceiver implementation and raises severe design challenges. First, the size of an antenna array at mmWave frequencies is comparable to the wavelength (antenna elements are spaced by ), and at 30 GHz, is ≈1 cm. This results in the requirement that the transmitter should be small and highly integrated. Second, in large phased arrays, the required output power levels for each antenna decrease as the number of antennas increases. This results in the fact that, in phased arrays, each antenna is preceded by a small or medium power amplifier (PA), which is preferably integrated in the transceiver RFIC [9,10,11,12,13,14,15,16]. Third, due to the high modulation schemes and high PAPR (peak to average power), wideband up to 400 MHz 256-QAM based OFDM signals are proposed, and the specified linearity requirements are very strict, as can be seen in Table 1. As a result, the phase linearity of the transmitter needs to be small. On the other hand, the wider FR2 bands’ adjacent channel power ratio (ACPR) requirements shown in Table 2 are more relaxed and allow more spectral distortion [17]. To achieve linearity, the PA is usually backed off at around 10 dB from its peak power. As efficiency is proportional to the output amplitude, the PA operates inefficiently most of the time. In traditional macro base stations (BS), this is solved by massive digital predistortion (DPD), which linearizes a single and large efficiency-enhanced PA (conventional BS power consumption is highly dominated by the PA). With the introduction of mmWave phased arrays, the number of PAs is so large that linearizing each of them separately is simply not cost-effective; instead, either analog or averaged effects are needed [18].
Table 1.
EVM requirements for 3GPP NR carrier [17].
Table 2.
ACPR requirements for 3GPP NR carrier [17].
This paper describes a highly linear and compact four-stack PA compatible for 3GPP/NR FR2 bands n258 and n257 that is implemented using GLOBAL FOUNDRIES 45 CMOS SOI technology. The achievable output power is limited by the nominal VDD, which is 1 in 45 CMOS SOI. Fortunately, transistor stacking is possible in the SOI technology, which allows higher operating voltages to be used and thus higher output power. In addition, with compact input and output matching and a distributed transistor core, the total size and thus parasitics of the PA are minimized, providing higher gain.
This paper is an extended version of [19]. The structure and the design flow of the proposed stacked PA is presented in detail with an illustration of the actual layout in Section 2. Section 3 shows the measurement setup in detail. Measured results with simulations are shown and compared against the state-of-the-art in Section 4. Conclusions are presented in Section 5.
2. Stacked Power Amplifiers
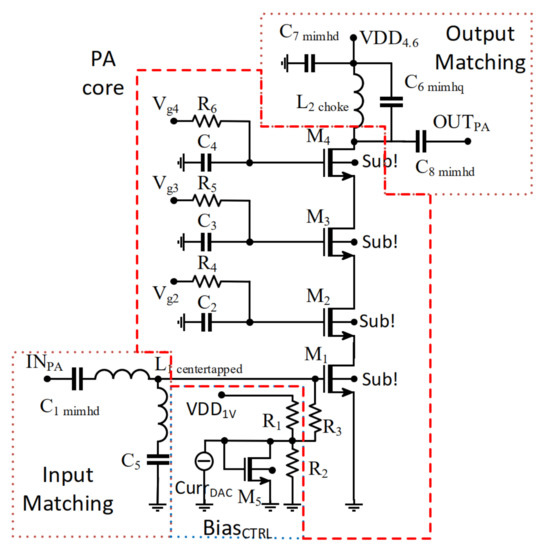
In CMOS SOI technology, the transistor body is not tied to a substrate but instead can be connected to a preferred node or left floating. The proposed stacking PA structure utilizes this feature. The devices are stacked; i.e., they are electrically floating on top of each other [20]. This enables a higher VDD and thus higher output power as the devices in the stack do not exceed the breakdown voltages if bias points are selected correctly. The schematic of the design is shown in Figure 1. The design is constructed by stacking four devices; in this case, by stacking 40 nm floating body devices. Based on the design manual, VDD can be increased from a nominal 1 up to and still maintain its reliability. Thus, by stacking four transistors, we can increase the VDD up to taking into account the inductor and routing losses. As a result, the maximum output power that can be transferred to a 50 load is above 20 dBm or > V peak-to-peak signal.
Figure 1.
Schematic of the stacked PA.
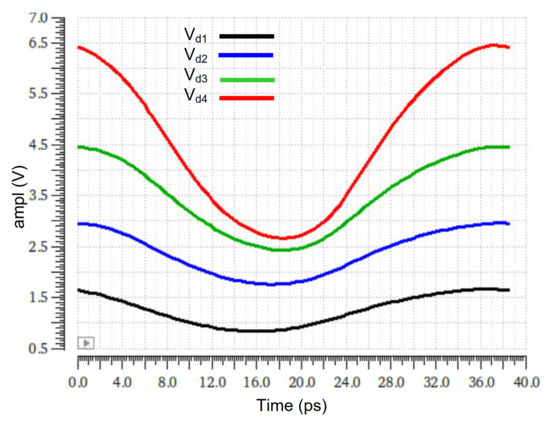
The gates of the transistors in the stacked PA are not RF grounded, but the inter-stage matching and voltage swing of – are controlled by dimensioning the gate capacitors – correctly. In order to avoid breakdown, the transistors source node waveforms are kept synchronous and progressively increased. Note also that each stage in the stack increases the delay and parasitics (which is a problem especially at mmWave frequencies), and thus it is impractical to increase the number of stacked devices excessively [21]. The simulated voltage swings at the drain nodes of the proposed design with an input power of 0 dBm are presented in Figure 2. It can be seen that the amplitude roughly doubles after each stage, but also a small amount of delay can be observed after each stage. In fact, with the gate capacitors, we also minimize the delay and provide a linear increase in the voltage swing in the stack. In addition, a direct match to a 50 load is enabled by optimizing the device size and gate capacitors. As a result, an additional output impedance matching network is not needed, which simplifies the design and minimizes the parasitics, losses and area.
Figure 2.
Simulated voltage swings at the drain nodes of .
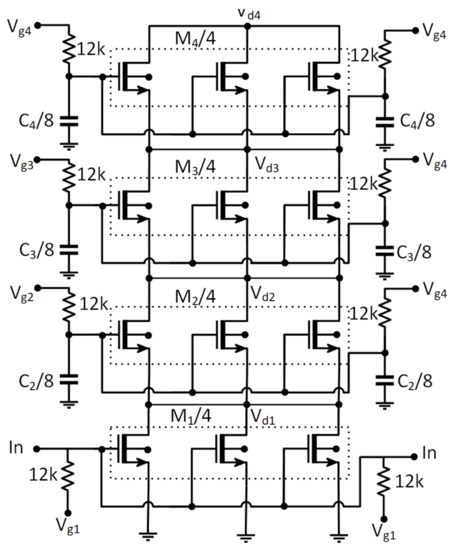
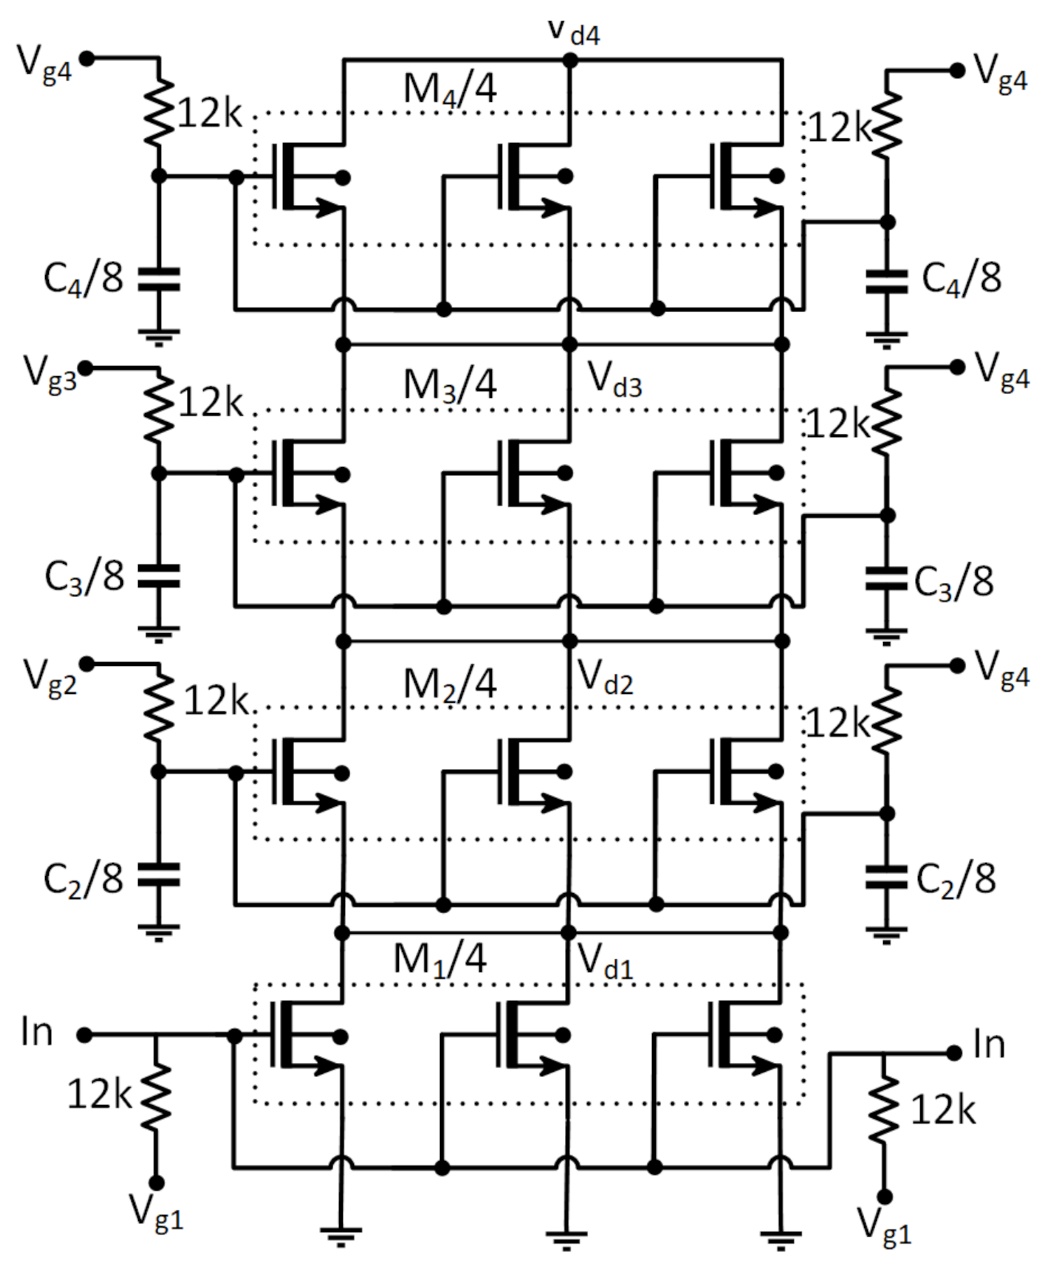
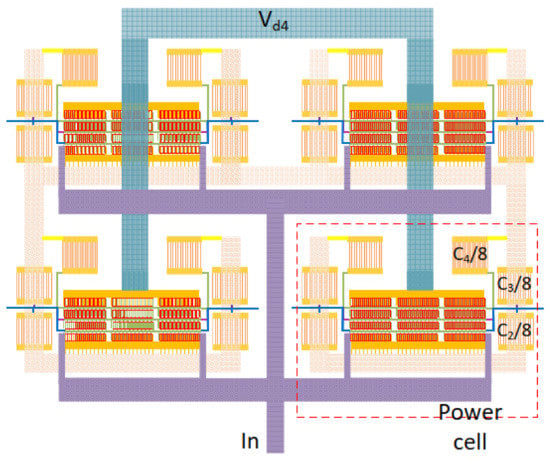
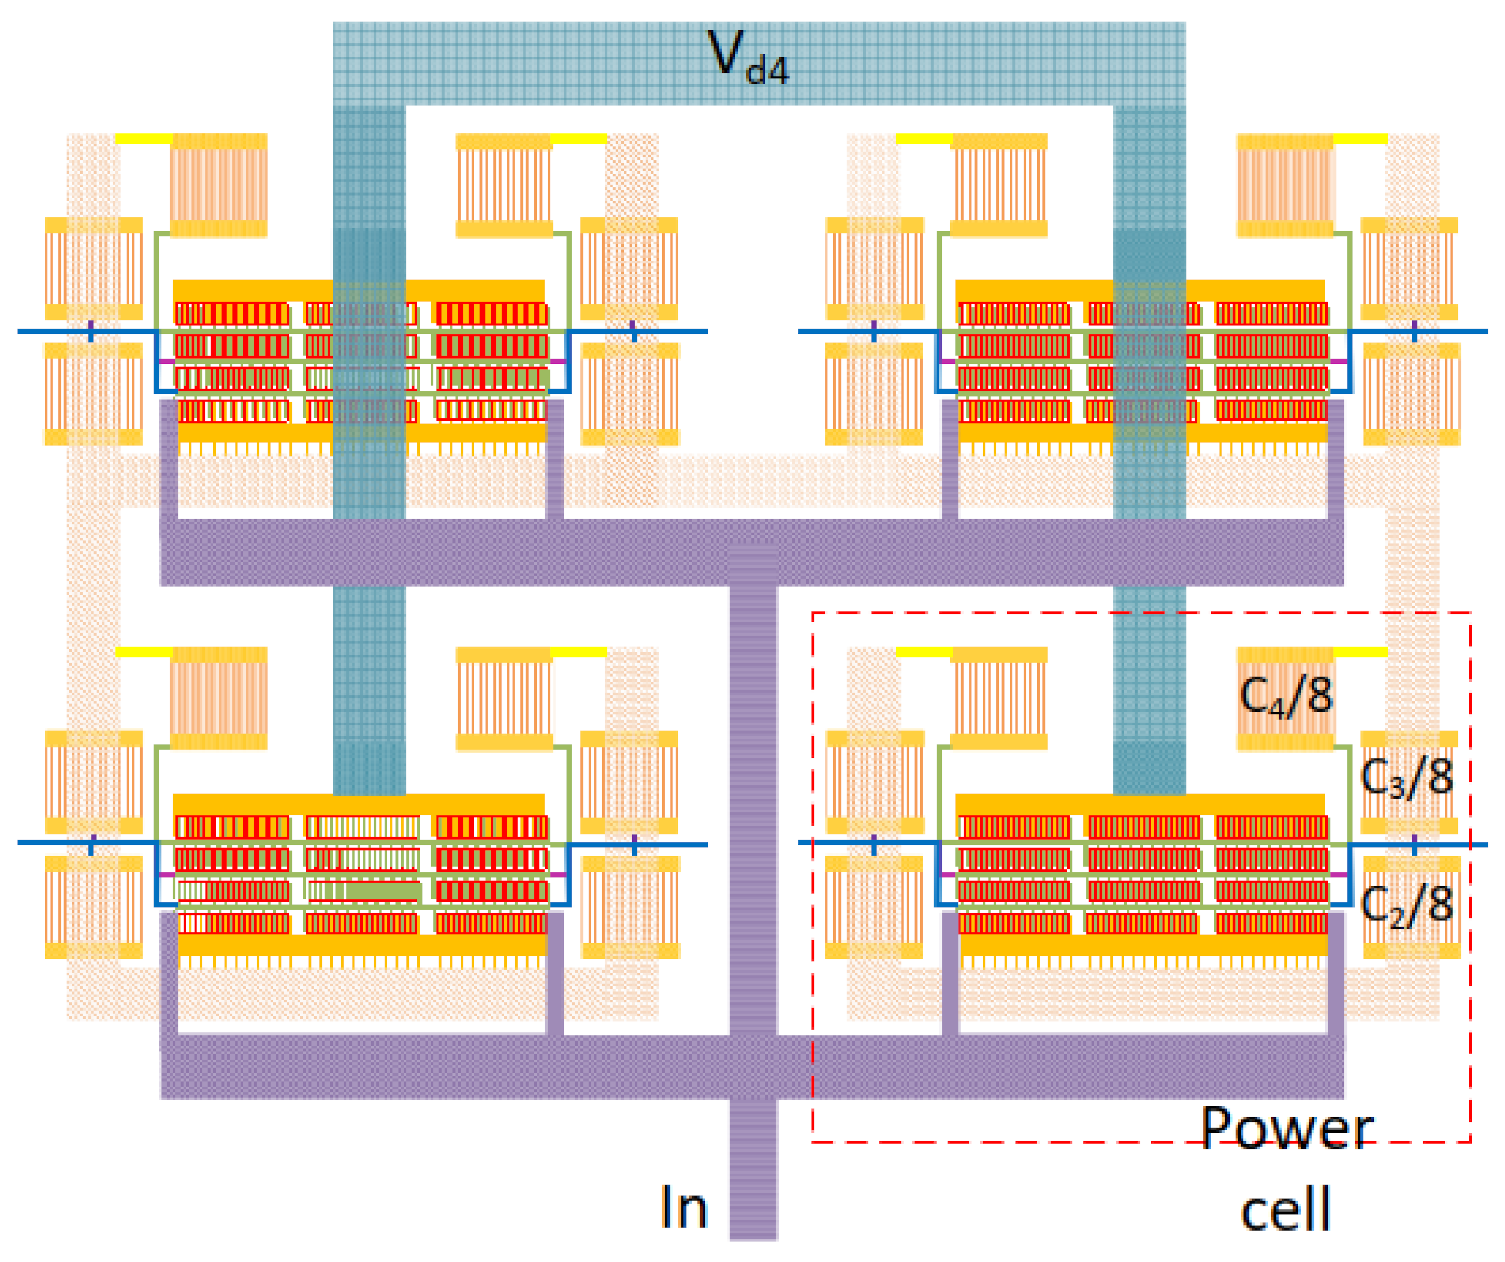
The PA core (highlighted with red dashed line in Figure 1) consists of four current combined power cells. The schematic of one power cell is shown in Figure 3. Each stage consists of three parallel devices. The total width of each device is 21 with a minimum length to maximize the speed. Thus, the total width of – (three devices in one cell and four cells in parallel) is 258 each. The transistor size is optimized in terms of power, linearity and efficiency. The layout of the PA core is illustrated in Figure 4. Power cells are connected symmetrically, the input is connected from both sides of the power cells to minimize the gate resistance, and the drain nodes of are combined as currents instead of power and thus connected directly to the output. As can be seen in Figure 3 and Figure 4, each gate capacitor is distributed in eight small metal oxide metal (MOM) capacitors. This is due to the fact that small capacitors (in a range of 6 × 6 um2) can be placed close to the transistor cells with fewer parasitics. The total value of the gate capacitors decreases higher in the stack. = 330 fF is the largest capacitor, while = 208 fF is the smallest capacitor.
Figure 3.
Schematic of one power cell of the stacked PA.
Figure 4.
Layout of the PA core of the four-stack PA.
Output matching (see Figure 1) consists of a parallel DC feed inductor and high Q (HQ) metal-insulator-metal (MIM) capacitor . These (along with stack transistor sizing and gate capacitors) are optimized to the and to provide good gain. The operation point of the PA is selected in moderate class AB by using external analog controls for , and . is biased using a digitally controlled, variable current (current DAC) source followed by a diode-connected transistor. The gate bias of can be tuned with 3 bit control from 100 mV up to 700 mV. = 450 mV is set as a nominal gate bias value for each transistor. In order to prevent breakdown, , and are derived from V VDD in an external control board and thus turned on at the same time. An additional precaution is taken with and , which prevent breakdown by setting a 100 mV voltage at in case the VDD is turned on while the current DAC is set to 0.
The input matching is implemented using a high density (HD) metal insulator metal (MIM) capacitor and two turn , from which the signal is fed to the transistor core via the center tap of . This provides compact and high Q matching around 26 GHz. As the input impedance of is inherently capacitive, the input matching is designed so that it resonates out the capacitive load and maximizes the power transfer to the PA. Resistive parasitics of the play a significant role in the resonator’s Q factor and thus, by feeding the signal out from the center tap of the , the resistive parasitics are decreased significantly. The DC is blocked from input and output nodes by using HD MIM capacitors and of 1 pF, which are low loss capacitors at mmWave frequencies. In addition, a large 10 pF HD MIM capacitor is used in the bias feed to provide a sufficient RF ground. An ADS Momentum EM simulator is used to design the input and output matching circuit, while the PA core (see Figure 4) is verified using parasitic extraction.
3. Measurement Setup
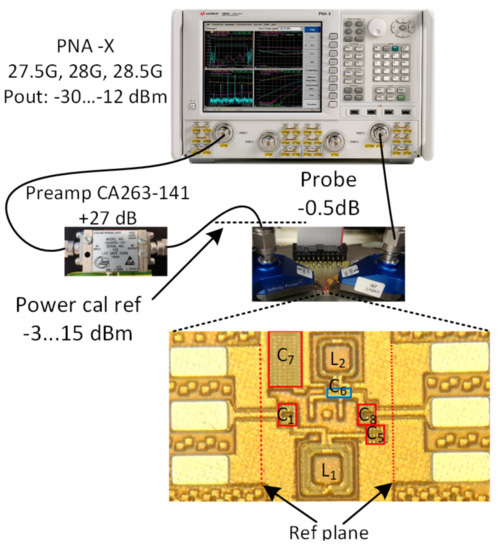
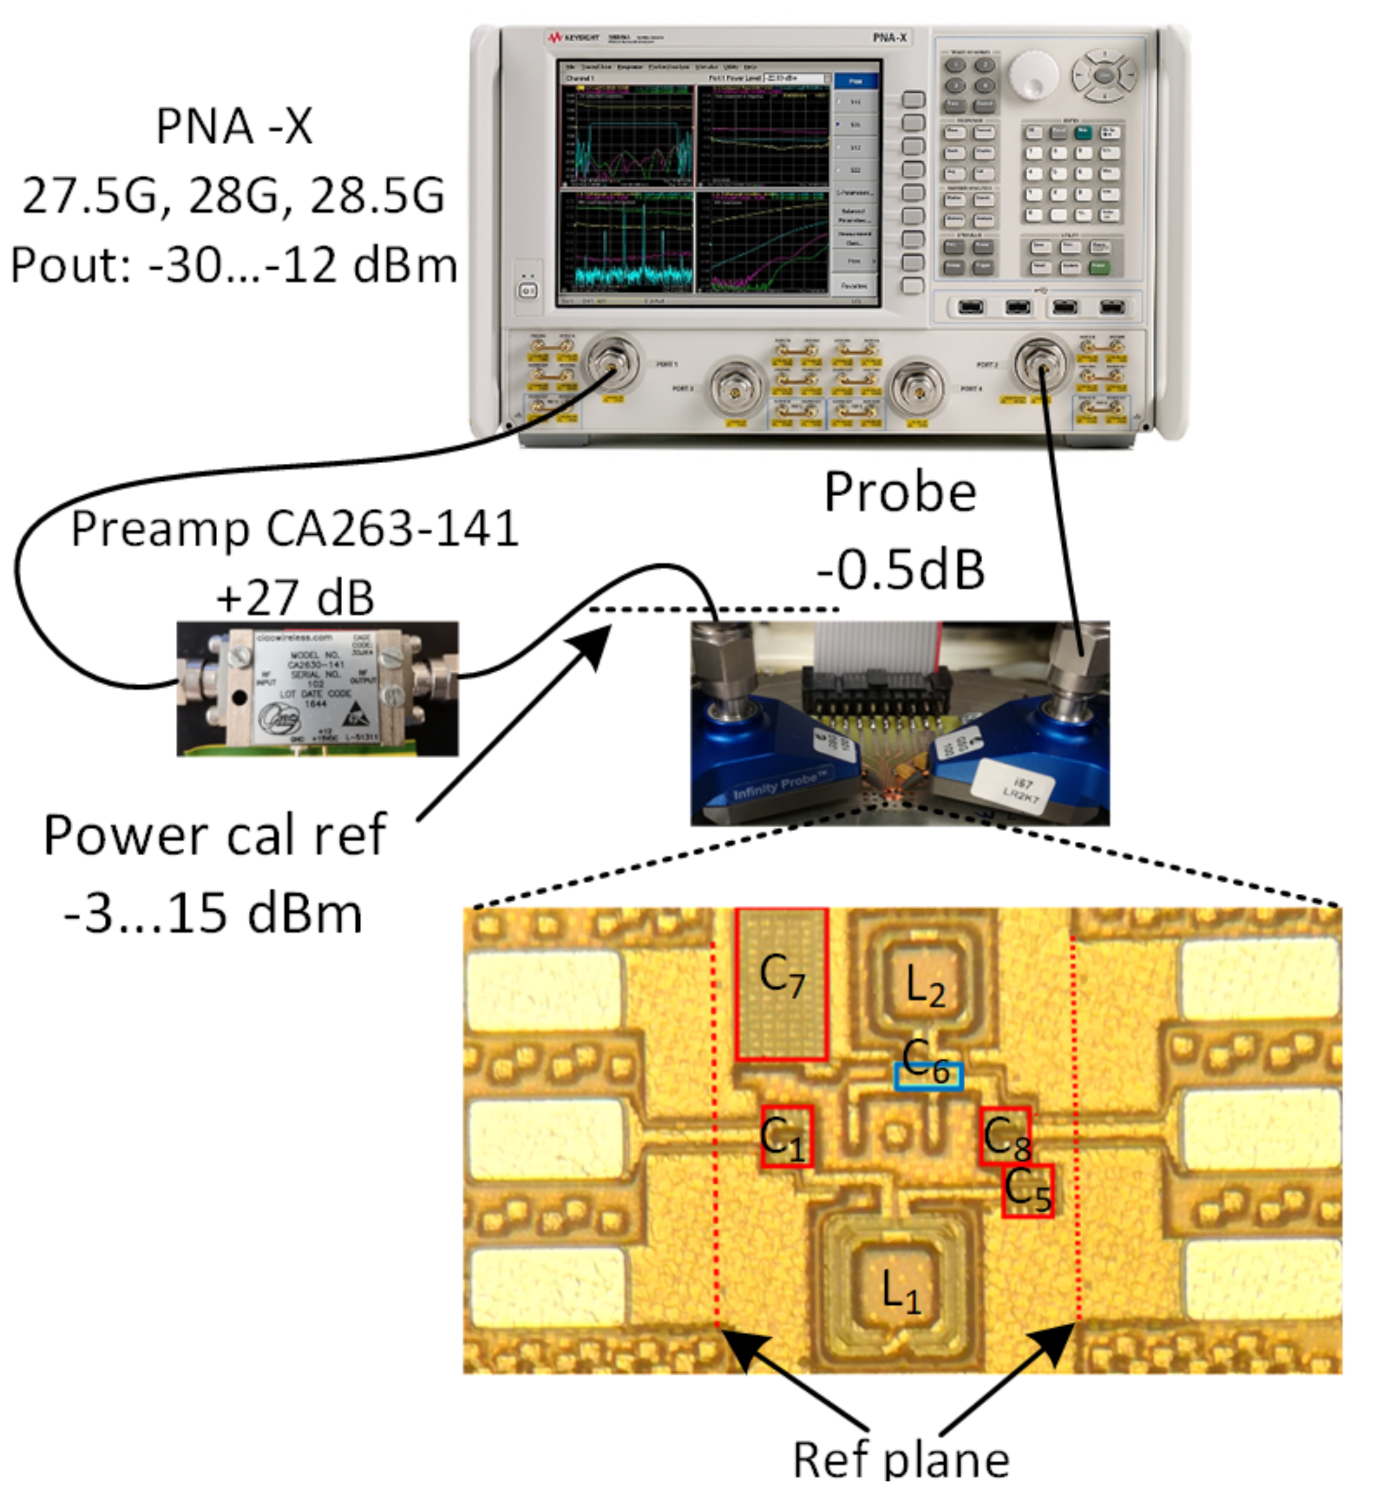
The micrograph of the fabricated integrated stacked PA is presented in Figure 5. Including the input and output pads, the dimensions of the PA is 684 × 331 = mm2. By excluding the probe pads, the active area is only 239 × 331 = mm2. In Figure 5, HD MIM capacitors are highlighted with red rectangles in the micrograph (, , and ), and the HQ MIM capacitor is shown with a blue rectangle ().
Figure 5.
Measurement setup for single-tone large signal measurements using PNA-X network analyzer and the micrograph of the stacked PA.
A Keysight PNA-X network analyzer was used to measure the proposed PA with Cascade Infinity I40 probes on a Cascade Microtech model 11,000 probe station. The measurement system is large and does not fit into an environmental chamber for temperature dependency testing, for example. In a single-tone power sweep, a measurement pre-amplifier (Caio Wireless CA263-141) was needed due to the fact that the PNA-X was not able to provide enough power to drive the PA into the compression. The power was calibrated at the end of the input cable. Then, the measurement was normalized using a Thru standard that was implemented on chip. The power calibration was repeated for every measured frequency point in single-tone power sweep measurements. The actual input and output power at the reference planes (see Figure 5) were calculated by subtracting the measured losses of the probe and the Thru.
Measurements with a modulated signal were performed using a Keysight UXA N9040A signal analyzer. A Keysight arbitrary waveform generator M5502A was used to generate a 3GPP/NR FR2 OFDM 100 MHz wide 16-QAM signal, which was mixed to mmWave frequencies with a Keysight E8267D signal generator. In order to minimize the EVM error of the test setup, we did not use a pre-amplifier, and therefore the signal generator limited the available input power.
4. Experimental Results
4.1. S-Parameter Measurements
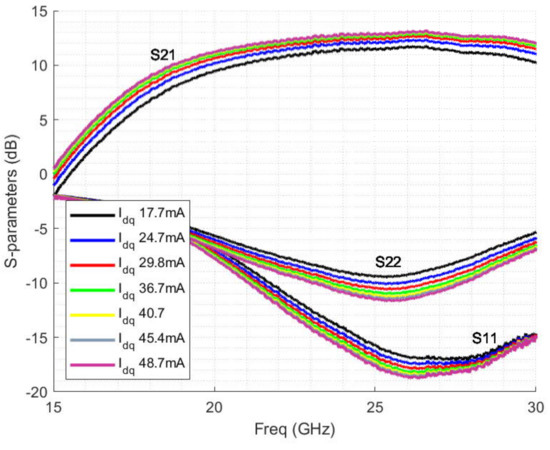
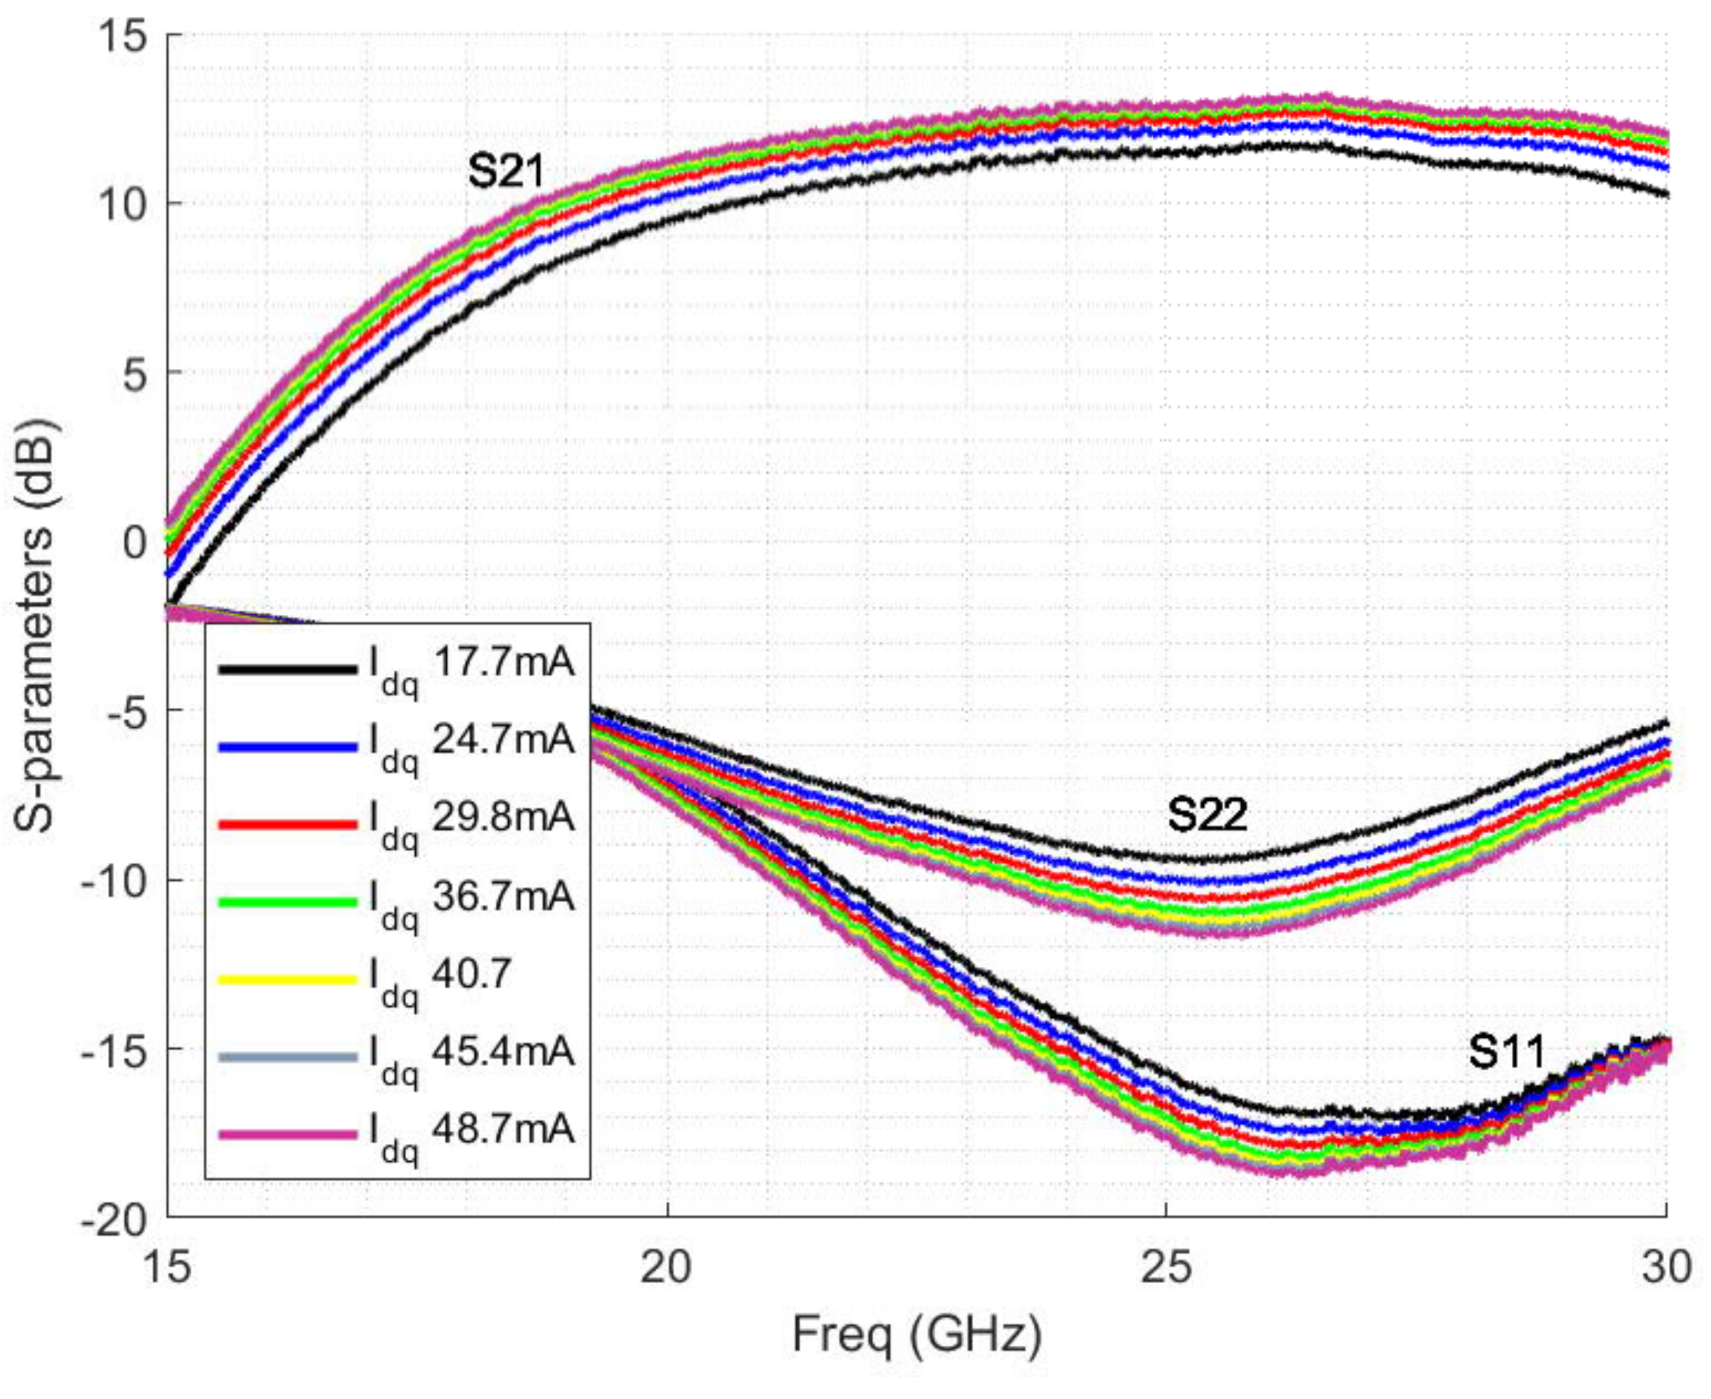
Measured S-parameters with different digitally controlled bias settings are presented in Figure 6. At the lowest gate bias setting of , the drain current was = mA (deep class AB) and the maximum was = mA (class A). Gate bias voltages for , and were kept equal. The Cascade calibration substrate P/N 101-190 was used for S-parameter calibration, which set the reference plane at the tips of the probes. It can be seen from Figure 6 that the measured maximum gain of dB occurred at 26 GHz by using the maximum bias voltage. Based on S21 curves, the frequency range of the the proposed design ranged from 20 GHz to 30 GHz, matching 3GPP/NR FR2 bands n257 and n258 [17]. It can also be seen that the frequency did not shift as a function of the bias current. The gain difference between the lowest and the highest bias current was only dB (from dB up to dB). The input matching (S11) was below 10 dB from 21 GHz to 30 GHz, and S22 was well matched at the center of the band regardless of the bias settings.
Figure 6.
Measured S-parameters of the stacked PA with different bias settings.
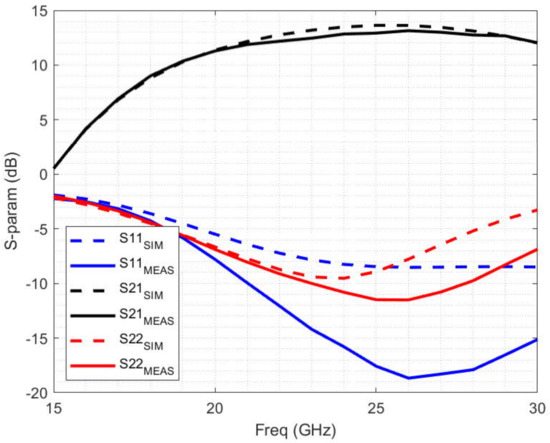
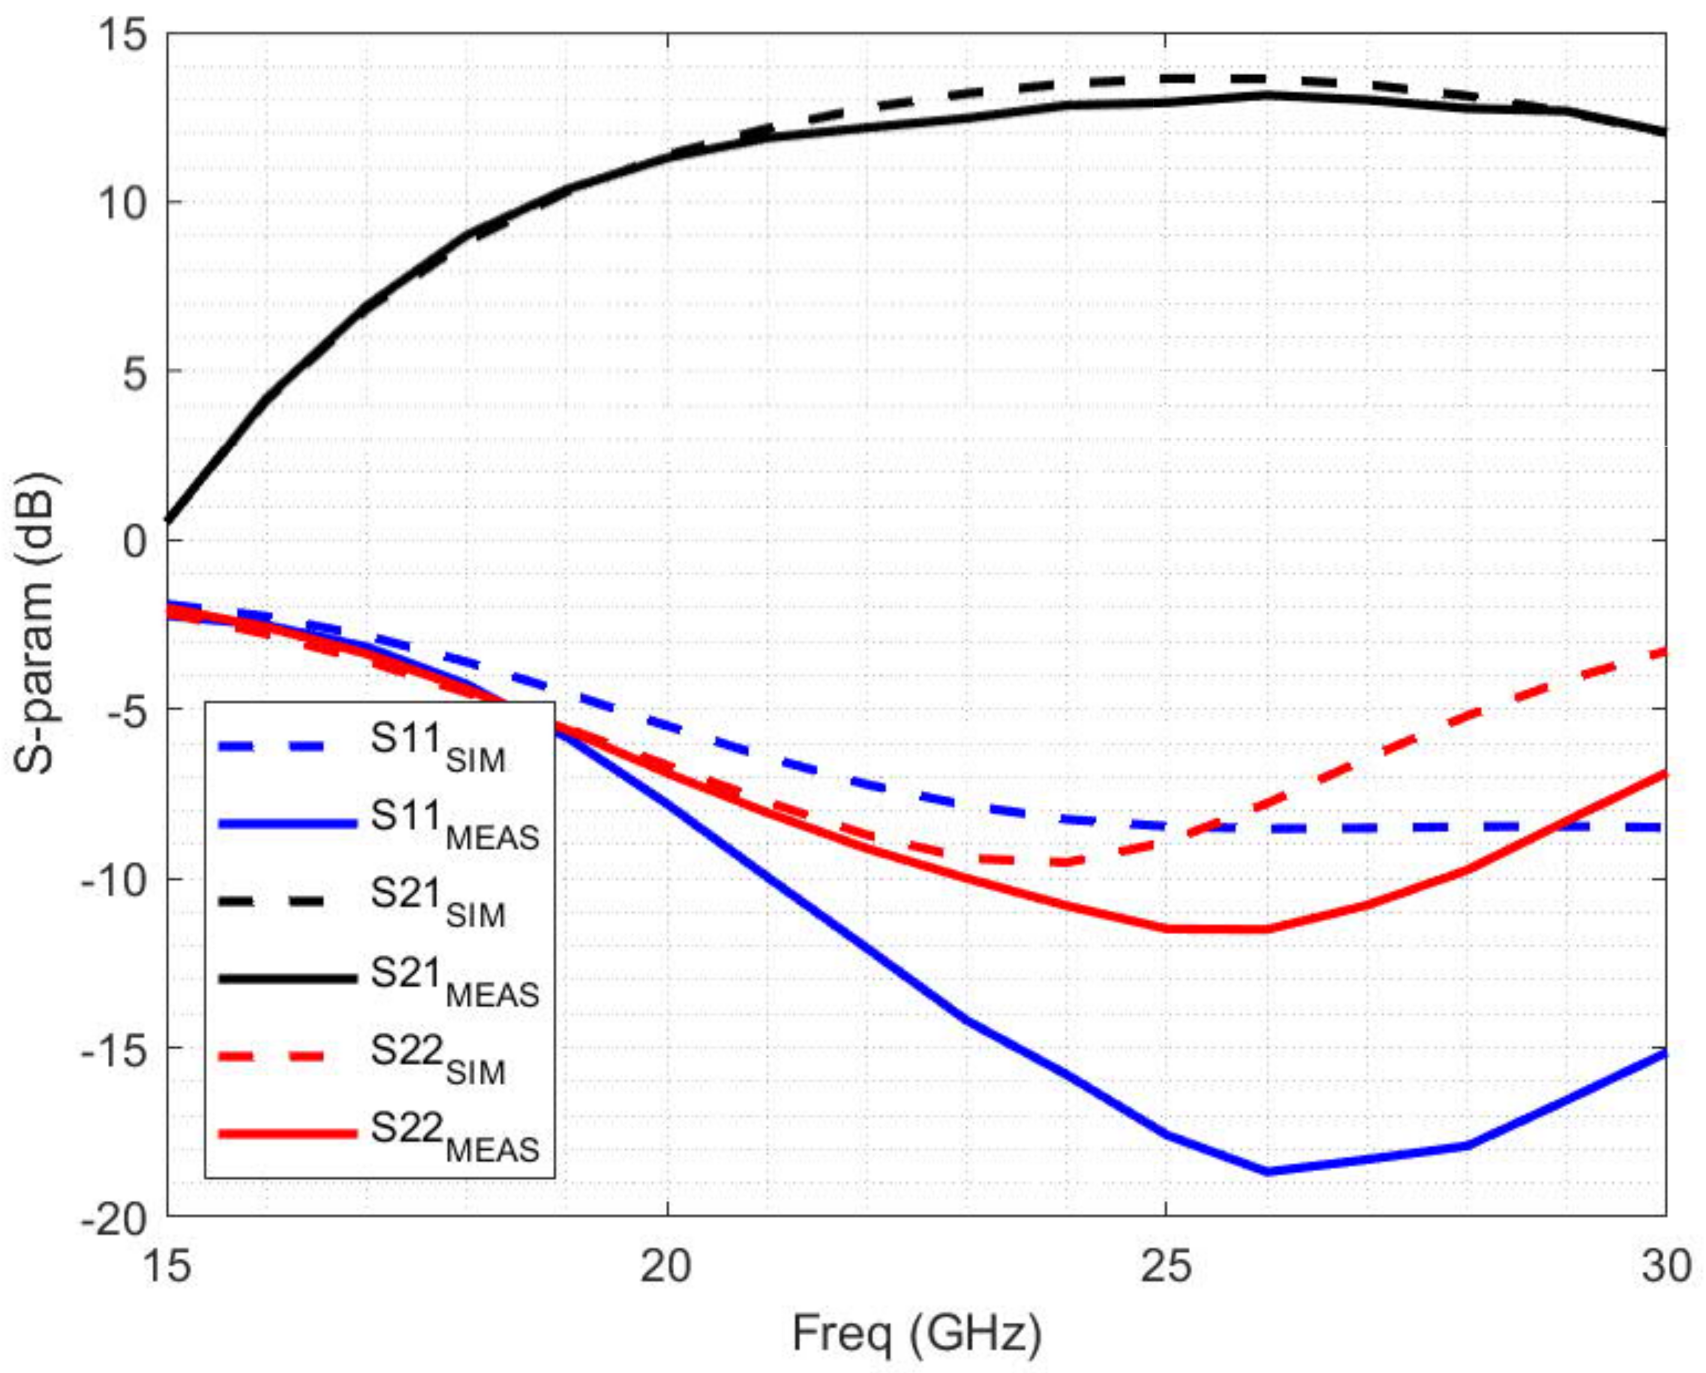
The measured and simulated S-parameters are compared in Figure 7 by using the maximum bias (i.e., = mA). It can be seen that the measured peak gain dB at 26 GHz matched the simulated gain within dB at the center of the band, representing a very good match. This was achieved by using a parasitic extracted transistor core and careful EM modeling; i.e., all the passive components and routing placed outside the PA (see Figure 3 ) were included in a single EM simulation block. The measured input and output matches at 26 GHz were dB and dB, respectively. The simulation results of S11 and S22 were not as accurate as S21, however. It can also be seen that the measured S11 and S22 curves showed better matching, which in fact was mainly due to the higher losses compared to simulations. In addition, simulations estimated lower input matching (see the blue curve in Figure 7), while the S22 simulations estimated roughly 2 GHz lower matching compared to the measured S22 curve (red curve in Figure 7).
Figure 7.
Comparison of the measured and simulated S-parameters of the stacked PA with maximum bias setting (Idq = 48.7mA).
4.2. Single-Tone Measurements
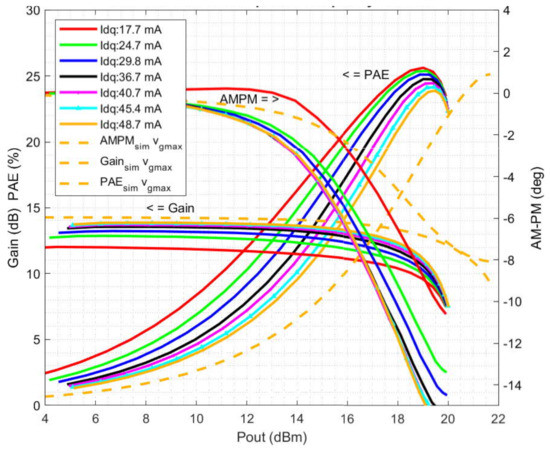
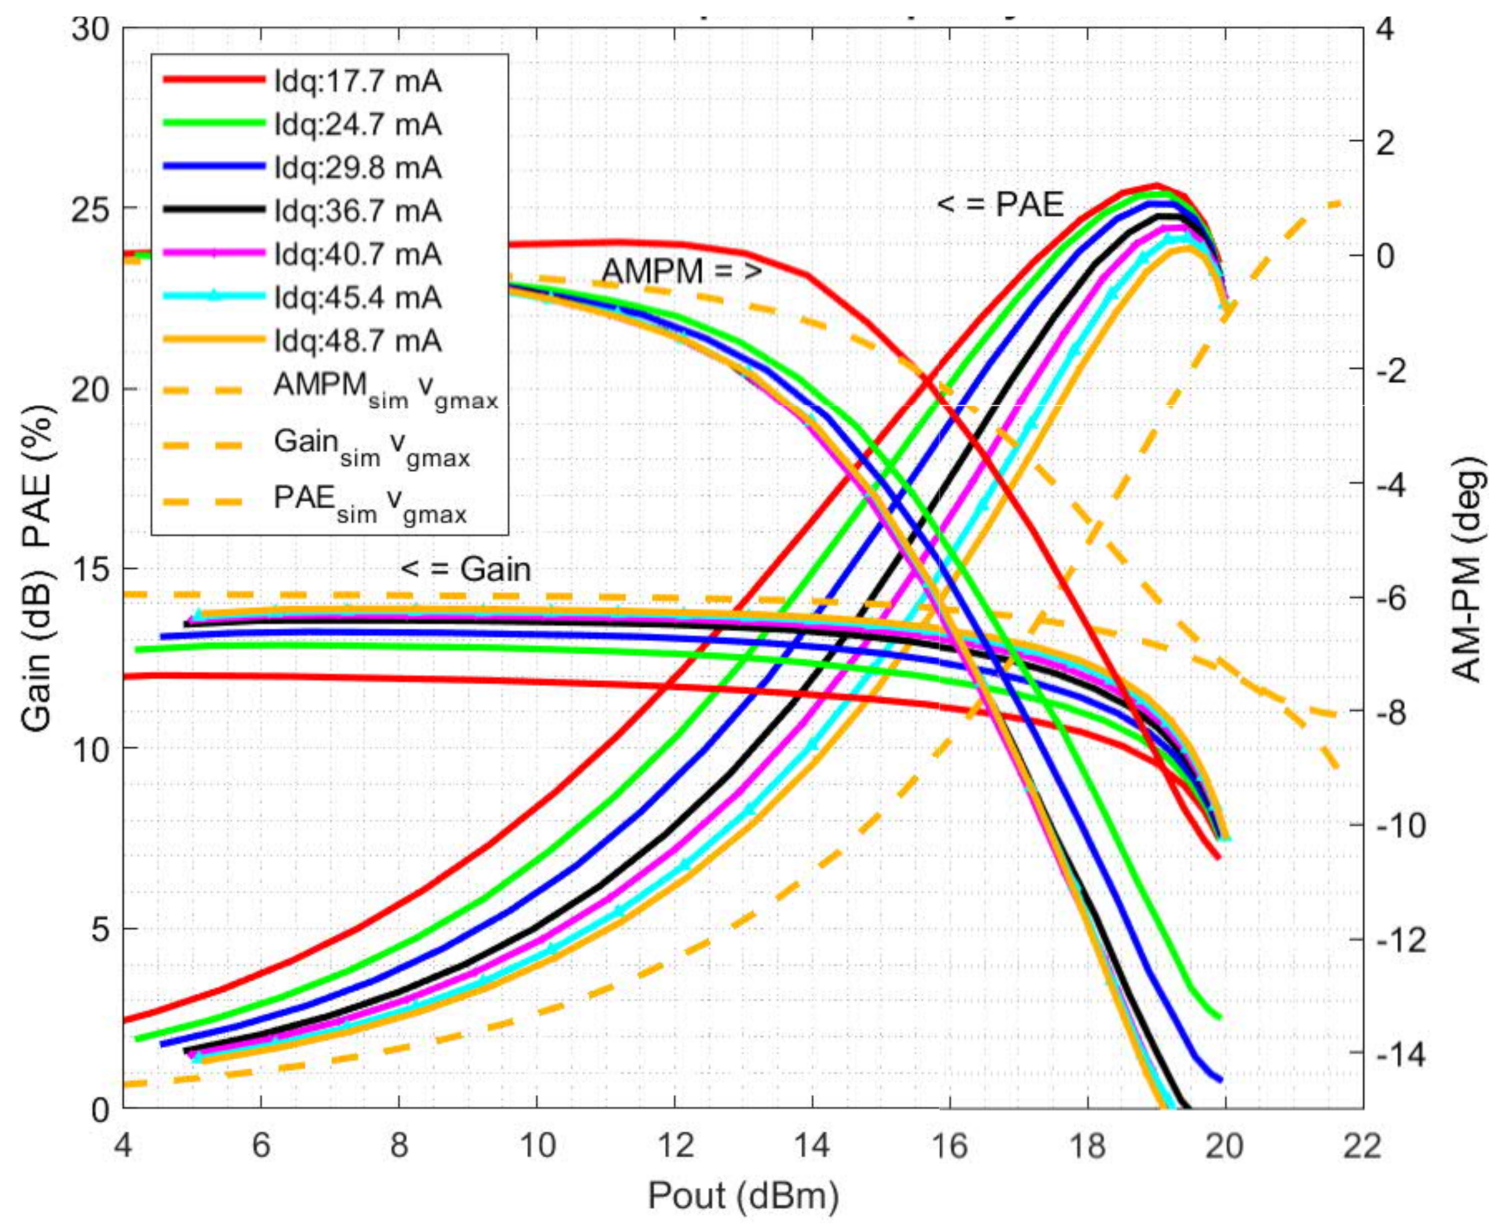
The power added efficiency (PAE), AM-PM and Gain/AM-AM as a function of output power are presented in Figure 8 at 26 GHz (the center of 3GPP/NR FR2 band n258) with varying bias settings. Note that, as explained in Section 3, the power calibration moved the reference planes to the PA input and output (see the red dotted line in Figure 5); thus, the RF pads are excluded from the results shown here. The achieved saturated output power Psat = 20 dBm at 26 GHz, which was achieved with each bias level. The peak PAE = 26% at 26 GHz, which was measured at the lowest bias voltage. The lowest gate biased the PA close to the class B operating class, and thus the higher input power level self-biased the PA. As a result, the AM-PM response with = mA decreased at a higher input drive than the other AM-PM curves (increasing self biasing seemed to linearize the PA). The total AM-PM below 16 was relatively low. The most notable difference vs. the bias level can be seen in the PAE curves, especially in the back-off region. For instance, at Pout = 14 dBm PAE varied by percent units (from % at = mA to % at = mA), while the difference in gain was less than 2 dB (see Figure 9c)) (from 12 dB at = mA to dB at = mA). This gain difference was slightly higher compared to the S-parameter measurements due to the different measurement type (power sweep) and calibration (excluding RF pads).
Figure 8.
Measured single-tone power sweep at 26 GHz with different bias and simulated results with the maximum bias.
Figure 9.
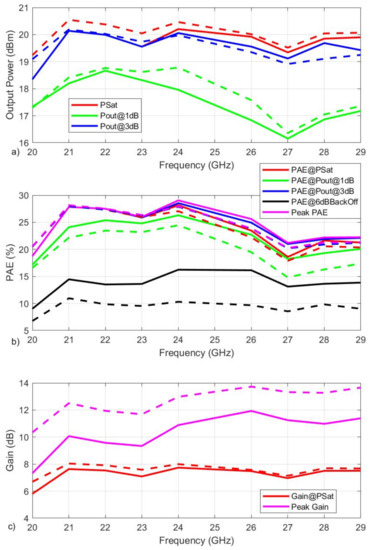
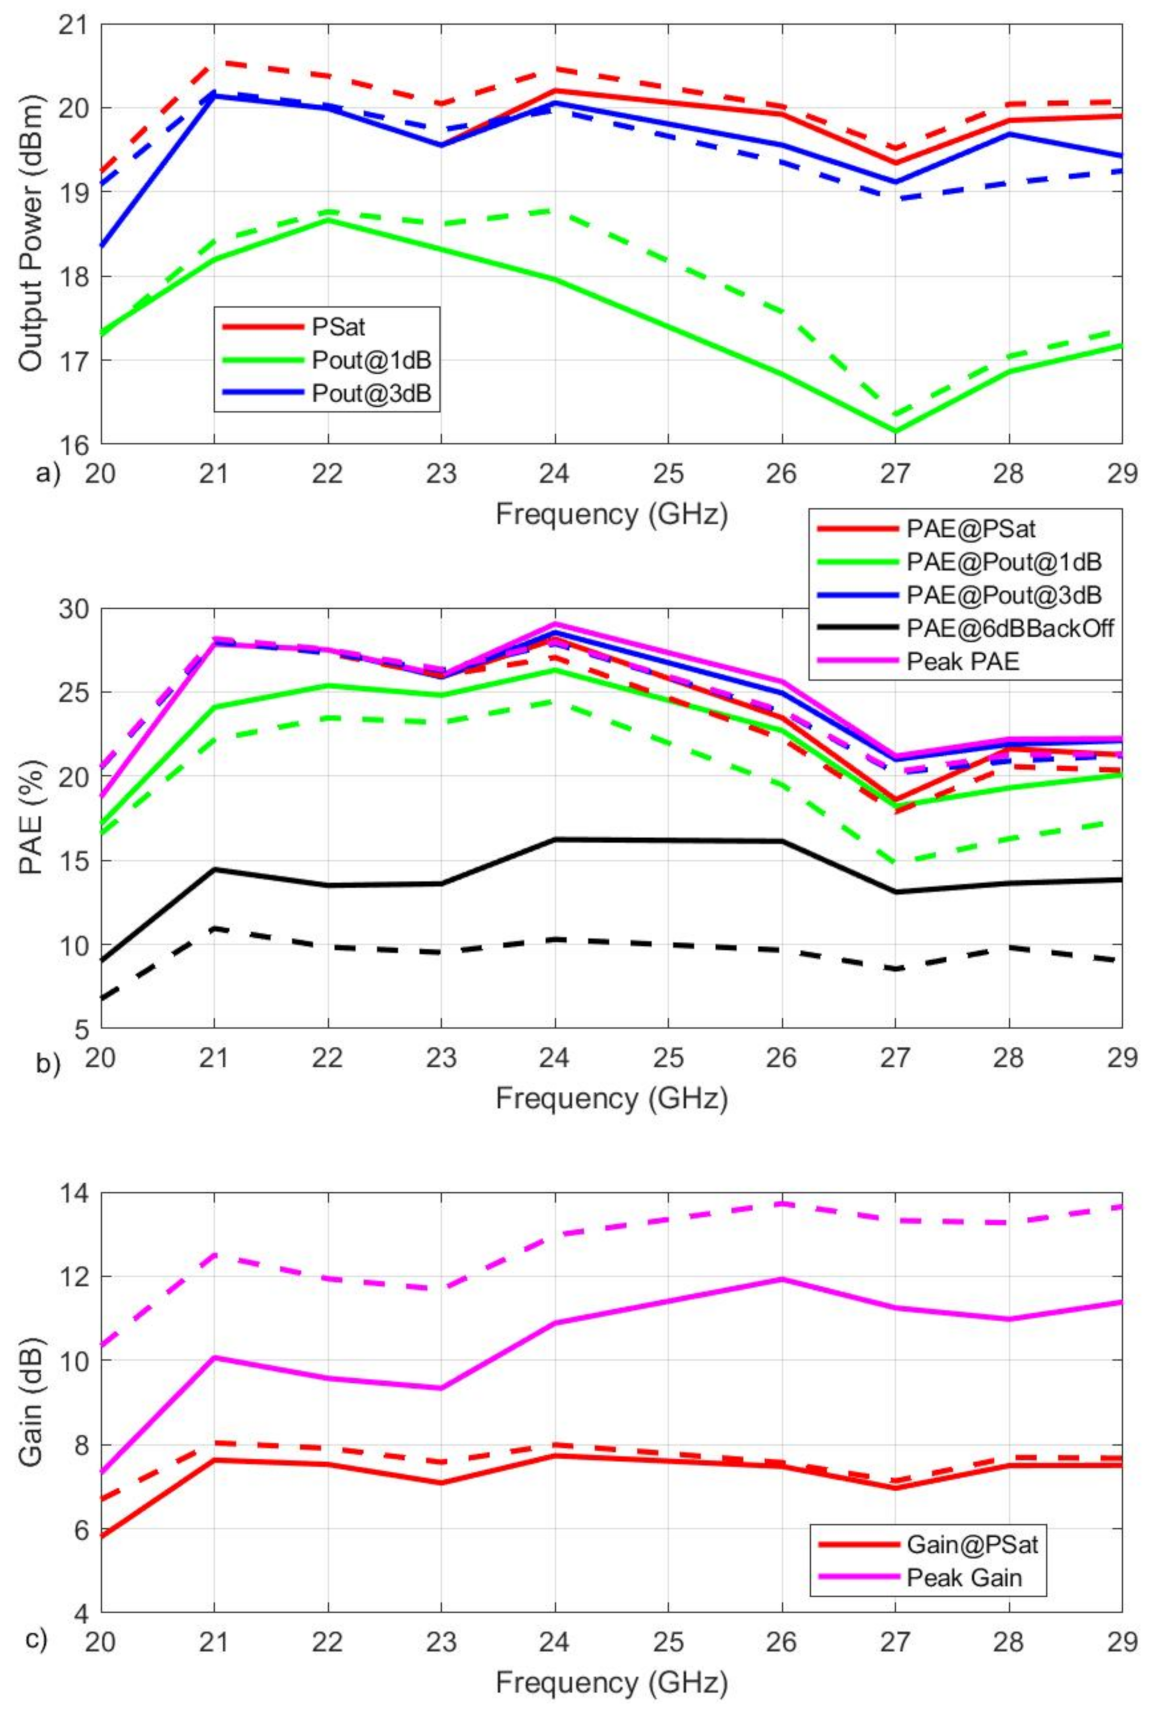
Measured figure of merits vs. frequency. (a) Pout, (b) PAE and (c) gain with = mA (solid line) and = mA (dashed line).
The simulation results are also shown in Figure 8 (dashed lines) using the maximum bias. It can be observed that the simulated gain matched quite closely with the measured large signal gain curve at lower input power levels. However, simulations predicted a higher compression point and saturated output power than the measurements. Similar to the higher 1 dB compression point, the simulations predicted less AM-PM. The main difference can be seen in the PAE curves; the simulated PAE was clearly lower in the simulations. These differences were mainly a result of the fact that the simulated PA predicted a larger current consumption with the same gate bias voltages.
The main figures of merit are presented in Figure 9 as a function of frequency. The solid lines indicate the smallest bias current ( = mA) and dashed lines show the maximum bias current ( = mA). It can be seen from Figure 9a that the highest 1 dB compression point was dBm and Psat was dBm at 24 GHz. In terms of power saturation, the difference between solid and dashed (minimum and maximum bias currents) curves was small. The PAE curves presented in Figure 9b show a similar behavior. The peak PAE was 29% at 24 GHz and the PAE decreased towards higher frequencies. The PAE difference between maximum and minimum bias currents was small at 3 dB compression and power saturation but increased in the back-off area. As mentioned above, the PAE difference between minimum and maximum bias currents was percent units at 6 dB back-off at 26 GHz. The measured gain was reasonably constant with respect to the frequency at the saturation (see Figure 9c) but showed a larger variation at lower drive. The maximum gain of dB was measured at 26 GHz using = mA bias current. It can be seen that the optimum power matching occurred at a point 2 GHz lower than the optimum gain, which was likely due to the limited modeling of the large signal simulations. However, as shown in the next section, the back-off performance with a modulated signal was better at 26 GHz due to the flatter intermodulation distortion (IMD) asymmetry
4.3. Measurements with Modulated Signal
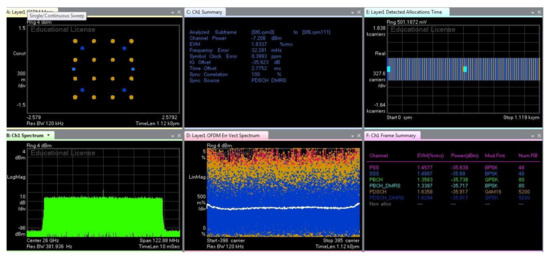
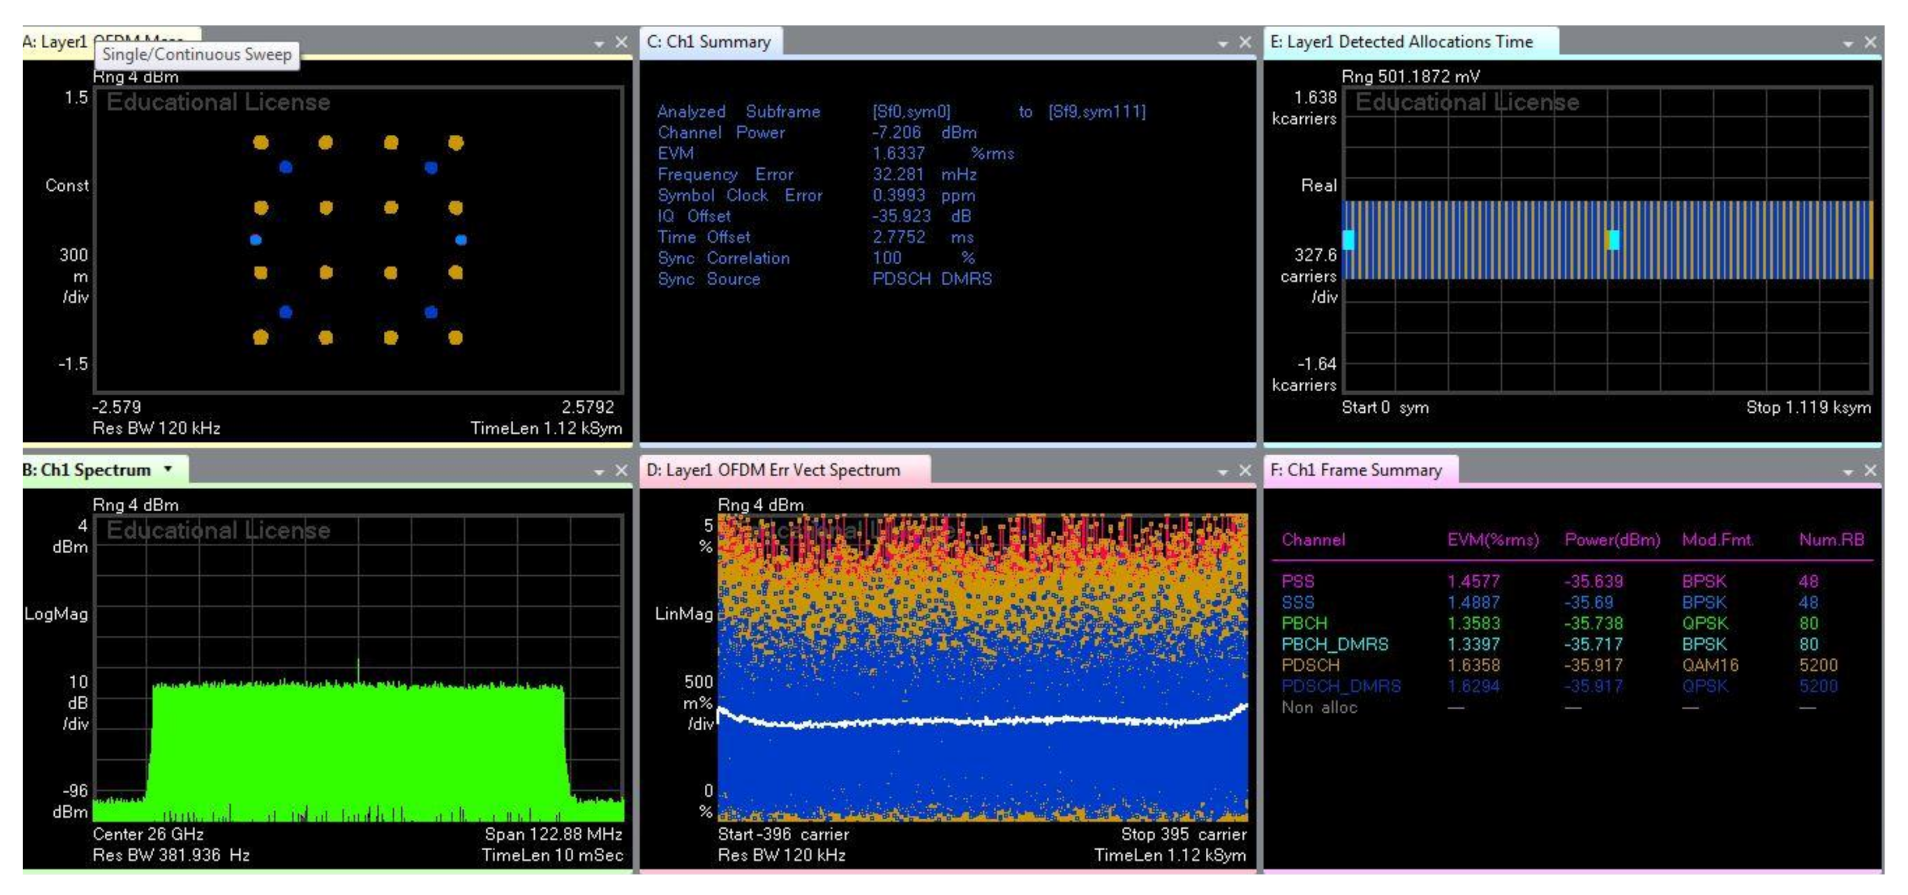
In order to verify the proposed integrated mmWave power amplifier in a real signal environment, we measured the error vector magnitude (EVM), adjacent channel leakage ratio (ACLR), average input and output channel power and PAE using a 100 MHz 16-QAM 3GPP/NR OFDM signal. A 16-QAM modulation scheme was selected so that EVM and ACPR limits would occur around the same output power range. With 64-QAM and 256-QAM, the EVM limits would have been at a lower output power compared with the more relaxed ACPR limit (see Table 1 and Table 2). The measurement setup is explained in Section 3. The reference measurement at the center of the 3GPP/NR FR2 band n258—i.e., 26 GHz—including cables, probes and the on-chip Thru standard is presented in Figure 10. The loss of the complete measurement path was dB with the reference EVM level of %. The losses of the input and output paths to the reference planes, shown in Figure 5, were dB and dB, respectively.
Figure 10.
Reference measurement of the test systems at 26 GHz using 100 MHz 16-QAM 3GPP/NR OFDM signal.
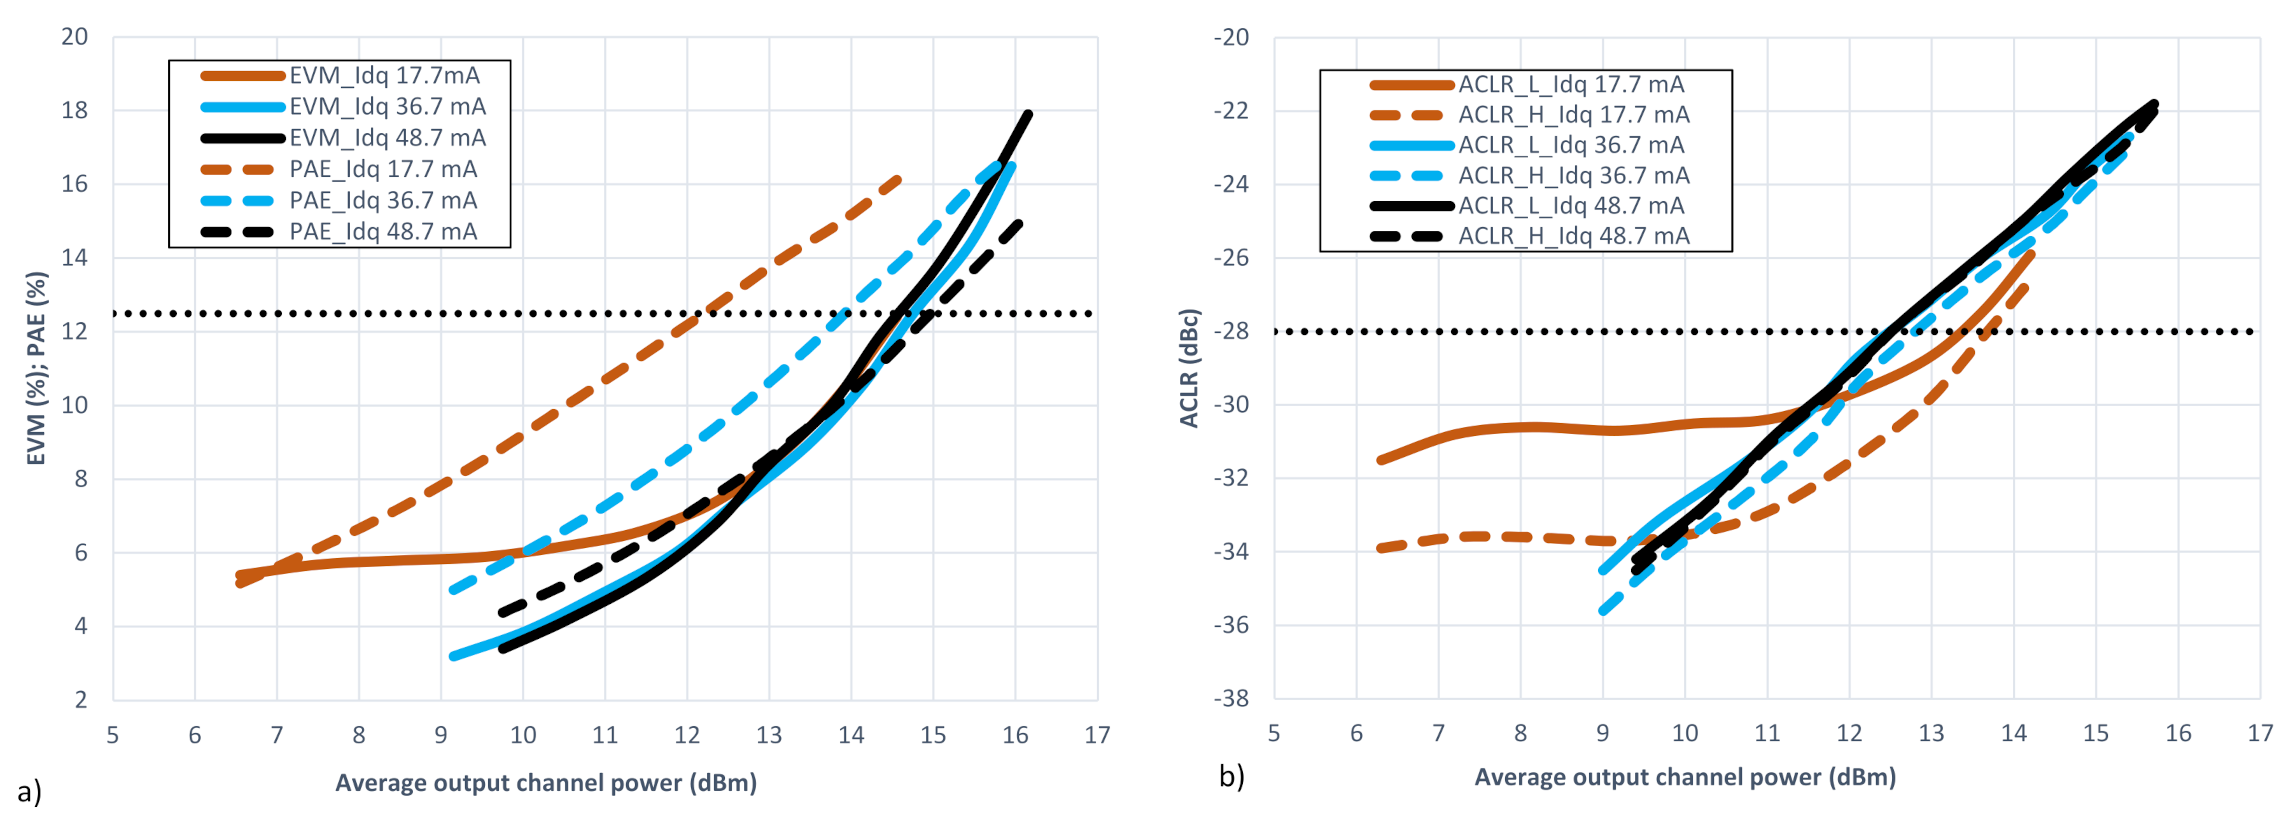
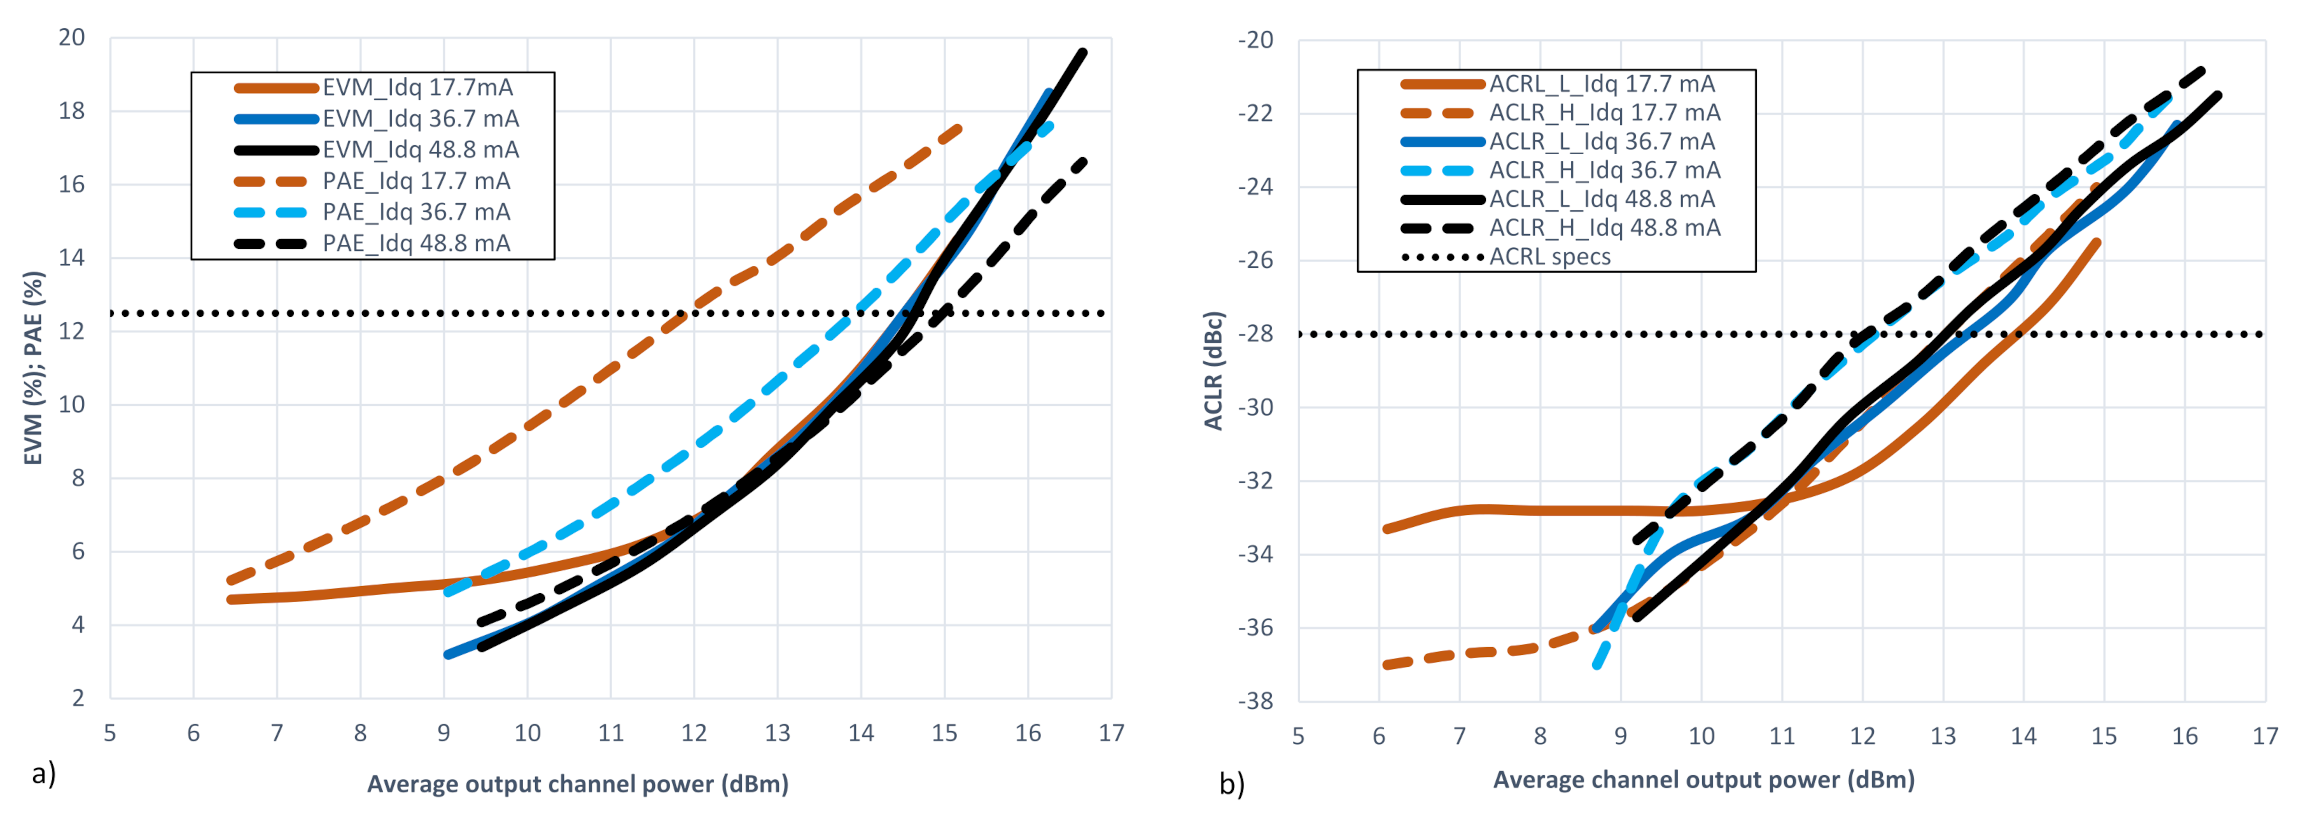
The measurement results at the center of band n258—i.e., 26 GHz—are shown in Figure 11 and at the lower edge of the band at 24 GHz in Figure 12, where single-tone measurements showed the highest PAE and output power. Results are shown with three different values: = mA (minimum bias, red curves), = mA (medium bias, blue curves) and = mA (maximum bias, black curves). The measured results are plotted in Figure 11 and Figure 12 as a function of average output channel power. PAE and EVM are plotted in the same subfigure and ACLR upper and lower in another subfigure. Figures also include the EVM and ACRL specifications (see Table 1 and Table 2), which for the used signal were % and dBc, respectively.
Figure 11.
(a) EVM, PAE and (b) ACLR as a function of average output channel power at three different bias currents at 26 GHz using 100 MHz 16-QAM 3GPP/NR2 OFDM signal.
Figure 12.
(a) EVM, PAE and (b) ACLR as a function of average output channel power at three different bias currents at 24 GHz using 100 MHz 16-QAM 3GPP/NR2 OFDM signal.
The EVM results at the center of the band n258 (Figure 11a) show that the black and blue curves were similar. On the other hand, the EVM with the minimum bias current was above 5% at lower average channel power levels but matched with others above the average output channel power of 13 dBm where the EVM = 8%. The specified EVM limit % was achieved at dBm average channel power regardless of the bias current. This was a very good result considering that the measured 1 dB compression point at 26 GHz was around dBm. The specified ACLR limit −28 dBc (see Figure 11b) was achieved with the minimum bias current (red lines) at an average channel power of dBm while the EVM = 9%. With medium and maximum bias currents, the ACLR increased linearly, overlapped and showed good symmetry. With the minimum bias current ( = mA), one can clearly see the asymmetry and higher distortion at lower drive levels. Interestingly, there seems to be a sweet spot for the IMD before a rapid increase in ACLR takes place and the ACLR levels of the higher bias are reached.
At the lower end of band n258 ( 24 GHz in Figure 12), a similar behavior can be seen in terms of EVM. However, at 24 GHz, asymmetry can be seen in each bias current. Thus, the specified dBc limit was met only up to 12 dBm of average output channel power with the higher bias setting and 13 dBm with the lowest bias setting.
The PAE results shown in Figure 11a are different from the EVM and ACLR results. For instance, at the specified EVM of %, the average output channel power was dBm, which was the same for each bias current, but with = mA PAE = 12%, which was a good result. However, with = mA bias current, the PAE was as high as 16%. In fact, the results shown in Figure 12a) are even better in. However, in both cases, the PA needed to be linearized to meet the ACLR specifications for these average channel power levels. Altogether, with the lowest bias currents, the best PAE and ACLR results were achieved with the same or better output channel power than the higher bias currents. The only notable disadvantage of using the lowest bias here is the reduced gain, as explained in Section 4.1 and Section 4.2.
4.4. Comparison of the Measured Results
The main measured figures of merit are compared against recent state-of-the-art CMOS Ka-band power amplifiers in Table 3. In order to present a complete view, we have included several single-ended and differential stacked power amplifier structures and even one differential common source structure using different modern CMOS technologies (45 nm CMOS SOI, 22 nm CMOS FDSOI and 28 nm bulk CMOS). It can be seen that the proposed PA showed very competitive results against the state-of-the-art. For example, the proposed PA showed the highest 1dB compression point. In addition, the proposed PA had the highest gain and was the smallest in size compared with other three and four-stacked 45 nm SOI PAs.
Table 3.
Comparison Table of the Recent Integrated Ka-Band Power Amplifiers.
Compared with [22], we used a lower VDD (smaller available signal swing and thus lower output power) but had a slightly better gain and smaller size with the same PAE. Note also that the proposed four-stack in [22] was inherently nonlinear. A high PAE was achieved in [10] with a lower VDD, which means that the Psat was relatively low. In addition, the size was large partly due to the PAE enhancing stack resonators. A differential 3-stack with 22 nm CMOS SOI [13] provides very good output power with a comparable PAE but smaller gain, whereas a differential 2-stack using a 22 nm CMOS SOI [23] shows a very good efficiency, gain and 1 dB compression point, but due to the low VDD, the output power is not comparable to 3 or 4-stack PAs. A differential 2-stack [24,25] implemented using a 28 nm bulk CMOS also shows very high efficiency with a comparable gain and linearity but smaller output power and larger size. Two-stack power amplifiers based on pMOS transistors using 45 nm CMOS SOI [26] also show a very high PAE and small size. However, the gain and output power are smaller when compared against the proposed four-stack PA. In addition, a pMOS two-stack at a high power mode is inherently nonlinear. Finally, the differential common source (CS) PA [27] show very good gain, which is due to the fact that the driver stage is included in the structure. The size is very small but, due to the low VDD, the achieved output power and P1dB are not very high compared to a four-stack PA.
5. Conclusions
In this paper, we have proposed a high linear and compact four-stack power amplifier implemented using 45 CMOS SOI technology. The operating bandwidth of the PA ranges from 20 GHz to 30 GHz. A maximum saturated output power of dBm along with a maximum peak power added efficiency of 29% and an output 1 dB compression point of as high as dBm was achieved at 24 GHz, and a maximum gain of dB was achieved at 26 GHz. The design is compact and the active area is mm2, which is very small. The specified ACLR limit of dBc was measured at dBm of the average channel power using a 100 MHz 16-QAM 3GPP/NR OFDM signal at 26 GHz, while the EVM and PAE were measured to be 9% and 15%, respectively. With these results, the proposed integrated mmWave four-stack power amplifier meets the specifications for 3GPP/NR FR2 band n258. The best performance overall in terms of EVM, PAE and ACLR was achieved with the lowest bias current at the center of band n258; i.e., 26 GHz. The proposed PA shows excellent linearity in terms of the high 1 dB compression point, high gain and small size when compared against the state-of-the-art approaches.
Author Contributions
Conceptualization, J.P.A. and T.R.; methodology, J.P.A.; measurements, J.P.A., A.S. software, A.S.; validation, J.P.A., A.S., M.H. and J.R.; formal analysis, J.P.A. and T.R.; writing—original draft preparation, J.P.A.; writing—review and editing, J.P.A., A.S., M.H., J.R., T.R., A.P.; visualization, J.P.A.; supervision, T.R. and A.P.; project administration, J.P.A., T.R. and A.P.; funding acquisition, J.P.A., T.R. and A.P. All authors have read and agreed to the published version of the manuscript.
Funding
This research has been financially supported Academy of Finland research projects MIMEPA (grant 323779) and 6Genesis Flagship (grant 318927).
Data Availability Statement
Reported data is not publicly available.
Acknowledgments
The authors would also like to acknowledge Global Foundries for the silicon processing and technical support.
Conflicts of Interest
The authors declare no conflict of interest.
References
- Andrews, J.G.; Buzzi, S.; Choi, W.; Hanly, S.V.; Lozano, A.; Soong, A.C.K.; Zhang, J.C. What Will 5G Be? IEEE J. Sel. Areas Commun. 2014, 32, 1065–1082. [Google Scholar] [CrossRef] [Scilit]
- 3GPP. NR; User Equipment (UE) Radio Transmission and Reception Part 2: Range 2 Standalone (Release 15). Technical Specification (TS) 38.101, 3rd Generation Partnership Project (3GPP). Version 15.2.0. 2018. Available online: https://www.3gpp.org/specifications (accessed on 13 July 2021).
- Rappaport, T.S.; Xing, Y.; Kanhere, O.; Ju, S.; Madanayake, A.; Alkhateeb, A.; Trichopoulos, G.C. Wireless Communications and Applications Above 100 GHz: Opportunities and Challenges for 6G and Beyond. IEEE Access 2019, 7, 78729–78757. [Google Scholar] [CrossRef] [Scilit]
- Pärssinen, A.; Alouini, M.; Berg, M.; Kuerner, T.; Kyosti, P.; Leinonen, M.E.; Matinmikko-Blue, M.; McCune, E.; Pfeiffer, U.; Wambacq, P. White Paper on RF Enabling 6G–Opportunities and Challenges from Technology to Spectrum; Technical Report; 6G Research Visions, No. 13; University of Oulu: Oulu, Finland, 2021. [Google Scholar]
- Han, S.; I, C.; Xu, Z.; Rowell, C. Large-scale antenna systems with hybrid analog and digital beamforming for millimeter wave 5G. IEEE Commun. Mag. 2015, 53, 186–194. [Google Scholar] [CrossRef] [Scilit]
- Roh, W.; Seol, J.; Park, J.; Lee, B.; Lee, J.; Kim, Y.; Cho, J.; Cheun, K.; Aryanfar, F. Millimeter-wave beamforming as an enabling technology for 5G cellular communications: Theoretical feasibility and prototype results. IEEE Commun. Mag. 2014, 52, 106–113. [Google Scholar] [CrossRef] [Scilit]
- Heath, R.W.; González-Prelcic, N.; Rangan, S.; Roh, W.; Sayeed, A.M. An Overview of Signal Processing Techniques for Millimeter Wave MIMO Systems. IEEE J. Sel. Top. Signal Process. 2016, 10, 436–453. [Google Scholar] [CrossRef] [Scilit]
- Tuovinen, T.; Tervo, N.; Pärssinen, A. Analyzing 5G RF System Performance and Relation to Link Budget for Directive MIMO. IEEE Trans. Antennas Propag. 2017, 65, 6636–6645. [Google Scholar] [CrossRef] [Scilit]
- Shakib, S.; Park, H.; Dunworth, J.; Aparin, V.; Entesari, K. 20.6 A 28 GHz efficient linear power amplifier for 5G phased arrays in 28nm bulk CMOS. In Proceedings of the 2016 IEEE International Solid-State Circuits Conference (ISSCC), San Francisco, CA, USA, 31 January–4 February 2016; pp. 352–353. [Google Scholar] [CrossRef] [Scilit]
- Li, C.; Wang, M.; Chi, T.; Kumar, A.; Boenke, M.; Cahoon, N.; Bandyopadhyay, A.; Joseph, A.; Wang, H. A high-efficiency 5G K/Ka-band stacked power amplifier in 45 nm CMOS SOI process supporting 9 Gb/s 64-QAM modulation with 22.4% average PAE. In Proceedings of the 2017 Texas Symposium on Wireless and Microwave Circuits and Systems (WMCS), Waco, TX, USA, 30–31 March 2017; pp. 1–4. [Google Scholar] [CrossRef] [Scilit]
- Zhang, Y.; Reynaert, P. A high-efficiency linear power amplifier for 28 GHz mobile communications in 40nm CMOS. In Proceedings of the 2017 IEEE Radio Frequency Integrated Circuits Symposium (RFIC), Honolulu, HI, USA, 4–6 June 2017; pp. 33–36. [Google Scholar] [CrossRef] [Scilit]
- Vigilante, M.; Reynaert, P. A Wideband Class-AB Power Amplifier With 29–57-GHz AM–PM Compensation in 0.9-V 28-nm Bulk CMOS. IEEE J. Solid-State Circuits 2018, 53, 1288–1301. [Google Scholar] [CrossRef] [Scilit]
- Ong, S.N.; Lehmann, S.; Chow, W.; Zhang, C.; Schippel, C.; Chan, L.H.K.; Andee, Y.; Hauschildt, M.; Tan, K.; Watts, J.; et al. A 22nm FDSOI Technology Optimized for RF/mmWave Applications. In Proceedings of the 2018 IEEE Radio Frequency Integrated Circuits Symposium (RFIC), Philadelphia, PA, USA, 10–12 June 2018; pp. 72–75. [Google Scholar] [CrossRef] [Scilit]
- Aikio, J.; Hietanen, M.; Tervo, N.; Rahkonen, T.; Pärssinen, A. Ka-Band 3-Stack Power Amplifier with 18.8 dBm Psat and 23.4% PAE Using 22nm CMOS FDSOI Technology. In Proceedings of the 2019 IEEE Topical Conference on RF/Microwave Power Amplifiers for Radio and Wireless Applications (PAWR), Orlando, FL, USA, 20–23 January 2019; pp. 1–4. [Google Scholar] [CrossRef] [Scilit]
- Manente, D.; Padovan, F.; Seebacher, D.; Bassi, M.; Bevilacqua, A. A 28-GHz Stacked Power Amplifier with 20.7-dBm Output P1dB in 28-nm Bulk CMOS. IEEE Solid-State Circuits Lett. 2020, 3, 170–173. [Google Scholar] [CrossRef] [Scilit]
- Asbeck, P.M.; Rostomyan, N.; Özen, M.; Rabet, B.; Jayamon, J.A. Power Amplifiers for mm-Wave 5G Applications: Technology Comparisons and CMOS-SOI Demonstration Circuits. IEEE Trans. Microw. Theory Tech. 2019, 67, 3099–3109. [Google Scholar] [CrossRef] [Scilit]
- 3GPP. Base Station (BS) Radio Transmission and Reception. Technical Specification (TS) 38.104, 3rd Generation Partnership Project (3GPP). 2021. Available online: https://www.3gpp.org/ftp/Specs/archive/38_series/38.104/38104-h20.zip (accessed on 13 July 2021).
- Tervo, N.; Khan, B.; Kursu, O.; Aikio, J.P.; Jokinen, M.; Leinonen, M.E.; Juntti, M.; Rahkonen, T.; Pärssinen, A. Digital Predistortion of Phased-Array Transmitter With Shared Feedback and Far-Field Calibration. IEEE Trans. Microw. Theory Tech. 2021, 69, 1000–1015. [Google Scholar] [CrossRef] [Scilit]
- Aikio, J.P.; Sethi, A.; Hietanen, M.; Rahkonen, T.; Pärssinen, A. Ka-Band 4-Stack 45 nm CMOS SOI Power Amplifier Supporting 3GPP New Radio FR2 band n258. In Proceedings of the 2019 SBMO/IEEE MTT-S International Microwave and Optoelectronics Conference (IMOC), Aveiro, Portugal, 10–14 November 2019; pp. 1–4. [Google Scholar]
- Dabag, H.; Hanafi, B.; Golcuk, F.; Agah, A.; Buckwalter, J.F.; Asbeck, P.M. Analysis and Design of Stacked-FET Millimeter-Wave Power Amplifiers. IEEE Trans. Microw. Theory Tech. 2013, 61, 1543–1556. [Google Scholar] [CrossRef] [Scilit]
- Montaseri, M.H.; Aikio, J.; Rahkonen, T.; Pärssinen, A. Optimum Number of Transistors in Stacked CMOS Millimeter-Wave Power Amplifiers. In Proceedings of the 2018 IEEE International Symposium on Circuits and Systems (ISCAS), Florence, Italy, 27–30 May 2018; pp. 1–4. [Google Scholar] [CrossRef] [Scilit]
- Jayamon, J.A.; Buckwalter, J.F.; Asbeck, P.M. Multigate-Cell Stacked FET Design for Millimeter-Wave CMOS Power Amplifiers. IEEE J. Solid-State Circuits 2016, 51, 2027–2039. [Google Scholar] [CrossRef] [Scilit]
- Chen, T.; Zhang, C.; Arfaoui, W.; Bellaouar, A.; Embabi, S.; Bossu, G.; Siddabathula, M.; Chew, K.W.J.; Ong, S.N.; Mantravadi, M.; et al. Excellent 22FDX Hot-Carrier Reliability for PA Applications. In Proceedings of the 2019 IEEE Radio Frequency Integrated Circuits Symposium (RFIC), Boston, MA, USA, 2–4 June 2019; pp. 27–30. [Google Scholar] [CrossRef] [Scilit]
- Park, B.; Jin, S.; Jeong, D.; Kim, J.; Cho, Y.; Moon, K.; Kim, B. Highly Linear mm-Wave CMOS Power Amplifier. IEEE Trans. Microw. Theory Tech. 2016, 64, 4535–4544. [Google Scholar] [CrossRef] [Scilit]
- Kim, B.; Moon, K.; Jeong, D.; Kim, S.; Shin, J. Linear PA at mm-Wave band for 5G application. In Proceedings of the 2017 10th Global Symposium on Millimeter-Waves, Hong Kong, China, 24–26 May 2017; pp. 80–82. [Google Scholar] [CrossRef] [Scilit]
- Thomas, D.; Rostomyan, N.; Asbeck, P. A 45% PAE pMOS Power Amplifier for 28 GHz Applications in 45 nm SOI. In Proceedings of the 2018 IEEE 61st International Midwest Symposium on Circuits and Systems (MWSCAS), Windsor, ON, Canada, 5–8 August 2018; pp. 680–683. [Google Scholar] [CrossRef] [Scilit]
- Xia, J.; Fang, X.; Ayed, A.B.; Boumaiza, S. Millimeter Wave SOI-CMOS Power Amplifier With Enhanced AM-PM Characteristic. IEEE Access 2020, 8, 8861–8875. [Google Scholar] [CrossRef] [Scilit]

Publisher’s Note: MDPI stays neutral with regard to jurisdictional claims in published maps and institutional affiliations. |
© 2021 by the authors. Licensee MDPI, Basel, Switzerland. This article is an open access article distributed under the terms and conditions of the Creative Commons Attribution (CC BY) license (https://creativecommons.org/licenses/by/4.0/).