Interfacial Shearing Behavior along Xanthan Gum Biopolymer-Treated Sand and Solid Interfaces and Its Meaning in Geotechnical Engineering Aspects
Abstract
1. Introduction
2. Materials and Experimental Process
2.1. Materials
2.1.1. Jumunjin Sand
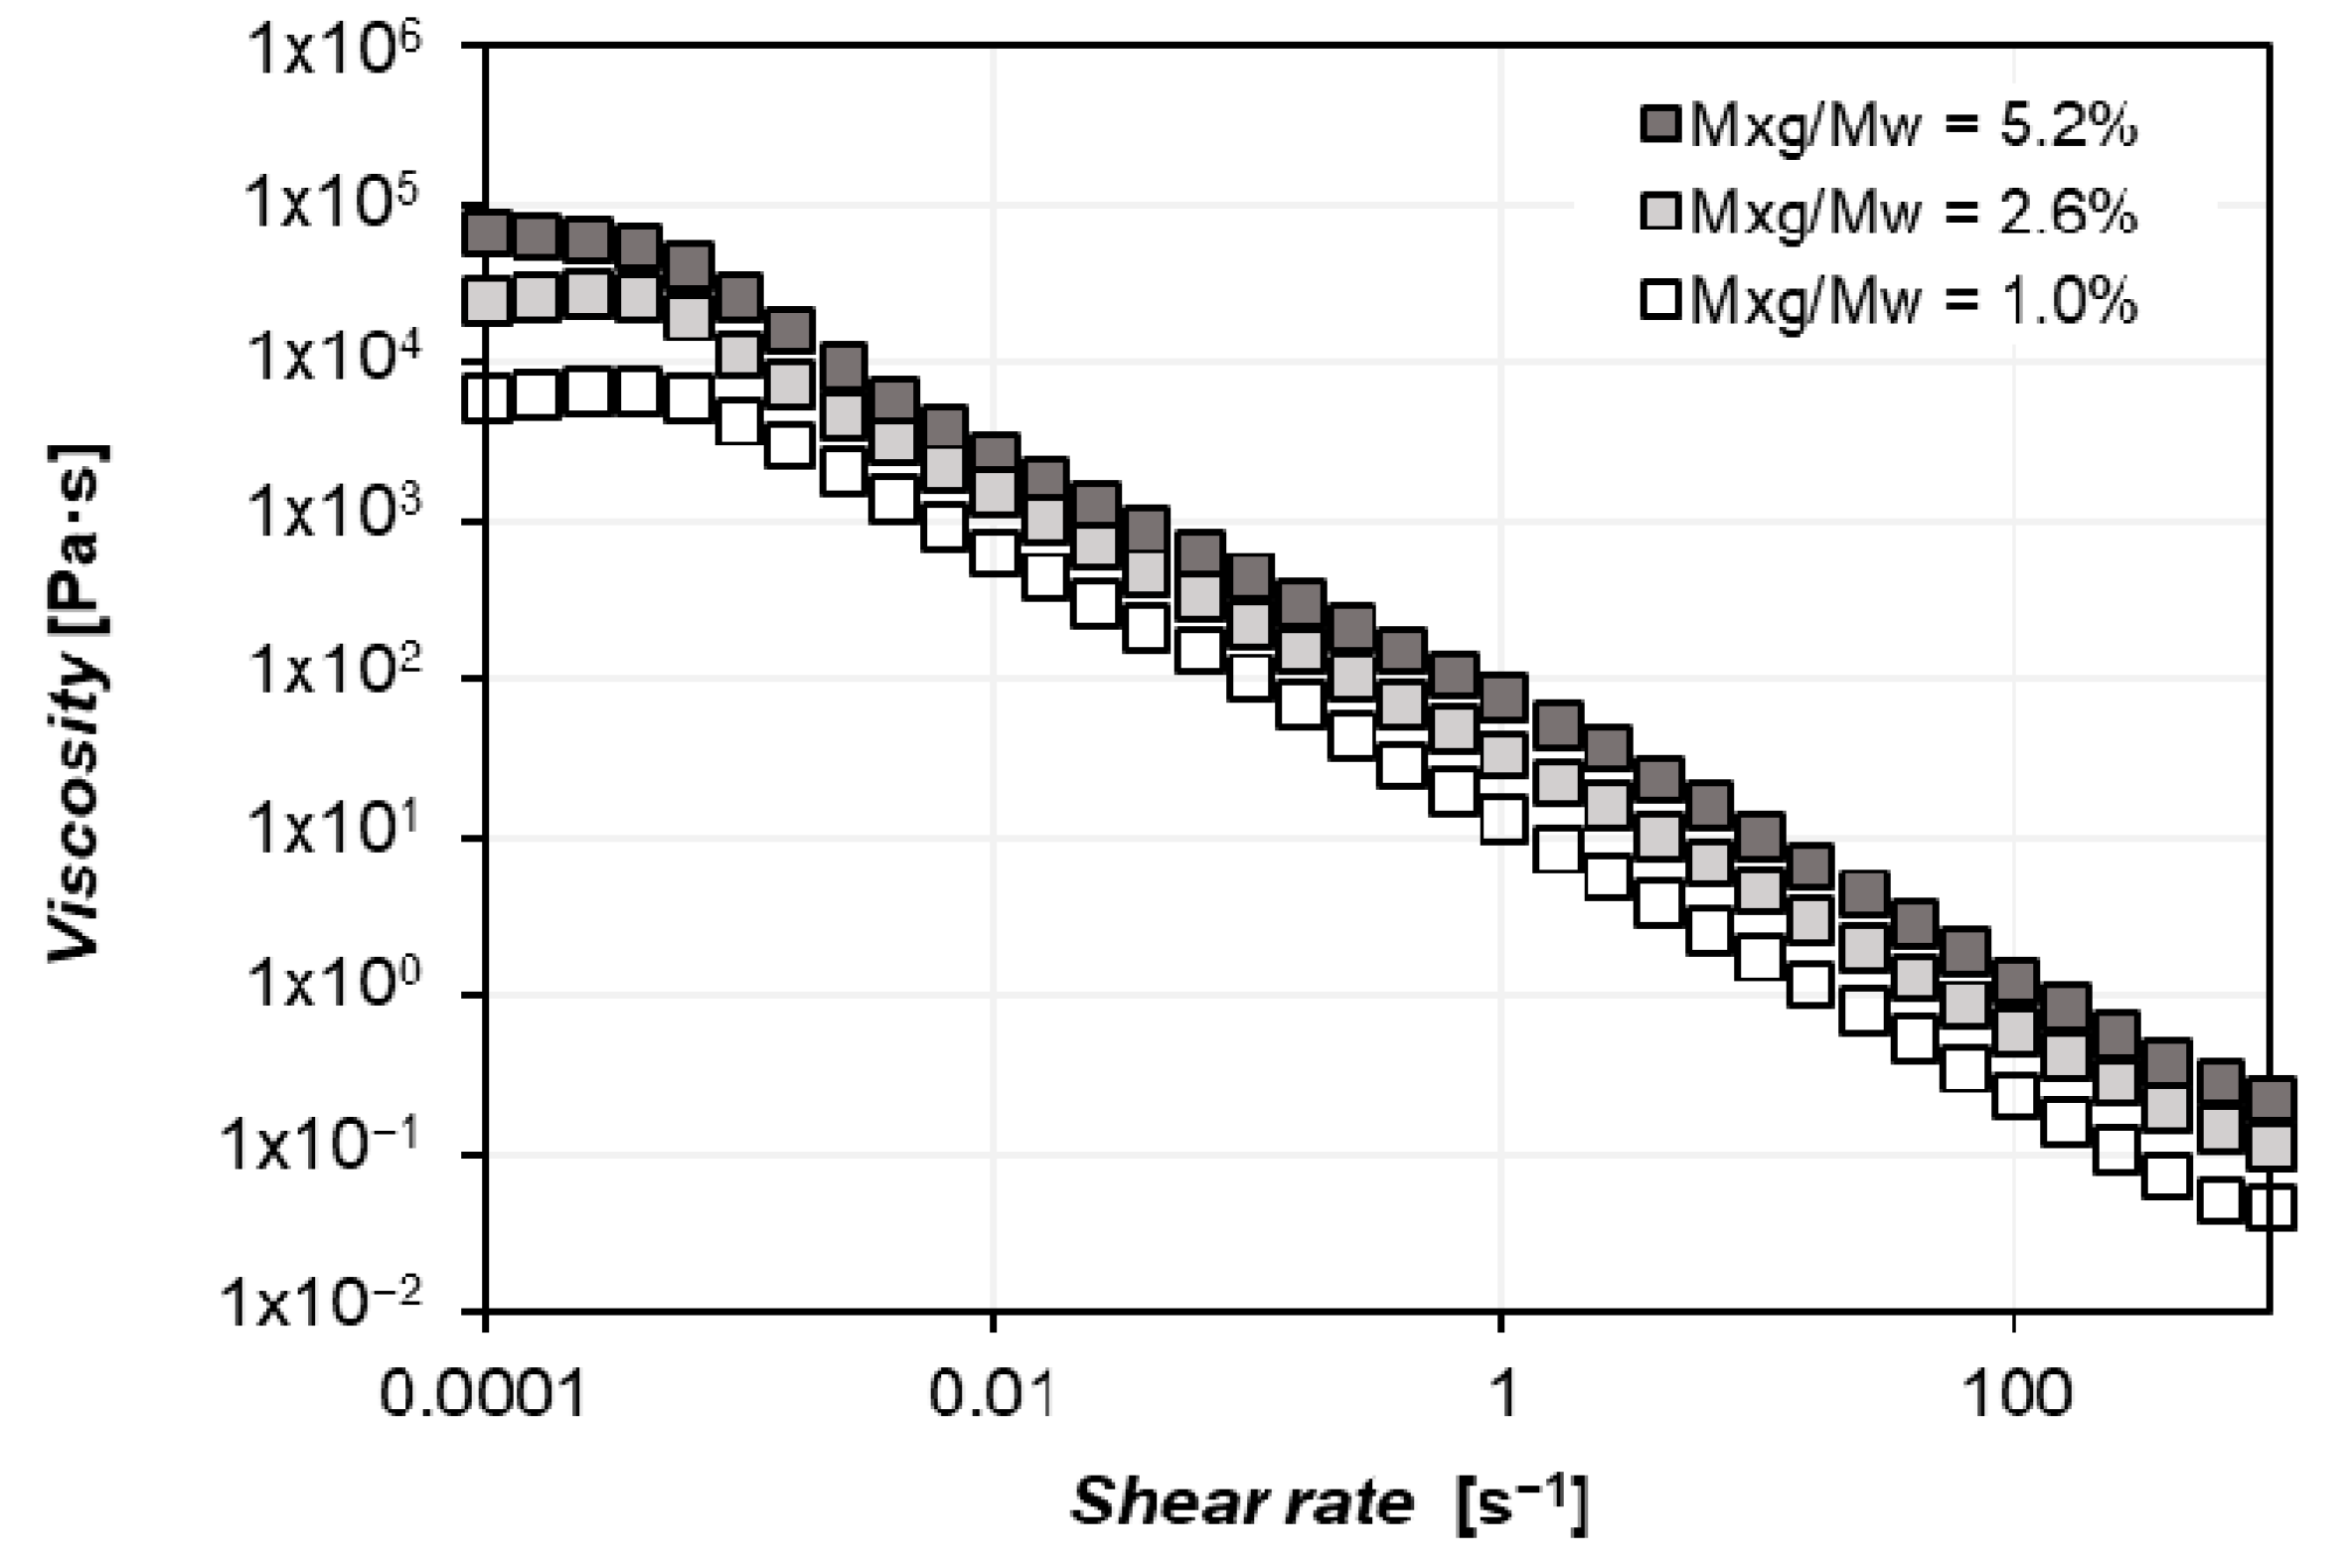
2.1.2. Biopolymer: Xanthan Gum
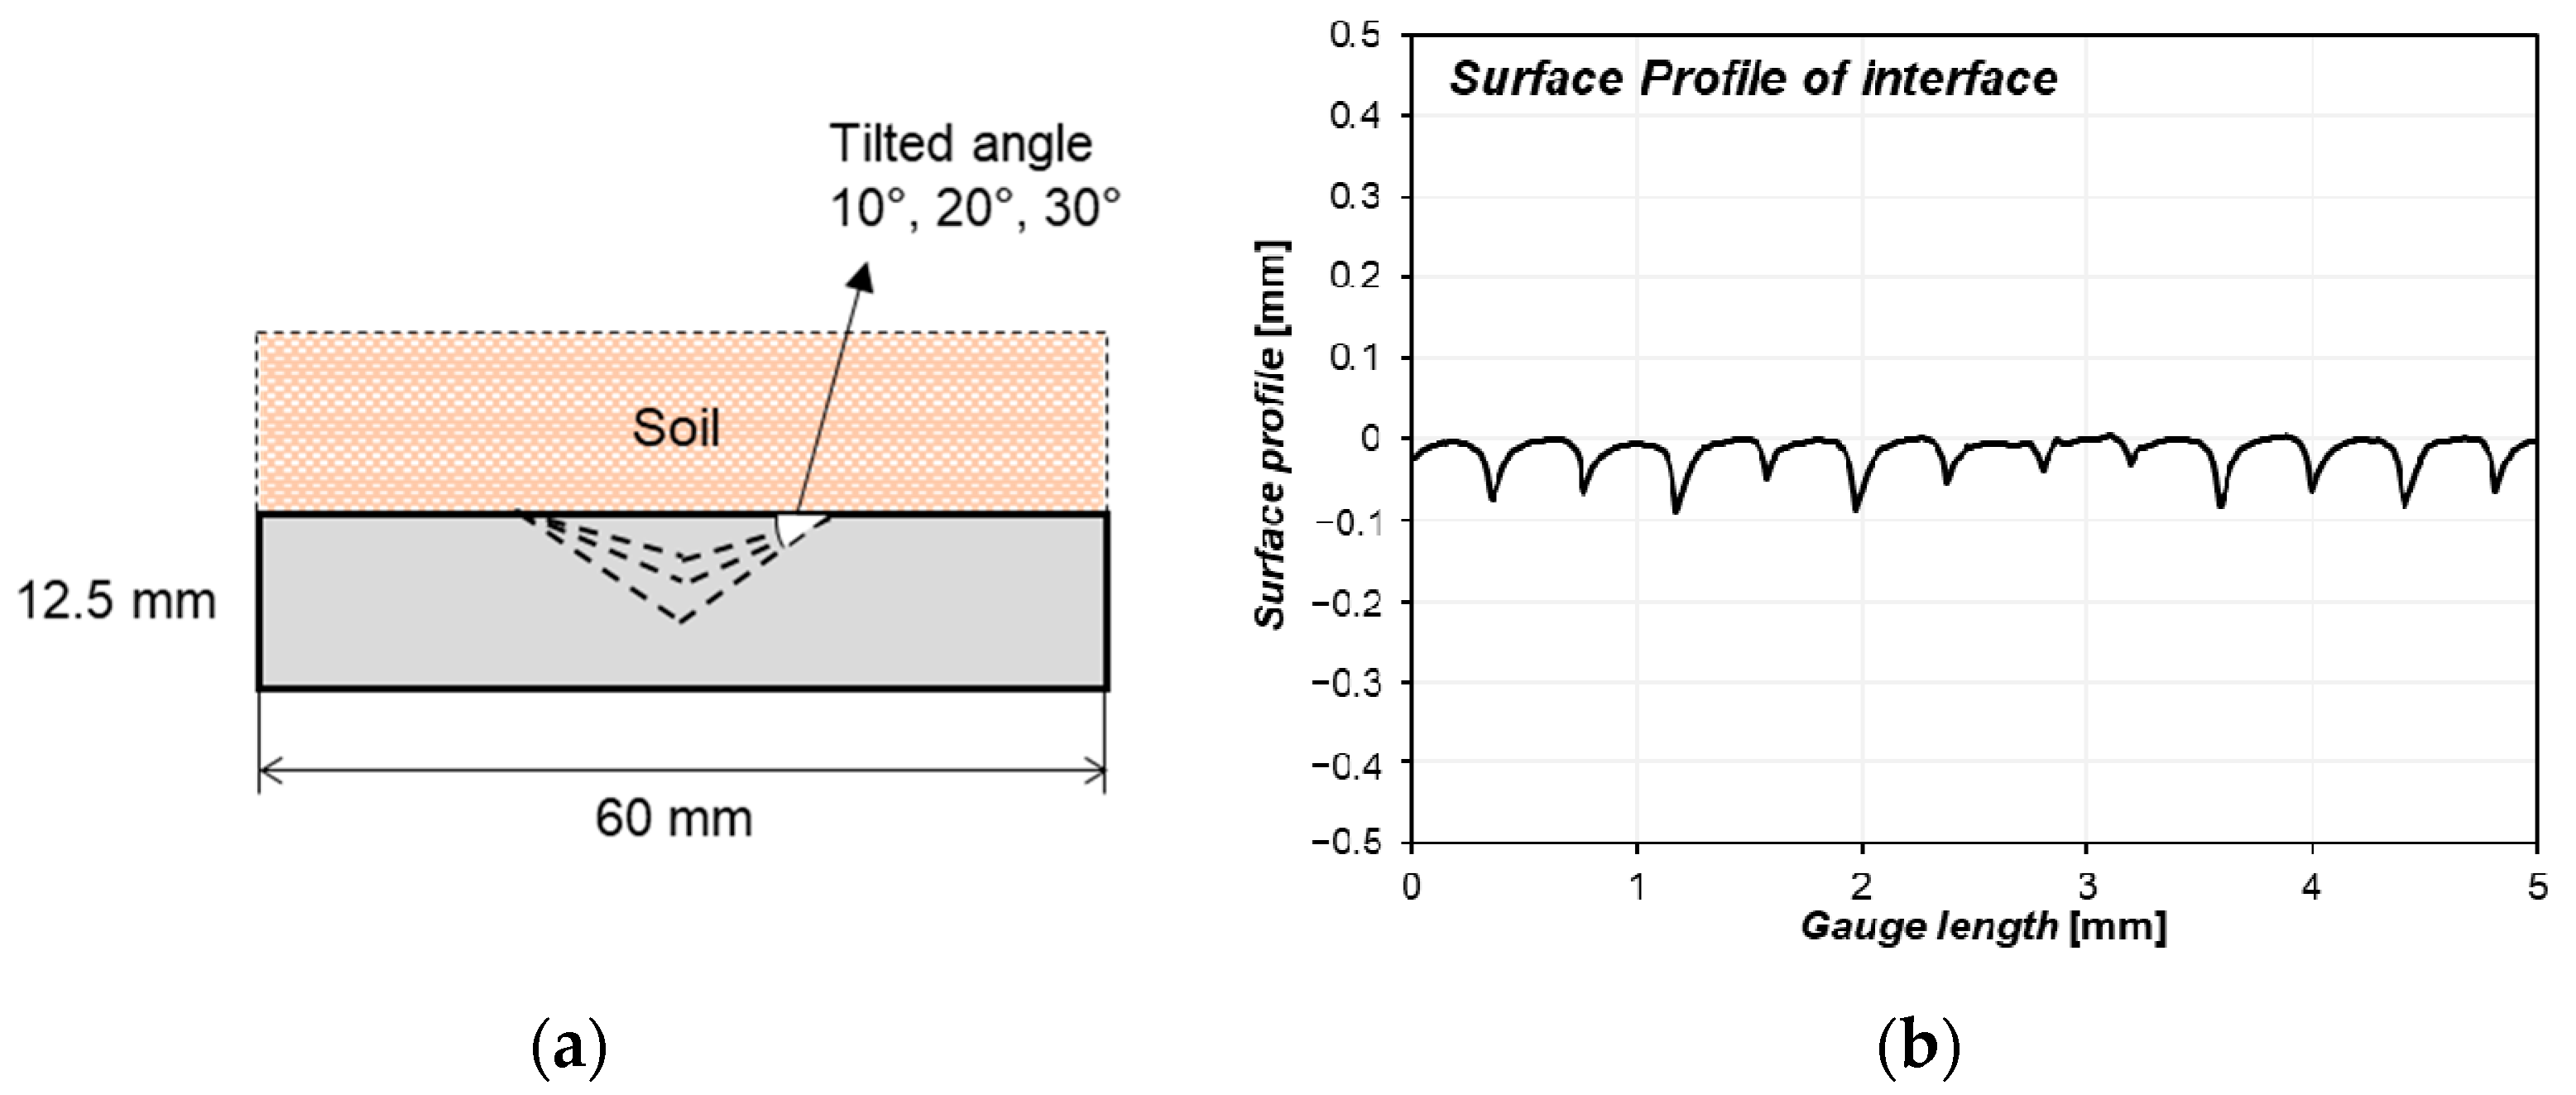
2.1.3. Interfacial Structure Model
2.2. Experimental Process
2.2.1. Specimen Preparation
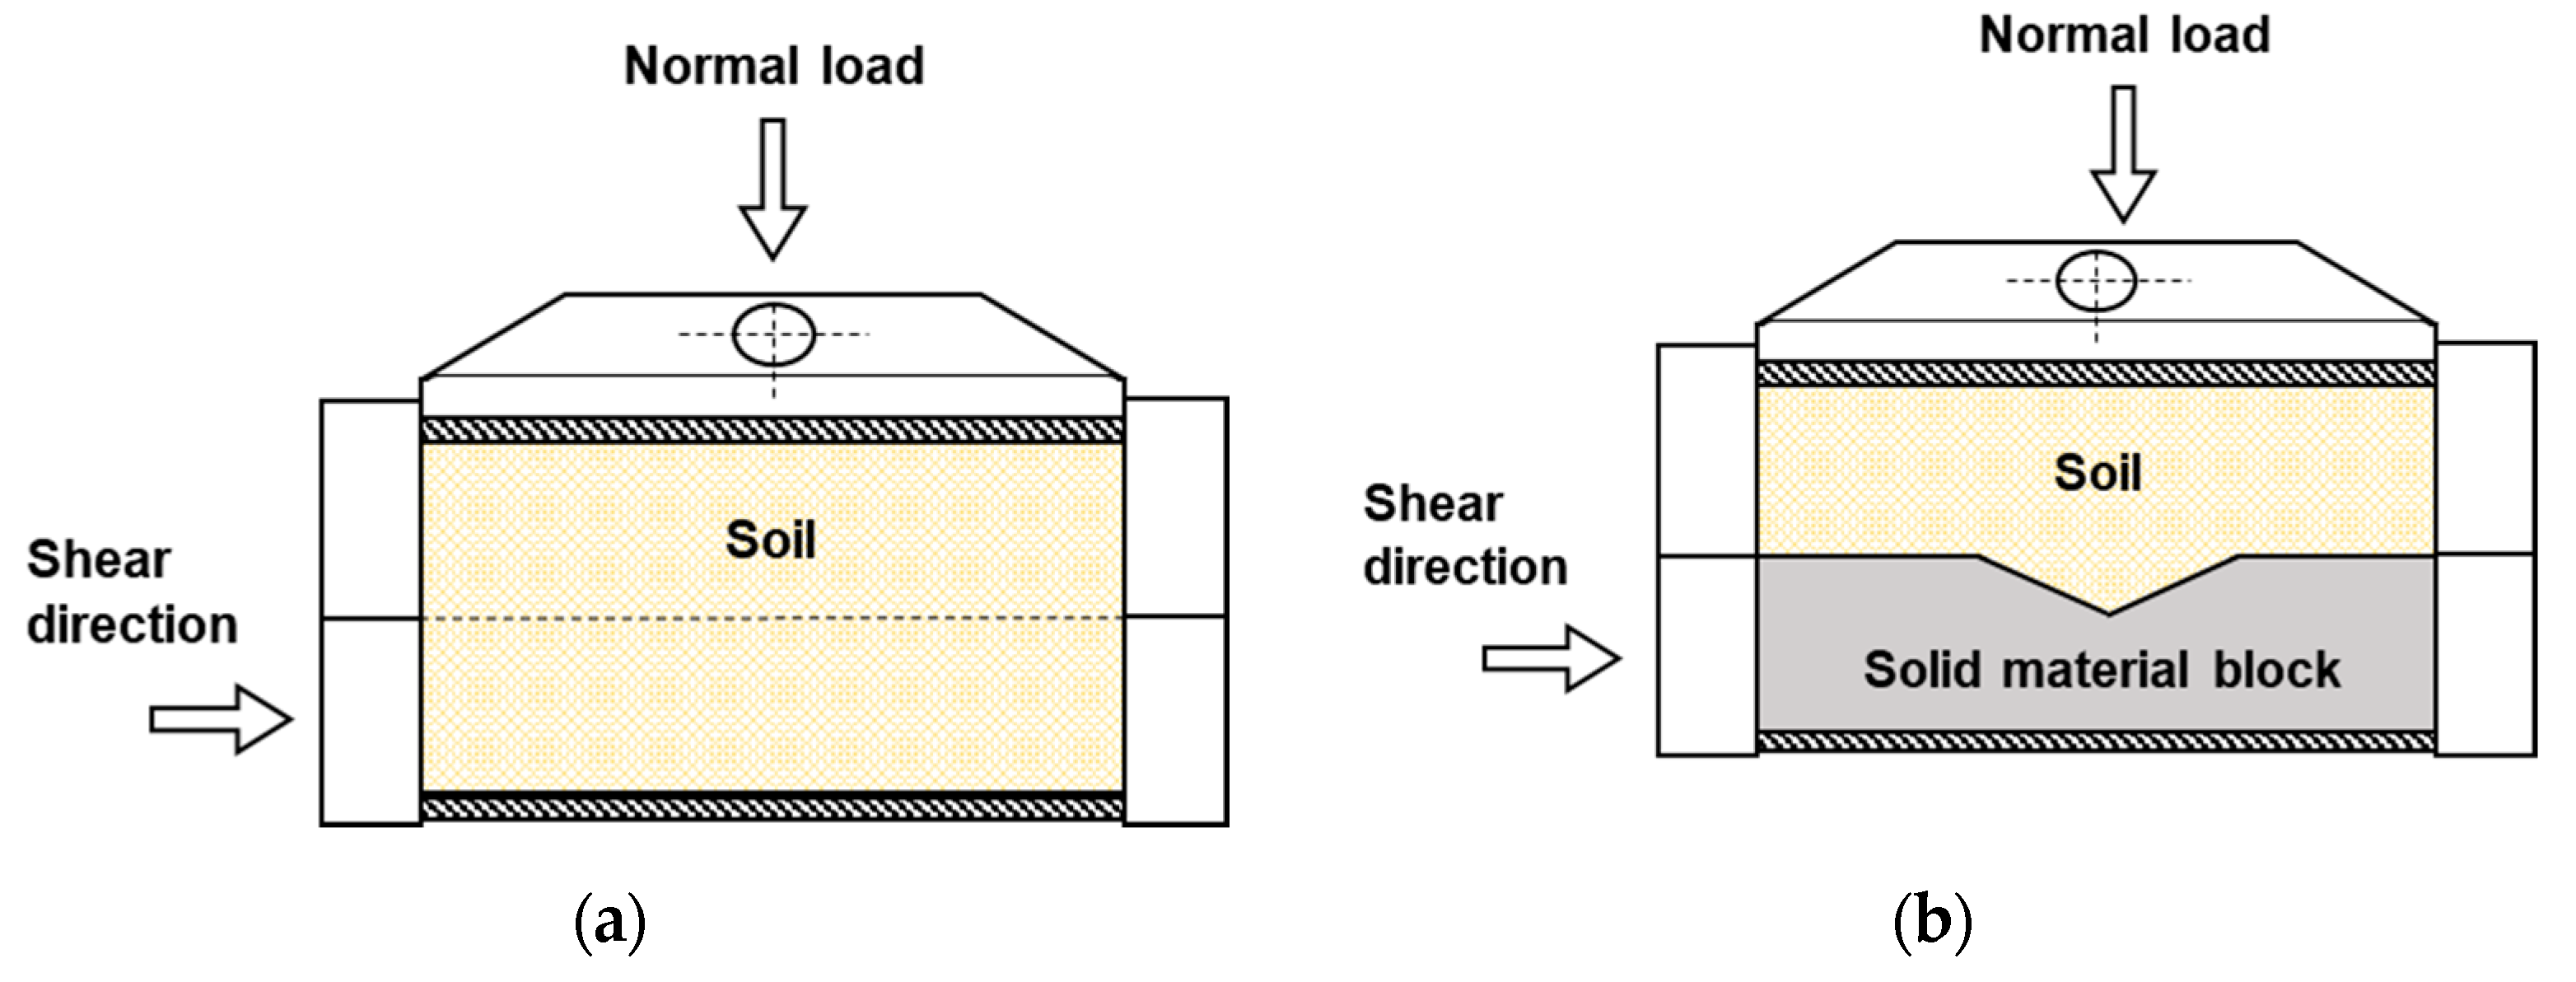
2.2.2. Direct and Interface Shear Tests
3. Results
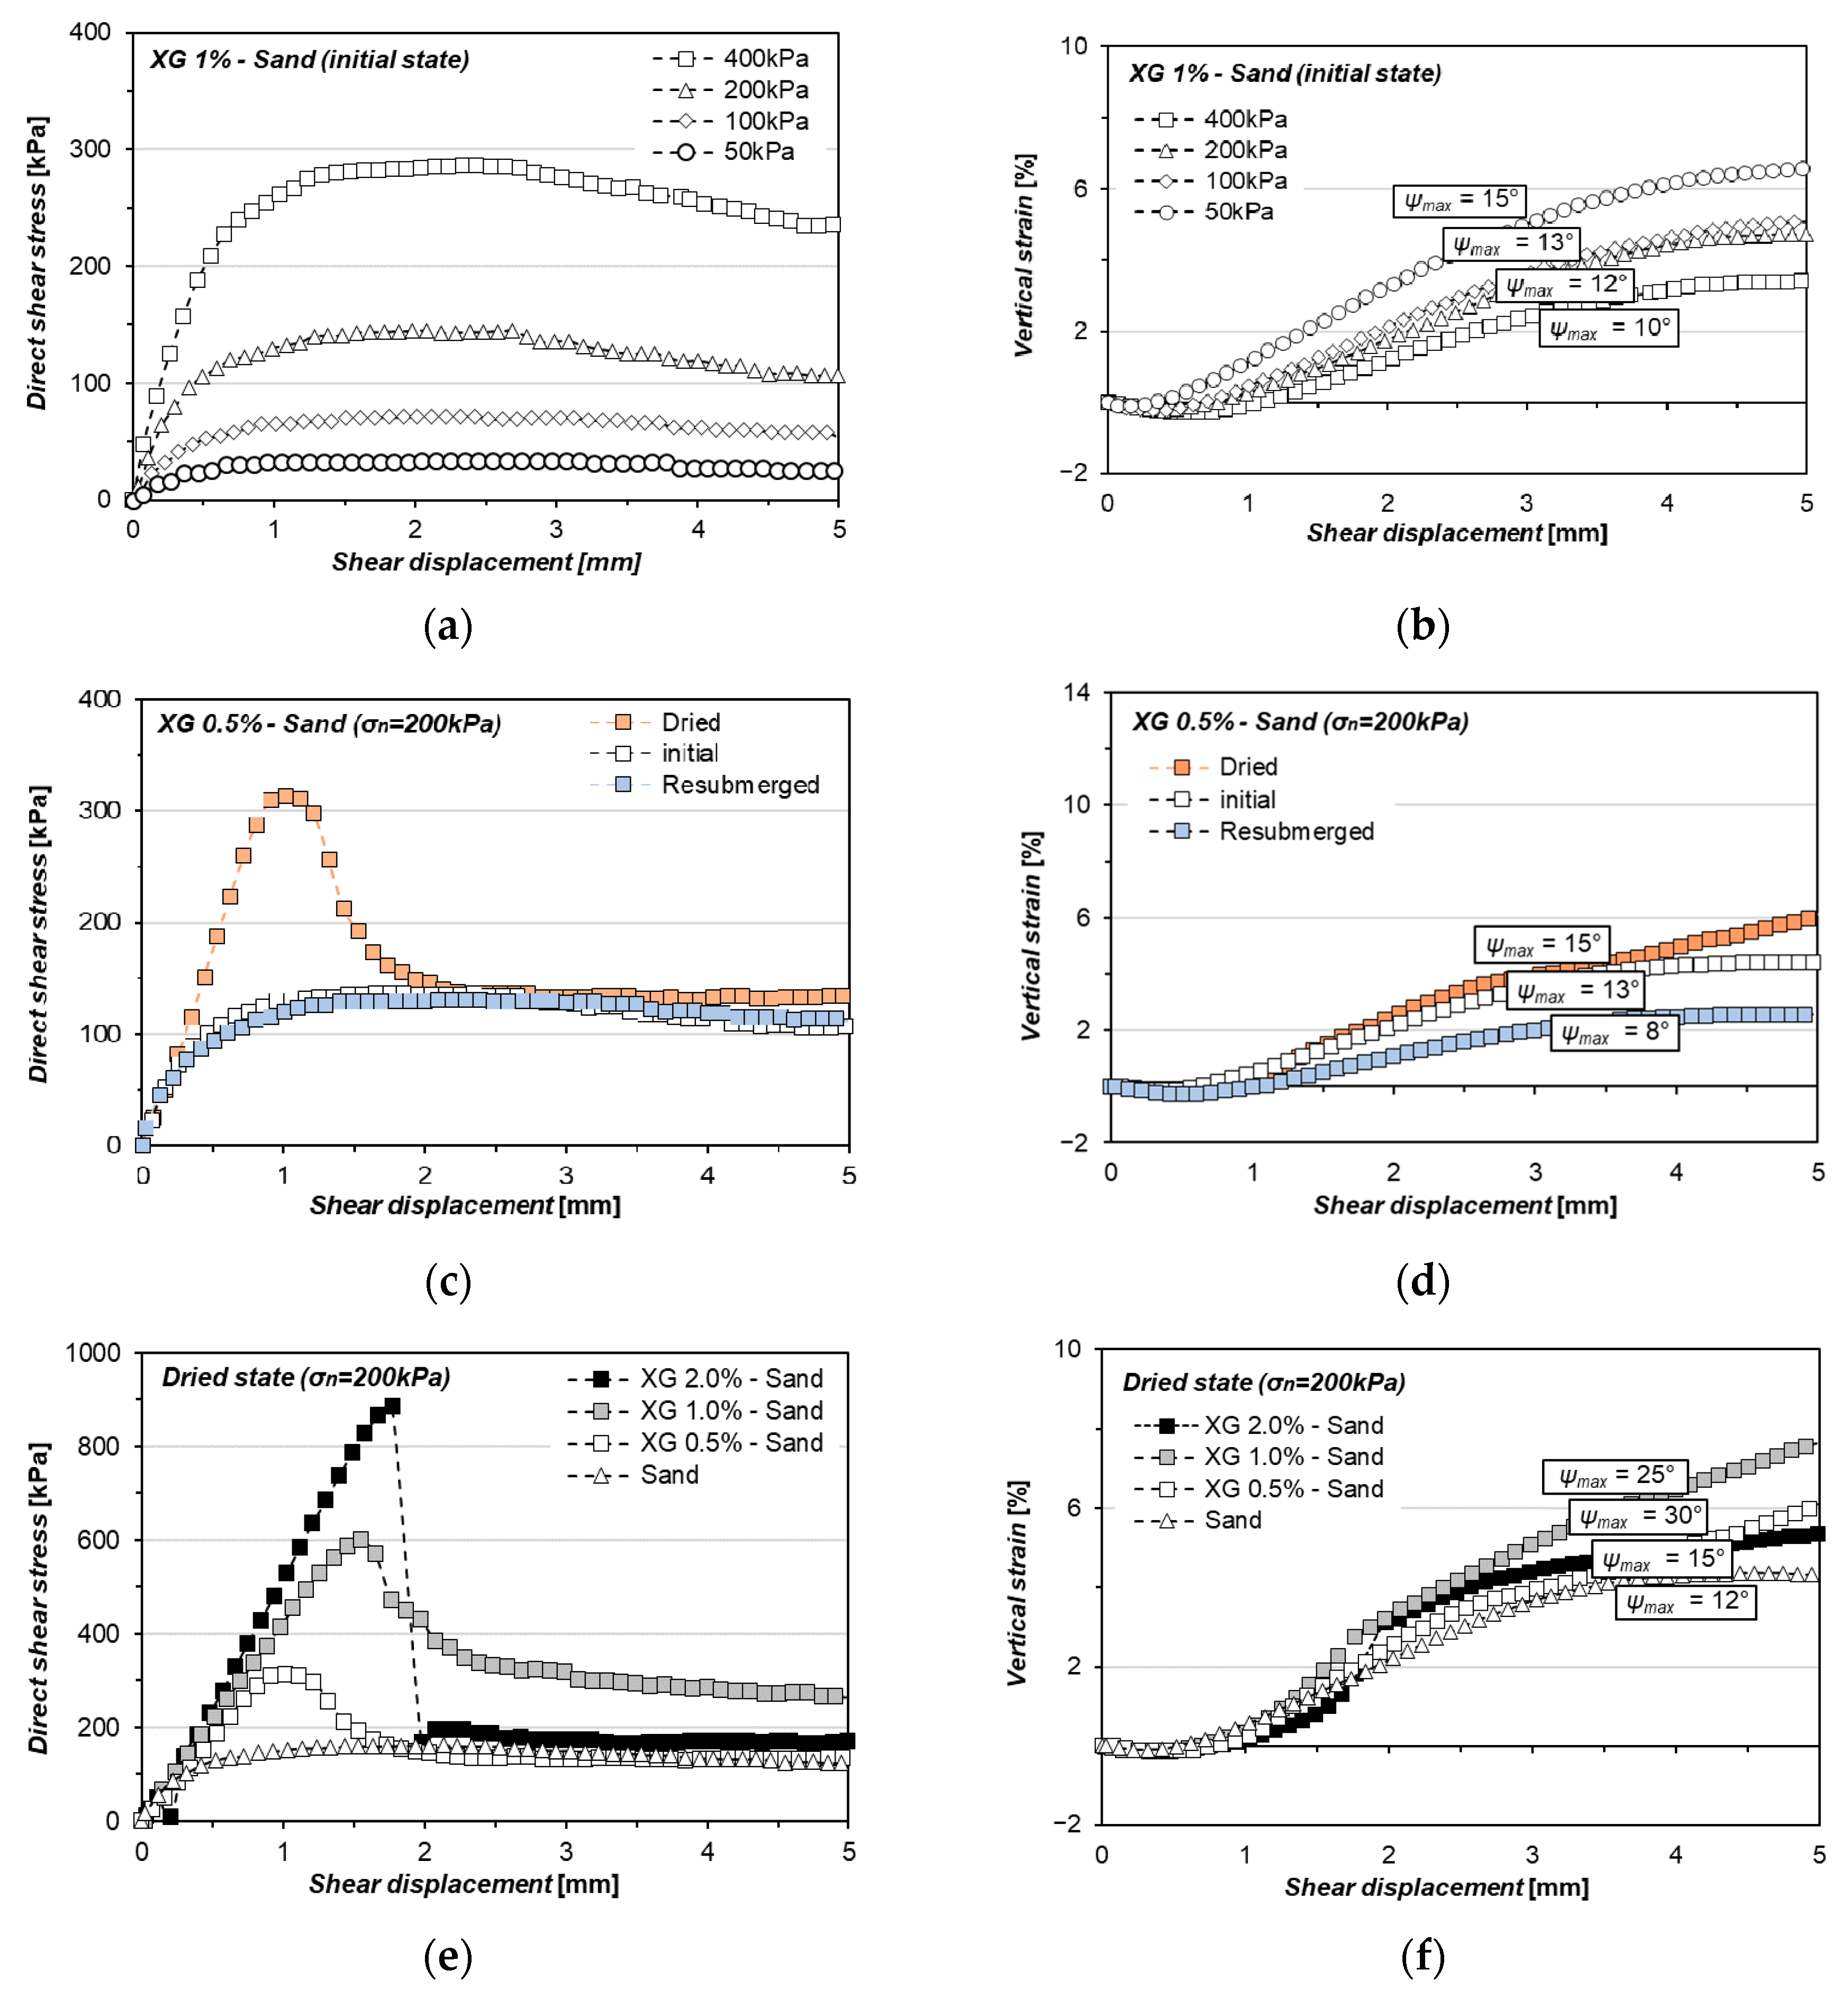
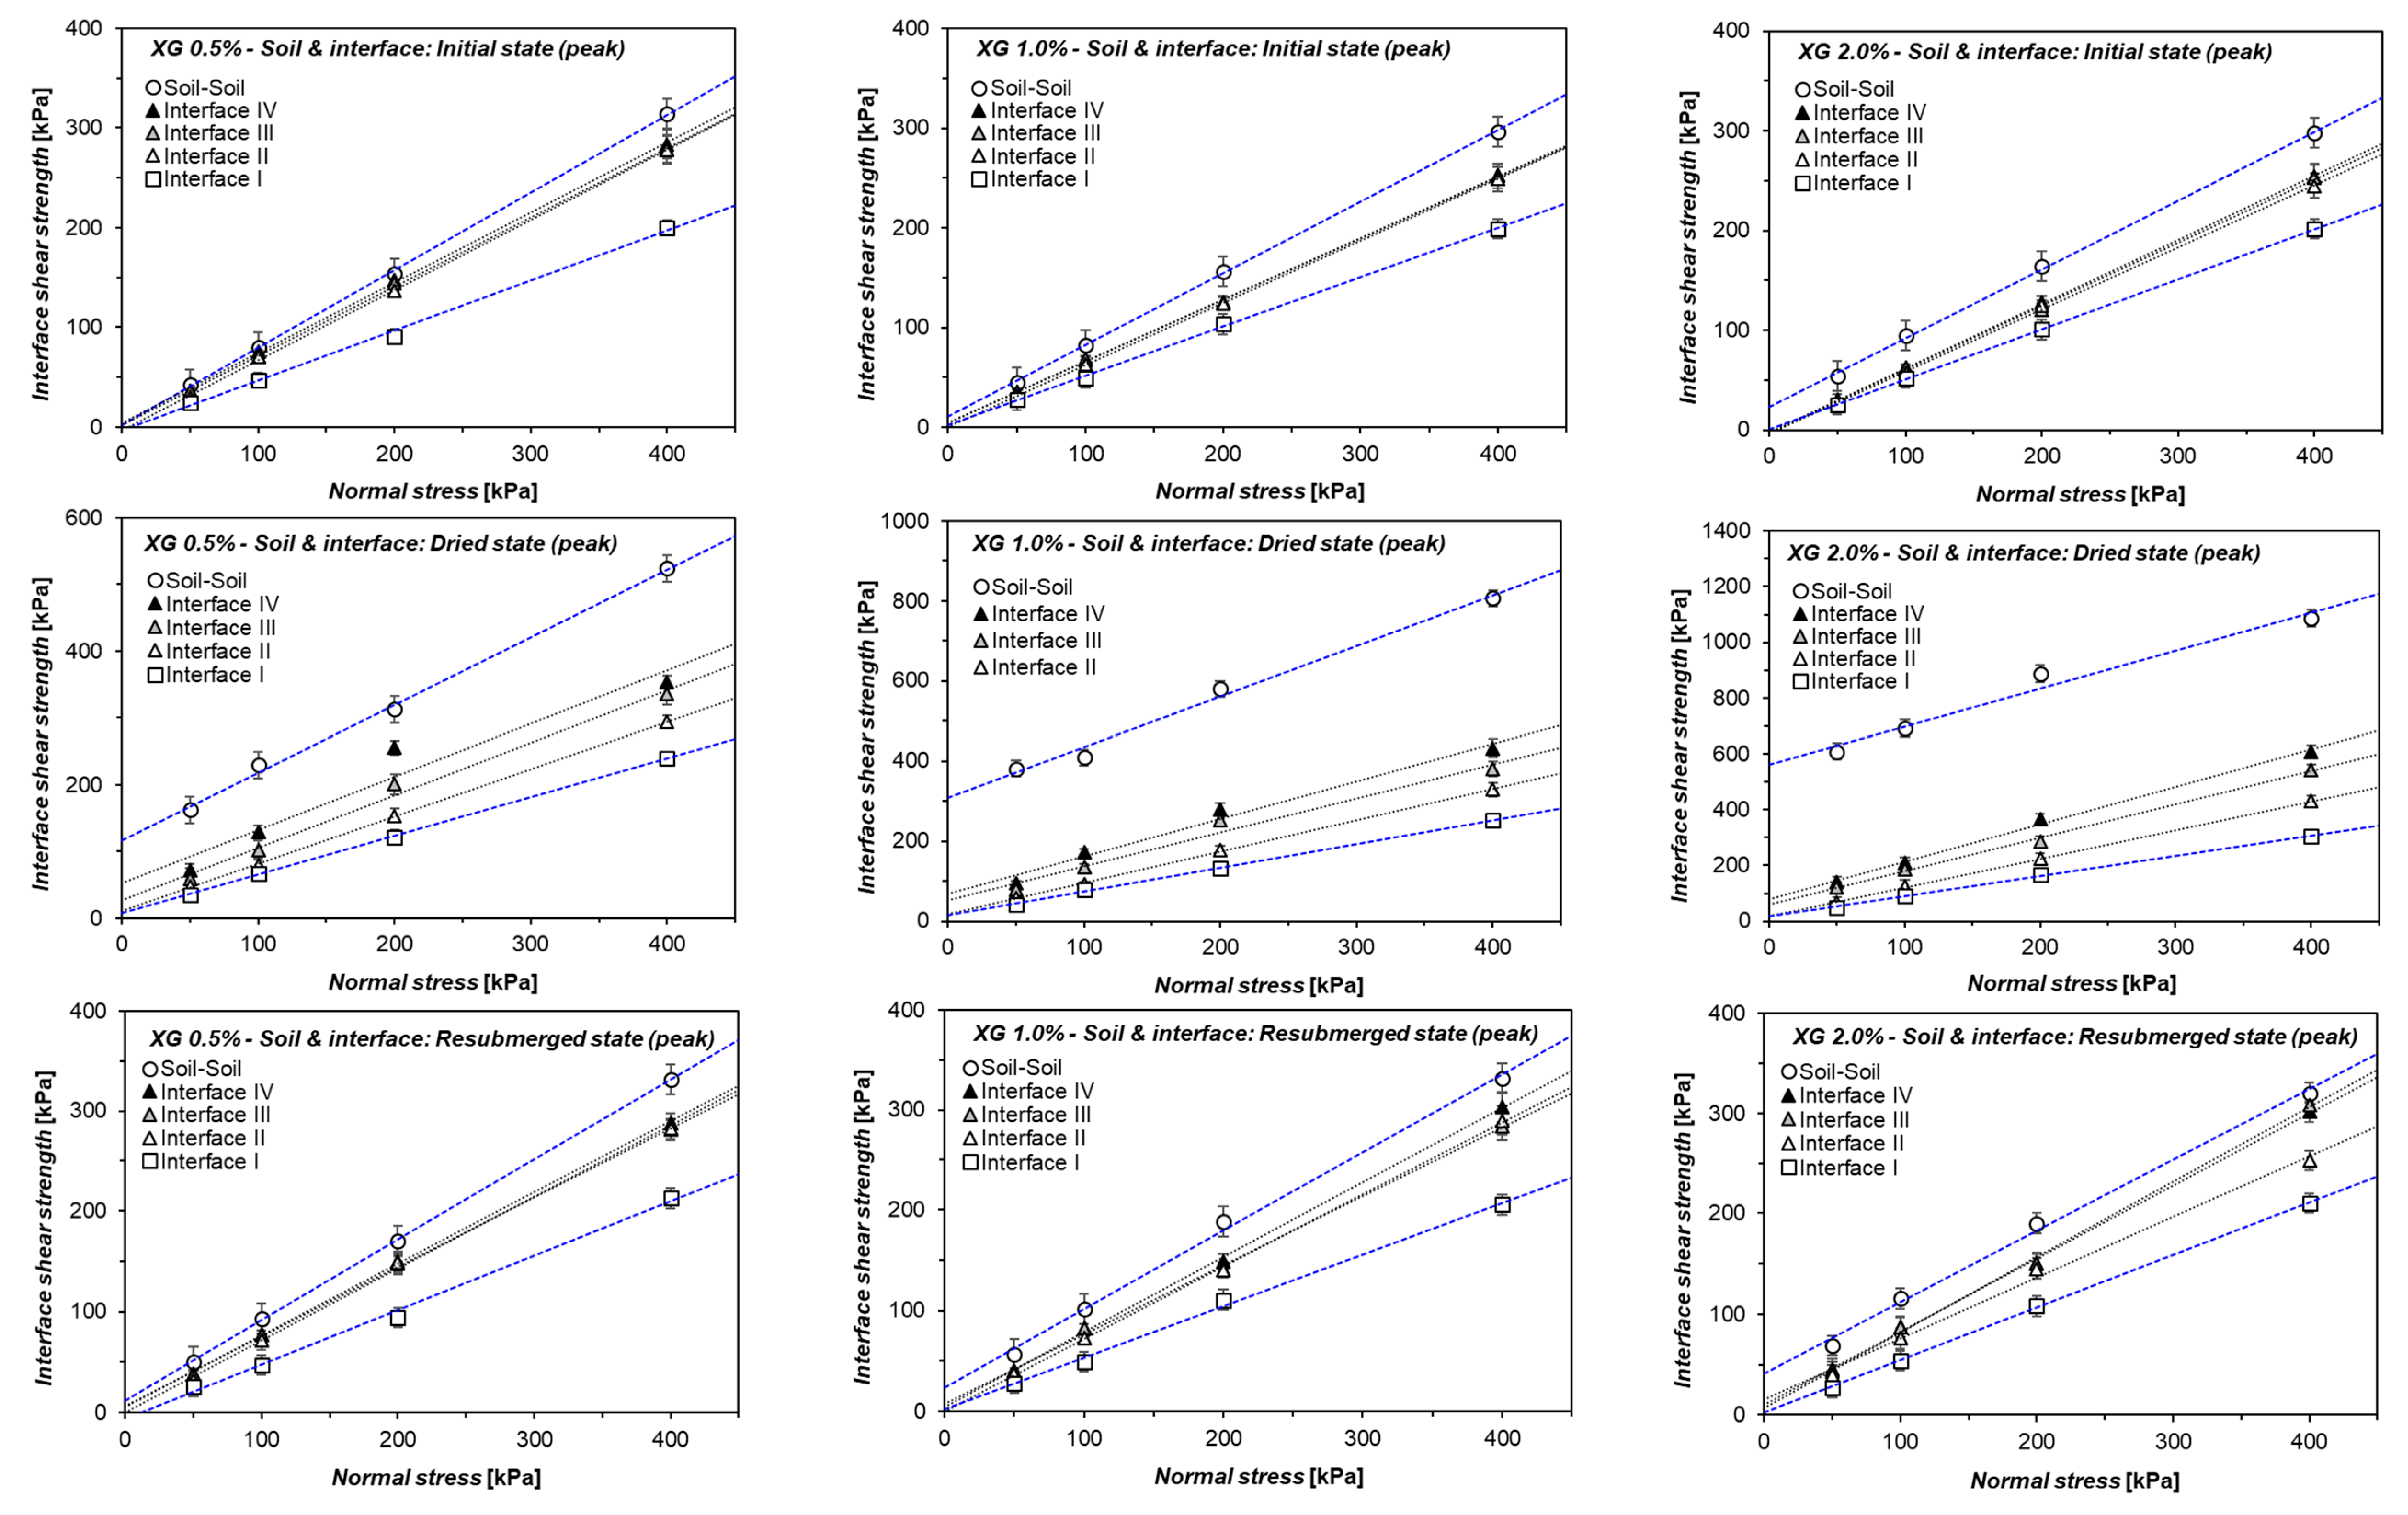
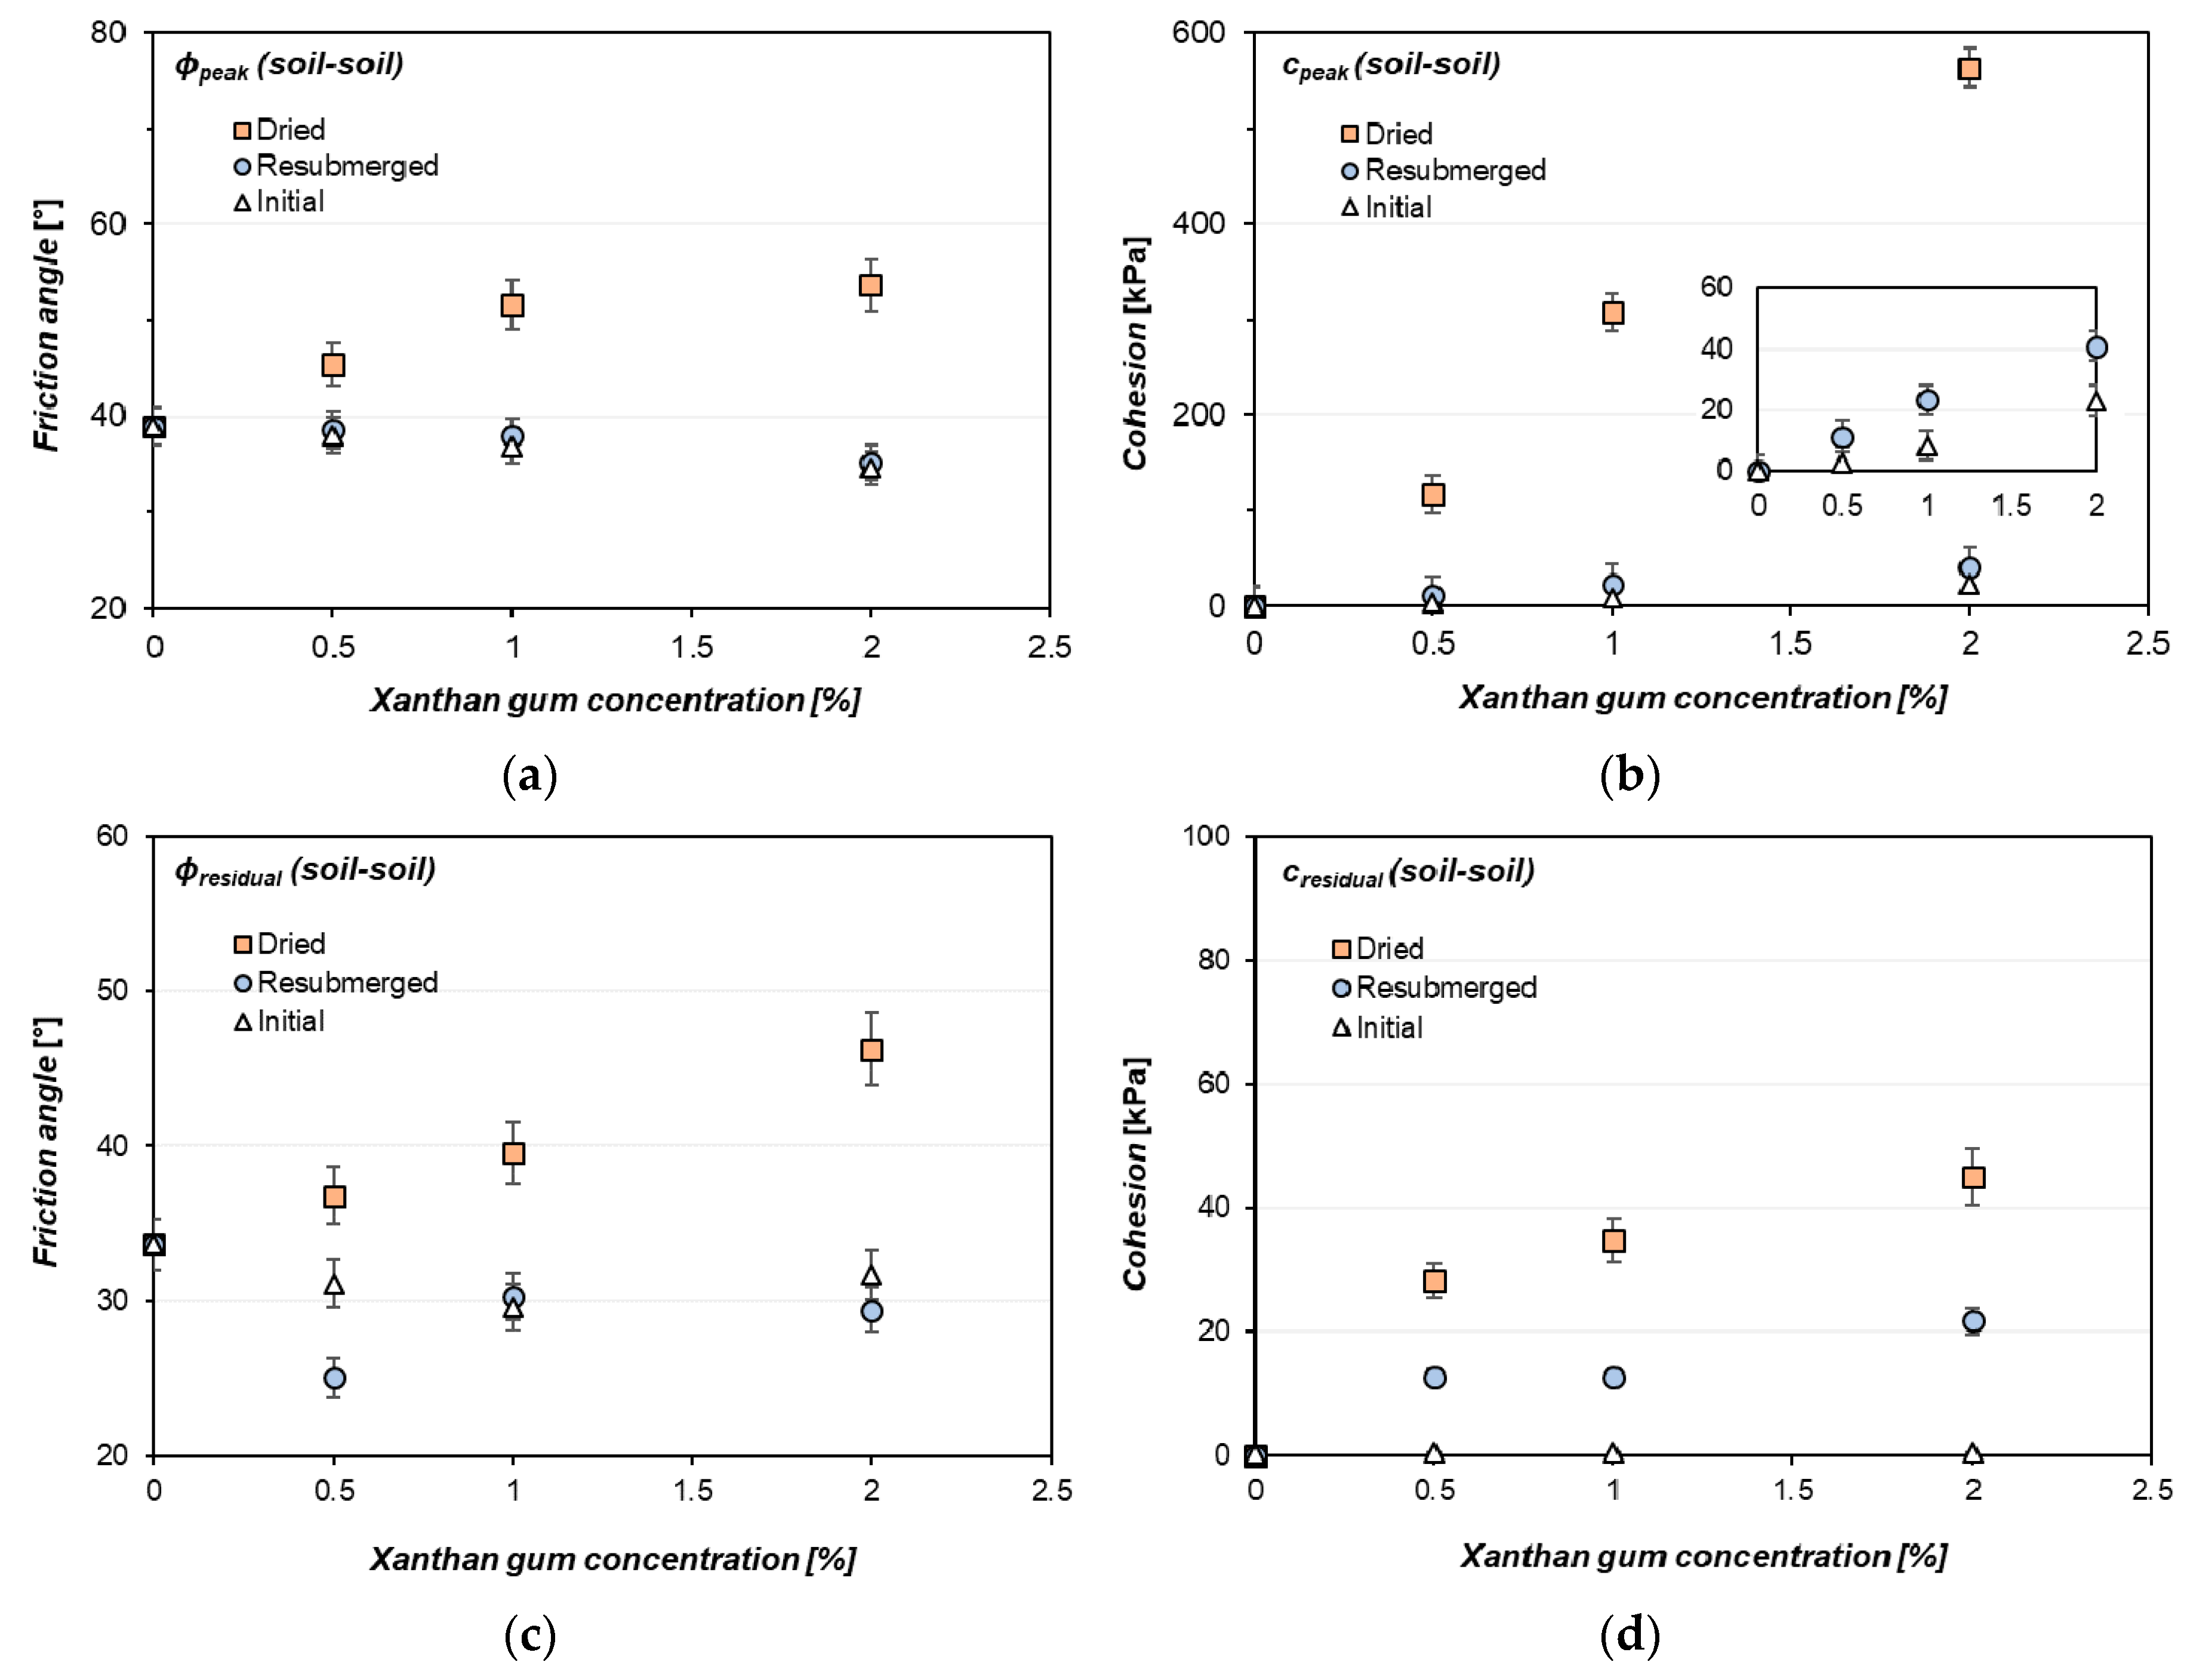
3.1. Shearing Behavior of Xanthan Gum-Treated Sand (Soil-to-Soil Shearing) in Hydrogel State
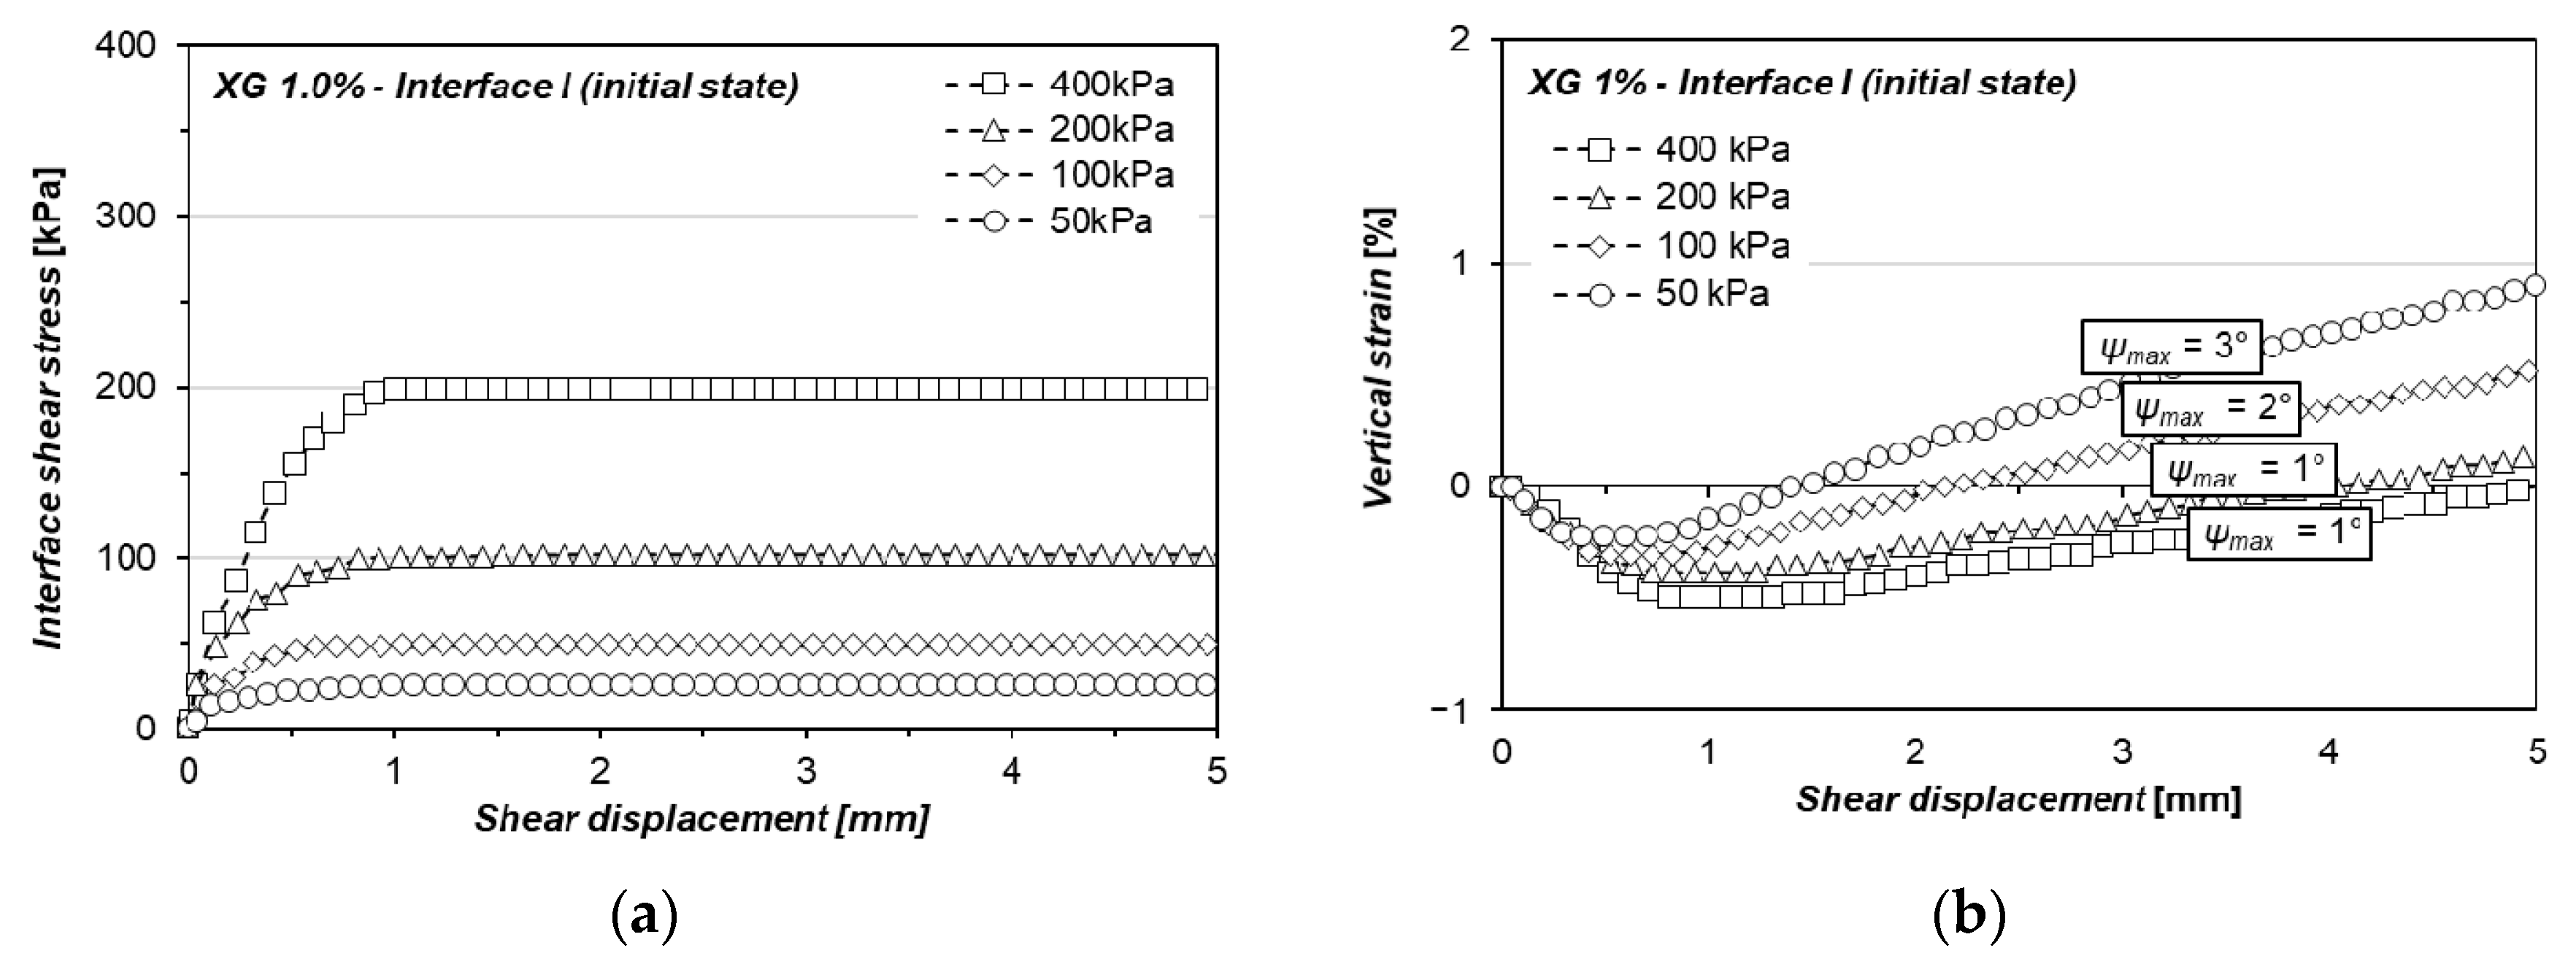
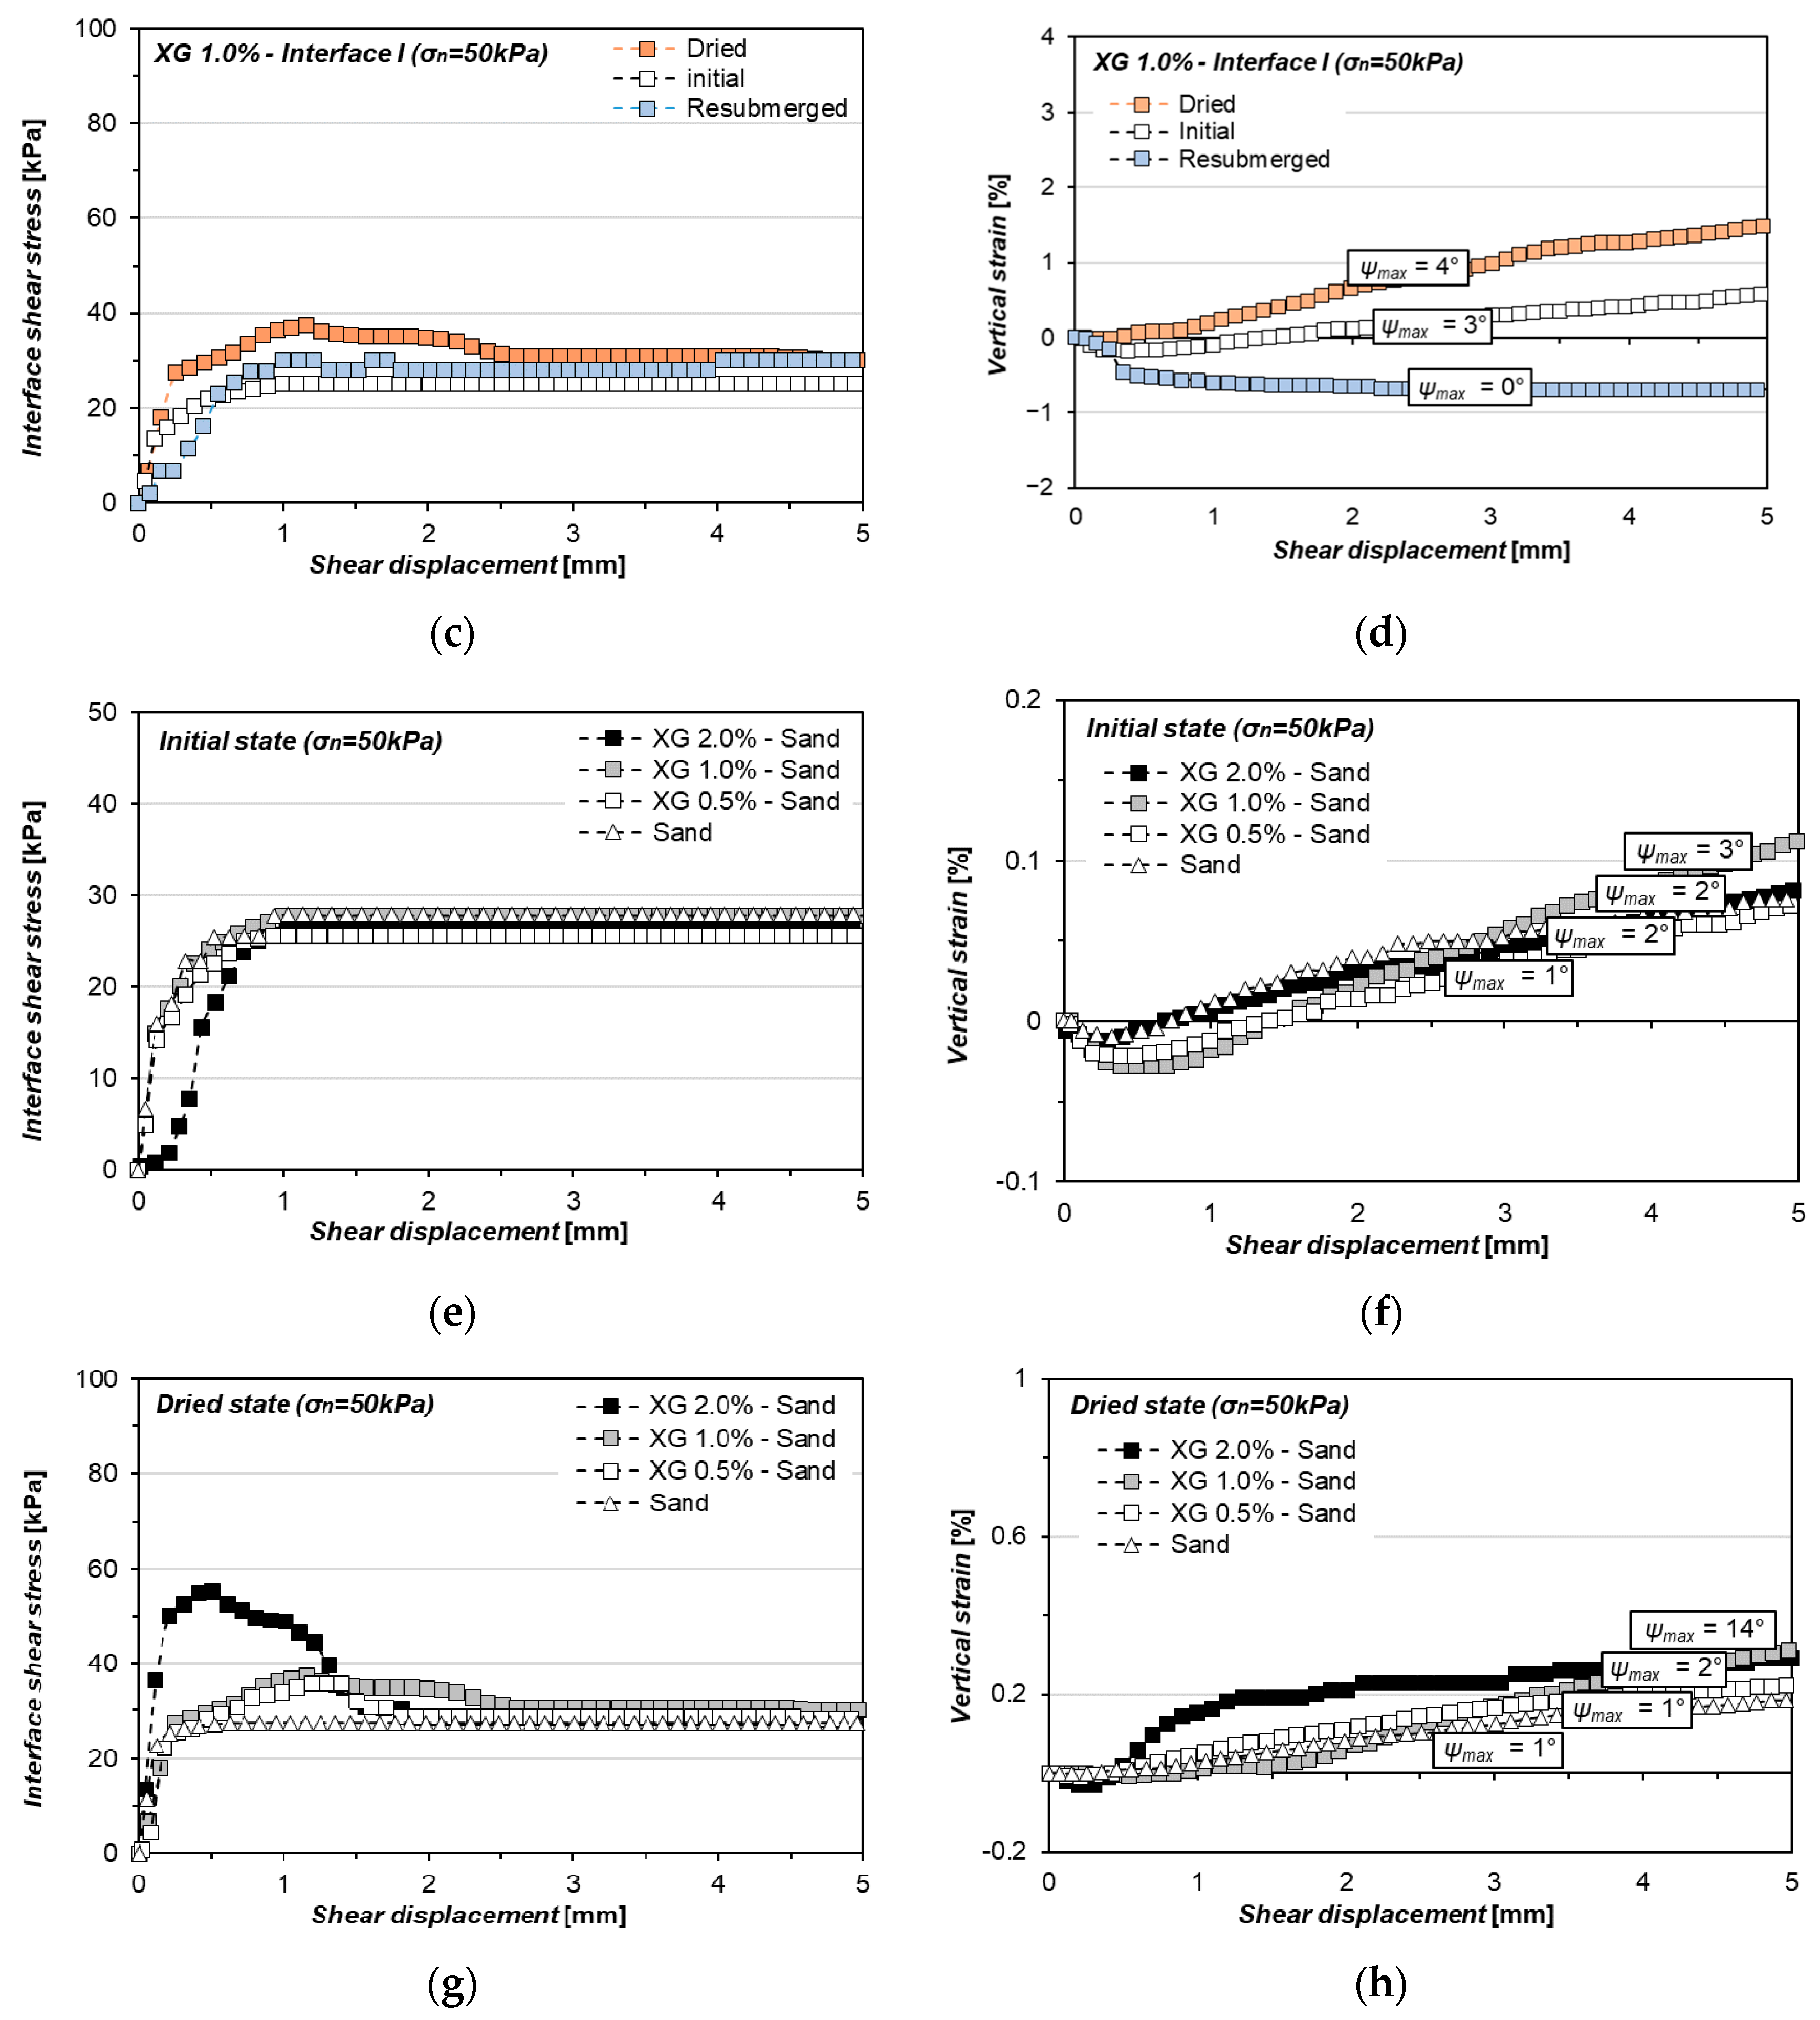
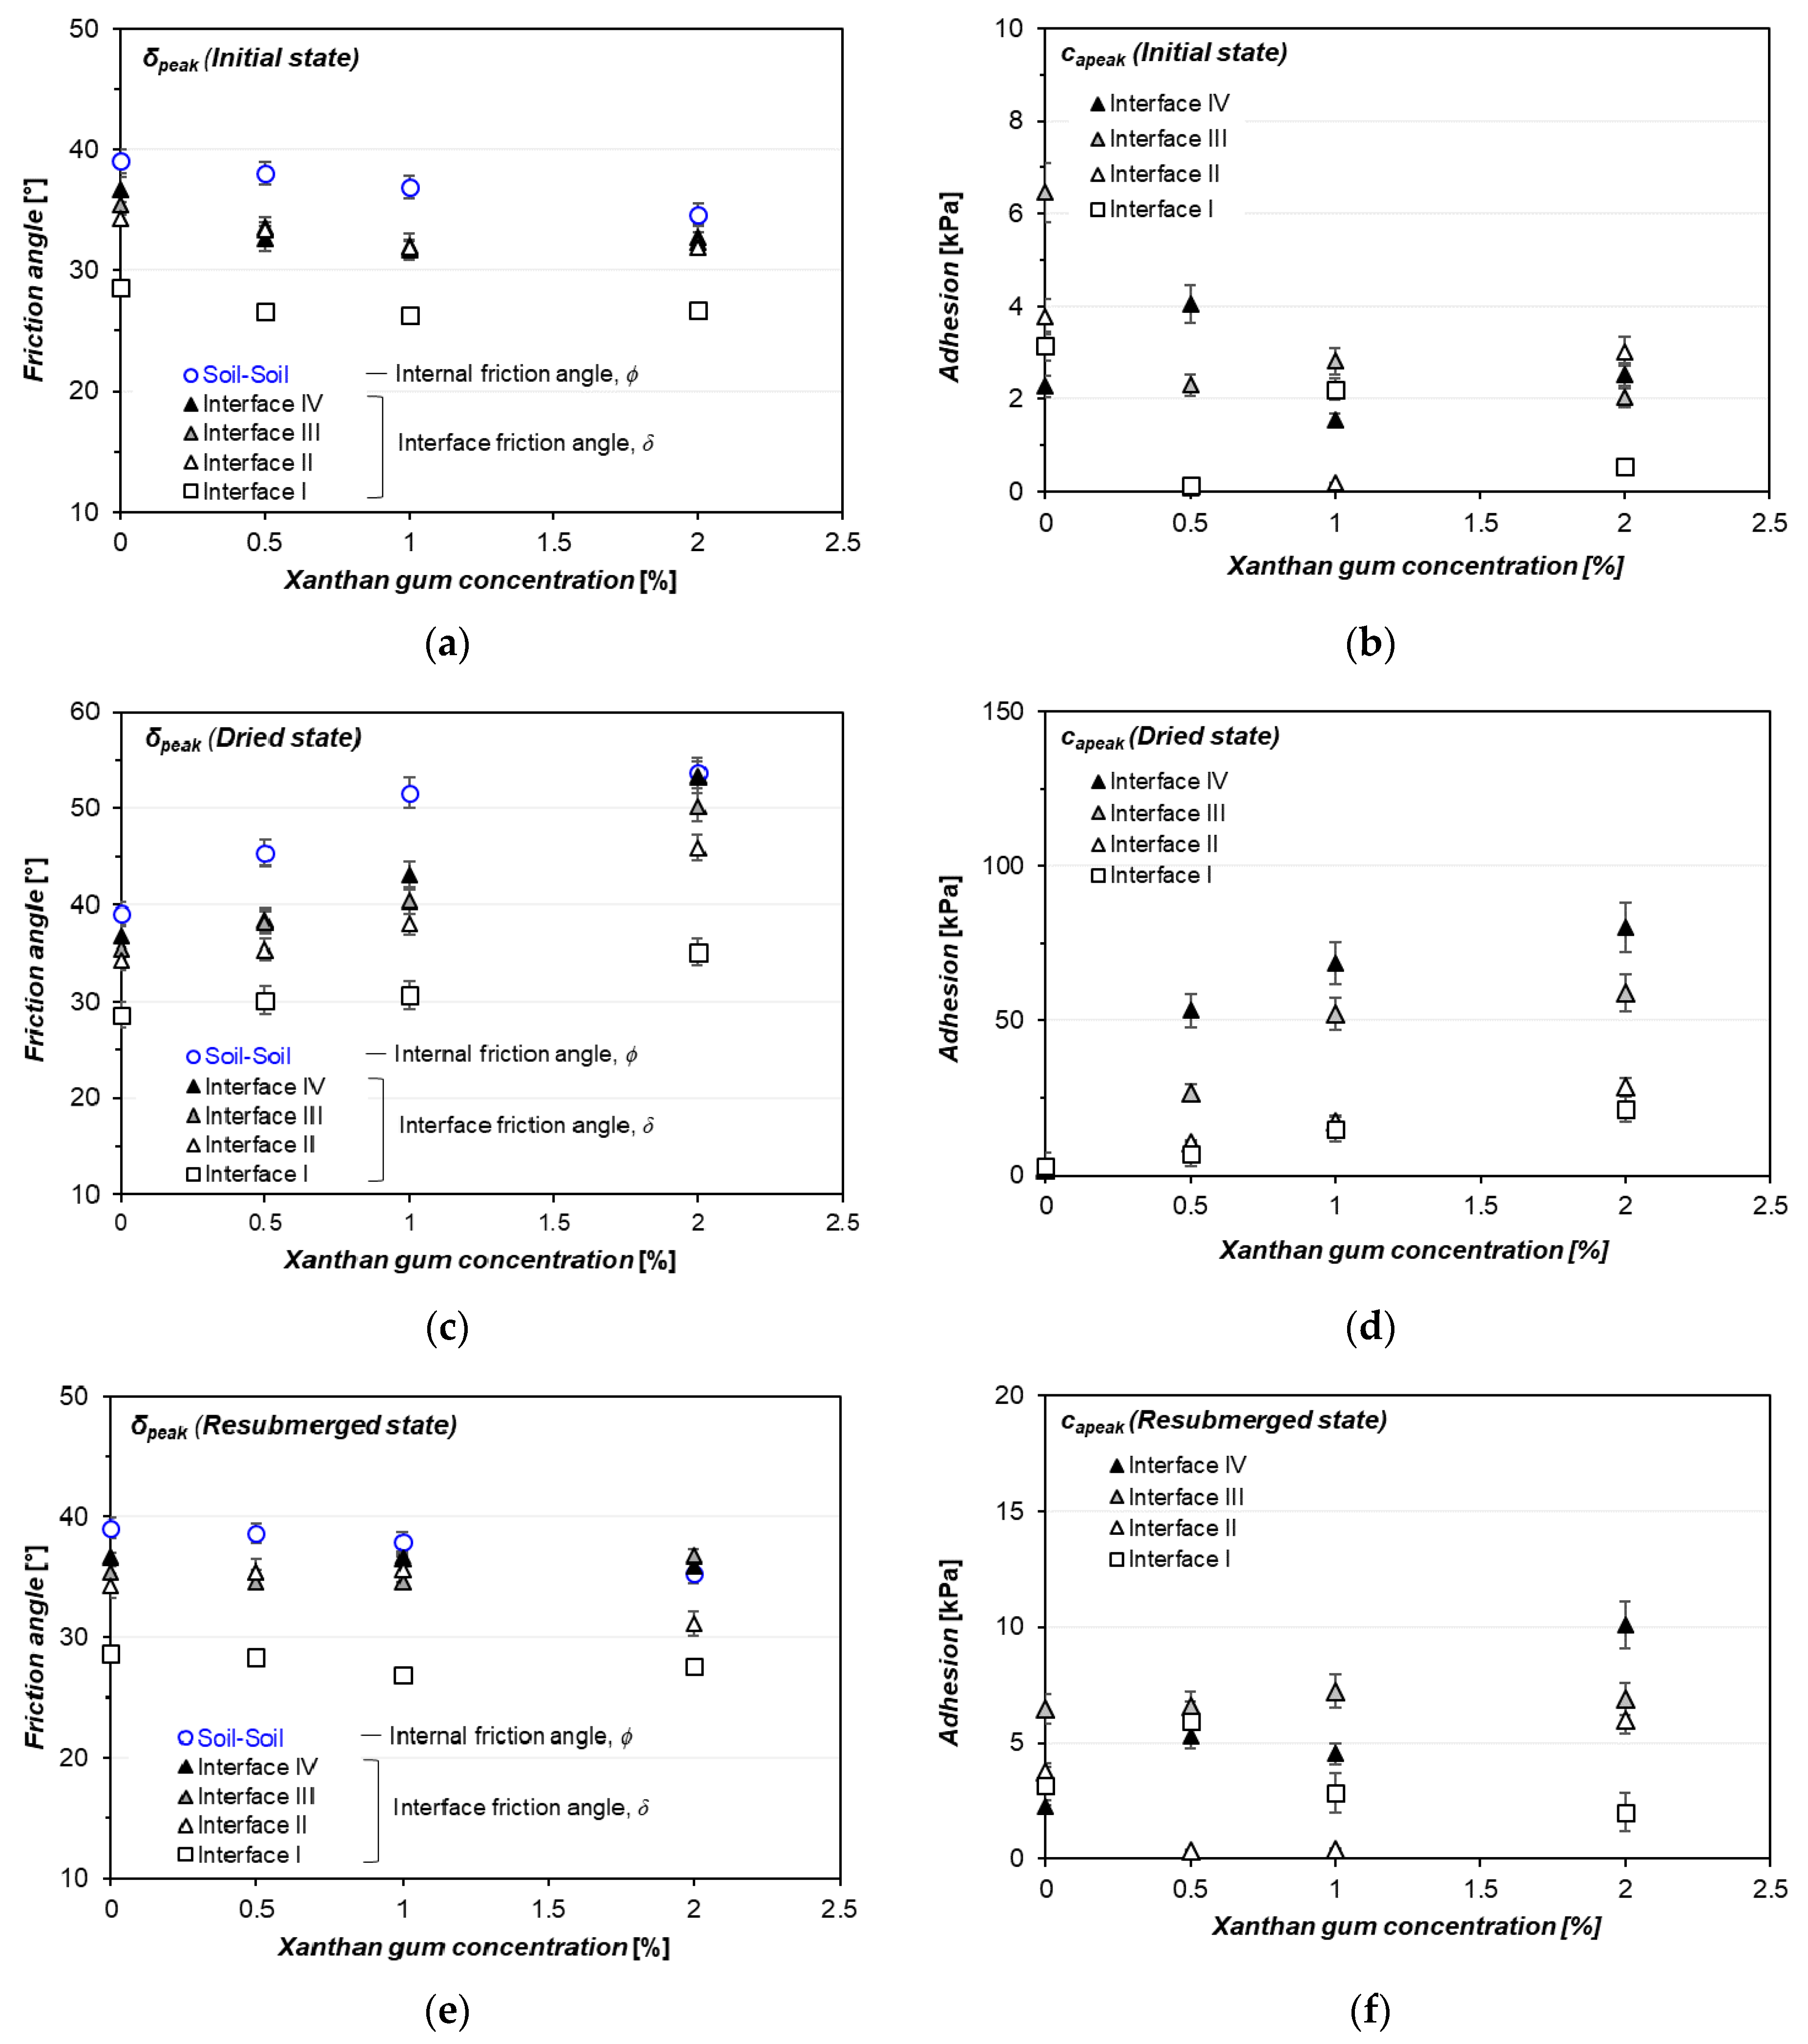
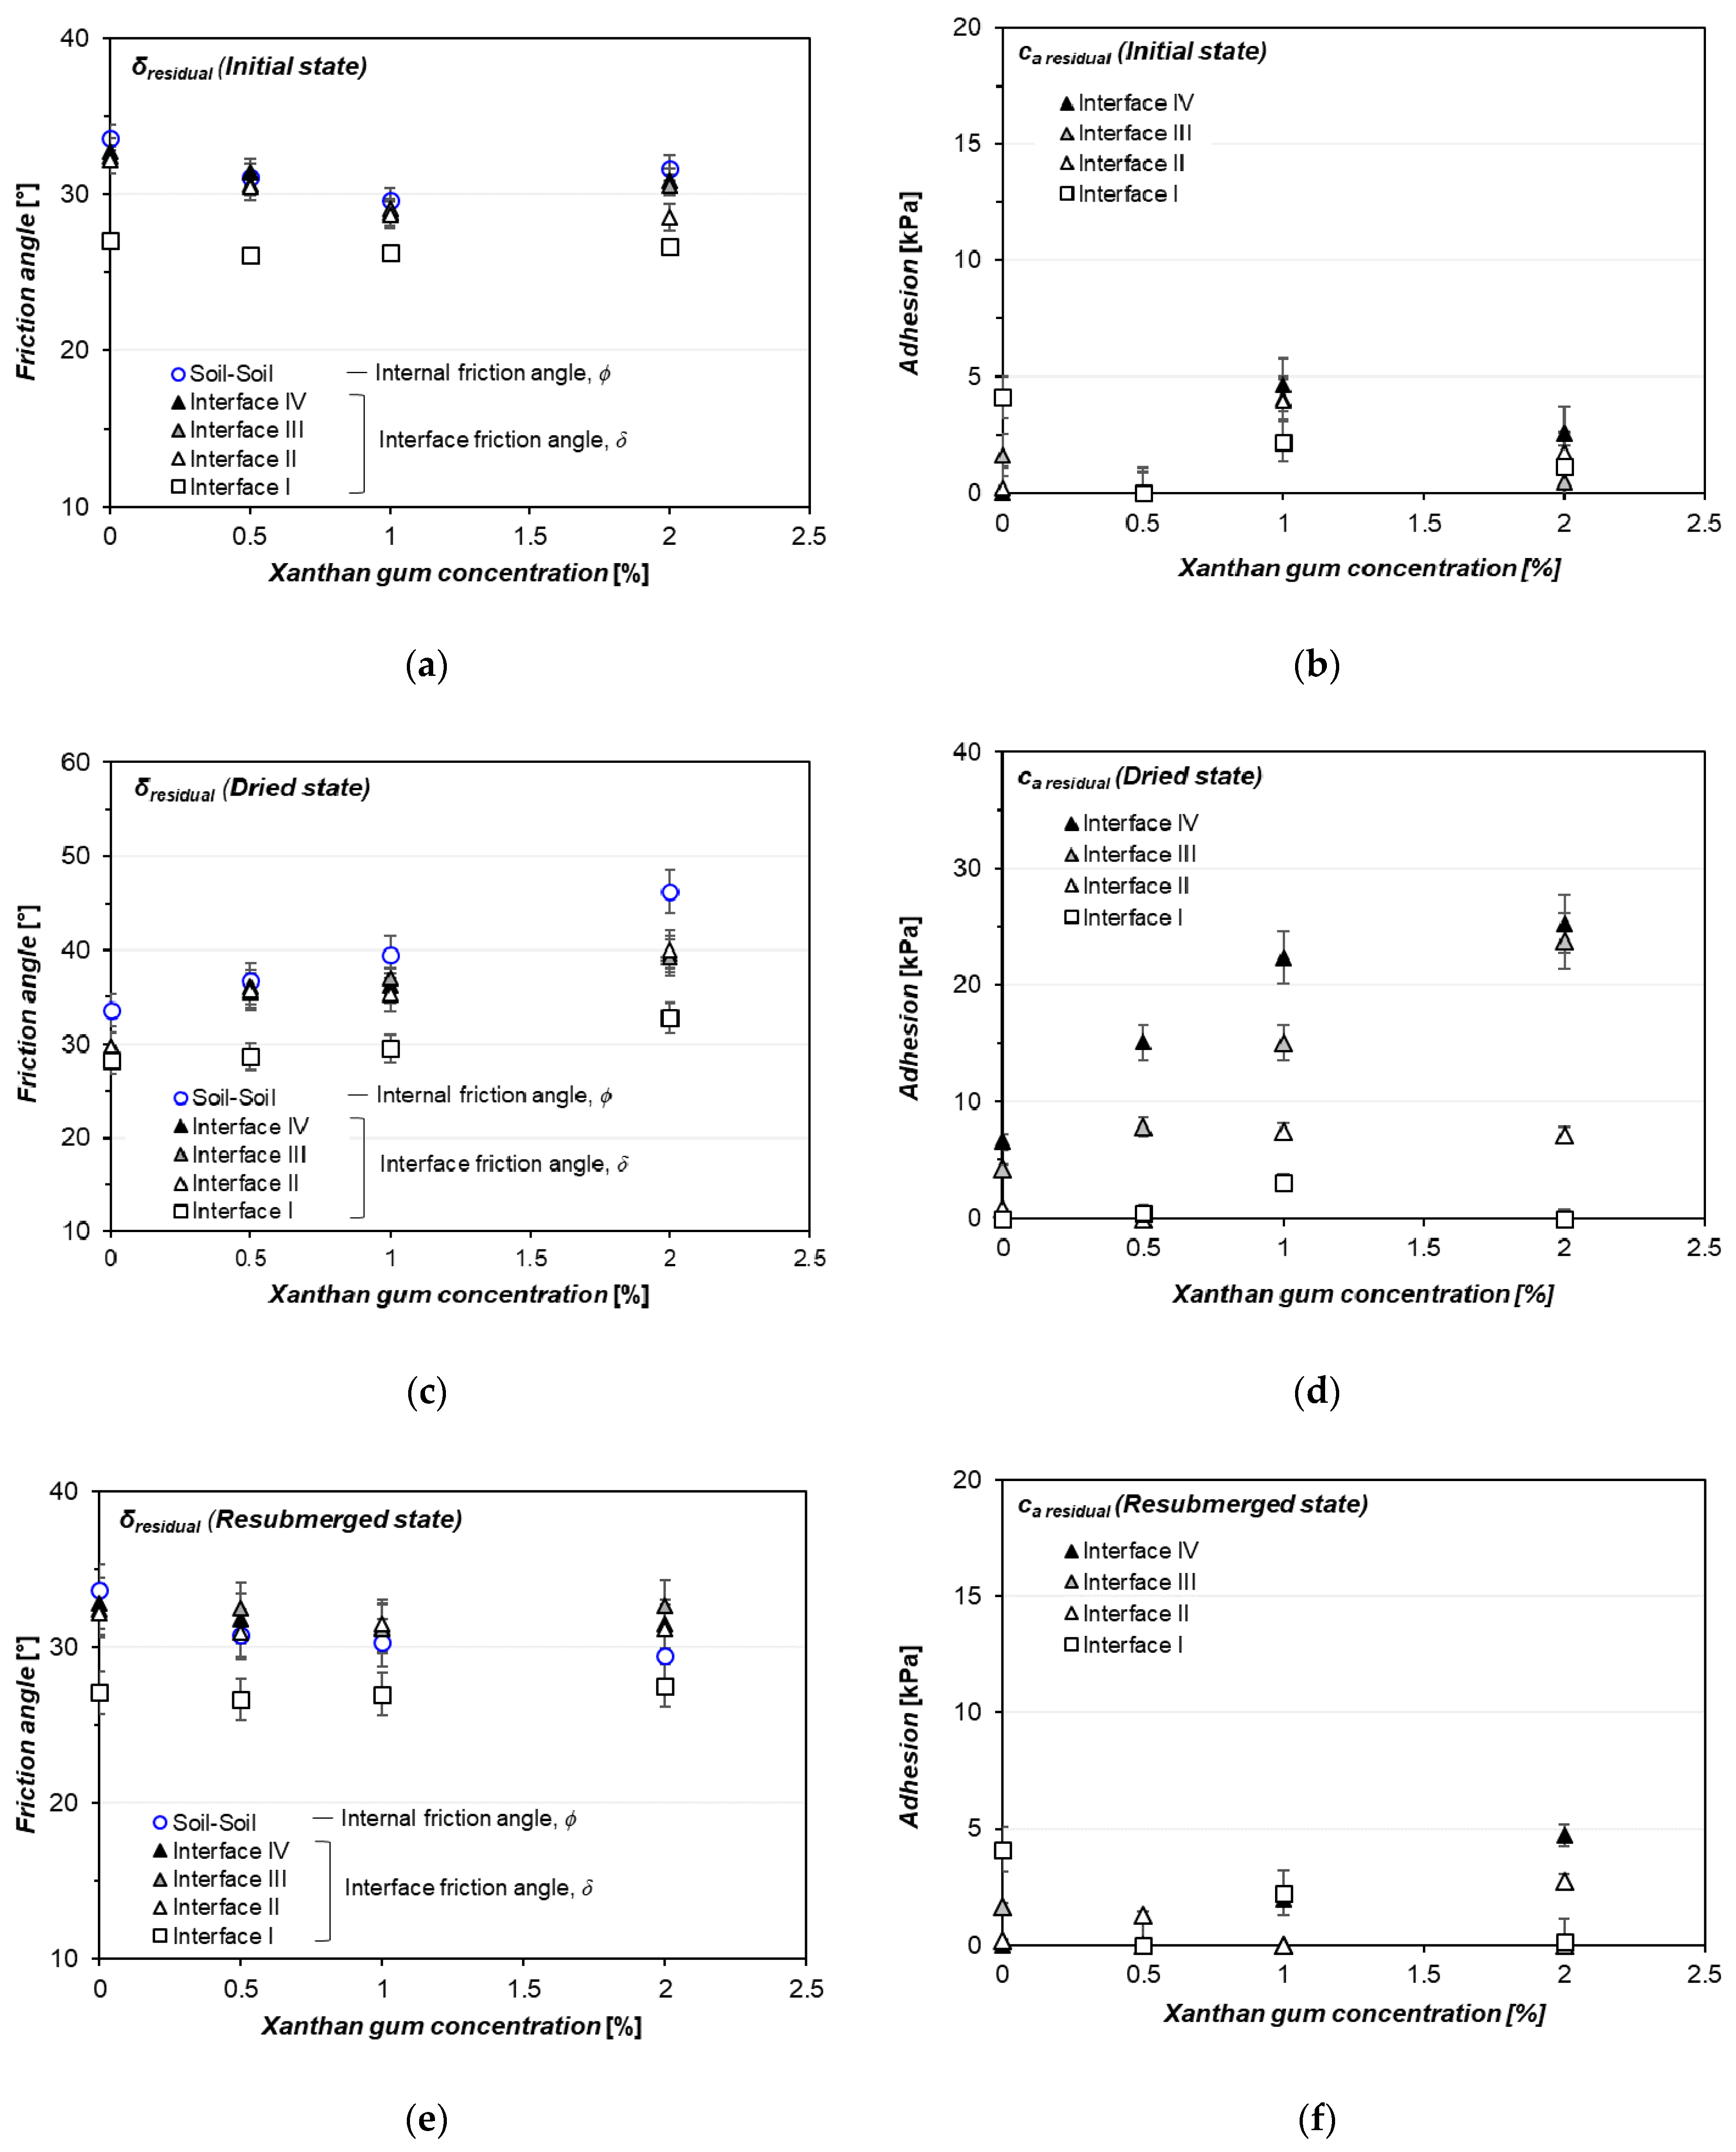
3.2. Xanthan Gum-Treated Sand Shearing at Interface without Asperities (Interface I)
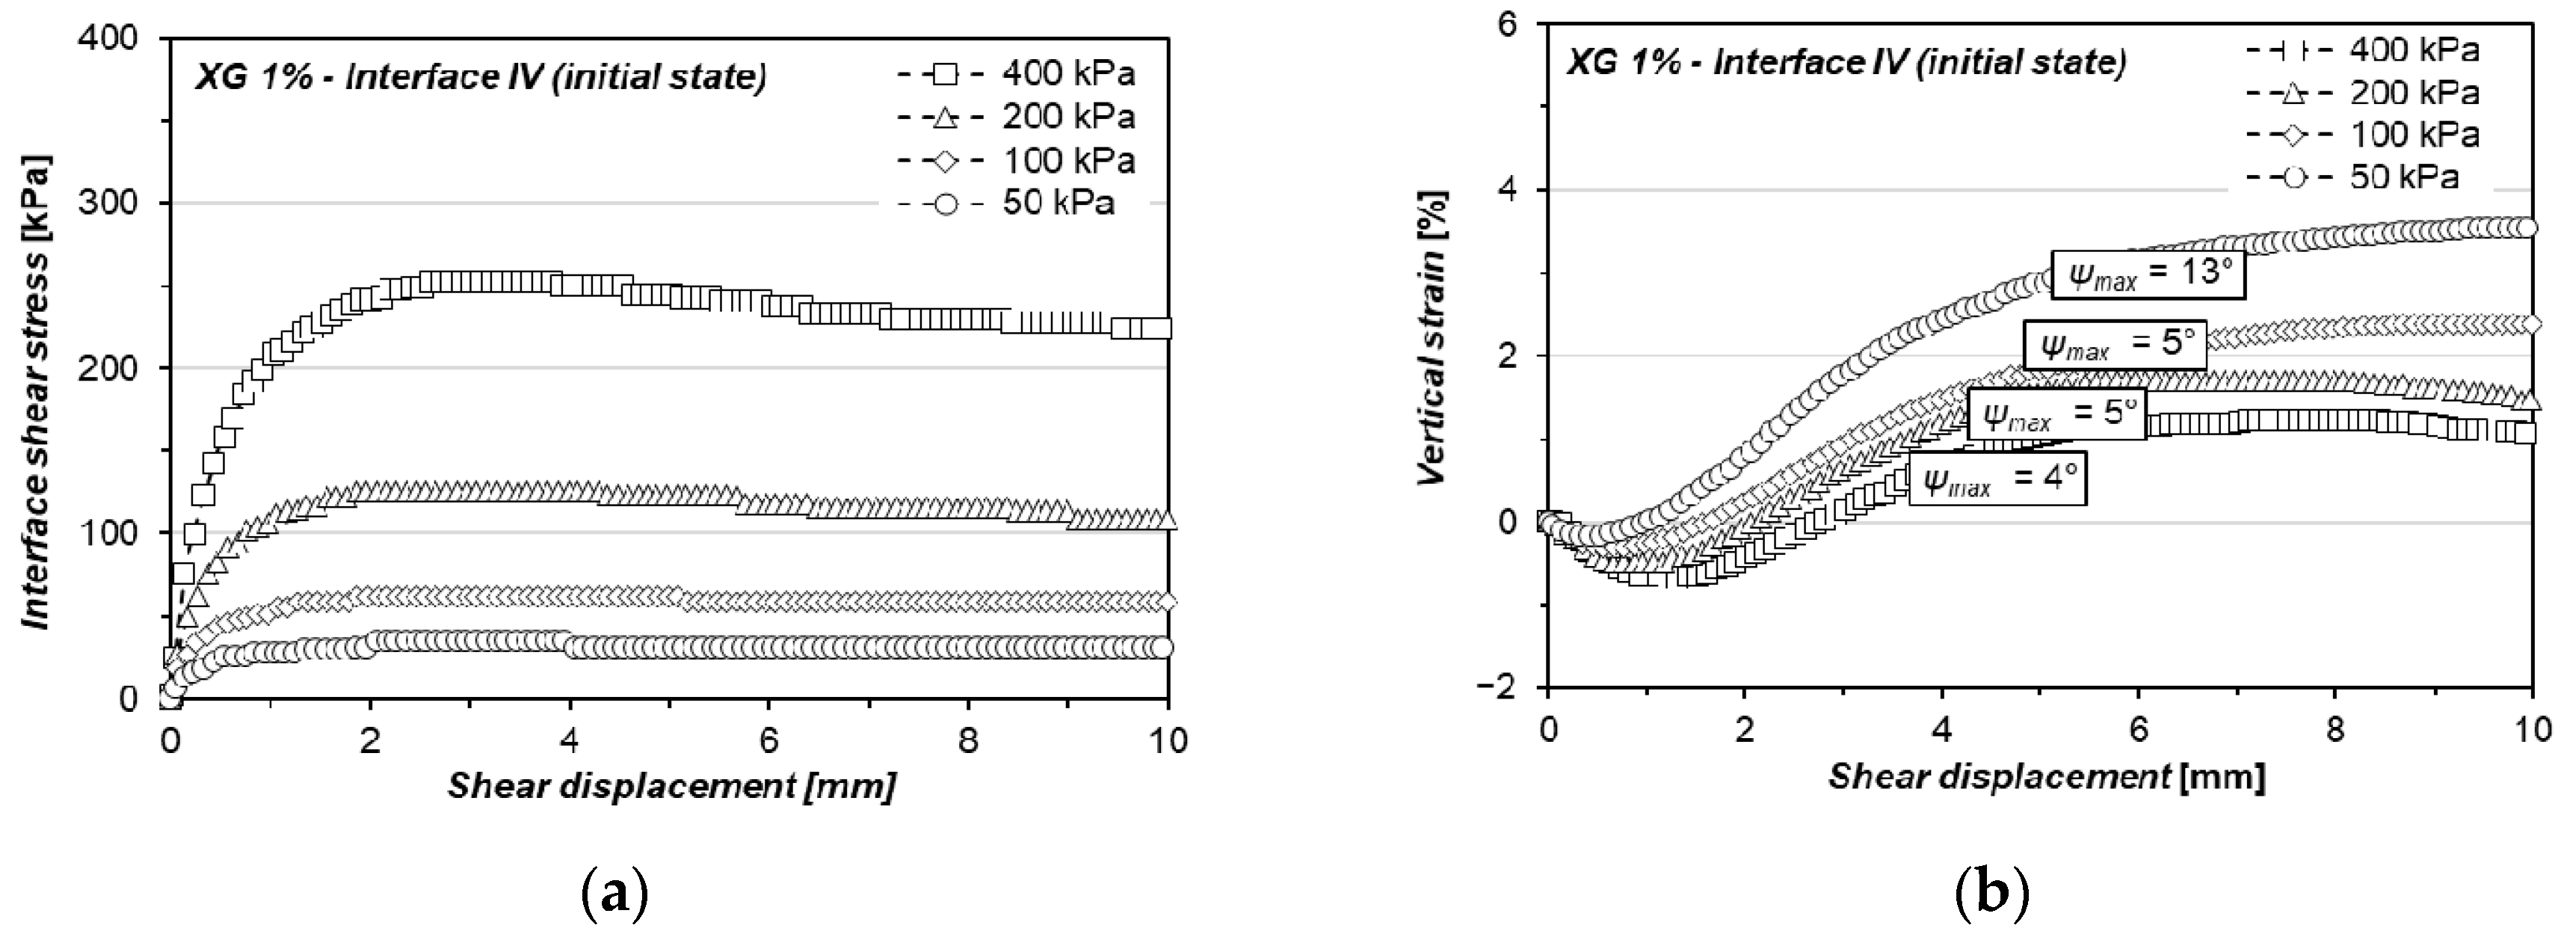
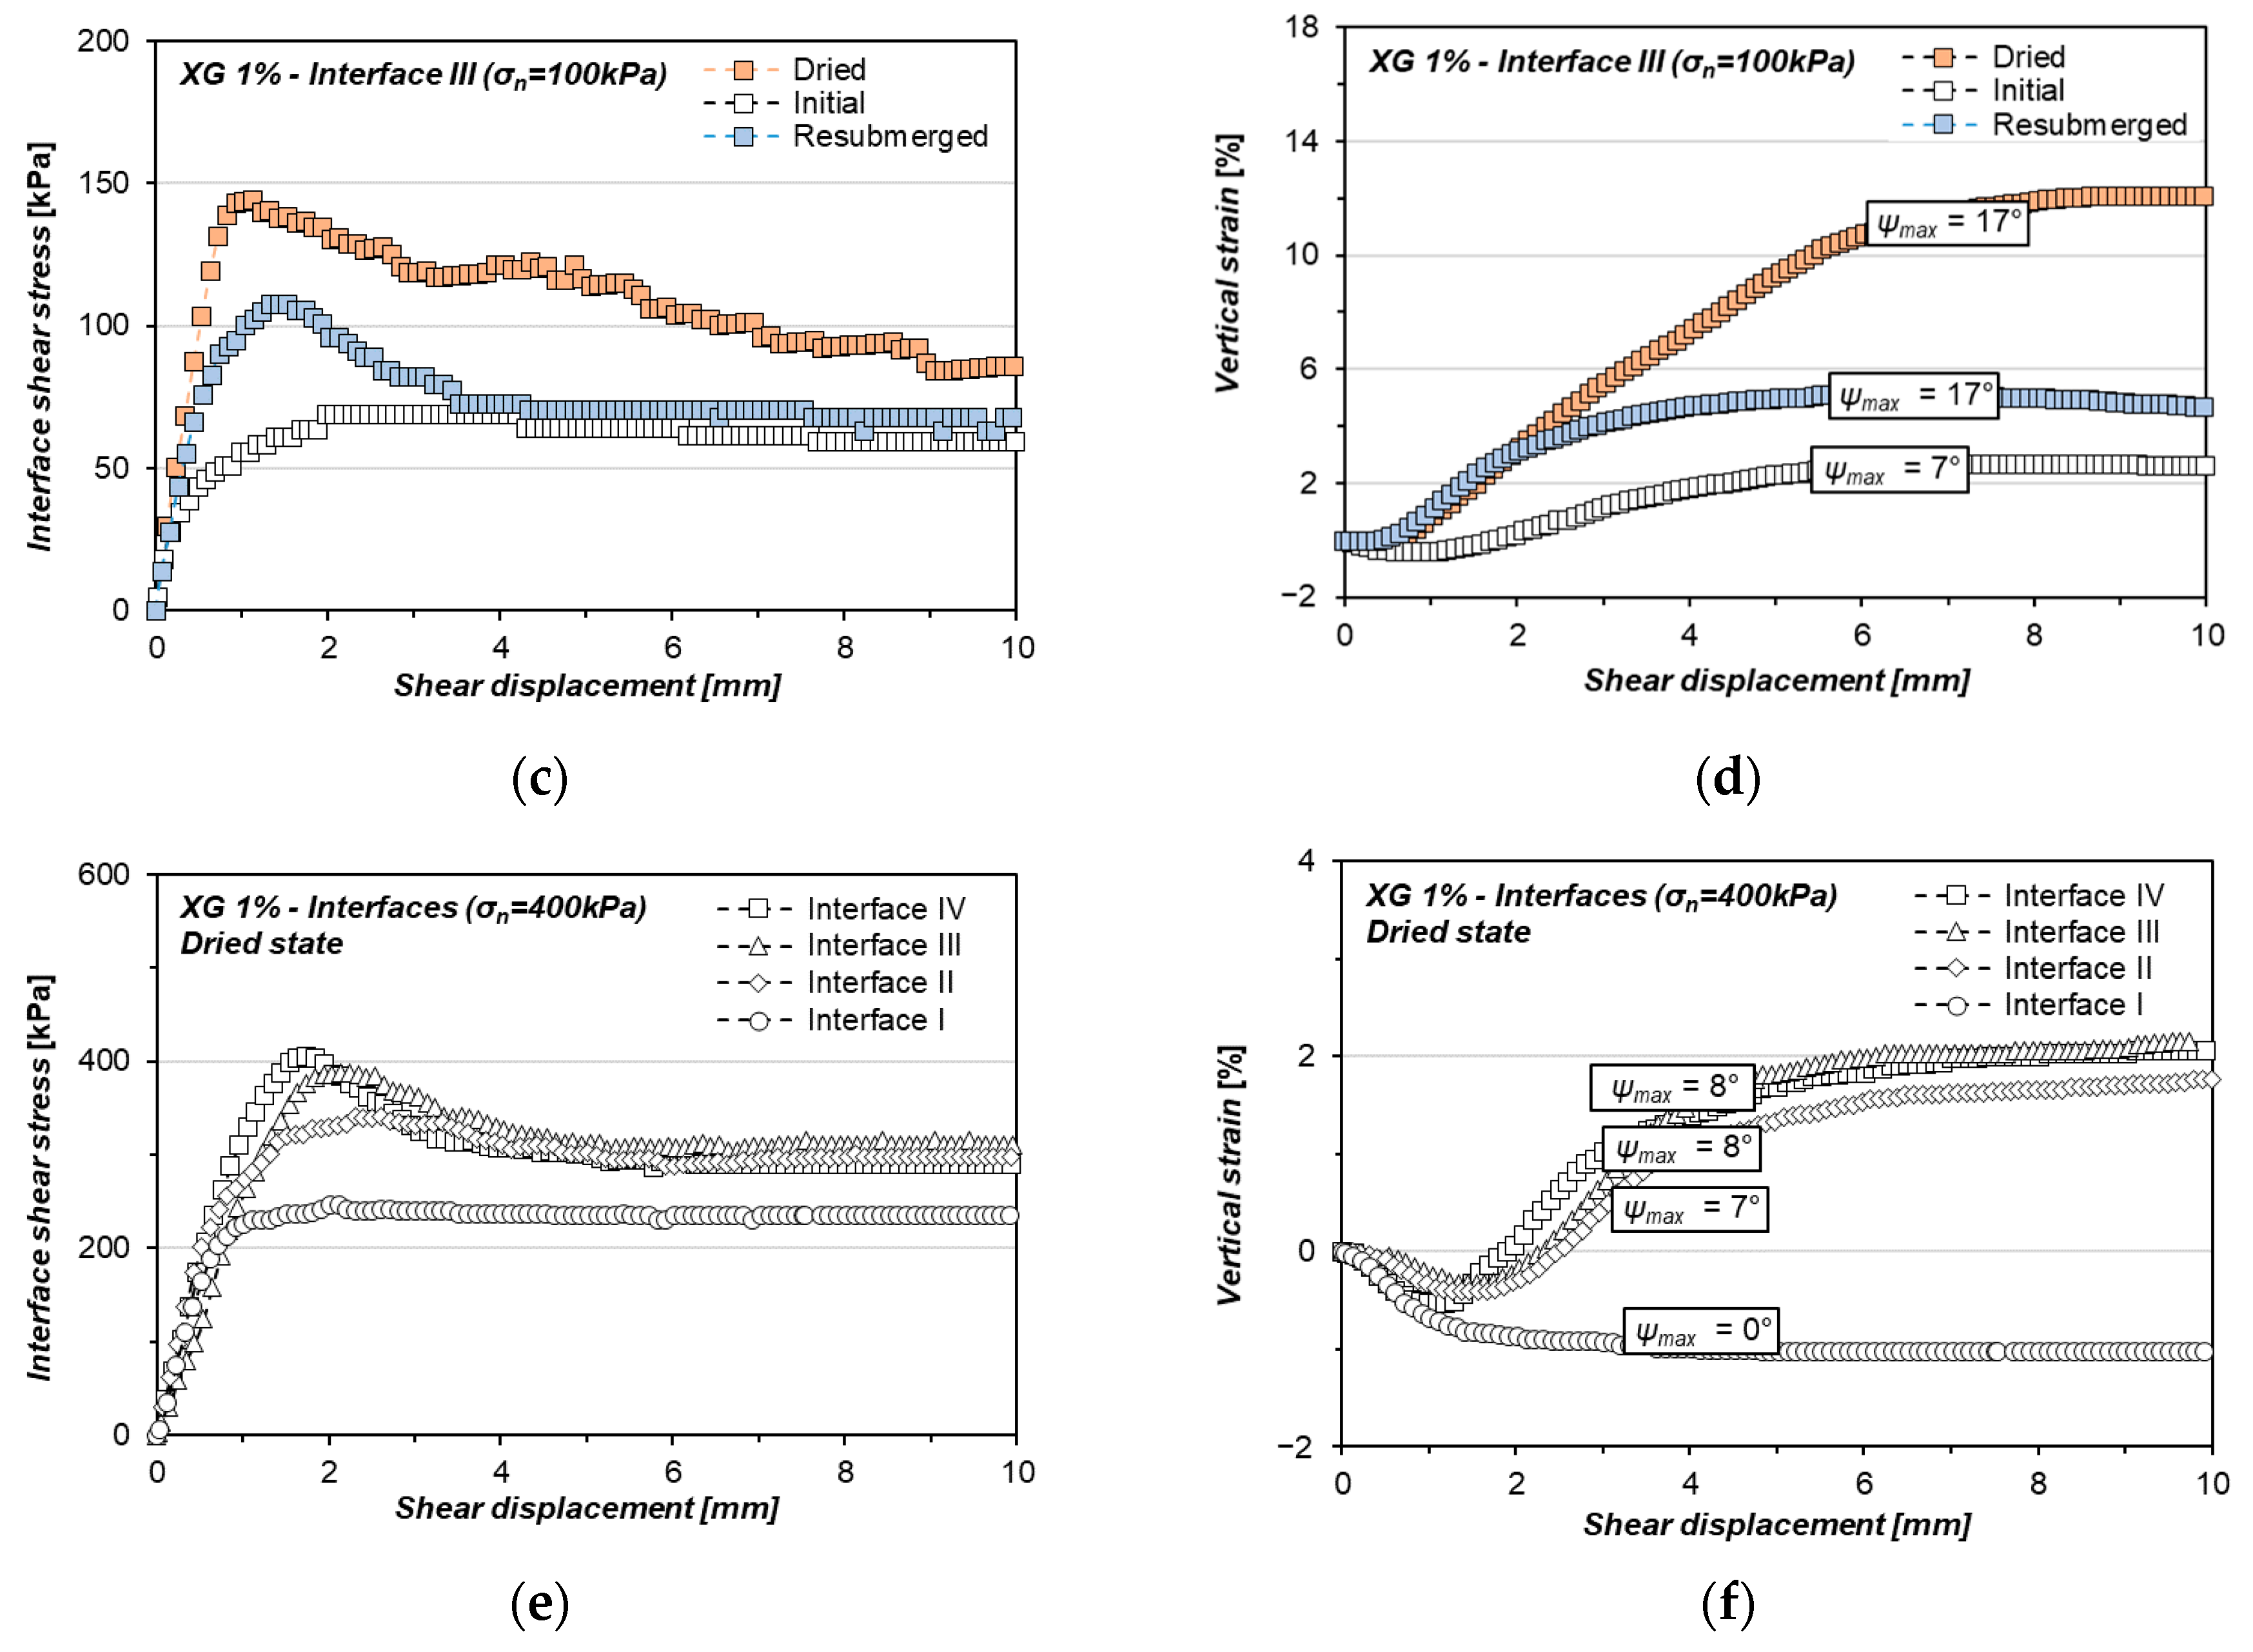
3.3. Xanthan Gum-Treated Sand Shearing at Interface with Singular Asperity
4. Discussion
4.1. Effect of Moisture Phase and Concentration of Hydrogel on the Interfacial Shearing Performance
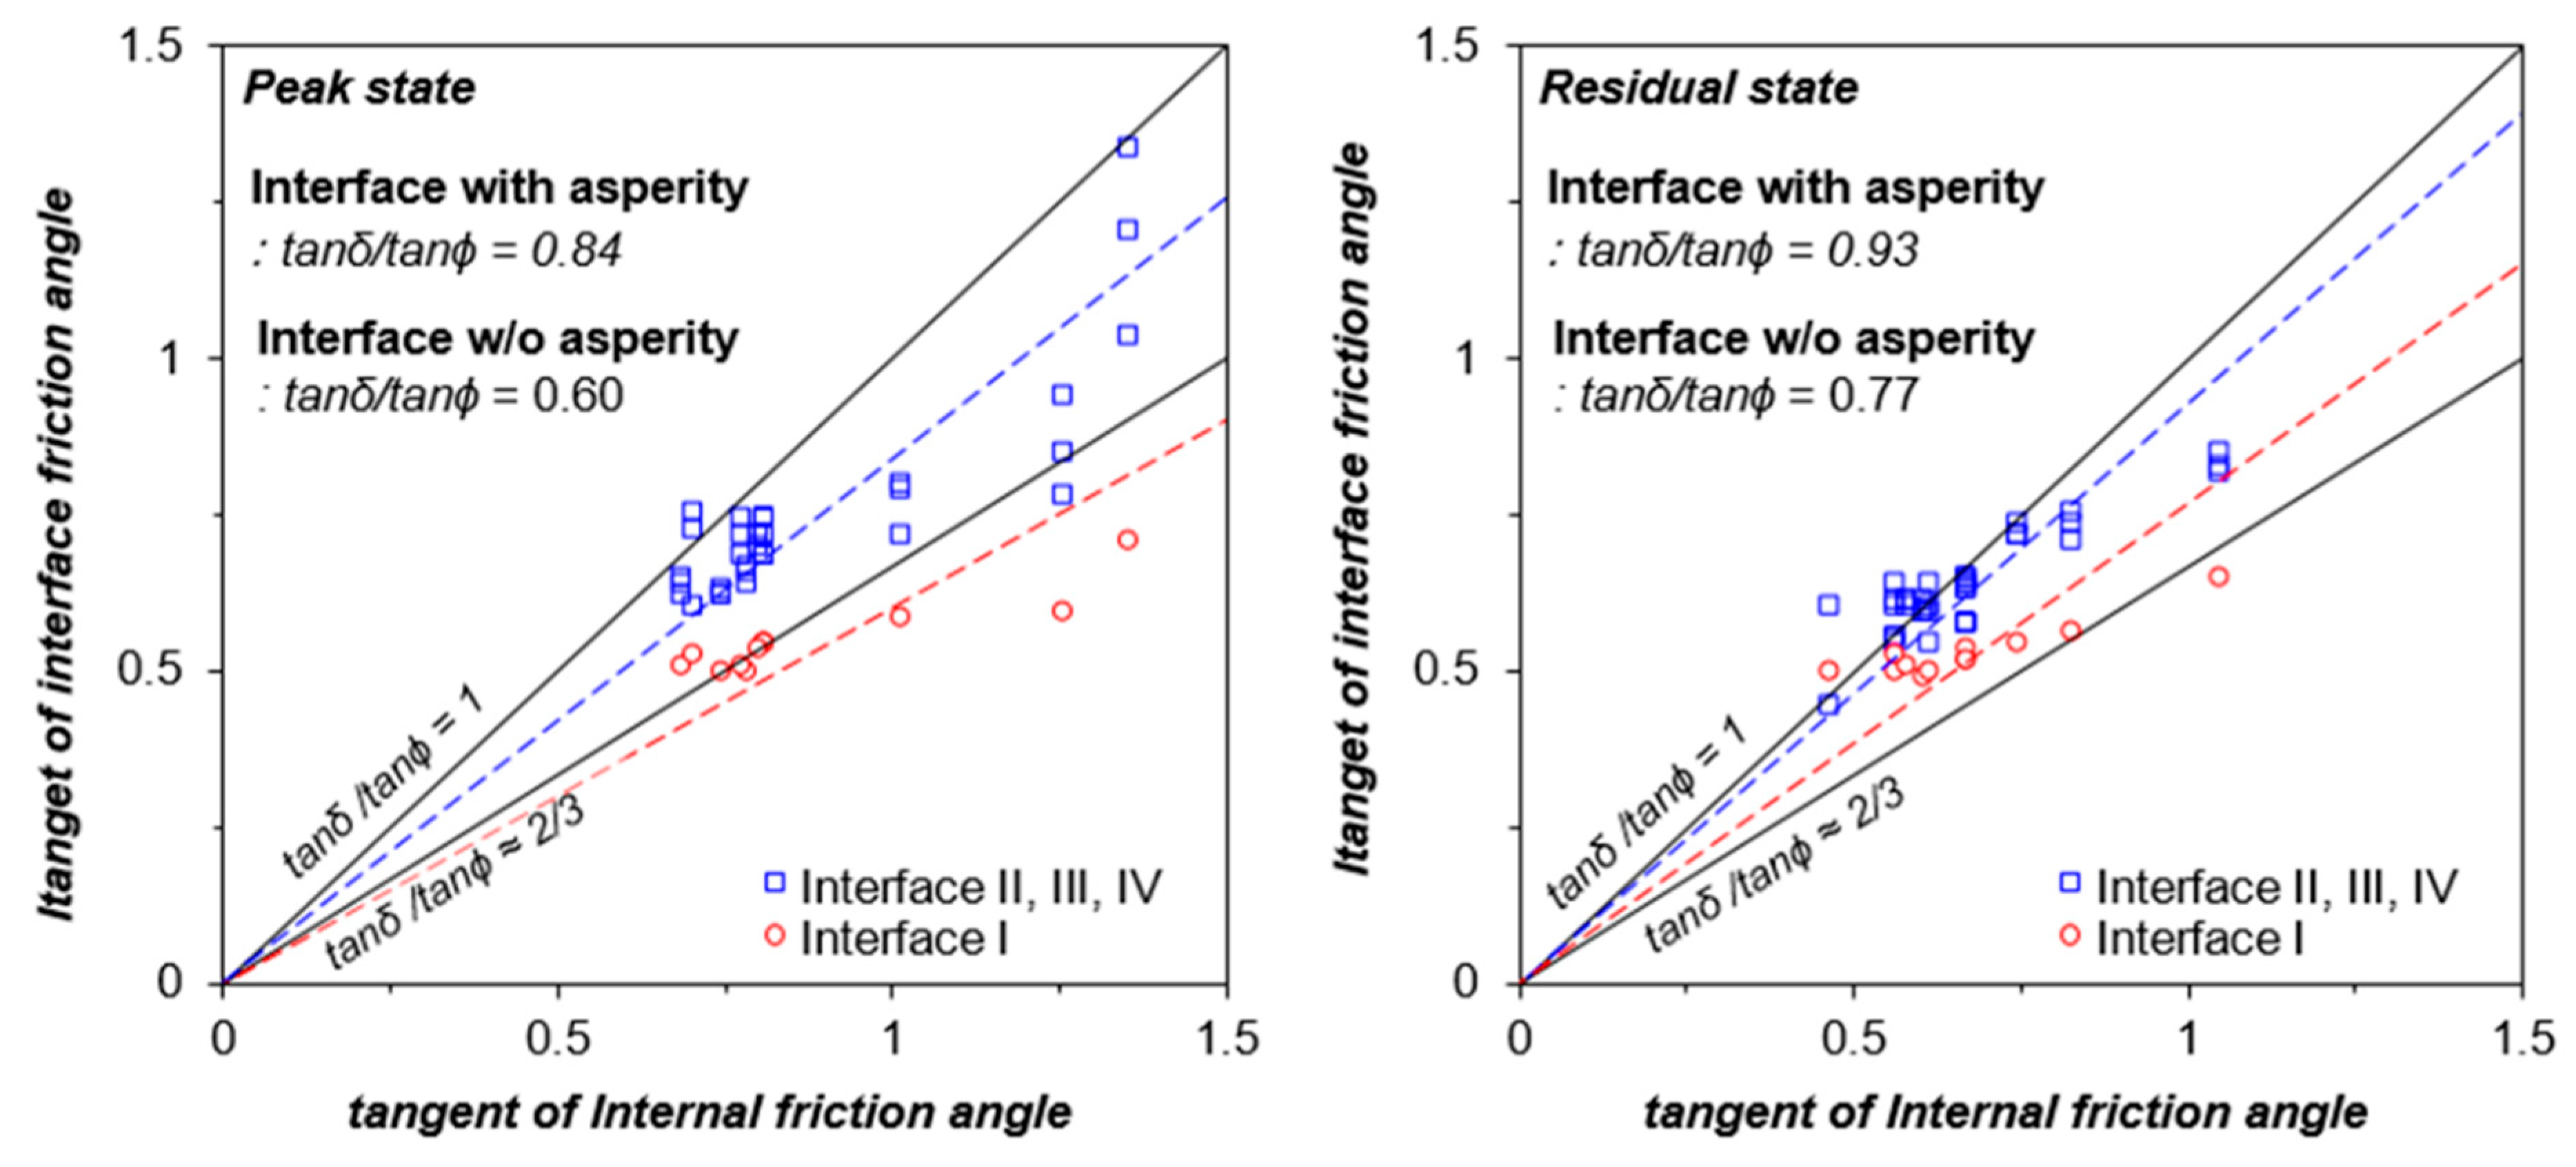
4.2. Relationship between Internal and Interface Friction Angle of Xanthan Gum-Treated Sand
5. Conclusions
Author Contributions
Funding
Data Availability Statement
Conflicts of Interest
References
- Han, F.; Ganju, E.; Salgado, R.; Prezzi, M. Effects of interface roughness, particle geometry, and gradation on the sand–steel interface friction angle. J. Geotech. Geoenviron. Eng. 2018, 144, 04018096. [Google Scholar] [CrossRef]
- Potyondy, J.G. Skin friction between various soils and construction materials. Geotechnique 1961, 11, 339–353. [Google Scholar] [CrossRef]
- Yoshimi, Y.; Kishida, T. A ring torsion apparatus for evaluating friction between soil and metal surfaces. Geotech. Test. J. 1981, 4, 145–152. [Google Scholar] [CrossRef]
- Uesugi, M.; Kishida, H.; Tsubakihara, Y. Behavior of sand particles in sand-steel friction. Soils Found. 1988, 28, 107–118. [Google Scholar] [CrossRef]
- Dove, J.E.; Frost, J.D. Peak friction behavior of smooth geomembrane-particle interfaces. J. Geotech. Geoenviron. Eng. 1999, 125, 544–555. [Google Scholar] [CrossRef]
- Frost, J.; DeJong, J.; Recalde, M. Shear failure behavior of granular–continuum interfaces. Eng. Fract. Mech. 2002, 69, 2029–2048. [Google Scholar] [CrossRef]
- Hebeler, G.L. Multi-Scale Behavior at Geomaterial Interfaces. Ph.D. Thesis, Georgia Institute of Technology, Atlanta, GA, USA, 2005. [Google Scholar]
- Tinjum, J.; Christensen, R. Site investigation, characterization and assessment for wind turbine design and construction. In Wind Energy Systems; Woodhead Publishing: Cambridge, UK, 2011; pp. 28–45. [Google Scholar]
- Das, B.M. Principles of Foundation Engineering, 8th ed.; Cengage Learning: Boston, MA, USA, 2016; 919p. [Google Scholar]
- Chang, I.; Lee, M.; Cho, G.-C. Global CO2 emission-related geotechnical engineering hazards and the mission for sustainable geotechnical engineering. Energies 2019, 12, 2567. [Google Scholar] [CrossRef]
- Chang, I.; Lee, M.; Tran, A.T.P.; Lee, S.; Kwon, Y.-M.; Im, J.; Cho, G.-C. Review on biopolymer-based soil treatment (BPST) technology in geotechnical engineering practices. Transp. Geotech. 2020, 24, 100385. [Google Scholar] [CrossRef]
- Chang, I.; Im, J.; Cho, G.C. Introduction of microbial biopolymers in soil treatment for future environmentally-friendly and sustainable geotechnical engineering. Sustainability 2016, 8, 251. [Google Scholar] [CrossRef]
- Chang, I.; Cho, G.-C. Strengthening of Korean residual soil with β-1,3/1,6-glucan biopolymer. Constr. Build. Mater. 2012, 30, 30–35. [Google Scholar] [CrossRef]
- Chang, I.; Cho, G.-C. Shear strength behavior and parameters of microbial gellan gum-treated soils: From sand to clay. Acta Geotech. 2019, 14, 361–375. [Google Scholar] [CrossRef]
- Cabalar, A.F.; Wiszniewski, M.; Skutnik, Z. Effects of xanthan gum biopolymer on the permeability, odometer, unconfined compressive and triaxial shear behavior of a sand. Soil Mech. Found. Eng. 2017, 54, 356–361. [Google Scholar] [CrossRef]
- Chang, I.; Im, J.; Prasidhi, A.K.; Cho, G.-C. Effects of xanthan gum biopolymer on soil strengthening. Constr. Build. Mater. 2015, 74, 65–72. [Google Scholar] [CrossRef]
- Chang, I.; Jeon, M.; Cho, G.-C. Application of microbial biopolymers as an alternative construction binder for earth buildings in underdeveloped countries. Int. J. Polym. Sci. 2015, 2015, 326745. [Google Scholar] [CrossRef]
- Lee, S.; Im, J.; Cho, G.-C.; Chang, I. Laboratory triaxial test behavior of xanthan gum biopolymer-treated sands. Geomech. Eng. 2019, 17, 445–452. [Google Scholar] [CrossRef]
- Tran, A.T.P.; Chang, I.; Cho, G.-C. Wetting soil-water characteristics of xanthan gum biopolymer-treated soils. Can. Geotech. J. 2019. under review. [Google Scholar]
- Kwon, Y.-M.; Ham, S.-M.; Kwon, T.-H.; Cho, G.-C.; Chang, I. Surface-erosion behaviour of biopolymer-treated soils assessed by EFA. Géotechnique Lett. 2020, 10, 1–7. [Google Scholar] [CrossRef]
- Lee, S.; Chang, I.; Chung, M.-K.; Kim, Y.; Kee, J. Geotechnical shear behavior of xanthan gum biopolymer treated sand from direct shear testing. Geomech. Eng. 2017, 12, 831–847. [Google Scholar] [CrossRef]
- Chang, I.; Im, J.; Cho, G.-C. Geotechnical engineering behaviors of gellan gum biopolymer treated sand. Can. Geotech. J. 2016, 53, 1658–1670. [Google Scholar] [CrossRef]
- Chen, C.; Wu, L.; Perdjon, M.; Huang, X.; Peng, Y. The drying effect on xanthan gum biopolymer treated sandy soil shear strength. Constr. Build. Mater. 2019, 197, 271–279. [Google Scholar] [CrossRef]
- Fatehi, H.; Abtahi, S.M.; Hashemolhosseini, H.; Hejazi, S.M. A novel study on using protein based biopolymers in soil strengthening. Constr. Build. Mater. 2018, 167, 813–821. [Google Scholar] [CrossRef]
- Zhong, L.; Oostrom, M.; Truex, M.J.; Vermeul, V.R.; Szecsody, J.E. Rheological behavior of xanthan gum solution related to shear thinning fluid delivery for subsurface remediation. J. Hazard. Mater. 2013, 244, 160–170. [Google Scholar] [CrossRef] [PubMed]
- García-Ochoa, F.; Santos, V.; Casas, J.; Gomez, E. Xanthan gum: Production, recovery, and properties. Biotechnol. Adv. 2000, 18, 549–579. [Google Scholar] [CrossRef]
- Fowmes, G.J.; Dixon, N.; Fu, L.; Zaharescu, C.A. Rapid prototyping of geosynthetic interfaces: Investigation of peak strength using direct shear tests. Geotext. Geomembr. 2017, 45, 674–687. [Google Scholar] [CrossRef]
- Cislaghi, A.; Sala, P.; Borgonovo, G.; Gandolfi, C.; Bischetti, G.B. Biodegradable Geosynthetics for Geotechnical and Geo-Environmental Engineering; Springer: Cham, Switzerland, 2020; pp. 49–57. [Google Scholar]
- Chu, L.-M.; Yin, J.-H. Comparison of interface shear strength of soil nails measured by both direct shear box tests and pullout tests. J. Geotech. Geoenviron. Eng. 2005, 131, 1097–1107. [Google Scholar] [CrossRef]
- Kishida, H.; Uesugi, M. Tests of the interface between sand and steel in the simple shear apparatus. Géotechnique 1987, 37, 45–52. [Google Scholar] [CrossRef]
- Farhadi, B.; Lashkari, A. Influence of soil inherent anisotropy on behavior of crushed sand-steel interfaces. Soils Found. 2017, 57, 111–125. [Google Scholar] [CrossRef]
- Tehrani, F.S.; Han, F.; Salgado, R.; Prezzi, M. Laboratory study of the effect of pile surface roughness on the response of soil and non-displacement piles. Geotech. Front. 2017, 2017, 256–264. [Google Scholar]
- Di Donna, A.; Ferrari, A.; Laloui, L. Experimental investigations of the soil–concrete interface: Physical mechanisms, cyclic mobilization, and behaviour at different temperatures. Can. Geotech. J. 2016, 53, 659–672. [Google Scholar] [CrossRef]
- Feng, S.-J.; Chen, J.-N.; Chen, H.-X.; Liu, X.; Zhao, T.; Zhou, A. Analysis of sand–woven geotextile interface shear behavior using discrete element method (DEM). Can. Geotech. J. 2020, 57, 433–447. [Google Scholar] [CrossRef]
- Lings, M.; Dietz, M. The peak strength of sand-steel interfaces and the role of dilation. Soils Found. 2005, 45, 1–14. [Google Scholar] [CrossRef]
- Randolph, M.F. Cyclic interface shearing in sand and cemented soils and application to axial response of piles. In Mechanical Behaviour of Soils under Environmentally Induced Cyclic Loads; Springer: Vienna, Austria, 2012; pp. 481–528. [Google Scholar]
- Dove, J.E.; Jarrett, J.B. Behavior of dilative sand interfaces in a geotribology framework. J. Geotech. Geoenviron. Eng. 2002, 128, 25–37. [Google Scholar] [CrossRef]
- Wei, X.; Ku, T. New design chart for geotechnical ground improvement: Characterizing cement-stabilized sand. Acta Geotech. 2020, 15, 999–1011. [Google Scholar] [CrossRef]
- Wei, X.; Liu, H.; Ku, T. Microscale analysis to characterize effects of water content on the strength of cement-stabilized sand–clay mixtures. Acta Geotech. 2020, 15, 2905–2923. [Google Scholar] [CrossRef]
- Chen, C.; Wu, L.; Harbottle, M. Exploring the effect of biopolymers in near-surface soils using xanthan gum–modified sand under shear. Can. Geotech. J. 2019, 1–10. [Google Scholar] [CrossRef]
- ASTM. D3080/D3080M-11: Standard Test Method for Direct Shear Test of Soils under Consolidated Drained Conditions; ASTM International: West Conshohocken, PA, USA, 2011. [Google Scholar] [CrossRef]
- Stokes, J.R.; Macakova, L.; Chojnicka-Paszun, A.; de Kruif, C.G.; de Jongh, H.H. Lubrication, adsorption, and rheology of aqueous polysaccharide solutions. Langmuir 2011, 27, 3474–3484. [Google Scholar] [CrossRef] [PubMed]
- Mitchell, J.K.; Soga, K. Fundamentals of soil Behavior, 3rd ed.; John Wiley & Sons: Hoboken, NJ, USA, 2005; 577p. [Google Scholar]
- Mitchell, J.K.; Villet, W.C. Reinforcement of earth slopes and embankments. Nchrp Rep. 1987, 6, 290. [Google Scholar]
- Williams, N.; Houlihan, M. Evaluation of Interface Friction Properties between Geosynthetics and Soils. In Proceedings of the Geosynthetics, New Orleans, LA, USA, 24 February 1987; pp. 616–627. [Google Scholar]
- Jewell, R. Soil Reinforcement with Geotextiles; Construction Industry Research and Information Association: London, UK, 1996. [Google Scholar]
- Puri, A. The friction coefficient of cohesive soils and geotextile: An approach based on the direct shear test data. Jurnal Saintis 2017, 17, 33–42. [Google Scholar]




| Mean Grain Size D50 [mm] | Specific Gravity Gs [-] | Coefficient of Uniformity Cu [-] | Coefficient of Curvature Cc [-] | Maximum Void Ratio emax [-] | Minimum Void Ratio emin [-] | USCS |
|---|---|---|---|---|---|---|
| 0.47 | 2.65 | 1.12 | 0.98 | 0.95 | 0.644 | SP |
| Interface Condition (Type) | Rn in mm (D50) | References |
|---|---|---|
| Rn in this study | 0.12 (D50 = 0.47) | |
| Very rough steel | 0.43 (D50 = 0.65) | [31] |
| Rough steel | 0.17 (D50 = 0.65) | |
| Intermediate steel | 0.08 (D50 = 0.65) | |
| Smooth steel | 0.03 (D50 = 0.65) | |
| Brass | 0.03 (D50 = 0.65) | [32] |
| #120 Sand paper | 0.26 (D50 = 0.65) | |
| #50 Sand paper | 1.14 (D50 = 0.65) | |
| Smooth concrete | 0.002 (D50 = 0.5) | [33] |
| Medium concrete | 0.12 (D50 = 0.5) | |
| Rough concrete | 0.2 (D50 = 0.5) | |
| Smooth woven geotextile | 0.03 (D50 = 0.65) | [34] |
| Moderately rough woven geotextile | 0.19 (D50 = 0.65) | |
| Rougher woven geotextile | 0.30 (D50 = 0.65) |
| Variables | Direct Shear Test | Interface Shear Test |
|---|---|---|
| Shearing condition | Soil–soil | Soil–solid structure |
| Moisture state | Initial state Dried state Resubmerged state | Initial state Dried state Resubmerged state |
| Xanthan gum concentration [MXG/MS,%] | 0, 0.5, 1, 2 | 0, 0.5, 1, 2 |
| Vertical confinement pressure [kPa] | 50, 100, 200, 400 | 50, 100, 200, 400 |
| Hydrogel State | Xanthan Gum MXG/MS [%] | Peak Strength | Residual Strength | ||
|---|---|---|---|---|---|
| Cohesion [kPa] | Friction Angle [°] | Cohesion [kPa] | Friction Angle [°] | ||
| Initial | 0.0 | <1 | 39.0 | <1 | 33.6 |
| 0.5 | 2.5 | 38.1 | <1 | 31.1 | |
| 1.0 | 8.5 | 36.9 | <1 | 29.6 | |
| 2.0 | 23.2 | 34.6 | <1 | 31.7 | |
| Dried (Initial → Dried) | 0.0 | <1 | 39.0 | <1 | 33.6 |
| 0.5 | 117.1 | 45.4 | 28.2 | 36.8 | |
| 1.0 | 307.7 | 51.6 | 34.9 | 39.5 | |
| 2.0 | 563.7 | 53.7 | 45.1 | 46.3 | |
| Resubmerged (Initial → Dried → Resubmerged) | 0.0 | <1 | 39.0 | <1 | 33.6 |
| 0.5 | 11.4 | 38.6 | 3.6 | 30.7 | |
| 1.0 | 23.3 | 37.9 | 12.8 | 30.3 | |
| 2.0 | 41.1 | 35.3 | 21.7 | 29.4 | |
| Hydrogel State | MXG/MS [%] | Peak Strength | Residual Strength | ||
|---|---|---|---|---|---|
| Adhesion [kPa] | Interface Friction Angle [°] | Adhesion [kPa] | Interface Friction Angle [°] | ||
| Initial | 0.0 | 3.1 | 28.6 | 4.1 | 27.1 |
| 0.5 | <1 | 26.610 | <1 | 26.1 | |
| 1.0 | 2.2 | 26.3 | 2.2 | 26.3 | |
| 2.0 | <1 | 26.7 | 1.2 | 26.6 | |
| Dried (1) | 0.0 | 3.2 | 28.6 | <1 | 28.3 |
| 0.5 | 7.1 | 30.1 | <1 | 28.7 | |
| 1.0 | 15.1 | 30.7 | 3.1 | 29.6 | |
| 2.0 | 21.5 | 35.1 | <1 | 32.8 | |
| Resubmerged (2) | 0.0 | 3.1 | 28.6 | 4.1 | 27.1 |
| 0.5 | <1 | 28.3 | <1 | 26.6 | |
| 1.0 | 2.8 | 26.9 | 2.3 | 27.0 | |
| 2.0 | 2.0 | 27.6 | <1 | 27.5 | |
| Interface | Hydrogel State | MXG/MS [%] | Peak Strength | Residual Strength | ||
|---|---|---|---|---|---|---|
| Adhesion [kPa] | Interface Friction Angle [°] | Adhesion [kPa] | Interface Friction Angle [°] | |||
| Interface II | Initial | 0.0 | 3.8 | 34.3 | 0.2 | 32.2 |
| 0.5 | <1 | 33.4 | <1 | 30.5 | ||
| 1.0 | <1 | 31.9 | 4.0 | 28.7 | ||
| 2.0 | 3.0 | 31.9 | 1.7 | 28.5 | ||
| Dried | 0.0 | 2.6 | 34.3 | <1 | 29.7 | |
| 0.5 | 10.5 | 35.4 | <1 | 35.7 | ||
| 1.0 | 17.6 | 38.0 | 7.4 | 35.3 | ||
| 2.0 | 28.7 | 45.9 | 7.1 | 39.4 | ||
| Resubmerged | 0.0 | 3.8 | 34.3 | <1 | 32.2 | |
| 0.5 | <1 | 35.4 | 1.3 | 30.9 | ||
| 1.0 | <1 | 35.7 | <1 | 31.5 | ||
| 2.0 | 6.0 | 31.1 | 2.8 | 31.2 | ||
| Interface III | Initial | 0.0 | 6.5 | 35.5 | 1.6 | 32.4 |
| 0.5 | 2.3 | 33.6 | <1 | 30.7 | ||
| 1.0 | 2.8 | 31.7 | 4.1 | 29.0 | ||
| 2.0 | 2.0 | 32.4 | 0.5 | 30.6 | ||
| Dried | 0.0 | 1.8 | 35.5 | 4.2 | 29.7 | |
| 0.5 | 26.6 | 38.2 | 7.9 | 36.1 | ||
| 1.0 | 52.2 | 40.4 | 15.1 | 37.0 | ||
| 2.0 | 59.0 | 50.2 | 23.8 | 39.2 | ||
| Resubmerged | 0.0 | 6.5 | 35.5 | 1.6 | 32.4 | |
| 0.5 | 6.6 | 34.6 | <1 | 32.5 | ||
| 1.0 | 7.2 | 34.5 | <1 | 31.2 | ||
| 2.0 | 6.9 | 36.8 | <1 | 32.6 | ||
| Interface IV | Initial | 0.0 | 2.3 | 36.7 | <1 | 32.8 |
| 0.5 | 4.0 | 32.6 | <1 | 31.4 | ||
| 1.0 | 1.5 | 32.0 | 4.6 | 28.8 | ||
| 2.0 | 2.5 | 32.8 | 2.6 | 30.9 | ||
| Dried | 0.0 | 2.0 | 36.7 | 6.6 | 29.8 | |
| 0.5 | 53.2 | 38.5 | 15.1 | 35.4 | ||
| 1.0 | 68.6 | 43.2 | 22.3 | 36.2 | ||
| 2.0 | 80.0 | 53.3 | 25.2 | 39.6 | ||
| Resubmerged | 0.0 | 2.3 | 36.7 | <1 | 32.8 | |
| 0.5 | 5.3 | 35.4 | <1 | 31.8 | ||
| 1.0 | 4.5 | 36.6 | 2.0 | 31.2 | ||
| 2.0 | 10.1 | 35.9 | 4.7 | 31.5 | ||
Publisher’s Note: MDPI stays neutral with regard to jurisdictional claims in published maps and institutional affiliations. |
© 2020 by the authors. Licensee MDPI, Basel, Switzerland. This article is an open access article distributed under the terms and conditions of the Creative Commons Attribution (CC BY) license (http://creativecommons.org/licenses/by/4.0/).
Share and Cite
Lee, M.; Im, J.; Cho, G.-C.; Ryu, H.H.; Chang, I. Interfacial Shearing Behavior along Xanthan Gum Biopolymer-Treated Sand and Solid Interfaces and Its Meaning in Geotechnical Engineering Aspects. Appl. Sci. 2021, 11, 139. https://doi.org/10.3390/app11010139
Lee M, Im J, Cho G-C, Ryu HH, Chang I. Interfacial Shearing Behavior along Xanthan Gum Biopolymer-Treated Sand and Solid Interfaces and Its Meaning in Geotechnical Engineering Aspects. Applied Sciences. 2021; 11(1):139. https://doi.org/10.3390/app11010139
Chicago/Turabian StyleLee, Minhyeong, Jooyoung Im, Gye-Chun Cho, Hee Hwan Ryu, and Ilhan Chang. 2021. "Interfacial Shearing Behavior along Xanthan Gum Biopolymer-Treated Sand and Solid Interfaces and Its Meaning in Geotechnical Engineering Aspects" Applied Sciences 11, no. 1: 139. https://doi.org/10.3390/app11010139
APA StyleLee, M., Im, J., Cho, G.-C., Ryu, H. H., & Chang, I. (2021). Interfacial Shearing Behavior along Xanthan Gum Biopolymer-Treated Sand and Solid Interfaces and Its Meaning in Geotechnical Engineering Aspects. Applied Sciences, 11(1), 139. https://doi.org/10.3390/app11010139


