Article

Jumping Flying Distance and Jump Performance of Elite Male Volleyball Players at FIVB Volleyball Men’s World Championship

1
Department of Biological and Motor Sport Bases, University School of Physical Education in Wroclaw, 51-612 Wroclaw, Poland
2
Department of Paralympics Sports, University School of Physical Education in Wroclaw, 51-612 Wroclaw, Poland
3
Department of Track and Field, University School of Physical Education in Wroclaw, 51-612 Wroclaw, Poland
4
Faculty of Architecture, Wroclaw University of Science and Technology in Wroclaw, 50-317 Wroclaw, Poland
*
Author to whom correspondence should be addressed.
Appl. Sci. 2020, 10(6), 2045; https://doi.org/10.3390/app10062045
Submission received: 18 February 2020 / Revised: 11 March 2020 / Accepted: 14 March 2020 / Published: 18 March 2020
(This article belongs to the Special Issue Digital Motion in Sports)

Abstract

:
We investigated different specific jumping performances of high-level male volleyball players. The aim of this study was to assess covered jumping distance, jump height, and number of jumps performed at certain positions by volleyball players competing at the 2014 FIVB Volleyball Men’s World Championship in Poland. A total of 140 male volleyball players from national teams participated in the study. The analysis was performed for jumping flying distance (JFD), jump serve height (SJH), attack jump height (AJH), block jump height (BJH), and quantity of jumps (JC). The analysis of JFD of attack jumps showed that the middles covered a shorter distance than the other players. When analyzing the block jump lengths, distance during jump performance covered by the receivers (R1) was shorter than that of the opposites. Analysis of SJH by volleyball players at various positions showed statistically significant differences (P < 0.05) among the middles (M1, M2), receivers (R1, R2), and opposites (O). Statistically significant differences (P < 0.05) in BJH were found between the middles and the rest of the players. The results of the experiment show a high degree of reliability for jump height during serve and attack, jumping flying distance covered during an attack, and number of block jumps. The strongest relationship was seen between jump components, which predominantly depend only on a volleyball player performing a specific action (e.g., jump serve or attack jump).

1. Introduction

Volleyball is a team sport where explosive movements such as an attack jump, block jump, and jump serve dominate [1,2]. Jumping abilities combined with technical and tactical skills, as well as body build of player (body height and body mass), are considered to be the most important determinants of winning a volleyball championship [3]. A player’s dynamic and speed movements are dominant during attacks and blocks. In most cases, these well-executed actions determine the number of points scored during a game and a match win [4]. Therefore, the players’ maximal reach ability—performing actions predominantly high above the net during an attack jump or block jump—is a key determinant of their effective performance [5].
In most cases, to define the levels of a volleyball player’s jumping abilities we apply tests of predominantly various types of jumps (single maximum performance) ranging from the most popular countermovement jump (CMJ) to squad jump (SJ). It is possible to assess these jump performances through laboratory tests using dynamometric platforms, and photocells or field-testing, such as assessing jumps performed to reach the highest possible vane of a Vertec device [6,7]. Standard vertical jump testing procedures have been widely used for various purposes (jump power, power asymmetry, injuries predictor) [8,9,10]. However these jumps may not reflect the players’ real jumping abilities during a game. Therefore, it is necessary to assess jumps that are specific to volleyball, such as the block jump (BJ) and the attack jump (AJ) [8,9,11,12].
Despite innovative technical solutions, no reliable information on the frequency and quality of jumps performed by volleyball players at highest level of volleyball championships have been found. Lack of access to verified research tools that do not interfere with players’ comfort during play (sensors, belts) or influence the structure of play constitute a serious problem to both researchers and coaches. Through further development and access to new technologies such as Vert Jump, we are able to report on values of height and covered jumping distance during play, and volleyball games in particular. Previous studies have quantitatively assessed the jumping performance of volleyball players in certain positions; however, these observations were conducted on youth groups [3]. No data reporting these variables (i.e., estimation of number of jumps and jump height in real time during a game [10] performed at a World Championship) have been found.
To reach this goal (i.e., observation and analysis of motor performance in volleyball during a game in real time), we applied innovative technology, including self-made computer software (Mroczek et al.) [13]. It is believed that this will allow for more-accurate and a wider use of volleyball player jumping abilities during volleyball matches. The obtained results may have an influence on more-accurate planning of individual training loads with reference to a detailed description of a game. Therefore, the aim of this study was to assess jump height, covered jumping distance, and number of jumps performed at certain positions by volleyball players competing at the 2014 FIVB Volleyball Men’s World Championship in Poland. Moreover, the purpose was to determine reference values for coaches who prepare teams for volleyball tournaments at the highest level.

2. Materials and Methods

2.1. Subjects

A total of 140 male volleyball players from the following national teams participated in the study: Poland, Russia, Serbia, Argentina, Canada, Australia, Bulgaria, Cuba, Finland, China, Venezuela, and Cameroon. The players were aged 19 to 40 years (27.05 ± 4.33 years), with a body height of 170 to 218 cm (197.15 ± 9.63 cm), body mass 63 to 108 kg (88.51 ± 9.23 kg), attack reach 305 to 375 cm (346.68 ± 14.73 cm), and block reach 290 to 369 cm (320.80 ± 30.49 cm). With regard to the functions performed on the court, volleyball players were categorized as Opposites (O) (n = 20); Middles (M1 and M2) (n = 40); Liberos (L) (n = 20); and Setters (S) (n = 20); and Receivers (R1 and R2) (n =40). Libero players have been disregarded in the analysis, as they do not perform attack jumps, block jumps, or jump serves during a game. The study was reviewed and approved by the Senate Committee on Research Ethics of the University School of Physical Education in Wroclaw, Poland, and the procedures complied with the Declaration of Helsinki regarding human experimentation.

2.2. Methodology

Cross-sectional research was performed on a large sample of professional male volleyball players at the 2014 FIVB Volleyball Men’s World Championship in Poland. The experiment consisted of three stages. The first stage included the collection of audio-visual recordings of the matches played in Wrocław (Groups A and F). The recordings were made using three professional 4K video cameras (Sony PXW-Z150). The second stage of the experiment and the results obtained were in the form of innovative and original analyses of jumping performance of volleyball players, assessing jump height, covered jumping distance, and number of jumps performed during a game. The concept of the analysis method using individual parameters was described and developed by Mroczek et al. [13]. This is the first time the described method has been used. The third stage of the experiment included collecting data on age, body height, and body mass of each volleyball player, as well as their attack and block reaches (data valid from 2014).

2.3. Instruments

The software designed to calculate jump height and move distance was built by using the OpenCV (available 28.06.2018r. on: https://opencv.org/) library. All calculations were performed in double precision (available 28.06.2018r. on: https://docs.microsoft.com).
The analysis was performed on jump serve height (SJH), attack jump height (AJH), block jump height (BJH) (shift of a volleyball player’s center of gravity in a vertical position), jumping flying distance (JFD) (shift of a volleyball player’s center of gravity in a horizontal and/or vertical position), as well as quantity of jumps (JC) (Figure 1).
JFD is a lead curve (parabola) marked out by the trajectory of the center of mass influenced by forces of gravity and aerodynamics during the moments from take-off to the landing jump point (Figure 2). The shape of the trajectory depends on the angle of depression and the velocity of a designated point obtained during the vertical jump performance. In this experiment, the center of the mass shift at the iliac spine level was taken into account.

2.3.1. Jump Height

Jump calculations were based on [14]
h m a x h ( t ) = g t 2 2
where h stands for height, t is time, and g is the gravitational constant (1). From a movie clip recording we can determine a start and landing jump frame by the procedure described below. Jump duration is calculated as
d = ( f l a n d i n g f s t a r t )   ·   t f
where f stands for frame number and t f is the time of a single frame.
Jump ascent and descent time are equal, as they both only depend on the gravitational constant. Hence, descent time is d 2 and landing height is 0. Based on the above notes we can create a formula:
h m a x = g · [ ( f l a n d i n g f s t a r t )   ·   t f ] 2 8

2.3.2. Jump Detection

The algorithm to detect jumps was used. For every frame, HOG features [15] were extracted and analyzed to find a characteristic downward pointing of the toes. The histogram of oriented gradients (HOG) is a feature descriptor used in computer vision and image processing for the purpose of object detection. All frames in the movie clip with this characteristic were marked as the probable start of a jump to help the observer choose a valid one. Finally, start and finish jump frames were selected manually by a researcher.

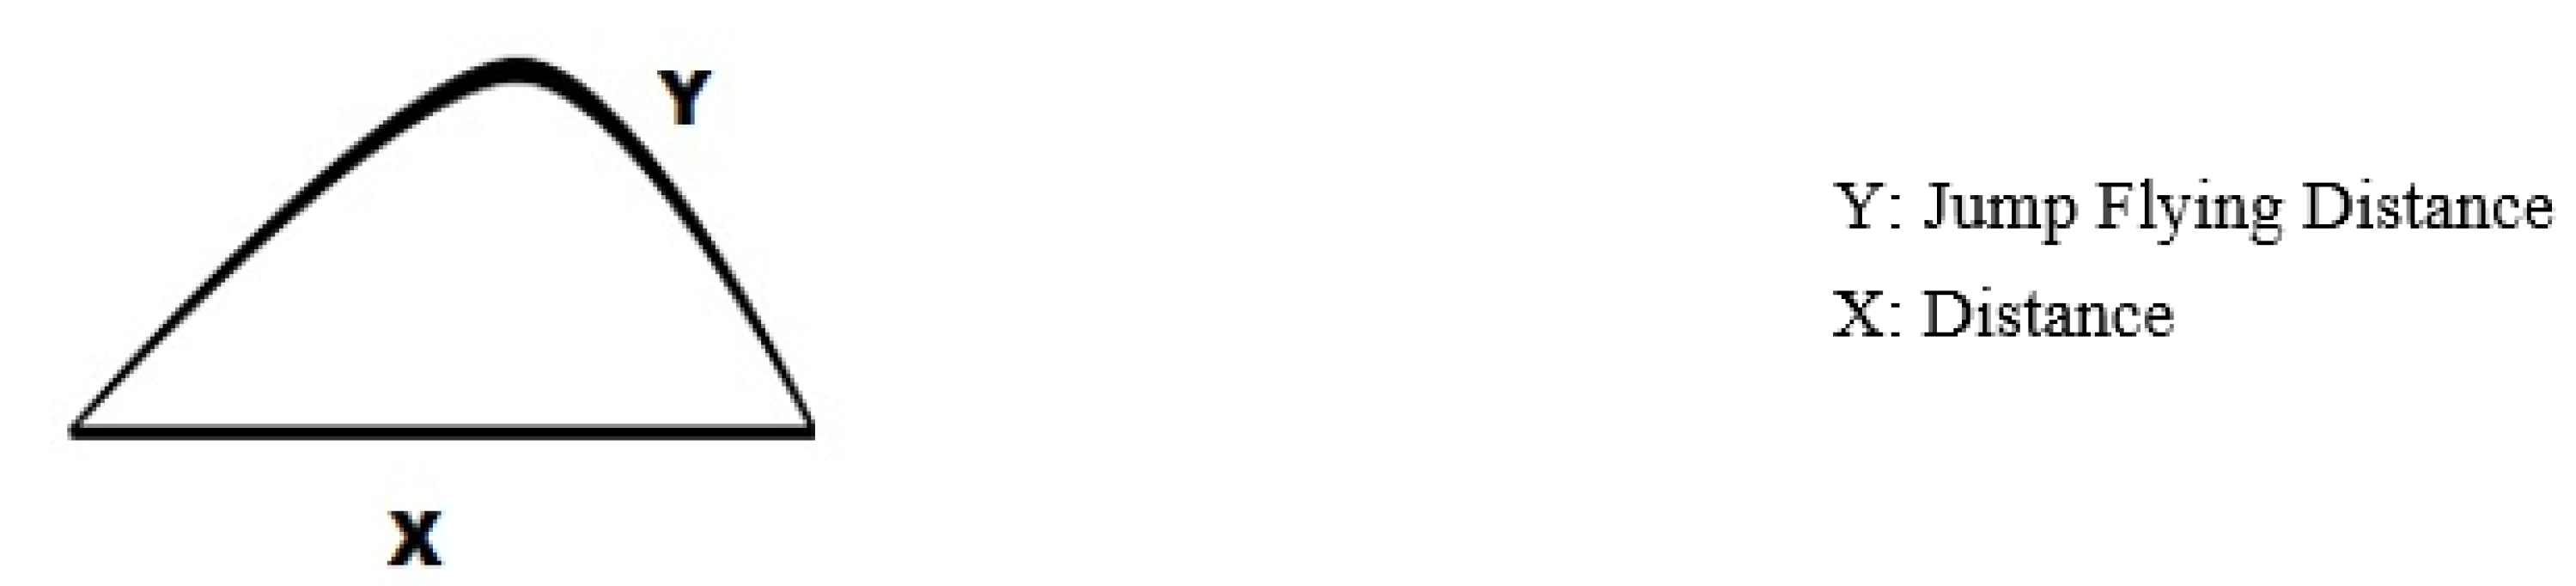
2.3.3. Distance Calculation

Distance calculation concepts were based on the known play court dimension (Figure 3).
A volleyball court is a rectangle of 9 × 18 meters. Thus, it was possible to define the transformation (also known as a perspective transform or homograph [16]), which maps any points from a camera’s perspective into the 9 × 18 meter rectangle:
s i [ x i y i 1 ] = H [ x i y i 1 ]
where H is an arbitrary 3 × 3 matrix. Finding H is achieved by minimizing the back-projection error [17]:
i [ ( x i h 11 x i + h 12 x i + h 13 h 31 x i + h 32 x i + h 33 ) 2 + ( y i h 21 x i + h 22 x i + h 23 h 31 x i + h 32 x i + h 33 ) 2 ]
Achieving H permits the position to be determined in meters for all movie frames for any player.
x i = h 11 x i + h 12 x i + h 13 h 31 x i + h 32 x i + h 33 ,   y i = h 21 x i + h 22 x i + h 23 h 31 x i + h 32 x i + h 33
Finally, calculating the Euclidean distance between positions in two consecutive frames allows the total distance (d) of a player’s move to be discovered. Jump frames are excluded from this calculation.
d = i = 1 n ( x i x i 1 ) 2 + ( y i y i 1 ) 2

2.4. Statistical Analysis
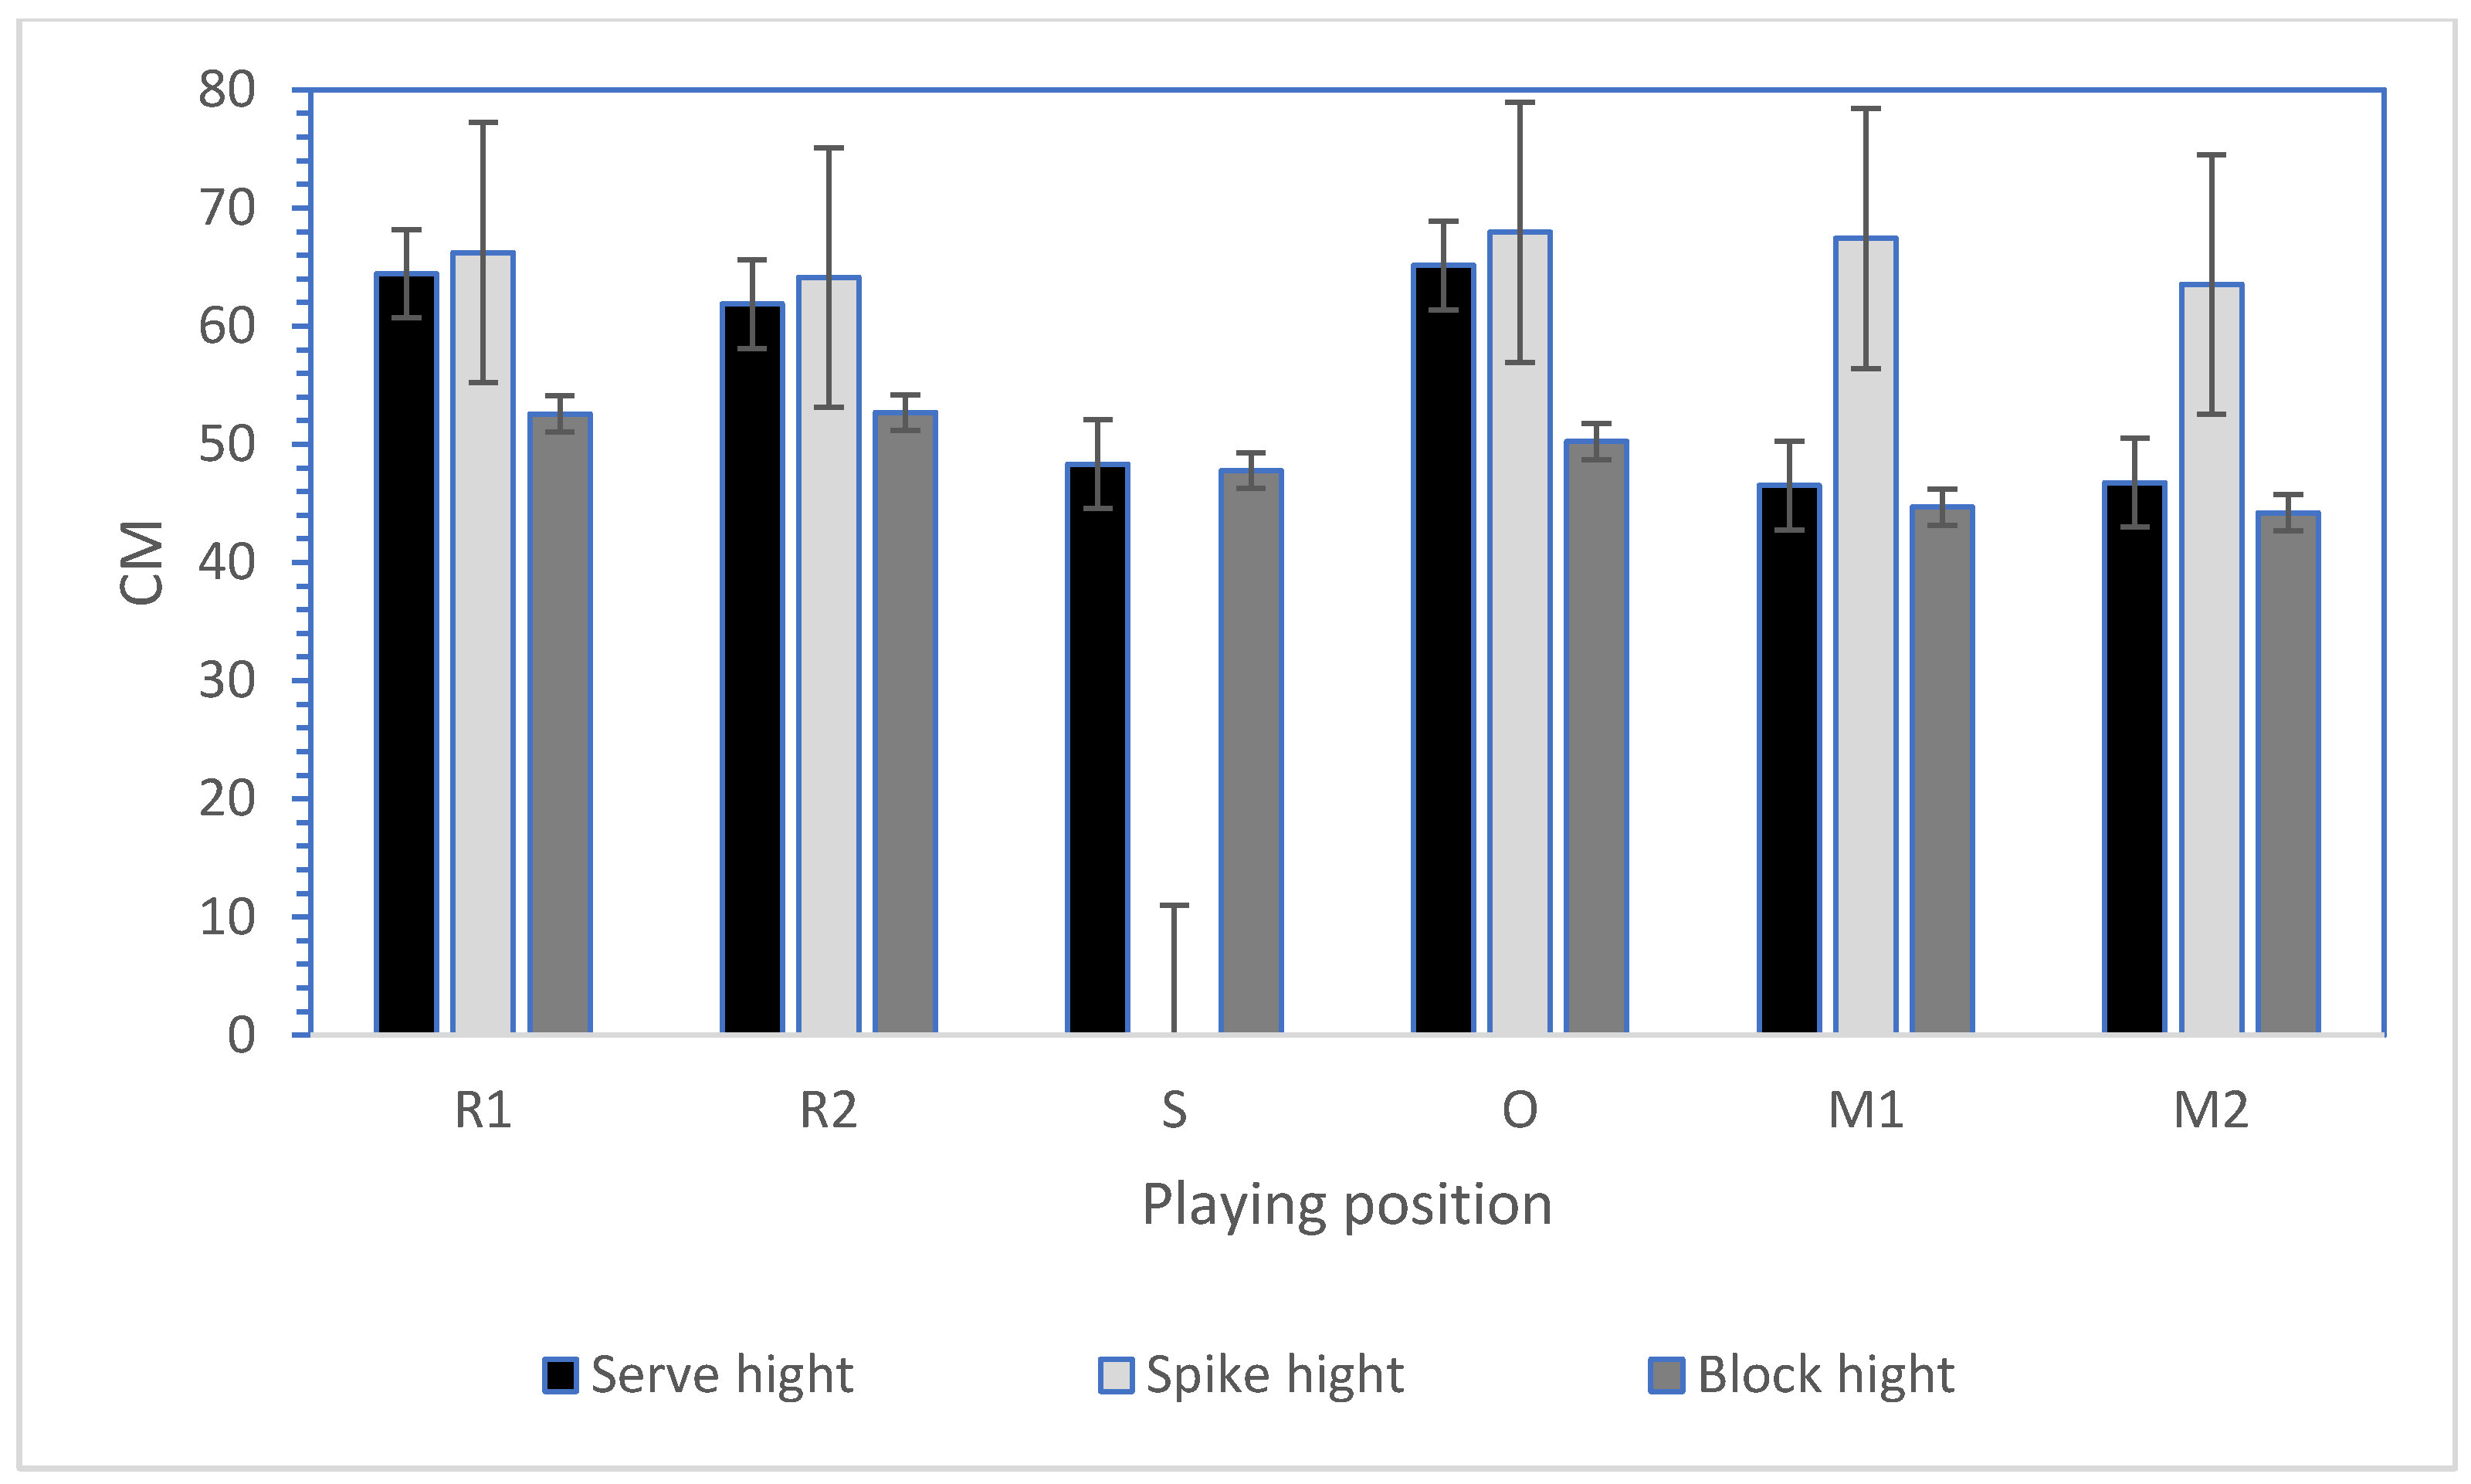
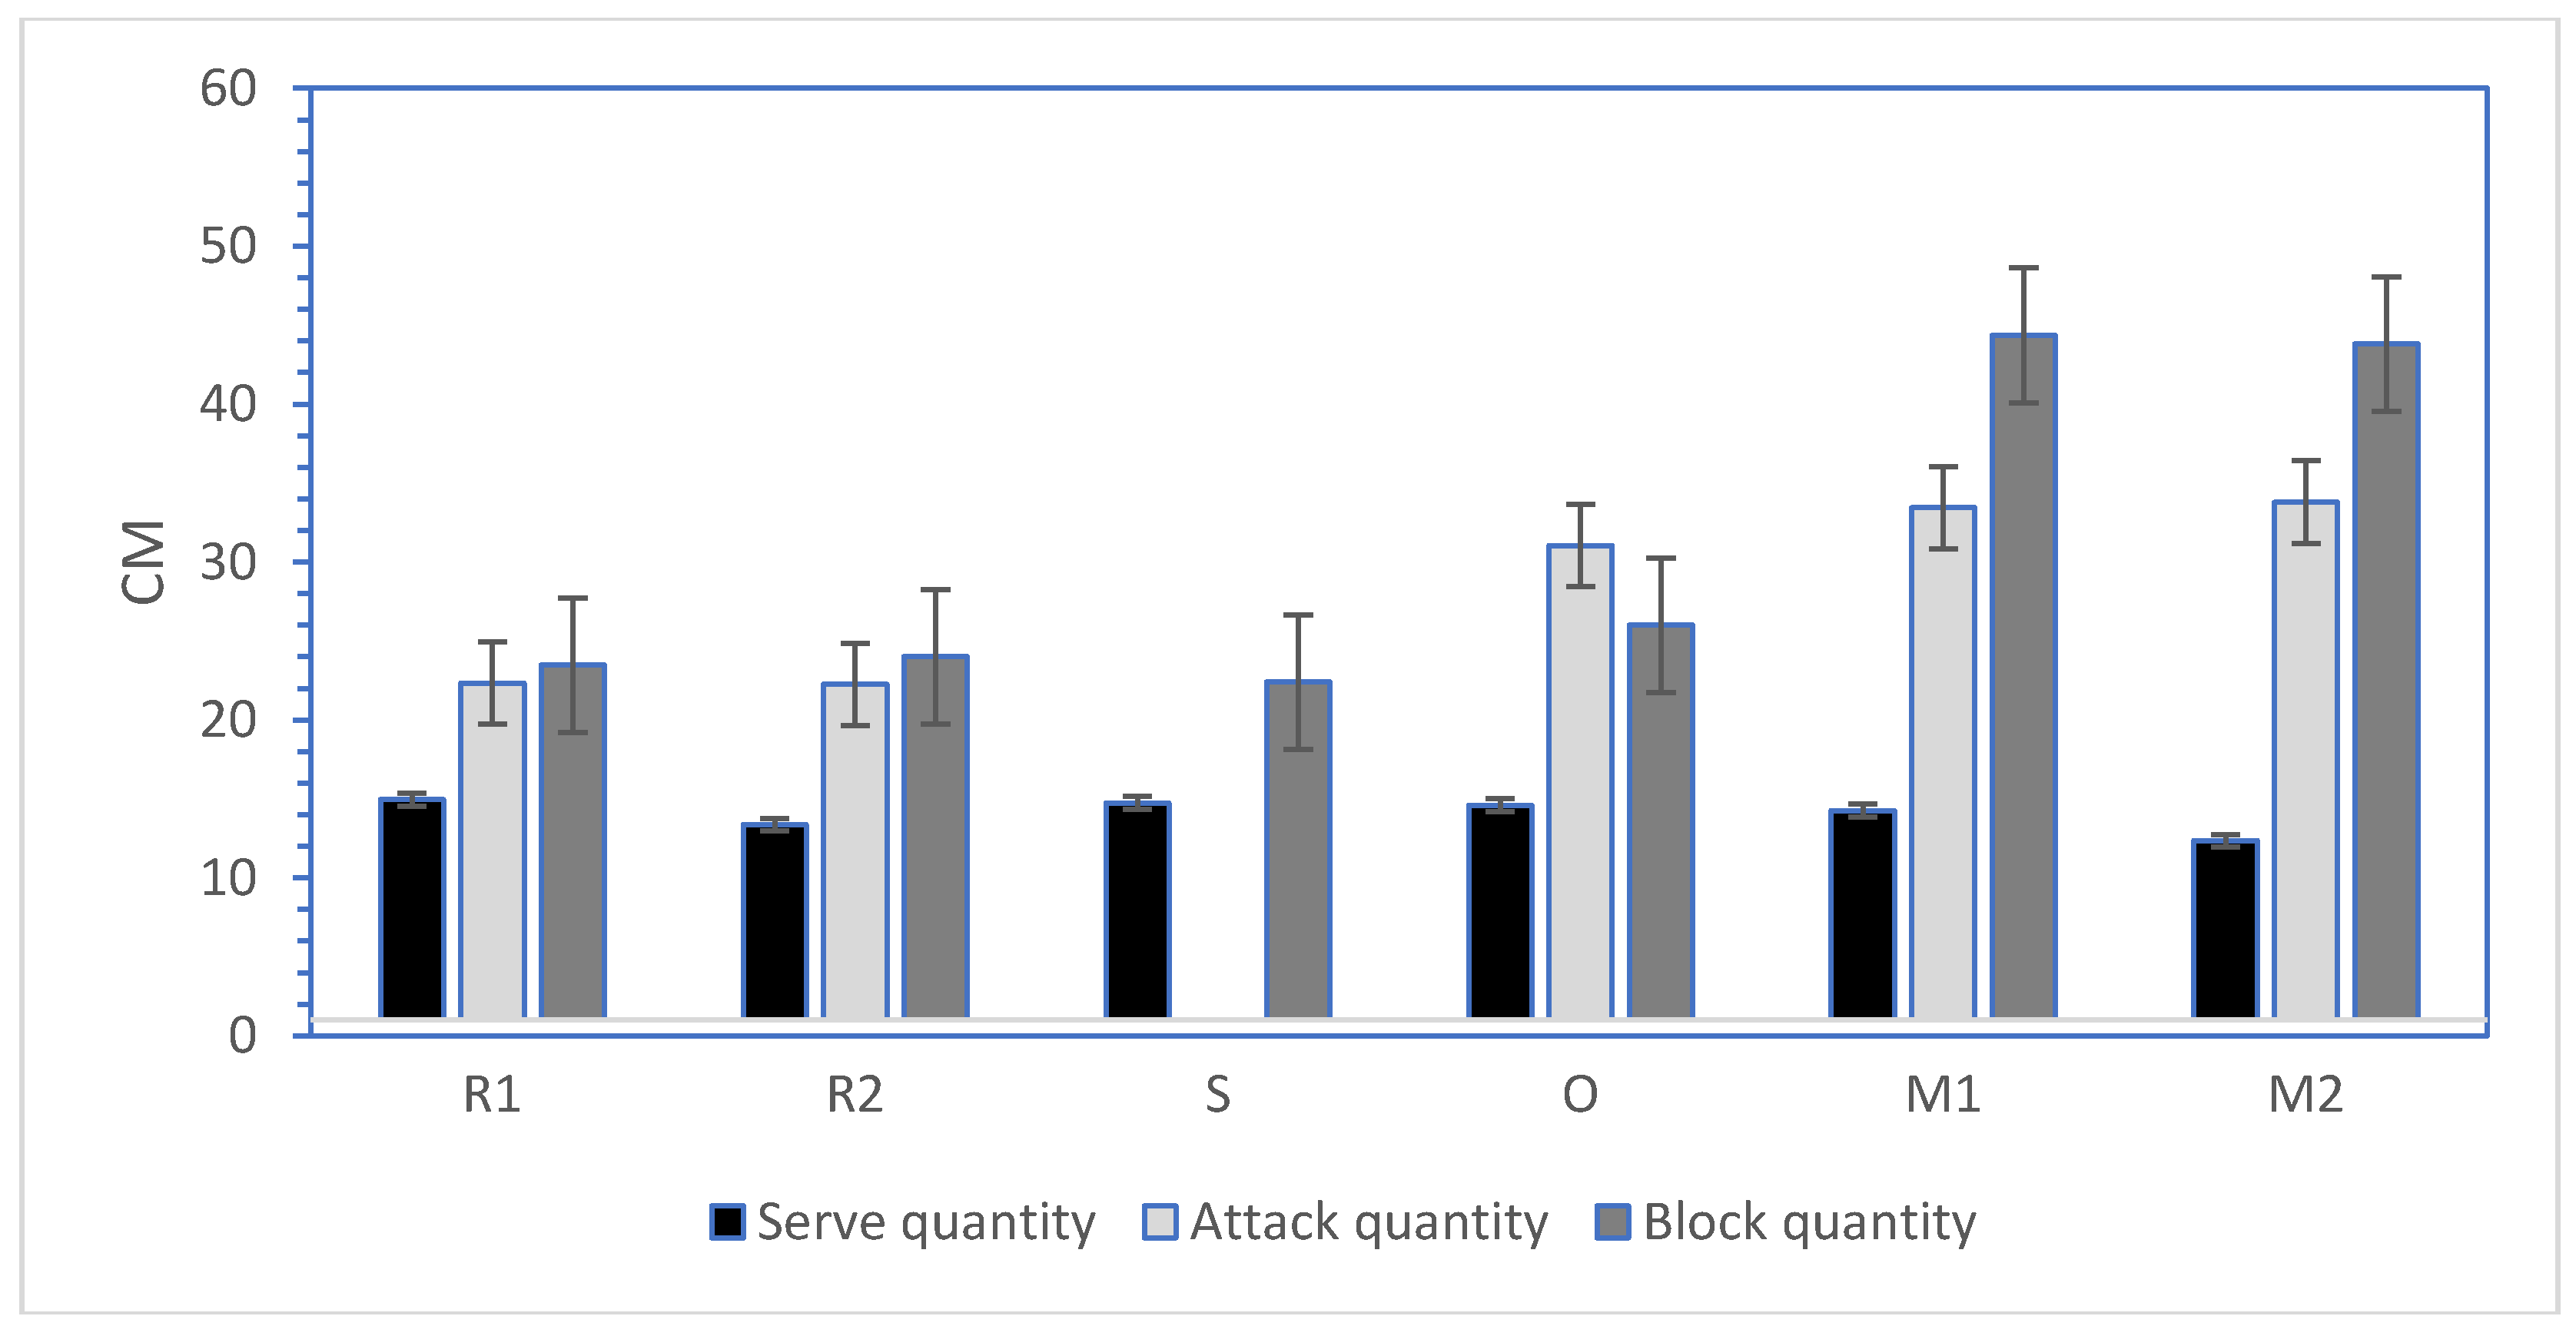
Statistical analysis of the jump performance parameters was presented as an arithmetic mean and standard deviation of all the observed jumps. The interitem correlation coefficient (ICC) and Cronbach’s alpha reliability coefficient (CA) were calculated to determine reliability between the jumps. Inter-variability for each test was measured by the coefficient of variation (CV) (Table 1). One-way analysis of variance (ANOVA) and a Fisher’s least significant difference (LSD) post hoc test were used to analyze all obtained data. The confidence interval (CI) was calculated for the determined mean values of each variable, and aimed at marking limiting points within which there was a 95% probability that the sought population means of the variables could be reduced. All coefficients at a level of 95% (P < 0.05) were considered significant.

3. Results

Table 1 represents the reliability coefficients of the tests. The results were within the range of Cronbach’s alpha coefficients of 0.38 to 0.90, interitem correlation coefficients were 0.38 to 0.89, and coefficients of variation were 0.11 to 0.39. The highest level of reliability was observed for the SJH and AJH (0.89 and 0.87 for ICC, and 0.89 and 0.87 for Cronbach’s alpha, respectively), as well as for covered jumping distance during the performance of an attack jump and number of block jumps (0.89 and 0.85 for ICC, and 0.90 and 0.86 for Cronbach’s alpha, respectively). No significant differences between the tests were noticed (the biggest difference was in covered jumping distance during the block jump performance: 0.43 for ICC and 0.37 for CA, respectively). The lowest level of reliability (validity) was observed for BJH (0.38 for ICC and CA).
Figure 4 shows the average jump height values during serve, attack, and block. The analysis of SJH by volleyball players at various positions showed statistically significant differences (P < 0.05) among the middles (M1—46.51 ± 11.12 cm and M2—46.75 ± 11.53 cm), receivers (R1—64.44 ± 15.03 cm, P = 0.000054 and R2—61.89 ± 10.07 cm P = 0.0003), and opposites (O—65.16 ± 11.12 cm, P = 0.00002). Similarly, such differences were observed among the setters (S—48.31 ± 12.61 cm), receivers (R1—64.44 ± 15.03 cm, P = 0.0002 and R2—61.89 ± 10.07 cm, P = 0.0011), and opposites (O—65.16 ± 11.12 cm, P = 0.00002). The receivers and the opposites showed higher jump height values during serves. Statistically significant differences in BJH were found between the middle M1 and receiver R1 (P = 0.0117), the middle M2 and the receiver R1 (P = 0.0075), the middle M1 and receiver R2 (P = 0.0124), and the middle M2 and receiver R2 (P = 0.0081). No statistically significant differences were noticed in attack jump height.
The results of the comparison between JFD and serve, attack, and block for the players at given positions (Table 2).
Significant differences (P < 0.05) were noticed between the average values for all JFD ratios during jump serve, attack, and block jump (Table 3).
Taking into account the average JFD of attack jumps, the middles (M2) covered a statistically significantly shorter distance than the opposite players O (P = 0.00874) and receiver P1 (P = 0.0344) and P2 (P = 0.0207) (Table 2). When analyzing the block jump lengths, the distance during jump performance covered by the receivers (R1) was significantly (P = 0.0256) shorter than that of the opposites (O) (Table 2).
The number of JCs during serve, attack, and block are summed and presented in Figure 4. Statistically significant differences were observed in JCs during attack between both receivers R1 (P = 0.0025) and R2 (P = 0.0029) versus the opposites (O); between both receivers R1 (P = 0.0001) and R2 (P = 0.0002) and the middles M1; and between the receivers R1 (P = 0.0001) and R2 (P = 0.0001) and the middles M2. The number of block jumps was significantly (P = 0.00001) different between the middles (M1 and M2) and the other players. No statistically significant differences were noticed when comparing players who performed the same functions on the court between R1 and R2 (P = 0.861) or M1 and M2 (P = 0.854). The number of jumps serves did not differentiate among players regarding their position on the court (Figure 5).

4. Discussion

The aim of this study was to assess jump height, covered jumping distance, and number of jumps performed at certain positions by volleyball players competing at the 2014 FIVB Volleyball Men’s World Championship in Poland. The analysis showed a high degree of reliability for jump height during serve and attack, jumping flying distance covered during an attack, and number of block jumps. The strongest relationship was seen between jump components, which predominantly depend only on a volleyball player performing a specific action (e.g., jump serve or attack jump).
Serving skill was the most unique activity in volleyball. SJH was similar for receivers (R1 and R2) and opposites (O), as well as for middles (M1 and M2) and setters (S). Moreover, it differed significantly between these groups of players. Such results prove that the roles and distribution of offensive and defensive forces are different for individual players. In top-level sport teams, outside hitters (A, R1, and R2) take responsibility for efficacy of jump power serve, which aims to score a point. “Defensive” players most often perform a jump float serve (soft), which decreases the risk of making an error related to force exerted from a player during the serve. The game action during which a setter performs a jump float (soft) bases tactics on game complex II (block, defense, setting, and counterattack), and on the block-defense system in particular for accurate and inaccurate serving reception [18,19]. Even though jump float and jump power serve different purposes in jump technique, no statistically significant differences were observed in the number of jumps or jump flying distance.
No statistically significant differences were observed in AJH, which indicates that the action was performed at the maximum possible height level, similar for all elite volleyball players. This is proven by a strong relationship between the actions (0.87 for ICC and 0.87 for CA) and an insignificant variation (0.11 with CV) (Table 1). It can be concluded that elite volleyball players (regardless their playing position) reach similar attack jump heights that are close to the maximum height (96.5% for AJ). Statistically significant differences were observed for JC. The middles (M1 and M2) and the opposites (O) performed the largest numbers of attack jumps. Setters most often set the ball for players on these positions to create a comfortable position for them to score a point. Middle blockers, due to fast pace of setting the ball, have to perform a jump in almost every offensive attack (regardless distribution of the ball). On average, middles (33 ± 10 jumps on average) as well as opposites (31 ± 10 jumps) performed 10 jumps more during a game than receivers (22 ± 10 jumps on average). A number of jumps was also observed by Sheppard [3]. They assessed over 200 volleyball players of U21 National Teams. The authors partly confirmed the results of the current study, highlighting that the greatest number of attack jumps were performed by middle blockers.
Significant differences were seen in the components of block jumps between the middles and the other players. Volleyball players jumped, on average, up to 88.8% of a single maximum block jump. Middles performed twice as many block jumps (average 44 ± 12 jumps per match) than other players (O = 26 ± 9; R = 24 ± 7; S = 22 ± 7), while the heights of their jumps were considerably lower (Figure 1 and Figure 2). The main reasons for this disproportion is the role of the middles during a game, such as their somatic features and opponents’ capabilities. To perform emergent actions at a comparable height, middle blockers do not need to perform jumps that are as high as outside-hitters (outside-teammates). Significant differences in block jump were observed between the receivers (R1) and opposites. This may have resulted from volleyball blocking tactics, which can become a repetitive activity at this level of play. Due to the presence of the opponent’s hitter in defense zone, a receiver (R1) approaches the axis of the court where he supports a middle; in case of setting the ball to zone I (O in defense zone), the player changes the block movement technique, which in turn contributes to the increase of distance between the take-off and the landing spot. The opposite is, in the first place, prepared for the defense of the attack from attack tempo 2 or even attack tempo 1 from zone 2 [20]. Taking into account the above purpose, a block is performed after a slight movement, and the take-off and the landing spots are close.
The current study differs to previous reports, as the results were not obtained by studies carried out under laboratory conditions. When assessing the jump heights of male Italian volleyball players of the Volleyball Regional Team, Maffiuletti disregarded the SJ (squat jump) and CMJ (countermovement jump) and assessed jumps similar in structure to jumps performed during a play (i.e., AJ (attack jump) and BJ (block jump)) [21]. The attack jump height for Italian players amounted to 54.4 cm (±4.8) for the experimental group and 63 cm for the control group. The values for block jump were 48.1 cm (±6.0) and 53 cm. Borras [8] assessed the jump heights of the Spanish National Team in 2007 and 2008. Their observations showed that in 2007 the Spanish volleyball players attained an average block jump height of 56.8 cm (±6.4) and an attack jump height of 66.3 cm (±5.9). In 2008 the Spanish players attained 59.8 cm (5.1) for block jump height and 71.2 cm (5.8) for attack jump height. Comparing the attack (AJ) and block (BJ) jump heights presented in the publications [8,9,21,22] to the results obtained in the current study, some disproportions can be noticed between the single maximum jump (AJ, BJ) and the average jump height performed during a game. Comparing the results of average values of single jumps, obtained by the authors to the average values of jumps obtained during a game, the values of the latter were as follows: 81.5% (for serve), 96.5% (for attack), and 88.8% (for block) for a single maximum jump.
In summary, the results differentiate volleyball players of different specializations with regard to jump loads during a game. According to this we can find both differences and similarities between the players, demonstrating tendencies towards tactics that become repeated game strategies.

5. Conclusions

The results of experiment showed a high degree of reliability for jump height during serving, and attacking, jumping flying distance covered during an attack, and number of block jumps. The strongest relationship was seen between jump components, which predominantly depend only on a volleyball player performing a specific action (e.g., jump serve or attack jump). Volleyball players jump at a height of approximately 96.5% when performing an attack and 81.5% and 88.8% when performing a serve and block, respectively.
The results showed both differences and similarities regarding the numbers of jumps executed during the game. In turn, the number of jumps depended not only on the level of the player, but primarily on the position the volleyball player played. They were also connected closely to tactics, which became repeated game strategies.
The game strategy itself depends on training, with a special focus on jumping abilities. Therefore it would seem reasonable to individualize jump training for volleyball players performing different functions on the court, taking into account the number and height of jumps performed during a game.
It would be reasonable to enrich training with a program to improve the jumping potential of a volleyball player (a plyometric one), which would directly improve the results of games and reduce potential for injury.

Author Contributions

Conceptualization, D.M. and A.K.; methodology, A.K.; software, A.K.; validation, D.P.; formal analysis, J.C.; investigation, A.K.; resources, M.K.; data curation, K.M.; writing—original draft preparation, D.P.; writing—review and editing, D.M. and A.K.; visualization, D.M. and D.P. All authors have read and agreed to the published version of the manuscript.

Funding

This research received no external funding.

Acknowledgments

The authors have no professional relationships with companies or manufacturers that might benefit from this study. The results do not constitute the endorsement of any product. The authors thank the dedicated group of volleyball players for their outstanding performance in the present study.

Conflicts of Interest

The authors declare no conflict of interest.

References

  1. Marques, M.; González-Badillo, J.; Kluka, D. In-season strength training male professional volleyball athletes. Strength Cond. J. 2006, 28, 2–12. [Google Scholar]
  2. Marques, M.C.; Van den Tillaar, R.; Gabbett, T.J.; Reis, V.M.; Gonzalez-Badillo, J.J. Physical fitness qualities of professional volleyball players: Determination of positional differences. J. Strength Cond. Res. 2009, 23, 1106–1111. [Google Scholar] [CrossRef] [PubMed]
  3. Sheppard, J.M.; Gabbett, T.J.; Stanganelli, L.C. An analysis of playing positions in elite men’s volleyball: Considerations for competition demands and physiologic characteristics. J. Strength Cond. Res. 2009, 23, 1858–1866. [Google Scholar] [CrossRef] [PubMed] [Green Version]
  4. Dopsaj, M.; Ćopić, N.; Nešić, G.; Sikimić, M. Jumping performance in elite female volleyball players relative to playing positions: A practical multidimensional assessment model. Serb. J. Sports Sci. 2012, 6, 61–69. [Google Scholar]
  5. Katic, R.; Grgantov, Z.; Jurko, D. Motor structures in female volleyball players aged 14–17 according to technique quality and performance. Coll. Antropol. 2006, 30, 103–112. [Google Scholar] [PubMed]
  6. Farrell, N.; Adams, K.J.; DeBeliso, M. Correlation between varying back squat depths on speed and vertical jump performance in North American high school football players. J. Phy. Edu. Res. 2016, 3, 1–11. [Google Scholar] [CrossRef]
  7. MacDonald, N.; Baker, R.; Cheatham, S.W. The effects of instrument assisted soft tissue mobilization on lower extremity muscle performance: A randomized controlled trial. Int. J. Sports Phys. 2016, 11, 1040–1047. [Google Scholar]
  8. Borràs, X.; Balius, X.; Drobnic, F.; Galilea, P. Vertical jump assessment on volleyball: A follow-up of three seasons of a high-level volleyball team. J. Strength Cond. Res. 2011, 25, 1686–1694. [Google Scholar] [CrossRef] [PubMed] [Green Version]
  9. Sattler, T.; Hadzic, V.; Dervisevic, E.; Markovic, G. Vertical jump performance of professional male and female volleyball players: Effects of playing position and competition level. J. Strength Cond. Res. 2015, 29, 1486–1493. [Google Scholar] [CrossRef] [PubMed]
  10. Skazalski, C.; Whiteley, R.; Hansen, C.; Bahr, R. A valid and reliable method to measure jump-specific training and competition load in elite volleyball players. Scand. J. Med. Sci. Sports 2018, 28, 1578–1585. [Google Scholar] [CrossRef] [PubMed]
  11. Marques, M.C.; Tillaar, R.; Vescovi, J.D.; Gonzalez-Badillo, J.J. Changes in strength and power performance in elite senior female professional volleyball players during the in-season: A case study. J. Strength Cond. Res. 2008, 22, 1147–1155. [Google Scholar] [CrossRef] [PubMed]
  12. Marqueste, T.; Messan, F.; Hug, F.; Laurin, J.; Dousset, E.; Grelot, L.; Decherchi, P. Effect of repetitive biphasic muscle electrostimulation training on vertical jump performances in female volleyball players. Int. J. Sport Health Sci. 2010, 8, 50–55. [Google Scholar] [CrossRef] [Green Version]
  13. Mroczek, D.; Januszkiewicz, A.; Kawczynski, A.S.; Borysiuk, Z.; Chmura, J. Analysis of male volleyball players’ motor activities during a top level match. J. Strength Cond. Res. 2014, 28, 2297–2305. [Google Scholar] [CrossRef] [PubMed]
  14. Halliday, D.; Resnick, R.; Walker, J.; Komar, W.; Bożek, R.; Łukaszewski, M. Podstawy Fizyki; Wydawnictwo Naukowe PWN: Warsaw, Poland, 2014. [Google Scholar]
  15. Dalal, N.; Triggs, B. Histograms of oriented gradients for human detection. In Proceedings of the Computer Vision and Pattern Recognition, 2005 (CVPR 2005), San Diego, CA, USA, 20–25 June 2005; pp. 886–893. [Google Scholar]
  16. Szeliski, R. Image formation. In Computer Vision; Springer: Berlin, Germany, 2011; pp. 27–86. [Google Scholar]
  17. Bradski, G.; Kaehler, A. Learning OpenCV: Computer Vision with the OpenCV Library; O’Reilly Media, Inc.: Sebastopol, CA, USA, 2008. [Google Scholar]
  18. Silva, M.; Lacerda, D.; João, P.V. Match analysis of discrimination skills according to the setter defence zone position in high level volleyball. Int. J. Perform. Anal. Sport 2014, 14, 463–472. [Google Scholar] [CrossRef]
  19. Suarez, M.C.; Claver, F.; Fernández-Echeverría, C.; Moreno, M.P. Relationship between decision-making and performance in game actions in volleyball. Eur. J. Hum. Mov. 2018, 39, 82–95. [Google Scholar]
  20. Costa, G.; Afonso, J.; Brant, E.; Mesquita, I. Differences in game patterns between male and female youth volleyball. Kinesiol. Int. J. Fundam. Appl. Kinesiol. 2012, 44, 60–66. [Google Scholar]
  21. Maffiuletti, N.A.; Dugnani, S.; Folz, M.; Di, E.P.; Mauro, F. Effect of combined electrostimulation and plyometric training on vertical jump height. Med. Sci. Sports Exerc. 2002, 34, 1638–1644. [Google Scholar] [CrossRef] [PubMed]
  22. Forthomme, B.; Croisier, J.L.; Ciccarone, G.; Crielaard, J.M.; Cloes, M. Factors correlated with volleyball spike velocity. Am. J. Sports Med. 2005, 33, 1513–1519. [Google Scholar] [CrossRef] [PubMed]
Figure 1. Software analysis on jump serve height (SJH), attack jump height (AJH), block jump height (BJH) (shift of a volleyball player’s center of gravity in a vertical position), and jumping flying distance (JFD).
Applsci 10 02045 g001
Figure 2. Trajectory of the center of mass in jump flying distance.
Applsci 10 02045 g002
Figure 3. Software analysis on player covered distance.
Applsci 10 02045 g003
Figure 4. The results of the comparison between jump flying distance (JFD) and serve, attack, and block for the players at given positions (R1, R2—Receiver; S—Setter; O—Opposite; M1, M2—Middle blocker).
Applsci 10 02045 g004
Figure 5. The number of jumps serves did not differentiate among the players regarding their position on the court (R1, R2—Receiver; S—Setter; O—Opposite; M1, M2—Middle blocker).
Applsci 10 02045 g005
Table 1. Descriptive statistics and reliability coefficients for the tests used in this study.
ParameterMean ± SD (cm)ICCCACVCI
−95%+95%
Ht. S55.53 ± 15.510.890.890.1552.7358.33
No. of S jumps2.41 ± 1.850.480.490.3913.2514.87
dist. of S jump164.12 ± 59.480.550.530.19150.42170.10
Ht. A65.22 ± 11.250.870.870.1163.0067.44
No. of A jumps4.08 ± 3.990.560.600.3824.0628.87
dist. of A jump126.69 ± 37.030.890.900.13119.10130.41
Ht. B48.69 ± 10.220.380.380.2946.8450.54
No. of B jumps5.26 ± 4.310.850.860.3728.2933.04
dist. of B jump96.43 ± 34.190.430.370.26137.86151.03
Ht—height; no.—number; dist.—distance; S—serve, A—attack, B—block; ICC—interitem correlation coefficient; CA—Cronbach’s alpha reliability coefficient; CV—coefficient of variation; CI—confidence interval.
Table 2. Mean jump distance of elite volleyball players
PositionServe (cm)Attack (cm)Block (cm)
O168.43 ± 52.17131.13 ± 19.3692.84 ± 24.88
R1140.66 ± 56.08111.97 ± 17.01103.79 ± 21.36
R2155.82 ± 57.08124.76 ± 29.7495.34 ± 20.62
S165.11 ± 44.73113.26 ± 15.8089.60 ± 27.90
M1156.20 ± 64.80122.20 ± 42.8297.53 ± 33.03
M2121.42 ± 45.14100.83 ± 6.99102.91 ± 17.80
Table 3. Differences between average jump flying distance values during serve, attack, and block.
Group 1Group 2dfP
ServeAttack2180.000000
ServeBlock2380.008700
AttackServe2180.000000
AttackBlock2180.000017
BlockServe2380.008700
BlockAttack2180.000017

