Hammer Throw: A Pilot Study for a Novel Digital-Route for Diagnosing and Improving Its Throw Quality


Abstract
1. Introduction
2. Materials and Methods
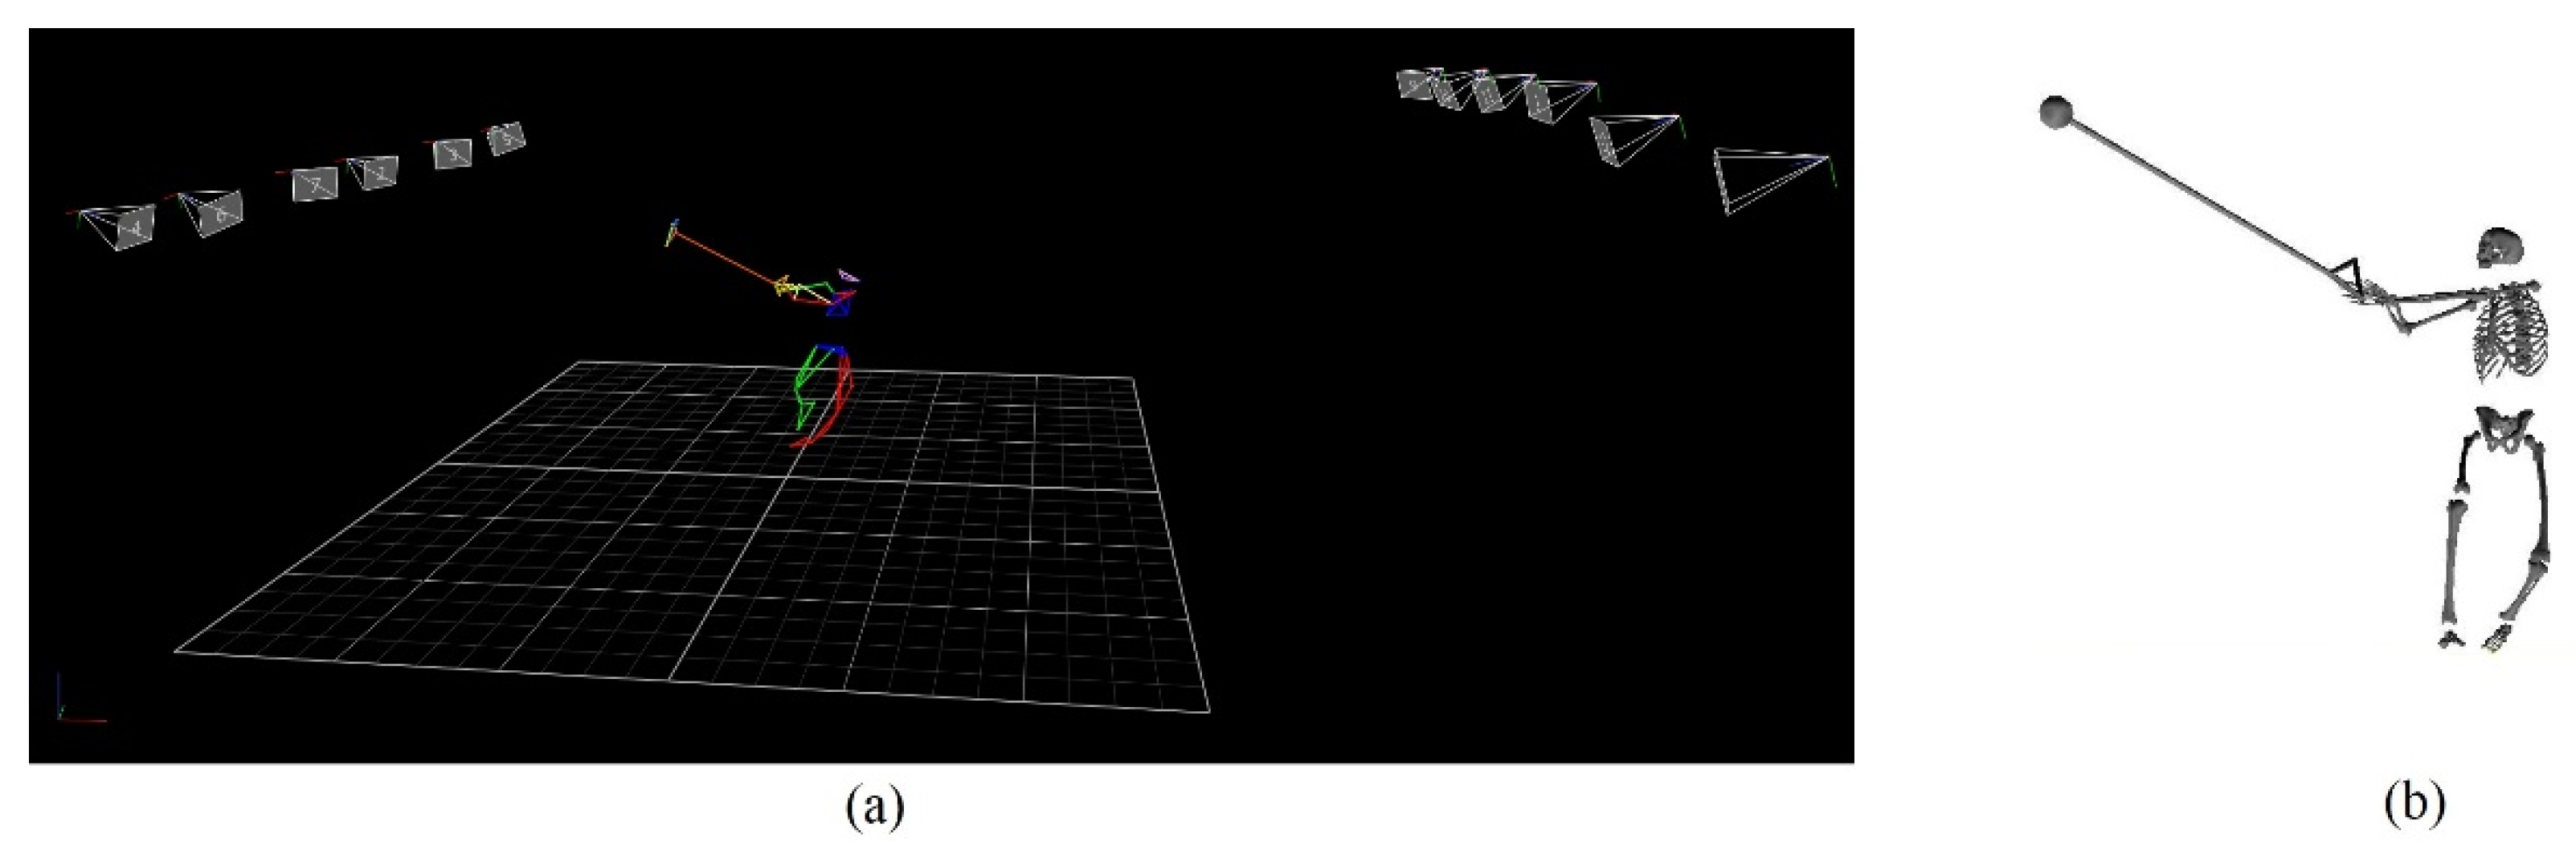
2.1. Three-Dimensional Motion Capture and Biomechnaical Modeling
2.2. Wearable Wire-tension Measurement Unit
2.3. Motor Control Analysis for Feedback Training
3. Results
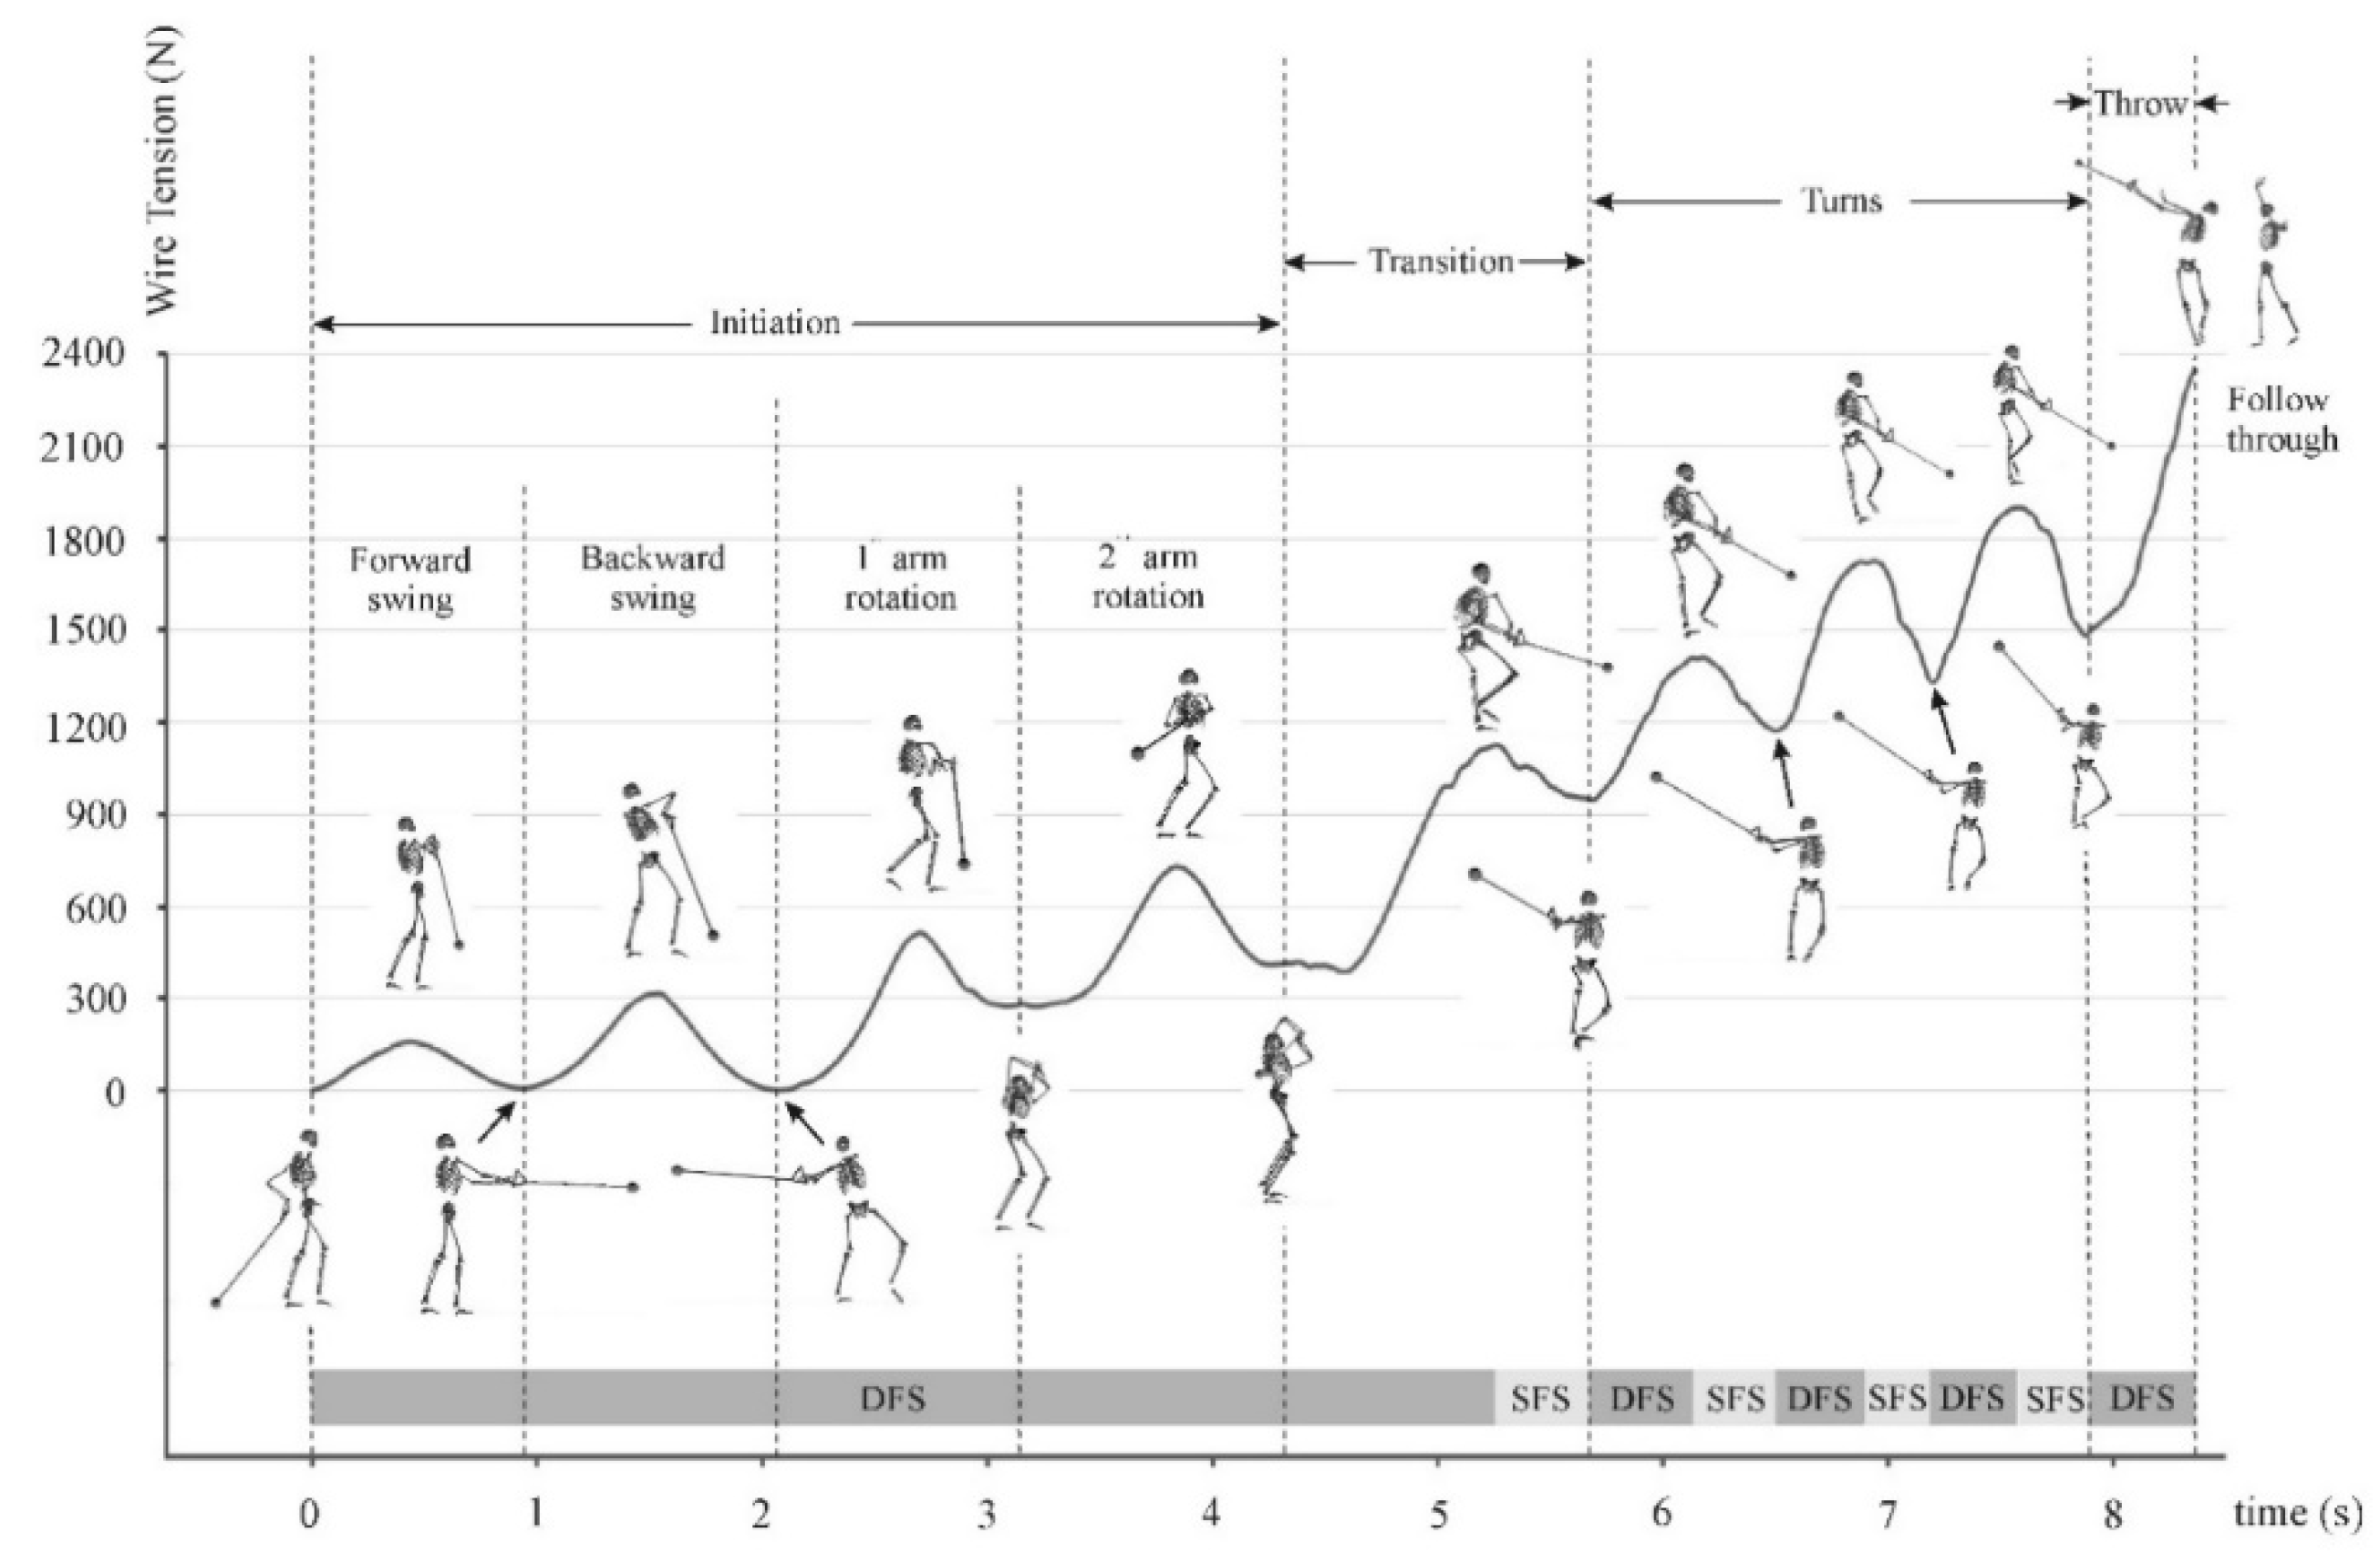
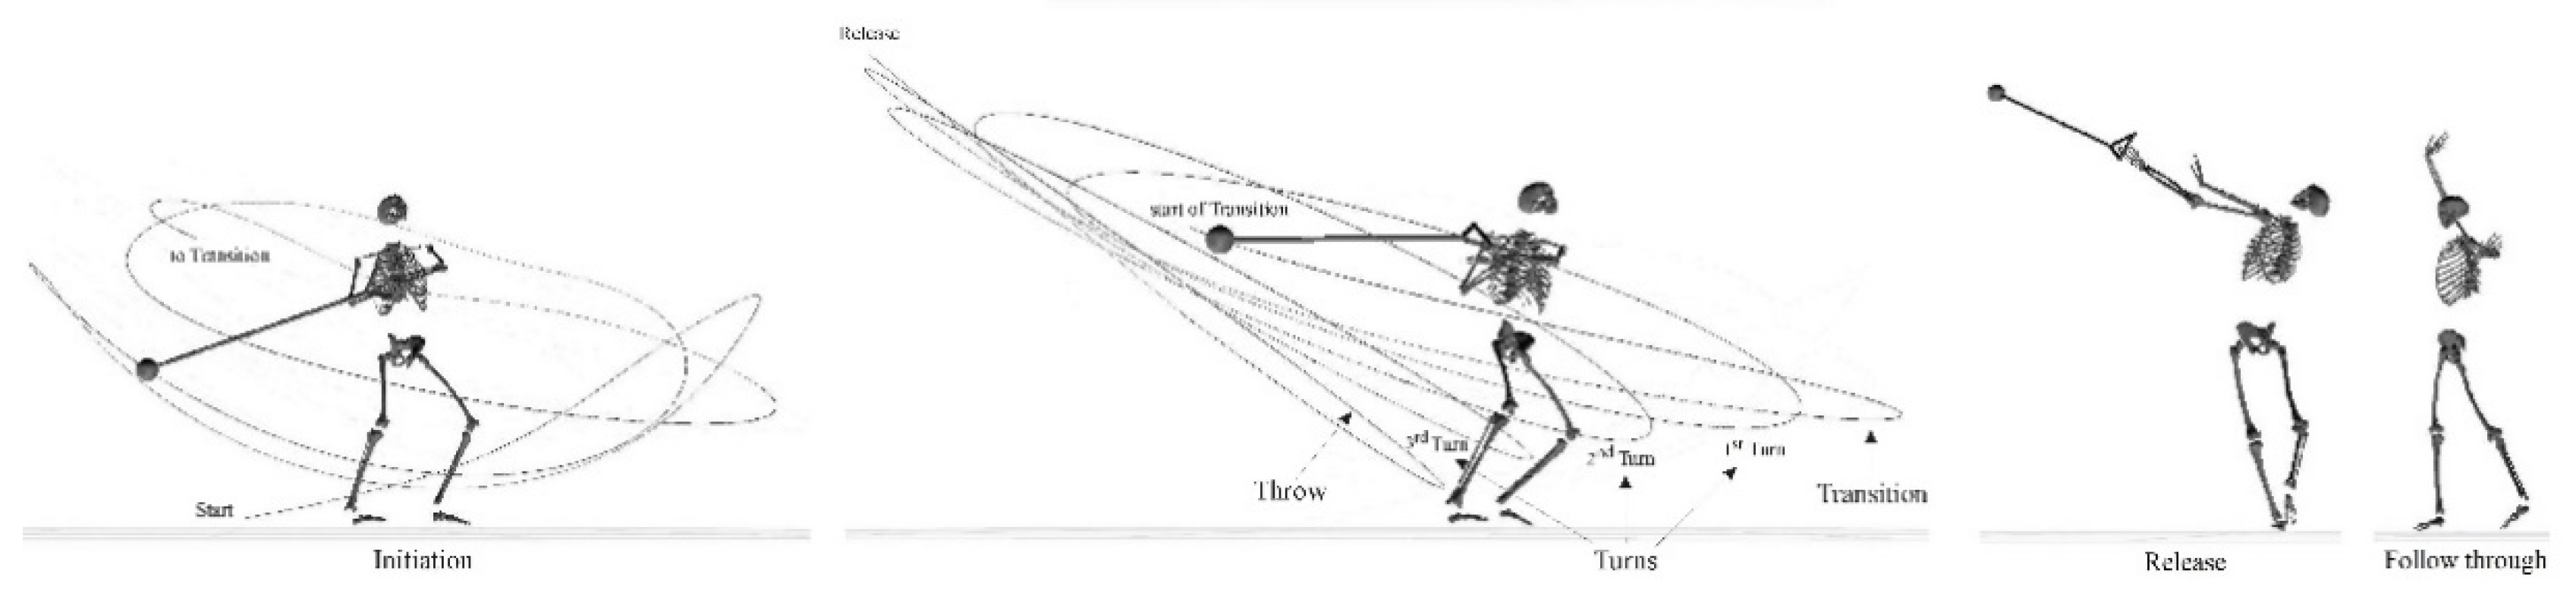
- timing
- the tension development/force-generation
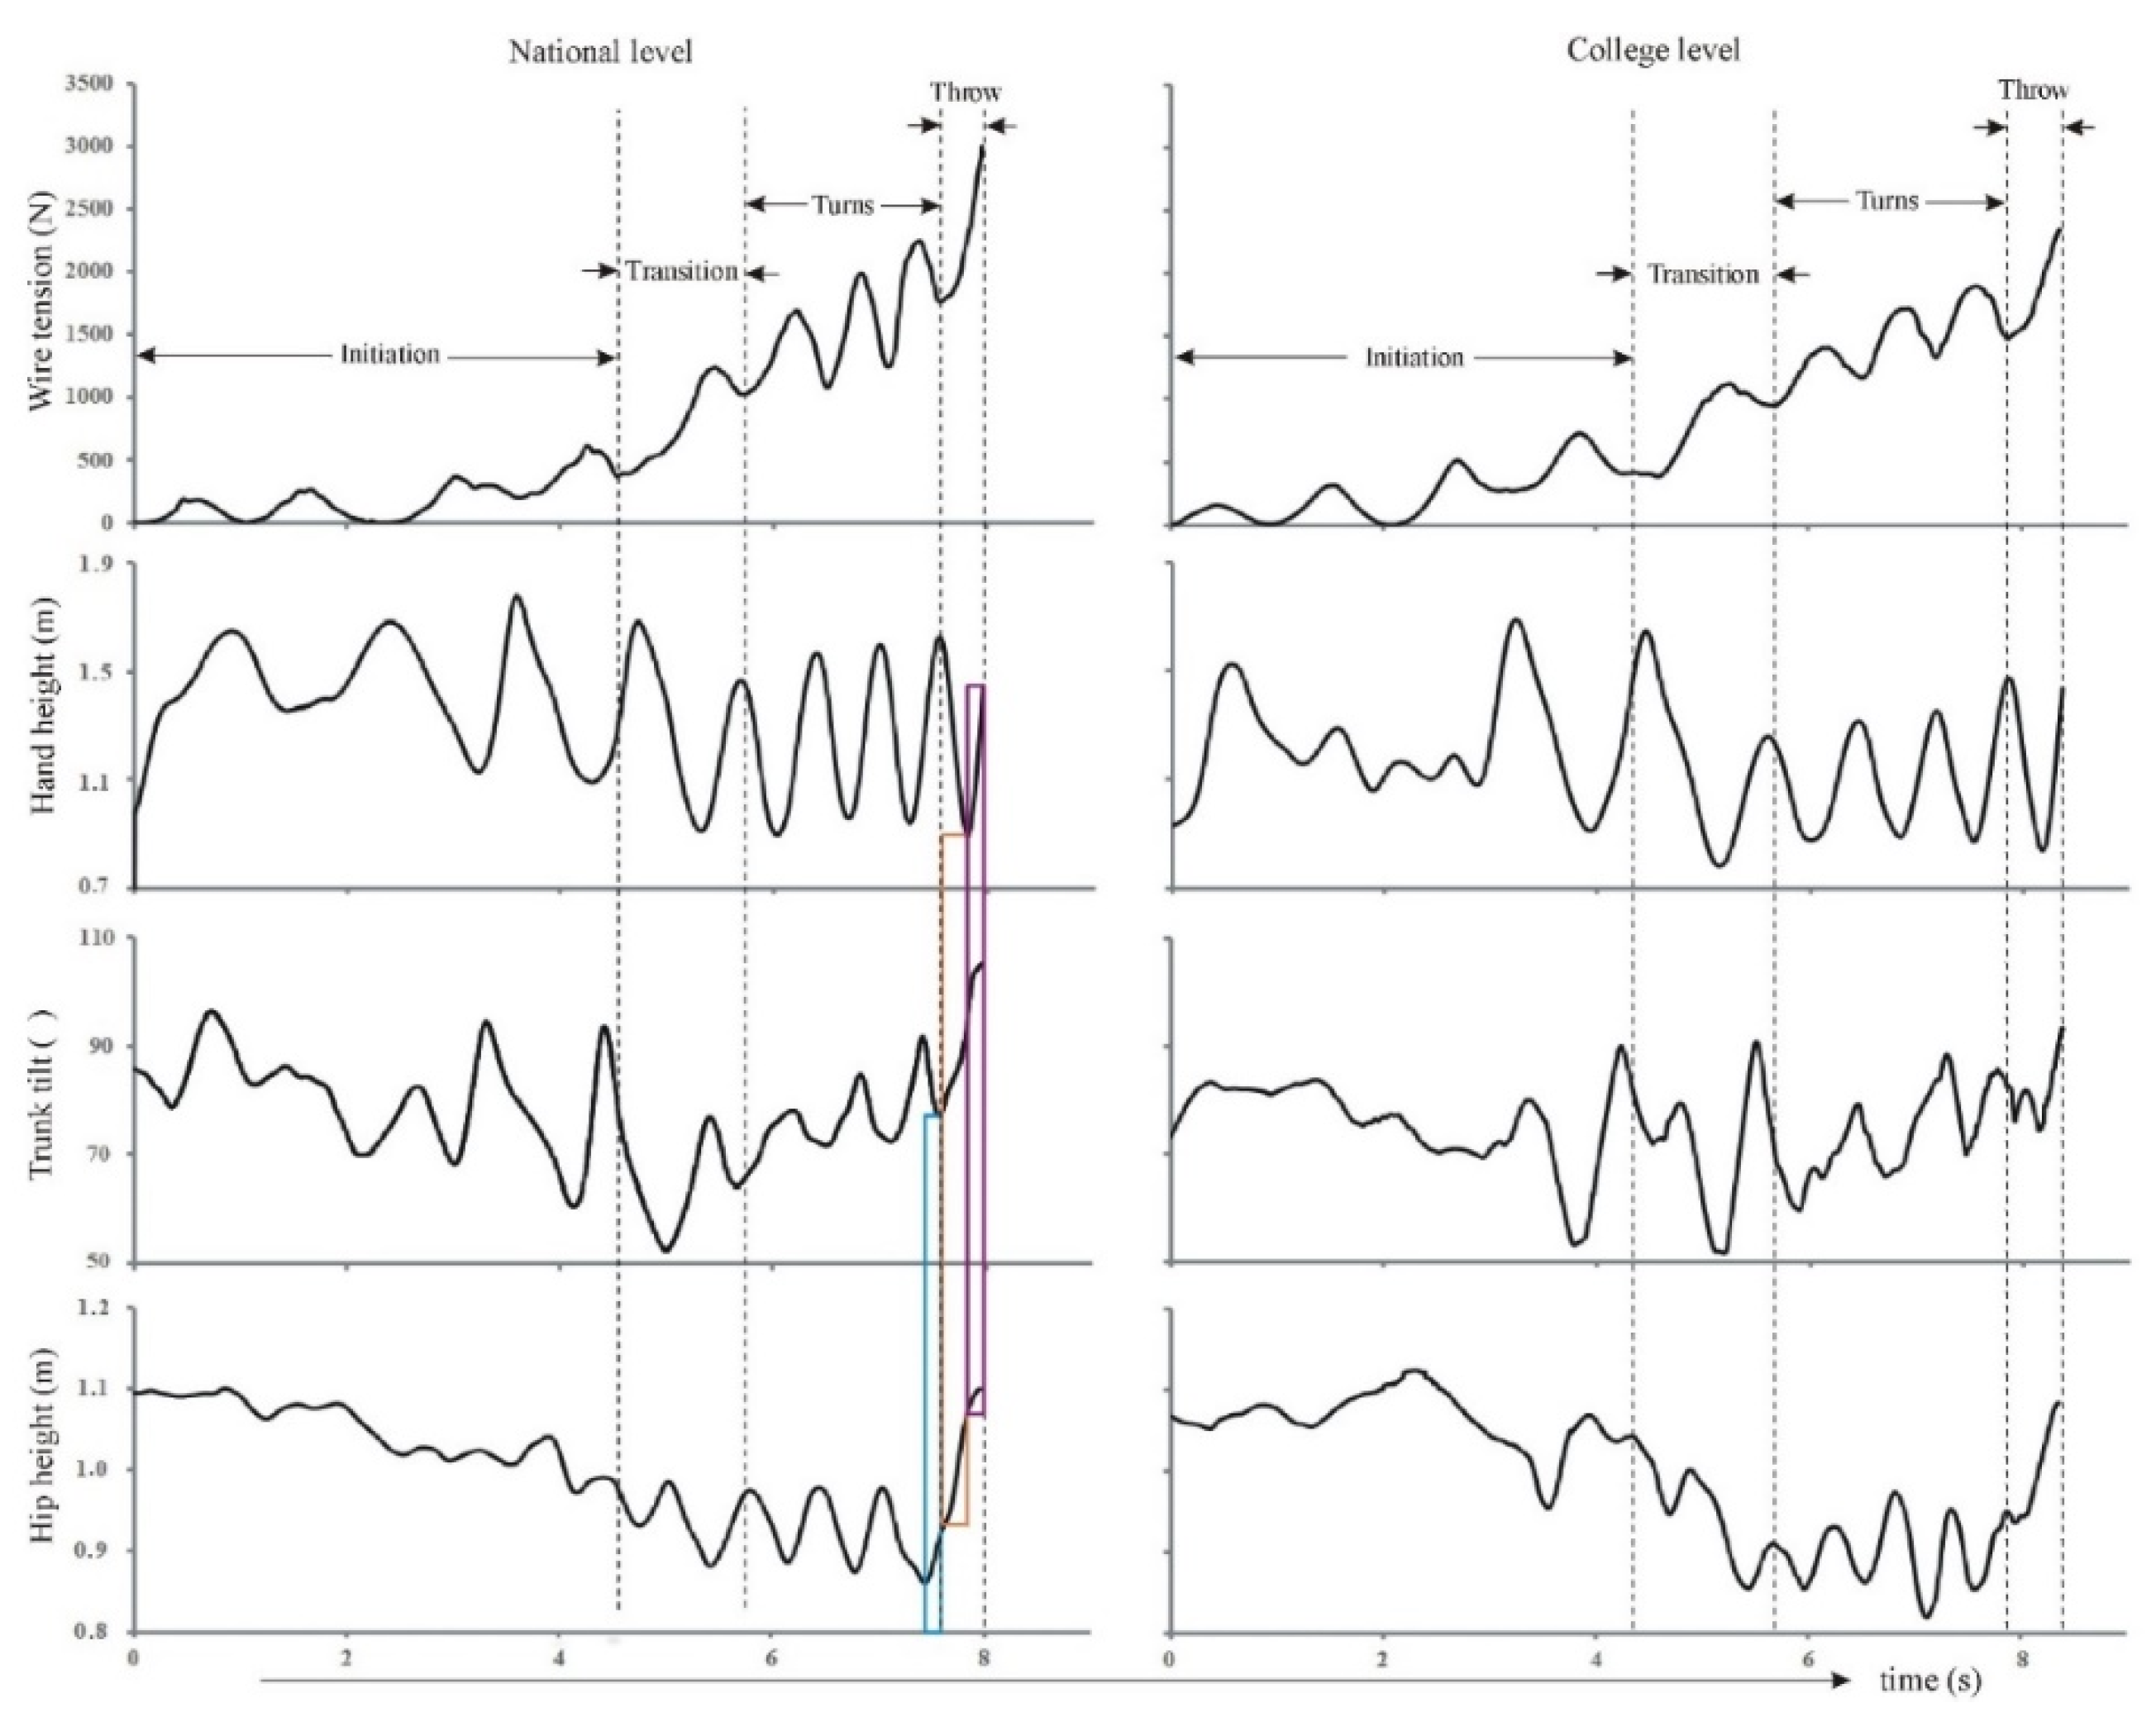
- peak-to-trough values during turns
- upper-limb control/vertical variation of hands
- trunk control/trunk tilt angle
- lower-limb control/vertical variation of hip.
4. Discussion
5. Conclusions
Author Contributions
Funding
Conflicts of Interest
References
- WorldAthletics. World Records. 2019. Available online: https://www.worldathletics.org/records/by-category/world-records (accessed on 16 June 2019).
- Wang, Y.; Wan, B.; Li, H.; Shan, G. A wireless sensor system for a biofeedback training of hammer throwers. SpringerPlus 2016, 5, 1395. [Google Scholar] [CrossRef]
- Wang, Y.; Li, H.; Wan, B.; Zhang, X.; Shan, G. Obtaining Vital Distances Using Wearable Inertial Measurement Unit for Real-Time, Biomechanical Feedback Training in Hammer-Throw. Appl. Sci. 2018, 8, 2470. [Google Scholar] [CrossRef]
- Zhang, X.; Shan, G.; Wang, Y.; Wan, B.; Li, H. Wearables, biomechanical feedback, and human motor-skills’ learning & optimization. Appl. Sci. 2019, 9, 226. [Google Scholar]
- Dapena, J. A kinematic study of center of mass motions in the hammer throw. J. Biomech. 1986, 19, 147–158. [Google Scholar] [CrossRef]
- Fujii, N.; Koyama, Y.; Ae, M. Reexamination of acceleration mechanism in hammer throw. J. Biomech. 2007, 40, S622. [Google Scholar] [CrossRef]
- Maroński, R. Optimal distance from the implement to the axis of rotation in hammer and discus throws. J. Biomech. 1991, 24, 999–1005. [Google Scholar] [CrossRef]
- Mizera, F.; Horváth, G. Influence of environmental factors on shot put and hammer throw range. J. Biomech. 2002, 35, 785–796. [Google Scholar] [CrossRef]
- Brice, S.M.; Ness, K.F.; Rosemond, D.; Lyons, K.; Davis, M. Development and validation of a method to directly measure the cable force during the hammer throw. Sports Biomech. 2008, 7, 274–287. [Google Scholar] [CrossRef]
- Hay, J. The Biomechanics of Sports Techniques; Prentice-Hall: Upper Saddle River, NJ, USA, 1978. [Google Scholar]
- Hall, S.J. Basic Biomechanics, 8th ed.; Mc Graw Hill: Boston, MA, USA, 2018. [Google Scholar]
- Shan, G.; Westerhoff, P. Full body kinematic characteristics of the maximal instep Soccer kick by male soccer players and parameters related to kick quality. Sports Biomech. 2005, 4, 59–72. [Google Scholar] [CrossRef]
- Zhang, Z.; Li, S.; Wan, B.; Visentin, P.; Jiang, Q.; Dyck, M.; Li, H.; Shan, G. The influence of X-factor (trunk rotation) and experience on the quality of the badminton forehand smash. J. Hum. Kinet. 2016, 53, 9–22. [Google Scholar] [CrossRef]
- Shan, G.; Visentin, P.; Zhang, X.; Hao, W.; Yu, D. Bicycle kick in soccer: Is the virtuosity systematically entrainable? Sci. Bull. 2015, 60, 819–821. [Google Scholar] [CrossRef]
- Li, S.; Zhang, Z.; Wan, B.; Wilde, B.; Shan, G. The relevance of body positioning and its training effect on badminton smash. J. Sports Sci. 2017, 35, 310–316. [Google Scholar] [CrossRef] [PubMed]
- Shan, G.; Zhang, X.; Wan, B.; Yu, D.; Wilde, B.; Visentin, P. Biomechanics of coaching maximal instep soccer kick for practitioners. Interdiscip. Sci. Rev. 2019, 44, 12–20. [Google Scholar] [CrossRef]
- Shan, G.; Zhang, X. From 2D leg kinematics to 3D full-body biomechanics-the past, present and future of scientific analysis of maximal instep kick in soccer. Sports Med. Arthrosc. Rehabil. Ther. Technol. 2011, 3, 23. [Google Scholar] [CrossRef] [PubMed]
- Liu, Y.; Kong, J.; Wang, X.; Shan, G. Biomechanical analysis of Yang’s spear turning-stab technique in Chinese martial arts. Phys. Activ. Rev. 2020, 8, 16–22. [Google Scholar]
- Shan, G.; Bohn, C. Anthropometrical data and coefficients of regression related to gender and race. Appl. Ergon. 2003, 34, 327–337. [Google Scholar] [CrossRef]
- Winter, D.A. Biomechanics and Motor Control of Human Movement; John Wiley & Sons: Hoboken, NJ, USA, 2009. [Google Scholar]
- Gutierrez, M.; Soto, V.; Rojas, F. A biomechanical analysis of the individual techniques of the hammer throw finalists in the seville athletics world championship, 1999. New Stud. Athl. 2002, 17, 15–28. [Google Scholar]
- Bartonietz, K. A biomechanical analysis of throws with different weight and length hammers. Mod. Athl. Coach 1994, 32, 33–36. [Google Scholar]
- Brice, S.M. Biomechanical Analysis of Hammer Throwing: Assessment of Speed Development; James Cook University: Douglas, Australia, 2014. [Google Scholar]
- Visentin, P.; Shan, G. An innovative approach to understand overuse injuries: Biomechanical modeling as a platform to integrate information obtained from various analytic tools. Med. Probl. Perform. Artist. 2004, 19, 90–97. [Google Scholar]
- Shan, G.; Visentin, P.; Schultz, A. Multidimensional signal analysis as a means of better understanding factors associated with repetitive use in violin performance. Med. Probl. Perform. Artist. 2004, 19, 129–139. [Google Scholar]
- Shan, G.; Zhang, X.; Li, X.; Hao, W.; Witte, K. Quantification of Golfer-club Interaction and Club-type’s Affect on Dynamic Balance during a Golf Swing. Int. J. Perform. Anal. Sport 2011, 11, 417–426. [Google Scholar] [CrossRef]
- Magill, R.A. Motor Learning Concepts and Applications, 6th ed.; McGraw-Hill: Boston, MA, USA, 2001. [Google Scholar]
- Shan, G. Influences of Gender and Experience on the Maximal Instep Soccer Kick. Eur. J. Sport Sci. 2009, 9, 107–114. [Google Scholar] [CrossRef]
- Wan, B.; Shan, G. Biomechanical modeling as a practical tool for predicting injury risk related to repetitive muscle lengthening during learning and training of human complex motor skills. SpringerPlus 2016, 5, 441. [Google Scholar] [CrossRef]
- Bartonietz, K. Hammer throwing: Problems and prospects. Biomech. Sport 2000, 458. [Google Scholar] [CrossRef]
- Zanone, P.G.; Kelso, J. Evolution of behavioral attractors with learning: Nonequilibrium phase transitions. J. Exp. Psychol. Hum. Percept. Perform. 1992, 18, 403. [Google Scholar] [CrossRef]
- Zhang, X.; Shan, G. Where do golf driver swings go wrong?—Factors Influencing Driver Swing Consistency. Scand. J. Med. Sci. Sports 2014, 24, 749–757. [Google Scholar] [CrossRef]
- Shan, G.; Daniels, D.; Wang, C.; Wutzke, C.; Lemire, G. Biomechanical analysis of maximal instep kick by female soccer players. J. Hum. Mov. Stud. 2005, 49, 149–168. [Google Scholar]
- Yu, D.; Yu, Y.; Wilde, B.; Shan, G. Biomechanical characteristics of the axe kick in Tae Kwon-Do. Arch. Budo 2012, 8, 213–218. [Google Scholar] [CrossRef]
- Shan, G. Biomechanical Know-how of Fascinating Soccer-kicking Skills—3D, Full-body Demystification of Maximal Instep Kick, Bicycle kick & Side Volley. In Proceedings of the 8th International Scientific Conference on Kinesiology, Opatija, Croatia, 10–14 May 2017; University of Zagreb: Zagreb, Croatia, 2017. [Google Scholar]
- Shan, G.; Yuan, J.; Hao, W.; Gu, M.; Zhang, X. Regression Equations related to the Quality Evaluation of Soccer Maximal Instep Kick for Males and Females. Kinesiology 2012, 44, 139–147. [Google Scholar]
- Komi, P.V. Stretch-shortening cycle: A powerful model to study normal and fatigued muscle. J. Biomech. 2000, 33, 1197–1206. [Google Scholar] [CrossRef]
- Hubbard, M. The flight of sports projectiles. Biomech. Sport 2000, 381–400. [Google Scholar]
- Tian, Y.; Meng, X.; Tao, D.; Liu, D.; Fen, C. Upper limb motion tracking with the integration of IMU and Kinect. Neurocomputing 2015, 159, 207–218. [Google Scholar] [CrossRef]
- Shan, G.; Zhang, X.; Meng, M.; Wilde, B. A Biomechanical Study for Developing Wearable-Sensor System to Prevent Hip Fractures among Seniors. Appl. Sci. 2017, 7, 771. [Google Scholar] [CrossRef]


| Duration (s) | National-Level | College-Level | Difference |
|---|---|---|---|
| Initiation | 4.66 | 4.24 | 9.9% |
| Transition | 1.09 | 1.38 | −21.0% |
| 1st Turn | 0.77 | 0.82 | −6.1% |
| 2nd Turn | 0.54 | 0.68 | −20.6% |
| 3rd Turn | 0.46 | 0.70 | −34.3% |
| Throw | 0.41 | 0.54 | −24.1% |
| Tension (N) | National-Level | College-Level | Difference |
|---|---|---|---|
| Initiation | 371 | 411 | −9.8% |
| Transition | 975 | 947 | 3.0% |
| 1st Turn | 1023 | 1172 | −12.7% |
| 2nd Turn | 1184 | 1330 | −11.0% |
| 3rd Turn | 1673 | 1484 | 12.7% |
| Throw | 2853 | 2350 | 21.4% |
| P-T Value (N) | National-Level | College-Level | Difference |
|---|---|---|---|
| Transition | 205 | 178 | 15.1% |
| 1st Turn | 587 | 238 | 146.7% |
| 2nd Turn | 704 | 395 | 78.3% |
| 3rd Turn | 463 | 416 | 11.3% |
| Hand Vertical Height (m) | National-Level | College-Level | Difference |
|---|---|---|---|
| P-T value of Transition | 0.78 | 0.85 | −9.0% |
| P-T value of 1st Turn | 0.59 | 0.41 | 30.5% |
| P-T value of 2nd Turn | 0.66 | 0.44 | 33.3% |
| P-T value of 3rd Turn | 0.72 | 0.62 | 13.9% |
| Release | 1.45 | 1.44 | 0.7% |
| P-T Value of Trunk Tilt (°) | National-Level | College-Level | Difference |
|---|---|---|---|
| Initiation | 33.6 | 35.7 | −6.2% |
| Transition | 29.9 | 38.6 | −29.1% |
| 1st Turn | 6.3 | 18.8 | −198.4% |
| 2nd Turn | 11.8 | 12.6 | −6.8% |
| 3rd Turn | 14.4 | 14 | 2.8% |
| Throw | 29.7 | 16.8 | 43.4% |
| Hip Vertical Height (m) | National-Level | College-Level | Difference |
|---|---|---|---|
| P-T value of Transition | 0.12 | 0.14 | −16.7% |
| P-T value of 1st Turn | 0.09 | 0.07 | 22.2% |
| P-T value of 2nd Turn | 0.11 | 0.15 | −36.4% |
| P-T value of 3rd Turn | 0.12 | 0.09 | 25.0% |
| Release | 1.11 | 1.06 | 4.5% |
© 2020 by the authors. Licensee MDPI, Basel, Switzerland. This article is an open access article distributed under the terms and conditions of the Creative Commons Attribution (CC BY) license (http://creativecommons.org/licenses/by/4.0/).
Share and Cite
Wan, B.; Gao, Y.; Wang, Y.; Zhang, X.; Li, H.; Shan, G. Hammer Throw: A Pilot Study for a Novel Digital-Route for Diagnosing and Improving Its Throw Quality. Appl. Sci. 2020, 10, 1922. https://doi.org/10.3390/app10061922
Wan B, Gao Y, Wang Y, Zhang X, Li H, Shan G. Hammer Throw: A Pilot Study for a Novel Digital-Route for Diagnosing and Improving Its Throw Quality. Applied Sciences. 2020; 10(6):1922. https://doi.org/10.3390/app10061922
Chicago/Turabian StyleWan, Bingjun, Yuanyuan Gao, Ye Wang, Xiang Zhang, Hua Li, and Gongbing Shan. 2020. "Hammer Throw: A Pilot Study for a Novel Digital-Route for Diagnosing and Improving Its Throw Quality" Applied Sciences 10, no. 6: 1922. https://doi.org/10.3390/app10061922
APA StyleWan, B., Gao, Y., Wang, Y., Zhang, X., Li, H., & Shan, G. (2020). Hammer Throw: A Pilot Study for a Novel Digital-Route for Diagnosing and Improving Its Throw Quality. Applied Sciences, 10(6), 1922. https://doi.org/10.3390/app10061922