Article

Improved Packing Model for Functionally Graded Sand-Fines Mixtures—Incorporation of Fines Cohesive Packing Behavior

by
Ammar El-Husseiny
Collage of Petroleum Engineering and Geosciences, King Fahd University of Petroleum and Minerals, Dhahran 31261, Saudi Arabia
Appl. Sci. 2020, 10(2), 562; https://doi.org/10.3390/app10020562
Submission received: 4 December 2019 / Revised: 31 December 2019 / Accepted: 10 January 2020 / Published: 13 January 2020
(This article belongs to the Special Issue Functionally Graded Materials)

Abstract

:
Binary soil mixture, containing large silica particles (sand) mixed with variable content of very fine silt or clay, is an example of a functionally graded material that is important for several science and engineering applications. Predicting the porosity (or void ratio), which is a fundamental quantity that affects other physical properties, of such material as function of fines (clay or silt) fraction can be significant for sediment research and material design optimization. Existing analytical models for porosity prediction work well for binary mixed soils containing multi-sized non-cohesive particles with no clay, while such models frequently underestimate the porosity of sand-clay mixtures. This study aims to present an analytical model that accurately predicts the porosity of mixed granular materials or soils containing sand and very fine silt or clay (cohesive particles). It is demonstrated that accounting for the cohesive nature of very fine particles, which exists due to the effect of inter-particle forces, is a major missing aspect in existing packing models for mixed soils. Consequently, a previously developed linear packing model is modified so that it accounts for fines cohesive packing in sand-fines mixtures. The model prediction is validated using various experimental published data sets for the porosity of sand-fines mixtures. Improvement in the prediction of permeability and maximum packing dry density when incorporating cohesive packing behavior is discussed. The current model also provides important insights on the conditions under which, the lowest permeability and maximum packing state are expected.

1. Introduction

Many physical properties of granular materials such as permeability, shear strength, elastic modulus, thermal conductivity and electrical resistivity depend on the packing state (or porosity) of the materials [1,2,3,4,5,6,7,8]. Therefore, preparation of mixed soil specimens at a target porosity (or void ratio) or predicting the porosity of such mixtures can be of great significance for several applications in earth and environmental sciences [8,9,10], as well as civil engineering [11,12,13,14,15]. Due to their abundance in nature and their desirable low porosity and permeability, mixtures composed of coarse sand or aggregates mixed with very fine particles such as clay or fine silt (less than 0.100 mm in size), has received increasing attention [8,15,16,17,18,19,20]. Predicting the porosity (n) or void ratio (e) of such sand-fines mixtures can be essential for several applications such as: (a) converting mass to volume for a sediment deposits [19,21,22], (b) calculating porosity and permeability of unconsolidated siliciclastic sediments (mixture of sand and fines) [8,23,24,25,26], (c) predicting elastic properties of sand-clay mixtures as function of porosity and clay content [20,27] (d) optimizing selection of particle mixtures for property control of ceramic products [28,29,30,31].
Developing an analytical model to predict the porosity of binary mixed soils, composed of large and fine particles, have been the focus of many studies [15,32,33,34,35], as it can reduce the need for extensive laboratory testing. Westman and Hugill [28] and Lade et al. [34] presented an analytical model that is based on the ideal case—the fines can effectively fill the space between the large sand particles without disturbing their packing. The ideal packing condition should be theoretically satisfied when the ratio of fines (clay or silt) particle size ( d f ) to the large sand particle size ( d l ), R = d f / d l , is very small [28,36,37]. Although such ideal packing model provided reasonable estimates for porosity as suggested by few studies [25,38], an increasing body of literature showed that such model underestimates the porosity for sand-clay and sand-silt mixtures (e.g., References [15,20,26,32,33]). Recent studies modified the ideal packing model by incorporating correction parameters that can be estimated based on R (e.g., References [15,33,35]) to account for deviation from ideal packing. The prediction of such models works well for coarse-grained mixtures (e.g., gravel-sand) mixtures but still predicts near-ideal packing case for sand-clay mixtures, as pointed out by Zhang et al. [35]. Mixed soils involving large sand and clay or fine silt should satisfy the low R condition, thus it remains unclear when and why the packing of such mixtures deviates from ideal packing.
Packing of very fine cohesive particles (i.e., clay or fine silt) can be very different from larger non-cohesive particles (i.e., sand) due to the effect of inter-particle forces, such as van der Waals and electrostatic forces, whose impact on packing can become more important than gravity force for very fine particles [39,40,41]. Therefore, very fine particles such as clay or fine silt, tend to form aggregates that are larger than the actual particle size due to the cohesive nature of the particles. Zhang et al. [35], suggested that such cohesiveness can explain why the formulations developed for coarse-grained binary mixtures fail when applied to sand-clay mixtures. Nevertheless, the effect of fines cohesive packing behavior was never incorporated into the packing model for sand-clay or sand-silt mixtures.
This study aims to find an approach that incorporates fines cohesive packing behavior into the packing model for sand-fines mixtures. The word “fines” throughout this study refers to clay and fine silt, both having particle size less than 0.100 mm. The objective here is to develop a model that can accurately predict the porosity (n) or void ratio (e) of sand-fines mixtures, as function of fines fraction with the ultimate goal of improving the prediction of maximum dry packing density and permeability of such functionally graded material. Theoretical background of relevant existing packing model for binary mixtures is firstly reviewed before modifying the model and validating it using various experimental published data sets for sand-fines mixtures. Improvement in the prediction of permeability and maximum dry packing density when incorporating fines cohesive packing is also discussed and compared with the prediction assuming ideal packing and no cohesive packing behavior.

2. Background

2.1. Packing Model for Binary Mixtures

The relationship between porosity (or void ratio) of the binary mixed soil and fine particles fraction exhibits a “V-shape” trend as shown in Figure 1. Adding fines to the mixture initially decreases the porosity as fines fill the pore space available between the large particles, leading porosity to decrease until reaching a minimum value (i.e., maximum packing density, ϕ, condition where ϕ = 1 − n). The fines fraction, f f , at the minimum porosity is frequently called critical fine fraction, f f * (Figure 1a) and it refers to the amount of fine particles needed to fill the pore space completely between the larger grains [18,42,43]. Increasing the fraction of fine particles beyond the critical value increases porosity due to replacement of solid large particles by micro porous fines aggregates. When the fine-to-large particles diameter ratio, R, is very small (<0.05), the binary mixture packing is described as “ideal” [28,37,44,45]. In this case, the original packing of the coarse spheres is not disturbed by the fine spheres and vice versa. Consequently, the porosity of the two pure unmixed end-members (i.e., pure large sand and pure fines) remains constant after mixing. In such an ideal packing system, the porosity has been described mathematically using a linear packing model [28,37,44,45]. At any fraction of fines, the porosity of the binary mixture in the case of ideal packing can be determined using only the porosity of the pure unmixed end-members.
When R increases, the binary mixture packing starts to deviate from the ideal case, as the fine particles become large enough to disturb the original packing of the large particle and vice versa [15,33,44,45]. In this case, the porosity of the binary mixture becomes larger than the prediction of the ideal packing model (Figure 1a). To correct for the underestimation of porosity in mixed soils, several semi-empirical models have been developed by introducing a mixing-degree coefficient (λ) into the ideal packing model [15,26,33]. The authors empirically related the mixing coefficient to R, based on data set from mixtures characterized by variable R, in an effort to provide an approach for predicting λ based on properties of end-members alone. The modified “non-ideal” packing model could successfully predict the porosity of sandy soil containing small and large sands as shown for example in Figure 1a. Nevertheless, accounting for the size ratio effect alone in existing models frequently fails to predict the porosity for sand-clay or sand-silt mixtures where R is very small (R < 0.1) and when fine particles are less than 0.100 mm in size as pointed out by Chang et al. [33] and Zhang et al. [35]. This is because existing λ-R relationship predicts almost an ideal packing for very small size ratios which does not match experimental data as demonstrated in Figure 1b for example. That is, existing models developed for binary coarse-grained soil frequently underpredict the porosity or void ratio of sand-clay and sand-fine silt mixtures. A possible reason is that very fine particles, such as clay or fine silt, tend to form aggregates that are larger than the actual particle size due to the cohesive nature of the particles [35]. Packing of very fine particles can be very different from larger particles due to the effect of inter-particle forces, such as van der Waals and electrostatic forces, that can become more important than the gravity force in governing the packing of very fine particles [39,40]. This suggests that binary mixtures containing cohesive particles should be treated differently compared to completely non-cohesive mixtures.
Outside the literature examining sand-fines mixtures, earlier studies from powder technology and chemical engineering disciplines [41], provided useful insights about the incorporation of fines cohesiveness into the packing model for glass beads powder. The authors showed that the size ratio, R, to be used in the packing model should be larger than the actual one and they provided empirical relationships to find the appropriate size ratio [41]. Nevertheless, the applicability of such model was never examined for predicting the porosity of sand-clay or sand-silt mixtures. In this study, the existing model by Zou et al. [41] is evaluated using various published data sets for binary soil mixtures containing clay or fine silt and the required modifications are proposed so as to reproduce the experimental results.

2.2. Incorporating Fines Cohesive Packing Behavior

We present here a brief summary of the formulation for the packing model developed by Zou et al. [41] for binary mixtures of glass beads, while more details can be found in the original paper. According to the packing model presented by Zou et al. [41], two main mechanisms could explain the increase in porosity associated with non-ideal packing for any binary mixture: the loosening and the wall effects. Regarding the loosening effect, it impacts packing when the large particles are dominant (ff < f f * ) where fine particles occupy the spaces between large particles and loosen their packing. On the other hand, the wall effect occurs when the fine particles dominate the packing (ff > f f * ); in such case the large particles disrupt the original packing of the fine particles by introducing larger pores at the large particles wall boundaries.
The impact of the above two mechanisms on porosity is accounted for through the use of empirical functions which are incorporated into the ideal packing model. The binary mixture porosity in the large particle dominated ( n m l ) and fine particles dominated ( n m f ) case, can be found using Equations (1) and (2), while the corresponding correction functions for the loosening (L) and wall (W) effect can be estimated using Equations (3) and (4) respectively:
1 1 n m l = ( f f 1 n f + f l 1 n l ) ( 1 L ( r ) ) f f 1 n f , when   f f < f f *
1 1 n m f = ( f f 1 n f + f l 1 n l ) ( 1 W ( r ) )   n l f l 1 n l , when   f f > f f *
L   ( r ) = 1 ( 1 r ) 3.3 2.8   r   ( 1 r ) 2.7
W   ( r ) = 1 ( 1 r ) 2.0 0.4   r   ( 1 r ) 3.7 .
In the above expressions: f f is the mass fraction of fine particles; f l is the mass fraction of large particles ( f l = 1 f f ) ; n f and n l are the porosities of the two end-members (i.e., pure unmixed fine and pure unmixed large particles respectively). The subscripts f and l refer to fine (i.e., clay or silt) and large (i.e., sand) particles, respectively throughout this paper. The quantity r is the effective size ratio, which for binary mixtures of non-cohesive spheres will be equal to the actual fine-to-large particle size ratio, R [41]. Nevertheless, the authors found that below a critical fine particle size value ( d c r i ), the porosity of fine glass beads increases drastically as the particle size decreases due to the effect of inter-particle forces (i.e., cohesive forces). The “cohesive degree” describes how n varies with particle size below d c r i which separates the cohesive and non-cohesive behavior. In the presence of cohesive behavior, the effective size ratio (r) will be larger than R due to fines aggregation and can be found using Equation (5):
r = ( 1 x ) R p + x   R .
In Equation (5), p is a material constant that quantifies cohesive packing degree of the fine particles [41]. The degree of cohesive packing increases as p decreases, which leads to forming larger cohesive aggregates (i.e., d f increases) and thus, r increases. The parameter x describes how the fines cohesive packing contributes to the packing disturbance of large particles in the binary mixture and it is given by [41]:
x = 1 1.543 e x p ( 0.697 d l d c r i ) ,
based on Equation (6), it is evident that x decrease as d l decreases and becomes more similar to d c r i indicating that fine particles significantly disturb the packing of larger particles in the mixture. In this case, r increases for a given p according to Equation (5), suggesting larger loosening and wall effects [Equations (3) and (4)] and causing porosity to increase at a given f f .
It is worth mentioning that the critical fine fraction ( f f * ) is not known a priori. This fraction can be however determined by finding the f f at which n m l = n m f , which represents the lowest porosity point along the V-shaped trend [41,45]. An alternative approach for estimating the porosity of the mixture, nm, at any given f f is by calculating n m l and n m f for all f f and then using [45]:
n m = maximum   { n m l ,   n m f } ,
note that when r approaches zero, both L(r) and W(r) approach zero according to Equations (3) and (4); hence, Equations (1) and (2) reduce to the ideal packing condition. It is finally important to mention that the above packing model can be equivalently expressed in terms of void ratio rather than porosity by substituting n with e/(1 + e) in Equations (1) and (2).

3. Model Validation for Sand-Fines Mixtures

It can be inferred from the model presented above [Equations (1) through (6)] that estimating the binary mixture porosity as function of f f requires the determination of n l , n f , R, d l , d c r i and p. The first four parameters ( n l , n f , R and d l ) can be found using measurements of porosity and particle size analysis for the pure fine and large particles samples, while d c r i and p need to be determined for a given material. For binary mixtures of glass beads characterized by very small R (<0.1), p has an average value of 0.2, while d c r i was found to be 0.150 mm [41]. In the following, we aim to find the appropriate d c r i and p for binary sand-fines mixtures. Since the original model of Zou et al. [41] was formulated for dry binary mixtures of glass beads, we focus here on dry sand-fines mixtures for model calibration and validation. It is however important to note that the presence of water can complicate the behavior of fines such as clay and impact the void ratio of sand-clay mixtures [46,47,48]. Clay swelling (i.e., expansive behavior of clays) is an example of the complication caused by the presence of water [46,49,50].

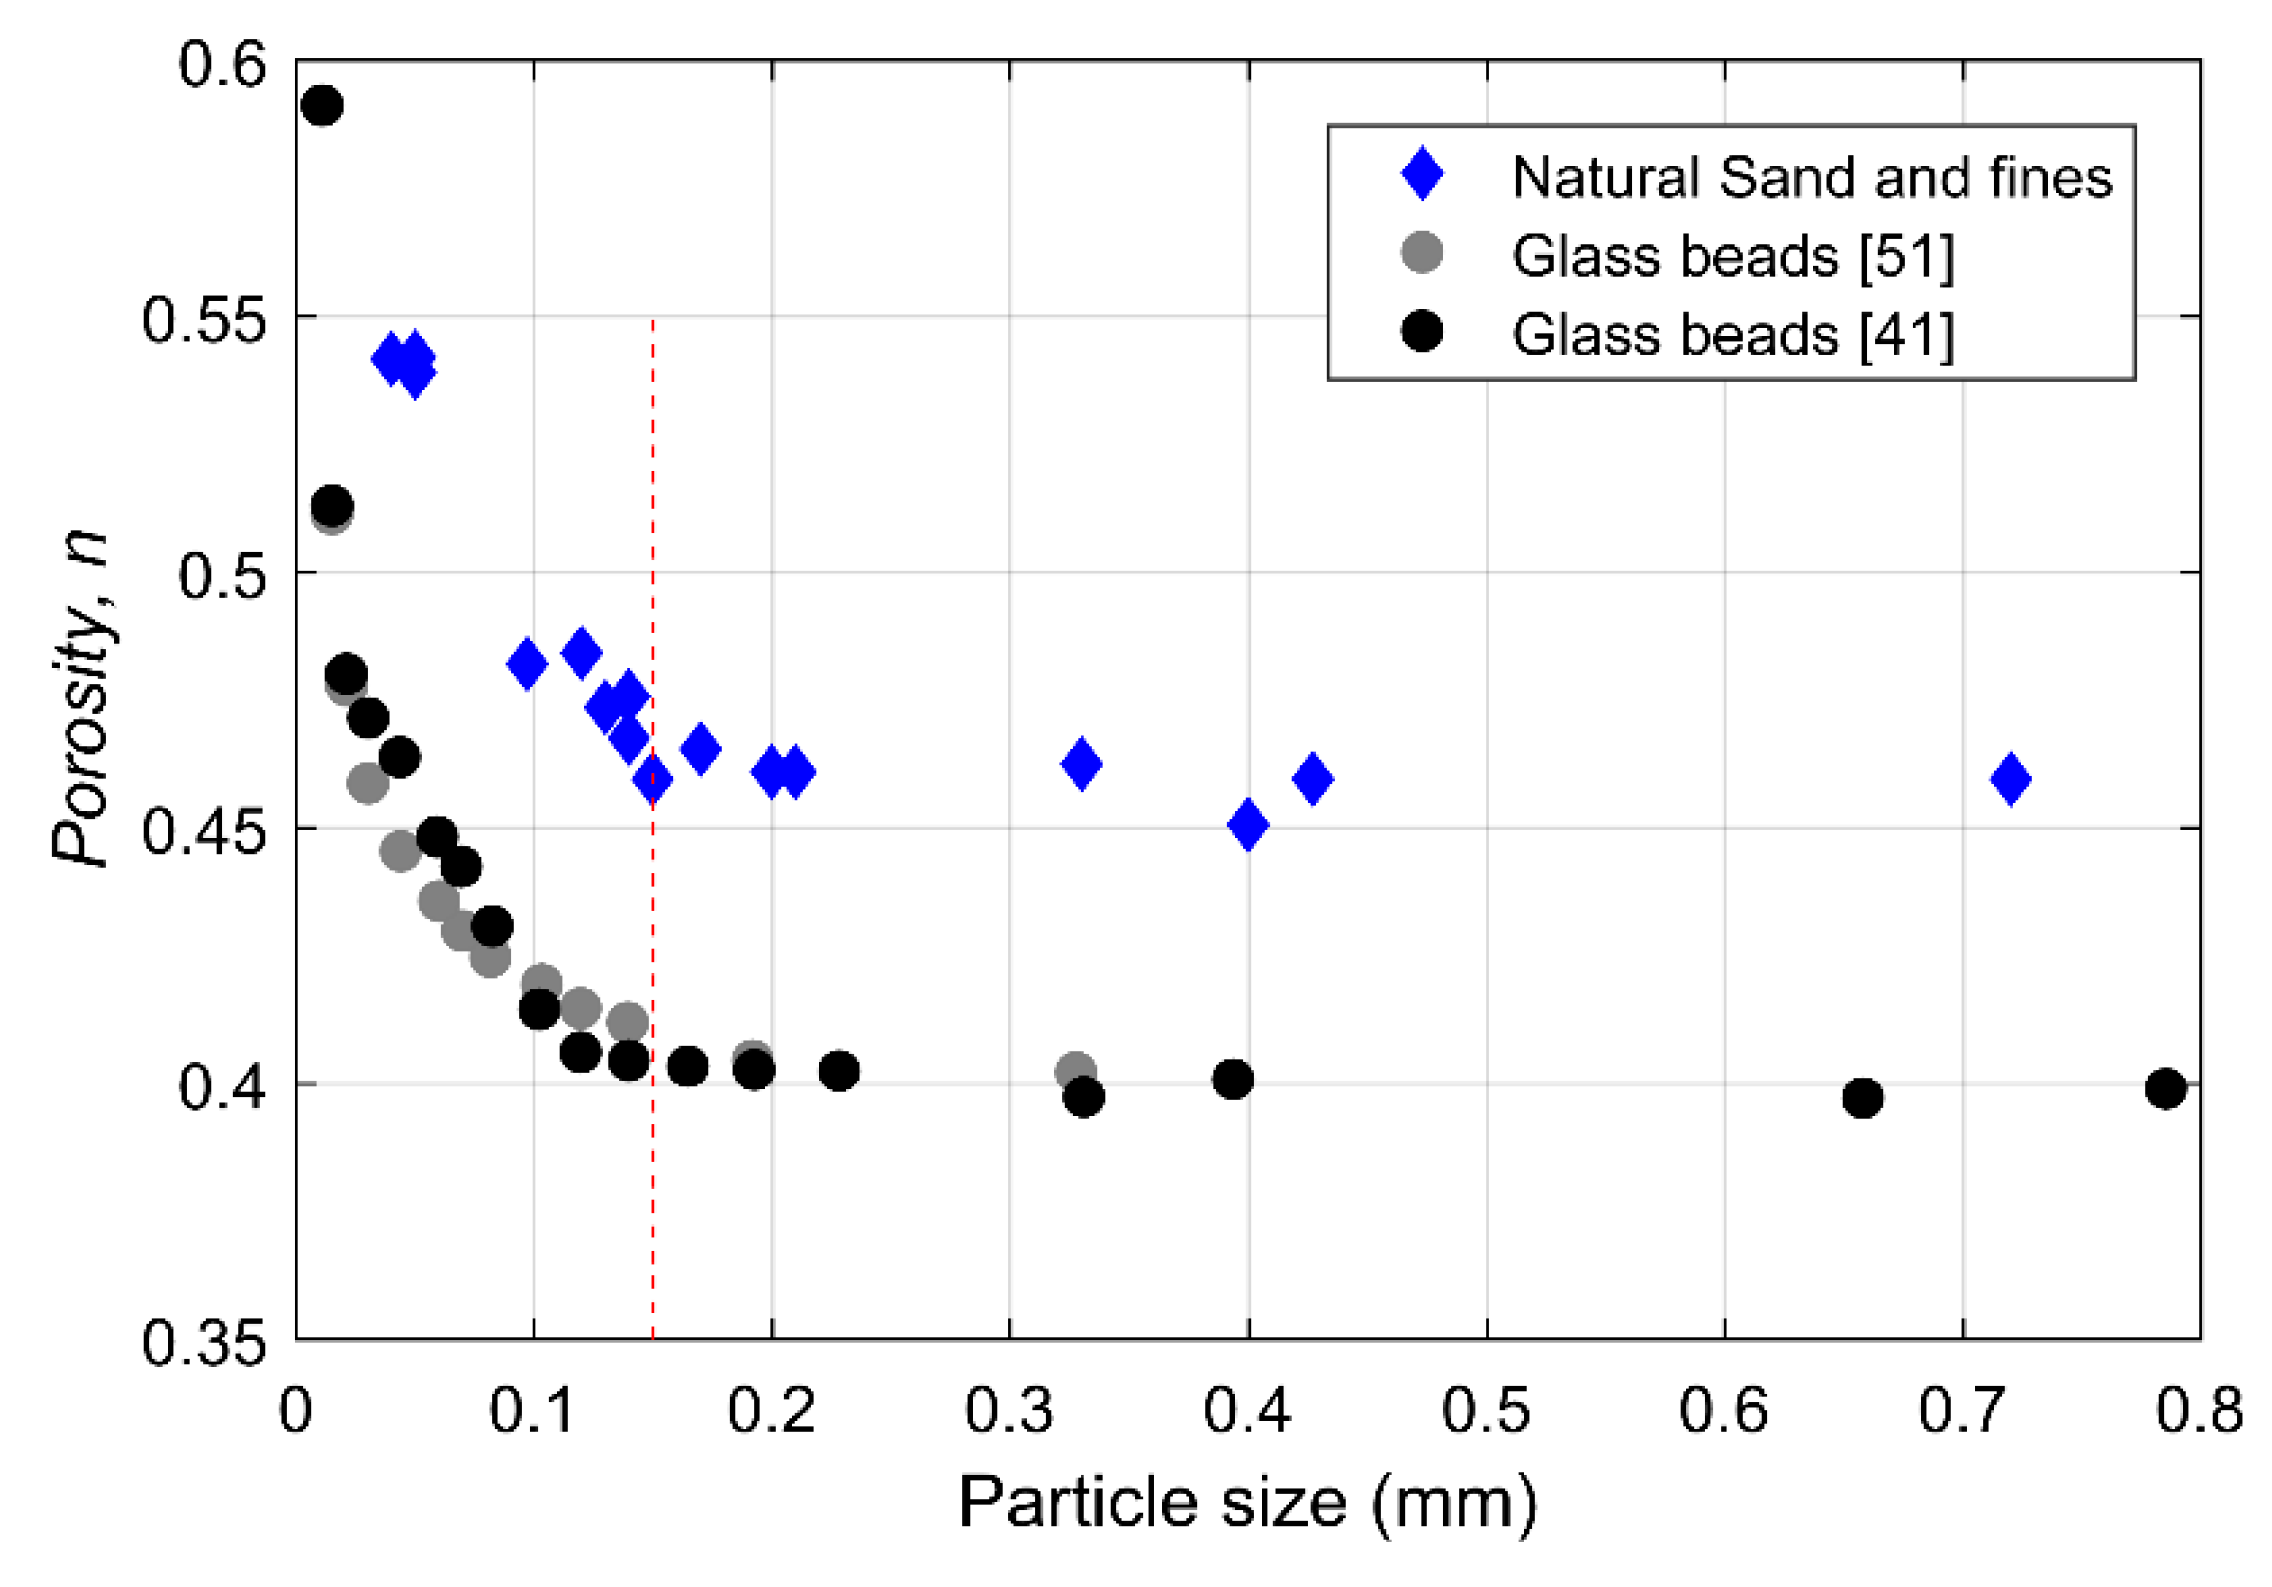
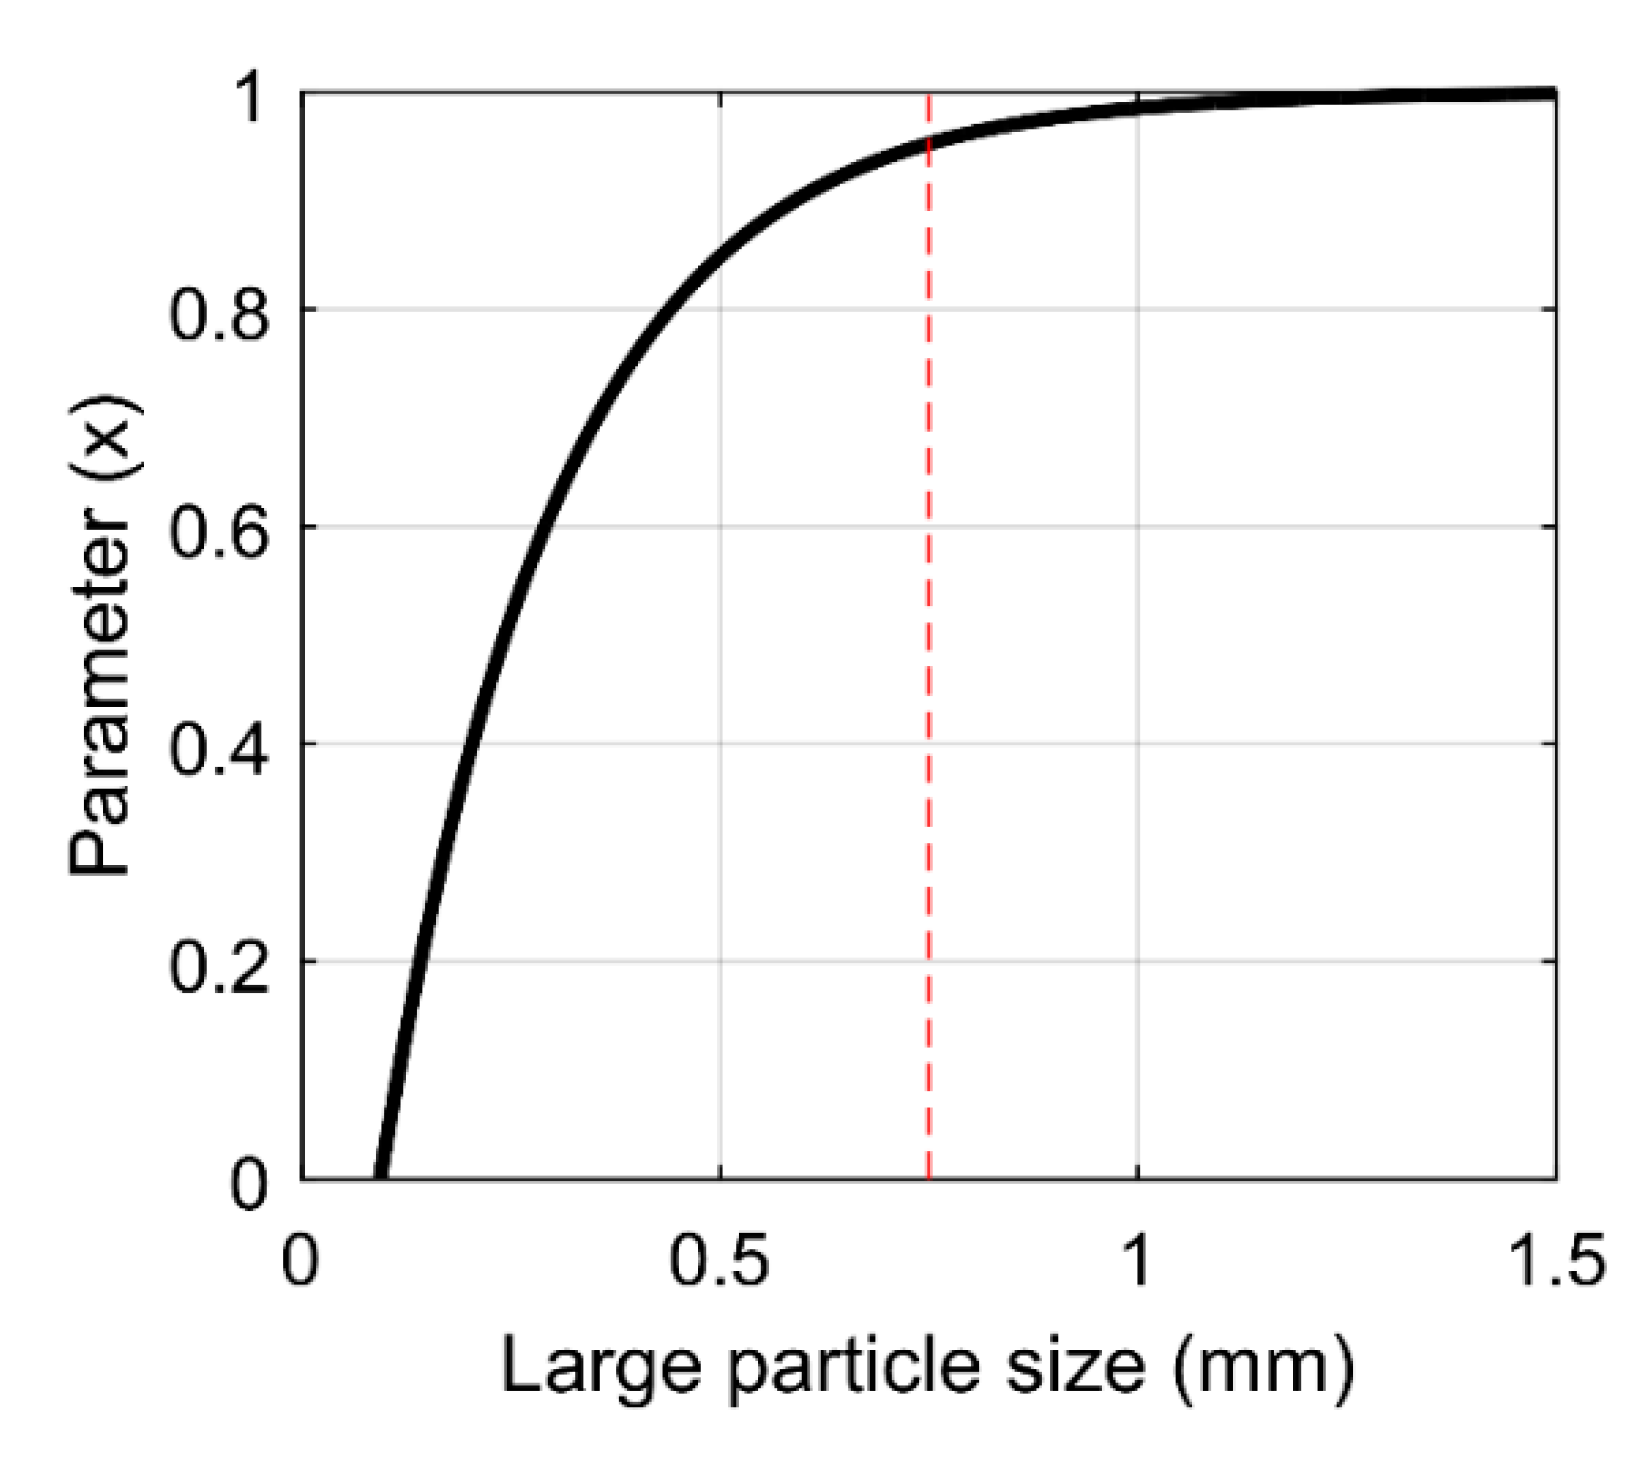
3.1. Evaluating the Critical Particle Size

Figure 2 shows the relationship between porosity and particle size for various spherical glass beads packs from literature [41,51].
At particle size above 0.150 mm, porosity of beads remains approximately the same despite the change in particle size (Figure 2), since particles has the same shape characteristics and their packing is governed by gravity. However, as particle size decreases below 0.150 mm, porosity started to increase with decrease in particle size (Figure 2). This is because as particle size decreases, the effect of inter-particle forces becomes more important than gravity and thus, causing fines aggregation or conglomeration that leads to higher porosity [40,57,58]. In order to find d c r i for sand and silt particles, we would need to construct relationship for porosity as function of particle size. It is however important to note that porosity of natural sand is function of particle shape too [9,52,59]. To rule out the effect of particle size alone, we used published dataset for only sand and fines with similar shape characteristics (i.e., roundness of 0.6 and sphericity of 0.8), measured at same condition (i.e., loose packing from maximum void ratio measurements). The porosity-particle size relationship is compared with the trend for glass beads (Figure 2). It can be noticed that 0.150 mm is a good estimate for d c r i of the natural sands and silts.
The natural sands and fines in Figure 2 has lower roundness and sphericity than glass beads which, as suggested by Cho et al. [52], can explain the higher porosity of the sands. Despite of the different shape and porosity values observed for sand in comparison with glass beads at the same particle size, the transition from cohesive to non-cohesive behavior seems to occur at the same d c r i .

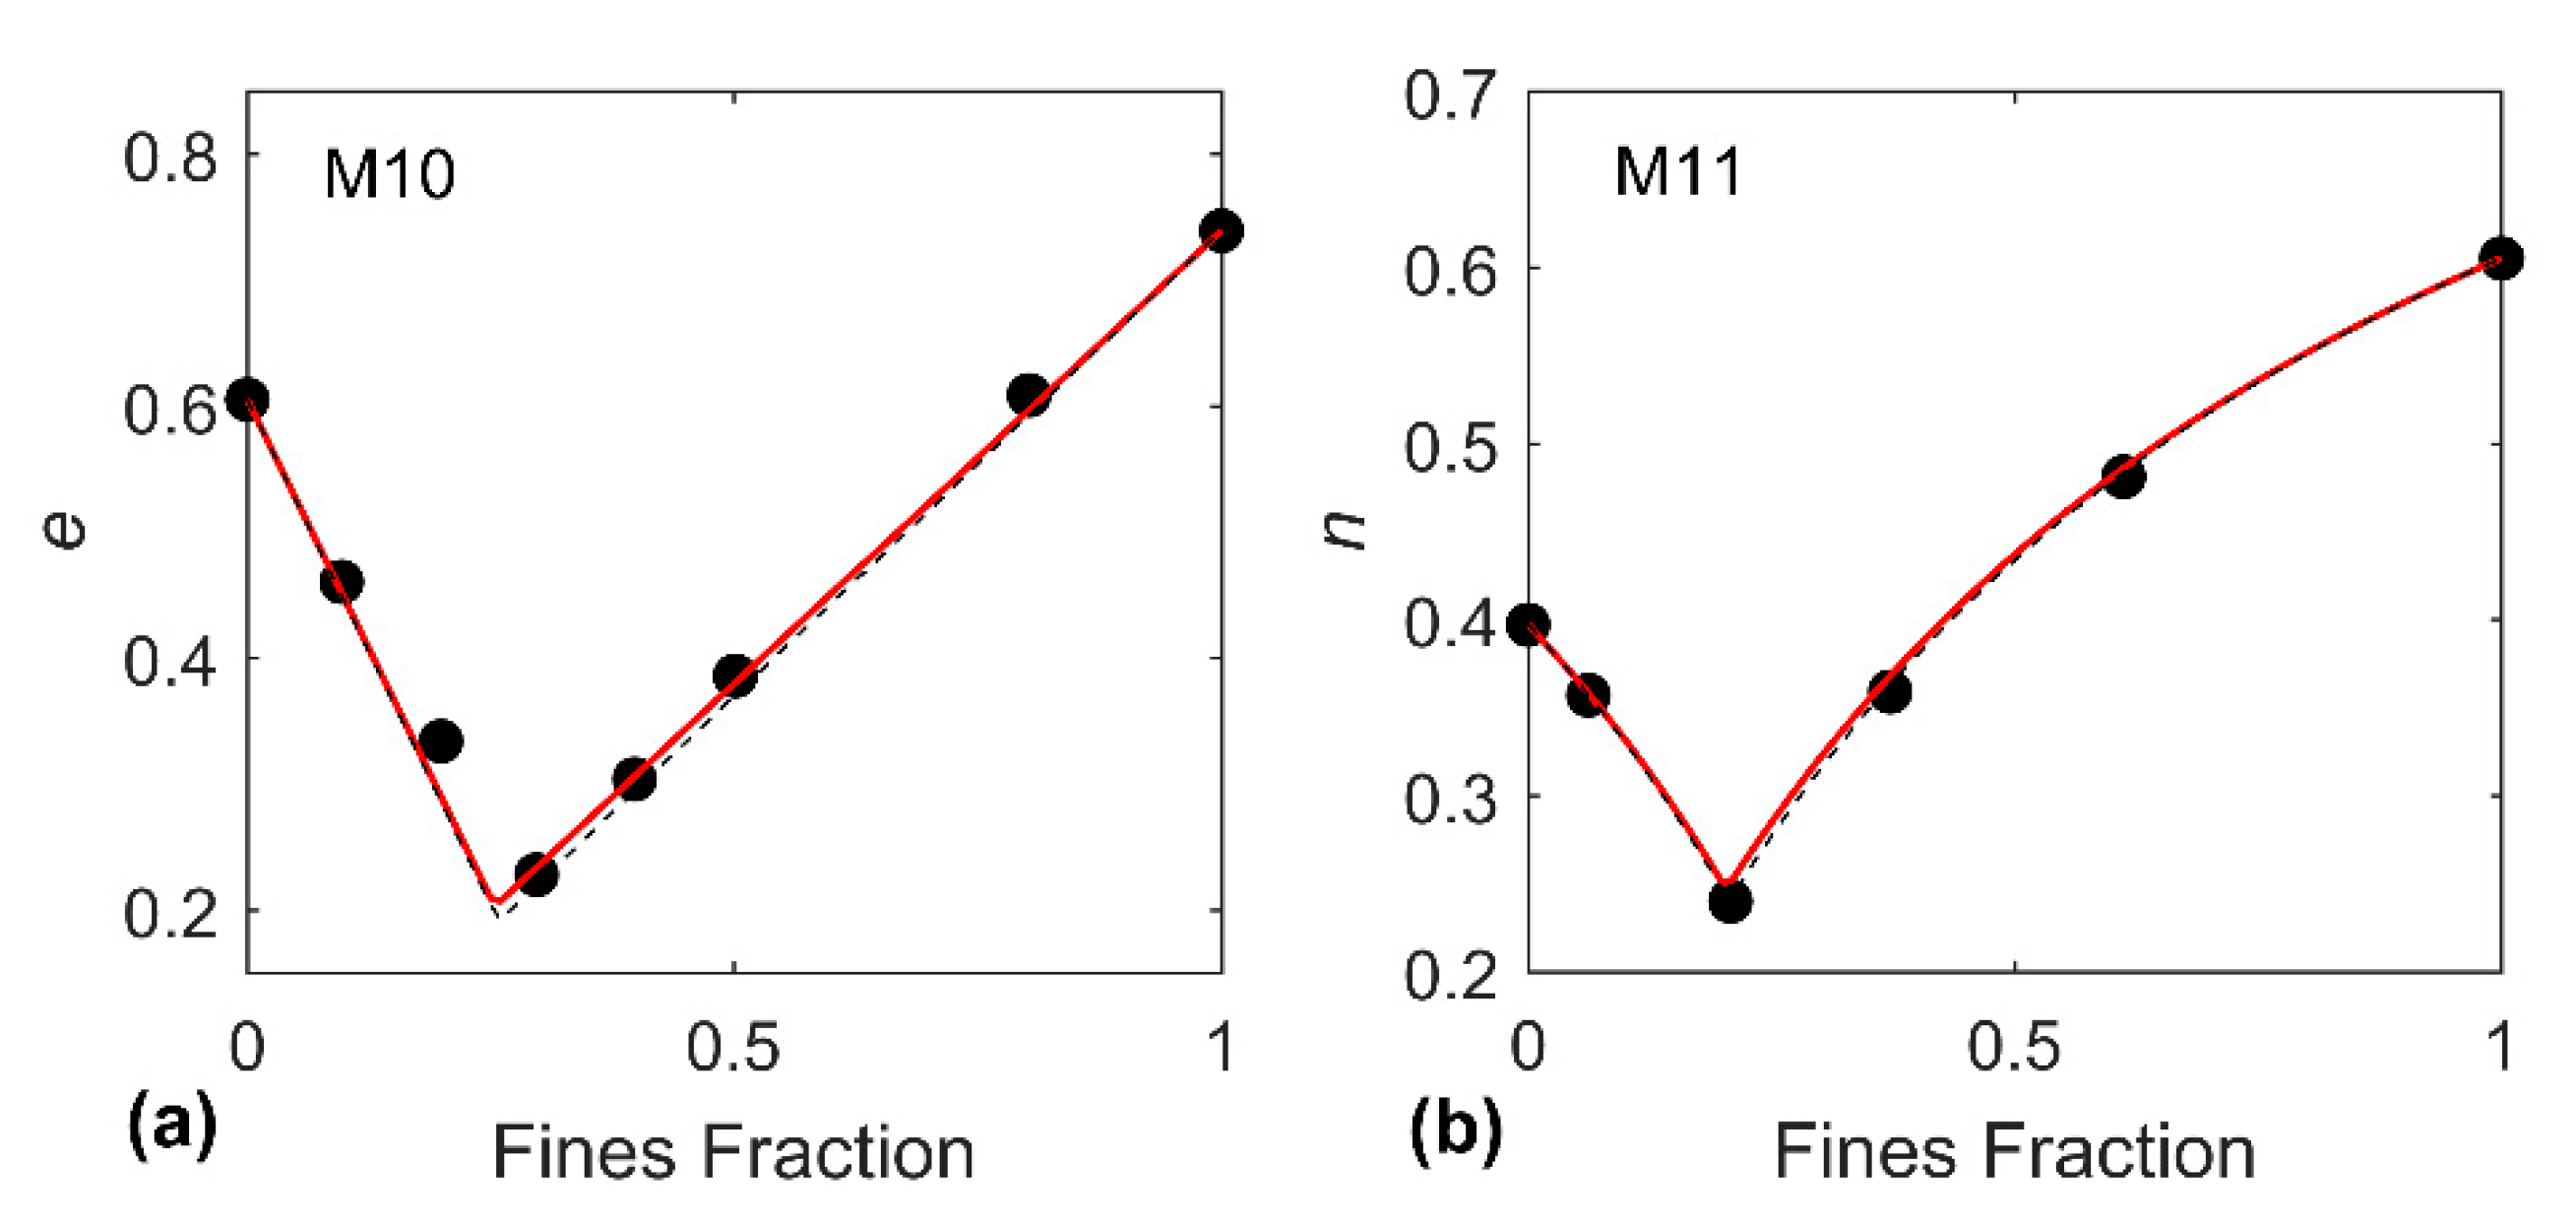
3.2. Evaluating the Cohesive Packing Parameter “p”

The current model [Equations (1)–(6)] was applied to various sand-silt and sand-clay mixtures (Table 1), to find the suitable parameter p that reproduces the experimental results. All mixtures used consists of binary mixed soils containing large particles (i.e., sand) and fine particles (i.e., fine silt or clay), where R is very small (R ≤ 0.1) and d f is smaller than 0.15 mm. All mixtures in Table 1 were prepared under dry conditions. The compaction condition (loose/poured versus dense/tapped) is shown in Table 1. The median particle size (d50) was used to represent the particle size when the particle size distribution is available while the average of the upper and lower sieve size was used otherwise. The best fitting value of p for each mixture is shown in Table 1. The analysis shows that p values for mixtures M1 to M10 are very close to each other (Table 1). Using an average value of p = 0.15, the experimental data can be reproduced reasonably well for all mixtures as demonstrated in Figure 3. When compared with the prediction of the ideal packing model, the use of the current model significantly improved the porosity and void ratio prediction (Figure 3).
For the remaining mixtures (M10 and M11), the analysis shows that p can take any value between 0 and 0.5 or 1 (Table 1) without significantly affecting the prediction. For those mixtures, packing seems to almost follow an ideal packing condition, which is also predicted by the current model as demonstrated in Figure 4. In the following section, a discussion about the packing of sand-fines mixtures in light of the recent findings is provided along with an explanation of why some mixtures deviates significantly from ideal packing while others seem to closely follow it. After that, the implications for minimum porosity (maximum dry packing density) and permeability prediction are discussed.

4. Discussion

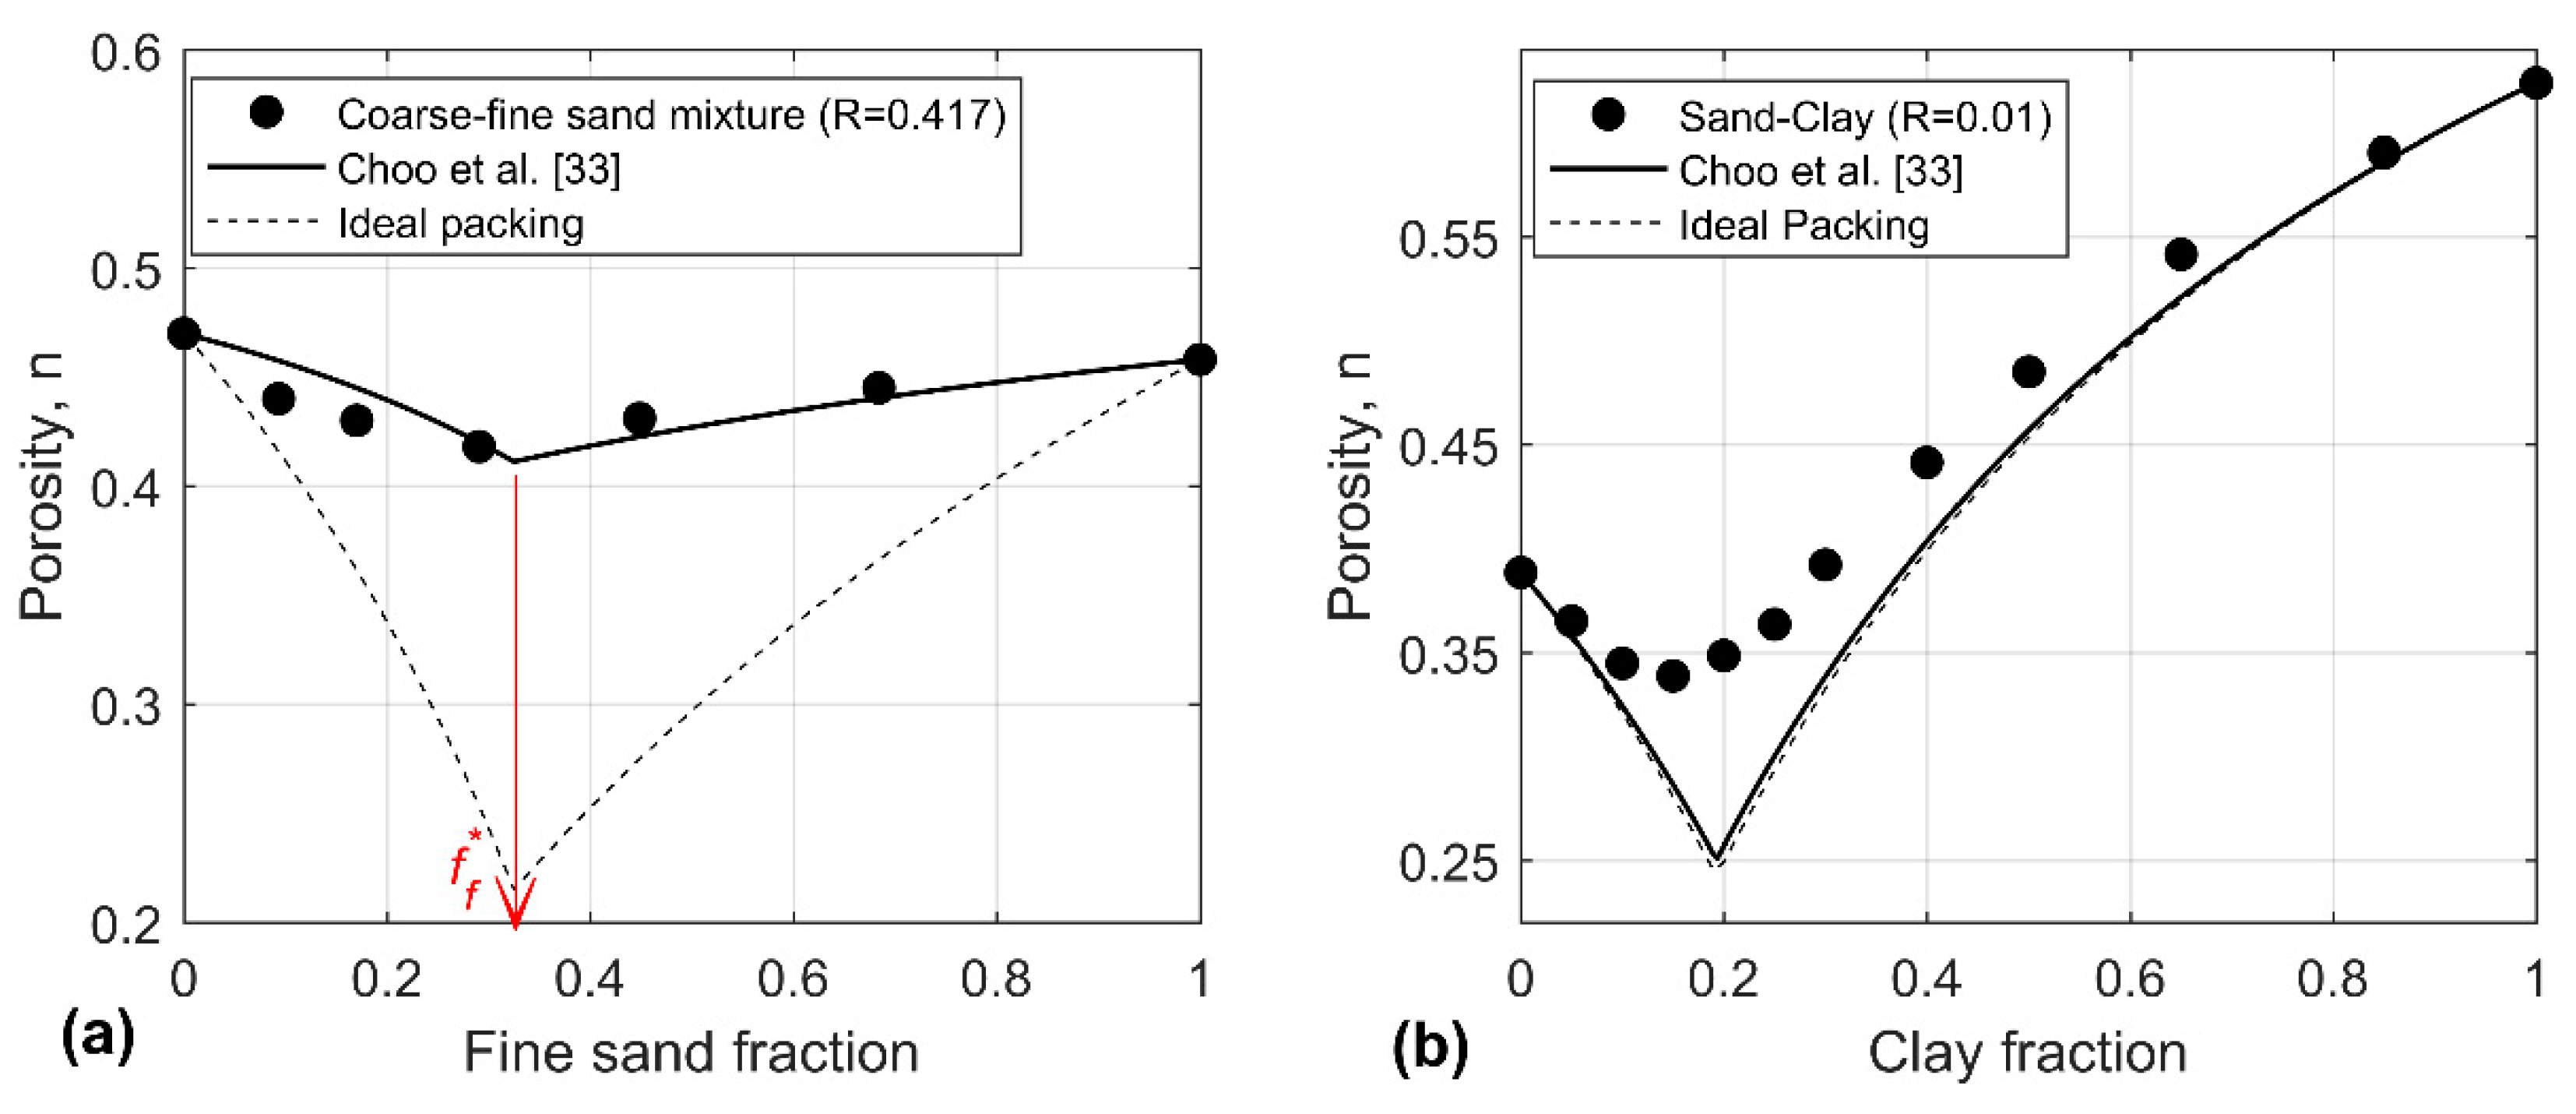
4.1. Ideal and Non-Ideal Packing for Sand-Fines Mixtures

The results presented in Figure 3 show a significant deviation from ideal packing for sand-clay and sand-silt mixtures despite of the small size ratio, R. The current model could explain this deviation through the incorporation of fines cohesive behavior by using d c r i of 0.15 mm and p = 0.15 in Equations (5) and (6). Nonetheless, the experimental and modeling results for mixtures M10 and M11 largely match with the ideal packing condition (Figure 4). Unlike the other mixtures, M10 and M11 share one important characteristic: d l is very large (>0.70 mm). Consequently, the parameter x in Equation (6) approaches 1 (>0.95), as shown in Figure 5 and thus the first term in Equation (5) approaches zero and the effect of p on r diminishes. That is, the cohesive packing behavior of the fine particles does not significantly disturb the packing of large particles once the latter becomes very large. In such case, r becomes predominantly function of R alone, as suggested by Equation (5), which can lead to near-ideal packing case if R is very small.
The ideal and non-ideal packing behavior of sand-fines mixtures is demonstrated in Figure 6. Both curves are constructed using exactly the same parameters including size ratio (R = 0.003) but the absolute large and fine particle sizes are different. For the near-ideal packing case, the large particle size is 0.750 mm while it is 0.250 mm for the non-ideal packing condition. The largest difference between the two cases can be observed around the minimum porosity value near f f * which corresponds to the maximum packing density condition. Error in predicting the actual porosity at such condition may result in significant underprediction of unconsolidated sediments initial volume and permeability in sedimentary basins [21,22,23,24,25]. At such maximum packing density, the maximum P-wave velocity of sand-fines sediment mixtures is also expected [20,27]. The prediction of such elastic property relies significantly on accurate prediction of the mixtures packing density [20,27]. Therefore, the following sections discusses how the current model can improve the prediction of maximum packing density.

4.2. Maximum Packing Density Prediction

The results shown in Figure 5 and Figure 6 highlight that minimizing porosity (i.e., maximizing packing density) at f f * , does not only require very small R but also d l has to exceed certain value. That is, packing density at any given fines fraction is function of absolute particle sizes rather than just the size ratio. This is a major difference between the current model and previous models (e.g., References [15,33]) introduced for sand-fines mixtures.
In Figure 7, we compare the measured maximum packing density (i.e., 1 − n at lowest porosity point) for all mixtures in Table 1, with predictions from three different approaches: (a) ideal packing (r = 0), (b) incorporating only R in the model (i.e., x = 1 for all mixtures) and (c) the current model incorporating both R and cohesive packing (p = 0.15, while x varies with d l ). The mean absolute percentage error for the three approaches was found to be 12.6%, 10.5% and 1.0% respectively. Incorporating the effect of R alone can only slightly improve the predictions compared to the ideal packing case (Figure 7) since R is very small anyhow for sand-clay and sand-silt mixtures. The analysis also shows that ignoring fines cohesive packing behavior can result in significant overestimation of maximum packing density (Figure 7). The predictions of the three approaches are close to each other only when approaching ideal packing condition as mentioned earlier for the two mixtures in Figure 4 (i.e., the largest measured maximum packing density in Figure 7).
The current model can then improve the prediction of the expected maximum packing density for mixtures composed of large and very small particles. According to the current model and observation, maximum packing density of sand-fines mixtures requires: (a) d l > 0.750 mm, (b) R to be very small and (c) n l and n f to be as small as possible.
It is important to note that the current model is developed for binary mixtures characterized by very small R (<0.1) where the fine particles have particle size less than 0.150 mm. The original model and correction functions [Equations (1)–(6)] were developed for spherical glass beads which can have very different shape compared to clay and silts particles, yet the analysis shown in this study suggests the validity of such formulations. Although particle shape can impact the packing, it is possible that at very low R, as it is the case for sand-clay mixtures, the impact of R and absolute particle size is dominating the packing behavior. It is also possible that the similar particle specific gravity of glass beads and sandy soil (both being predominantly composed of silica) is a major factor in having similar d c r i (Figure 2) and cohesive packing behavior. This is because specific gravity is a major control on inter-particle and gravity forces [36,37]. As R increases above 0.1 and the particle size of the fines increases above 0.150 mm, the role of particle shape is expected to become more important (as particle sizes become more similar), while the impact of cohesive packing diminishes and thus, the current model may not provide accurate prediction. For such mixtures containing coarser particles and characterized by large R, the model developed by Choo et al. [25] can be used.
It is also worth mentioning that although the current model and its correction functions [Equations (3) and (4)] were originally developed for poured packing condition [41], the model predictions match with experimental data for sand-fines mixtures prepared under both poured and tapped packing conditions (Figure 3 and Table 1). Although the poured mixtures seem to have slightly lower p values (0.13–14 as for mixtures M1, M2 and M4), compared to tapped mixtures (0.15–0.17 for mixtures M3, M5 and M8), the difference is too small that using an average p of 0.15 works well for all mixtures (Figure 3). Compaction reduces the void ratio and impacts packing characteristics of sand-fines mixtures [65,66,67,68]. Nevertheless, Chang et al. [65] showed that knowledge about the void ratio of unmixed pure sand and fines at any given compaction condition is essential for the void ratio prediction of sand-fines mixtures prepared at the same condition. It might be possible that the impact of compaction/tapping on the packing of the examined mixtures is largely accounted for by using porosity or void ratio of the unmixed compacted pure sand and pure fines as inputs in the current model. Supporting the same argument, Chang et al. [69] showed that emax (loose packing) for a sand-fines mixture could be predicted reasonably well using the same correction functions and parameters as for the emin (dense packing) case. This is given that void ratio of the pure sand and pure fines at each packing condition are used as inputs in the model [69]. Same behavior was observed for mixtures M4 and M5 where both are composed of the same sand and fines materials (Table 1) but one was prepared under loose packing condition (M4) while the other (M5) had dense/tapped packing. The void ratio of both mixtures could be however predicted using the same correction functions and parameters (Figure 3).
It should be noted that similar to existing models for example, References [15,33,65], the current model predicts porosity or void ratio of sand-fines mixtures as function of fines fraction, given that the porosity of end members is measured or known. The new contribution here is to account for the cohesive packing in the dry binary mixtures which improves the prediction when fines have particle sizes less than 0.15 mm. The estimation of porosity for the pure unmixed end members is not the focus of the current study and the reader is referred to other relevant studies about mono-sized or narrowly graded particles packing (e.g., References [70,71,72,73]).

4.3. Impact on Permeability

The aim in this discussion is to investigate how incorporating the notion of fines cohesive packing affects the prediction of permeability, K, for granular materials. Porosity, which can be significantly affected by cohesive packing as mentioned earlier, is a major factor that impacts K. The Kozeny-Carman formula is frequently used for estimating K for mixed soils and granular materials [2,4,8,33,35,74,75,76], where K is expressed as a function of porosity according to the following Equation (8):
K = ( d r e p 2 n 3 180 ( 1 n ) 2 ) ,
where d r e p is the representative particle size. For the pure unmixed sand or fines samples, representative particle size can be estimated from Equation (8) using the measured K and n values. For sand-fines mixtures, Zhang et al. [35] suggested to use a power-averaging method to determine d r e p of the mixture at any given f f as follows:
d r e p = ( f l   d r e p L m + f f   d r e p F m ) 1 / m ,
where d r e p L and d r e p F are the representative particle size of the large and fine particles, respectively. The coefficient m varies sigmoidally from −1 to 0 as f f decreases from 1 to 0 and it can be estimated empirically [35] through Equation (10):
m = 1 1 + exp [ a ( f l * f l ) ] 1 ,
where f l * is the critical large particle fraction ( f l * = 1 f f * ) above which K varies significantly with increasing f l ; and a is an empirical factor that controls the steepness of the a f f curve. In order to find a, the d r e p for sand-fines mixtures was calculated using the measured n and K in Equation (8) and then Equations (9) and (10) were used to find the best fit factor a, that can reproduce the d r e p of the mixture at variable fines fraction. An example is given in Figure 8 showing the calculated d r e p for mixture M1 and the best fit curve using Equations (9) and (10). We found that a = 10 provides the best fit for d r e p data calculated based on measured K and n for the different mixtures tested in the study (where K data is available).
Once the estimating equation for d r e p is determined as function of f f , K can be calculated as function of f f given that n is calculated using the current model [Equations (1)–(7)], where p = 0.15 and d c r i = 0.15 mm. In this case, K is predicted at any given f f , provided that the K and n of pure end-members are measured. The prediction of the current model shows good match with experimental data (Figure 9). The prediction of K assuming ideal packing for n is also shown using dashed curve in Figure 9 for comparison. The use of the current packing model improves the prediction of K in mixture M1 compared to the ideal packing model which underestimates n (Figure 3) and consequently underestimates K (Figure 9). On the other hand, both current model and ideal packing model predicts very similar K (Figure 9b) for mixture M11 which represents a near-ideal packing case (Figure 4b) as discussed earlier. That is, the current model can improve the prediction of K for mixtures where packing deviates from ideal case.
The main discrepancy between the two models is again observed around critical fines fraction (Figure 9a), at which the maximum discrepancy in predicted n occurs. The maximum difference between the K predicted by incorporating the current model and that assuming ideal packing is 70%, for mixture M1. Note that the difference does not seem as significant in Figure 9a only because K is plotted in log scale. Another important observation is that the minimum K can be observed around f f * only if the mixture follows the ideal packing condition (Figure 9b). Otherwise, K at f f = 1 is smaller than K at f f * (Figure 9a). This is because the porosity at f f * is not low enough, due to cohesive and non-ideal packing, to overcome the impact of larger d r e p at f f * compared to the 100% fines case. Based on the discussion above, higher porosity and permeability values are expected in sand-fines sediment mixtures deposited for example in aeolian environment when the sand particle size is fine (between 0.1 and 0.4 mm). Knowledge about sediment source and deposition environment can provide information about the expected particle size of the sediments and vice versa [78,79,80].

5. Conclusions

This study presents a packing model that can be used to predict the porosity or void ratio of binary soil mixtures involving clay or fine silt (i.e., characterized by R < 0.1 and d f < 0.150 mm). The model is based on the formulation of Zou et al. [41], developed originally for dry glass beads powder. The analysis is extended here to unsaturated sand-clay and sand-silt mixtures where the two main model parameters p and d c r i were found to be 0.15 and 0.150 mm respectively. Two important features of the current model: (1) it takes into account the cohesive packing behavior of the fines particles and (2) porosity of the mixture is not only function of particle size ratio but also the absolute particle size. The model shows significant improvement compared to existing models that frequently underestimate the porosity. The output of the model can be used to improve the estimation of important properties of the soil mixtures such as, maximum dry packing density (ϕ) and permeability (K), especially at the critical fines fraction ( f f * ). It was found that using the current packing model can reduce the error in estimating ϕ and K at f f * by up to one order of magnitude. According to the current model, maximum packing density (lowest sediment volume) and minimum permeability would require not only very small R but also d l that is larger than 0.750 mm. The current model can be used to predict the porosity or void ratio as function of fines content for mixed soils prepared or deposited under dry conditions.

Funding

This research was supported by the Startup Research Grant No. SR181007, funded by the deanship of scientific research in King Fahd University of Petroleum and Minerals (KFUPM).

Acknowledgments

The author thanks the deanship of scientific research in KFUPM for their financial (Grant No. SR181007) and administrative support.

Conflicts of Interest

The author declares no conflict of interest.

References

  1. Zhou, W.; Zhang, L.; Wu, P.; Cai, Y.; Zhao, X.; Yao, C. Study on Permeability Stability of Sand-Based Microporous Ceramic Filter Membrane. Materials 2019, 12, 2161. [Google Scholar] [CrossRef] [Green Version]
  2. Hwang, H.; Jeen, S.K.; Suleiman, A.A.; Lee, K. Comparison of Saturated Hydraulic Conductivity Estimated by Three Different Methods. Water 2017, 9, 942. [Google Scholar] [CrossRef] [Green Version]
  3. Ahn, J.; Jung, J. Effects of Fine Particles on Thermal Conductivity of Mixed Silica Sands. Appl. Sci. 2017, 7, 650. [Google Scholar] [CrossRef]
  4. Carrier, W.D. Goodbye, Hazen; Hello, Kozeny–Carman. J. Geotech. Geoenviron. Eng. 2003, 129, 1054–1056. [Google Scholar] [CrossRef]
  5. El-Husseiny, A.; Vanorio, T. Porosity-permeability relationship in dual porosity carbonate analogs. Geophysics 2017, 82, MR65–MR74. [Google Scholar] [CrossRef]
  6. Salgado, R.; Bandini, P.; Karim, A. Shear strength and stiffness of silty sand. J. Geotech. Geoenviron. Eng. 2000, 126, 451–462. [Google Scholar] [CrossRef]
  7. Selig, E.; Ladd, R. Evaluation of Relative Density Measurements and Applications: Evaluation of Relative Density and Its Role in Geotechnical Projects Involving Cohesionless Soils; ASTM International: West Conshohocken, PA, USA, 1973. [Google Scholar]
  8. Kamann, P.J.; Ritzi, R.W.; Dominic, D.F.; Conrad, C.M. Porosity and permeability in sediment mixtures. Groundwater 2007, 45, 429–438. [Google Scholar] [CrossRef]
  9. Kerimov, A.; Mavko, G.; Mukerji, T.; Dvorkin, J.; Al Ibrahim, M.A. The influence of convex particles’ irregular shape and varying size on porosity, permeability, and elastic bulk modulus of granular porous media: Insights from numerical simulations. J. Geophys. Res. Solid Earth 2018, 123, 10563–10582. [Google Scholar] [CrossRef]
  10. Alakayleh, Z.; Clement, P.; Fang, X. Understanding the Changes in Hydraulic Conductivity Values of Coarse- and Fine-Grained Porous Media Mixtures. Water 2018, 10, 313. [Google Scholar] [CrossRef] [Green Version]
  11. Kim, M.; Seo, H. Evaluation of one-and two-parameter models for estimation of void ratio of binary sand mixtures deposited by dry pluviation. Granular Matter 2019, 21, 71. [Google Scholar] [CrossRef]
  12. Moini, M.; Sobolev, K.; Flores-Vivian, I.; Amirjanov, A. Modeling and Experimental Evaluation of Aggregate Packing for Effective Application in Concrete. J. Mater. Civ. Eng. 2019, 31, 04019001. [Google Scholar] [CrossRef]
  13. Osuji, S.O.; Inerhunwa, I. Determination of optimum characteristics of binary aggregate mixtures. Civ. Environ. Res. 2015, 7, 68–75. [Google Scholar]
  14. Wang, J.; Hu, B.; Hwei, J.; Soon, J.H. Physical and Mechanical Properties of a Bulk Lightweight Concrete with Expanded Polystyrene (EPS) Beads and Soft Marine Clay. Materials 2019, 12, 1662. [Google Scholar] [CrossRef] [Green Version]
  15. Chang, C.S.; Wang, J.Y.; Ge, L. Modeling of minimum void ratio for sand-silt mixtures. Eng. Geol. 2015, 196, 293–304. [Google Scholar] [CrossRef]
  16. Bandini, P.; Sathiskumar, S. Effects of silt content and void ratio on the saturated hydraulic conductivity and compressibility of sand-silt mixtures. J. Geotech. Geoenviron. Eng. 2009, 135, 1976–1980. [Google Scholar] [CrossRef]
  17. Liu, Z.R.; Ye, W.M.; Zhang, Z.; Wang, Q.; Chen, Y.G.; Cui, Y.J. Particle size ratio and distribution effects on packing behavior of crushed GMZ bentonite pellets. Powder Technol. 2019, 351, 92–101. [Google Scholar] [CrossRef]
  18. Simpson, D.C.; Evans, T.M. Behavioral thresholds in mixtures of sand and Kaolinite clay. J. Geotech. Geoenviron. Eng. 2016, 142, 04015073. [Google Scholar] [CrossRef]
  19. Wu, W.; Li, W. Porosity of bimodal sediment mixture with particle filling. Int. J. Sediment Res. 2017, 32, 253–259. [Google Scholar] [CrossRef]
  20. Marion, D.; Nur, A.; Yin, H.; Han, D. Compressional velocity and porosity in sand-clay mixtures. Geophysics 1992, 57, 554–563. [Google Scholar] [CrossRef]
  21. Colby, B.R. Discussion of Sediment transportation mechanics: Introduction and properties of sediment”, Progress report by the Task Committee on Preparation of Sediment Manual of the Committee on Sedimentation of the Hydraulics Division, V.A.; Vanoni, Chmn. J. Hydraul. Div. 1963, 89, 266–268. [Google Scholar]
  22. Wu, W.; Wang, S.Y. Formulas for sediment porosity and settling velocity. J. Hydraul. Eng. 2006, 132, 858–862. [Google Scholar] [CrossRef]
  23. Yiming, Y.; Zhang, L.; Luo, X. Calculating the primary porosity of unconsolidated sands based on packing texture: Application to braided river sands. Mar. Pet. Geol. 2019, 107, 515–526. [Google Scholar] [CrossRef]
  24. Luijendijk, E.; Gleeson, T. How well can we predict permeability in sedimentary basins? Deriving and evaluating porosity–permeability equations for noncemented sand and clay mixtures. Geofluids 2015, 15, 67–83. [Google Scholar] [CrossRef] [Green Version]
  25. Revil, A.; Cathles, L.M. Permeability of shaly sands. Water Resour. Res. 1999, 35, 651–662. [Google Scholar] [CrossRef]
  26. Koltermann, C.E.; Gorelick, S.M. Fractional packing model for hydraulic conductivity derived from sediment mixtures. Water Resour. Res. 1995, 31, 3283–3297. [Google Scholar] [CrossRef]
  27. Konishi, C. Predictions of elastic and transport properties for unconsolidated sediments by gravel-sand-clay mixture model. In Proceedings of the Near-Surface Asia Pacific Conference, Waikoloa, HI, USA, 7–10 July 2015; pp. 180–183. [Google Scholar]
  28. Westman, A.E.R.; Hugill, H.R. The packing of particles. J. Am. Ceram. Soc. 1930, 13, 767–779. [Google Scholar] [CrossRef]
  29. Yu, A.; Standish, N.; Mclean, A. Porosity calculation of nonspherical particles. J. Am. Ceram. Soc. 1993, 76, 2813–2816. [Google Scholar] [CrossRef]
  30. Quaranta, N.; Caligaris, M.; Unsen, M.; López, H.; Pelozo, G.; Pasquini, J.; Vieira, C. Ceramic tiles obtained from clay mixtures with the addition of diverse metallurgical wastes. J. Mat. Sci. Chem. Eng. 2014, 2, 1. [Google Scholar] [CrossRef] [Green Version]
  31. Saengthong, C. Effect of sand addition on the properties of clay body for Traguan pottery. Suranaree J. Sci. Technol. 2017, 24, 321–325. [Google Scholar]
  32. El-Husseiny, A.; Vanorio, T.; Mavko, G. Predicting porosity of binary mixtures made out of irregular nonspherical particles: Application to natural sediments. Adv. Powder Technol. 2019, 30, 1558–1566. [Google Scholar] [CrossRef]
  33. Choo, H.; Lee, W.; Lee, C.; Burns, S.E. Estimating Porosity and particle size for hydraulic conductivity of binary mixed soils containing two different-sized silica particles. J. Geotech. Geoenviron. Eng. 2018, 144, 04017104. [Google Scholar] [CrossRef]
  34. Lade, P.V.; Liggio, C.D.; Yamamuro, J.A. Effects of non-plastic fines on minimum and maximum void ratios of sand. Geotech. Test. J. 1998, 21, 336–347. [Google Scholar]
  35. Zhang, Z.F.; Ward, A.L.; Keller, J.M. Determining the porosity and saturated hydraulic conductivity of binary mixtures. Vadose Zone J. 2011, 10, 313–321. [Google Scholar] [CrossRef] [Green Version]
  36. Yu, A.B.; Standish, N. Porosity calculation of multi-component mixtures of particles. Powder Technol. 1987, 52, 233–246. [Google Scholar] [CrossRef]
  37. Liu, Y.; Jeng, D. Pore Structure of Grain-Size Fractal Granular Material. Materials 2019, 12, 2053. [Google Scholar] [CrossRef] [Green Version]
  38. Knoll, M.D.; Knight, R. Relationships between dielectric and hydrogeologic properties of sand–clay mixtures. In Proceedings of the Fifth International Conferention on Ground Penetrating Radar, Kitchener, ON, Canada, 12–16 June 1994; pp. 45–61. [Google Scholar]
  39. Israelachvili, J.N. Intermolecular & Surface Forces, 2nd ed.; Academic Press: London, UK, 1991. [Google Scholar]
  40. Visser, J. Van der Waals and other cohesive forces affecting powder fluidization. Powder Technol. 1989, 58, 1–10. [Google Scholar] [CrossRef]
  41. Zou, R.P.; Gan, M.L.; Yu, A.B. Prediction of the porosity of multi-component mixtures of cohesive and non-cohesive particles. Chem. Eng. Sci. 2011, 66, 4711–4721. [Google Scholar] [CrossRef]
  42. Choo, H.; Burns, S.E. Effect of over consolidation ratio on dynamic properties of binary mixtures of silica particles. Soil Dyn. Earthquake Eng. 2014, 60, 44–50. [Google Scholar] [CrossRef]
  43. Evans, T.M.; Valdes, J.R. The microstructure of particulate mixtures in one-dimensional compression: Numerical studies. Granul. Matter 2011, 13, 657–669. [Google Scholar] [CrossRef]
  44. McGeary, R.K. Mechanical packing of spherical particles. J. Am. Ceram. Soc. 1961, 44, 513–522. [Google Scholar] [CrossRef]
  45. Yu, A.B.; Standish, N. Estimation of the porosity of particle mixtures by a linear-mixture packing model. Ind. Eng. Chem. Res. 1991, 30, 1372–1385. [Google Scholar] [CrossRef]
  46. Al-Shayea, N.A. The combined effect of clay and moisture content on the behavior of remolded unsaturated soils. Eng. Geol. 2001, 62, 319–342. [Google Scholar] [CrossRef]
  47. Malizia, J.P.; Shakoor, A. Effect of water content and density on strength and deformation behavior of clay soils. Eng. Geol. 2018, 244, 125–131. [Google Scholar] [CrossRef] [Green Version]
  48. Collins, K.; McGown, A. The form and function of microfabric features in a variety of natural soils. Geotechnique 1974, 24, 223–254. [Google Scholar] [CrossRef]
  49. Sun, W.J.; Zong, F.Y.; Sun, D.; Wei, Z.; Schanz, T.; Fatahi, B. Swelling prediction of bentonite-sand mixtures in the full range of sand content. Eng. Geol. 2017, 222, 146–155. [Google Scholar] [CrossRef]
  50. Dafalla, M.A. The Compressibility and Swell of Mixtures for Sand-Clay Liners. Adv. Mat. Sci. Eng. 2017, 2017, 3181794. [Google Scholar] [CrossRef] [Green Version]
  51. Zou, R.P.; Xu, J.Q.; Feng, C.L.; Yu, A.B.; Johnson, S.; Standish, N. Packing of multi-sized mixtures of wet coarse spheres. Powder Technol. 2003, 130, 77–83. [Google Scholar] [CrossRef]
  52. Cho, G.C.; Dodds, J.; Santamarina, J.C. Particle shape effects on packing density, stiffness, and strength: Natural and crushed sands. J. Geotech. Geoenviron. Eng. 2006, 132, 591–602. [Google Scholar] [CrossRef] [Green Version]
  53. Alvarez, E. Effects of Particle Weight, Size, Shape, and Size Distribution on Maximum Void Ratio. Master’s Thesis, University of California, Davis, CA, USA, 2016. [Google Scholar]
  54. Edil, T.B.; Krizek, R.J.; Zelasko, J.S. Effect of grain characteristics on packing of sands. Sour. Inf. Available 1975, 1, 46–54. [Google Scholar]
  55. Fuggle, A.; Roozbahani, M.; Frost, J. Size effects on the void ratio of loosely packed binary particle mixtures. In Geo-Congress 2014: Geo-Characterization and Modeling for Sustainability; ASCE: Atlanta, GA, USA, 2014; pp. 129–138. [Google Scholar]
  56. Yang, J.; Wei, L.M. Collapse of loose sand with the addition of fines: The role of particle shape. Géotechnique 2012, 62, 1111–1125. [Google Scholar] [CrossRef] [Green Version]
  57. Liu, H.; Yu, Q.; Pfeffer, R.; Gogos, C. Mixing and packing of fine particles of different sizes. Ind. Eng. Chem. Res. 2011, 50, 198–206. [Google Scholar] [CrossRef]
  58. Mizuno, M.; Fukaya, A.; Jimbo, G. The estimation of packing characteristics by centrifugal compaction of ultrafine particles. KONA Powder Part. 1991, 9, 19–27. [Google Scholar] [CrossRef] [Green Version]
  59. Santamarina, J.C.; Cho, G.C. Soil behaviour: The role of particle shape. In Advances in Geotechnical Engineering: The Skempton Conference; Thomas Telford: London, UK, 2004; pp. 1–14. [Google Scholar]
  60. Yang, S.L.; Sandven, R.; Grande, L. Instability of sand-silt mixtures. Soil Dyn. Earthq. Eng. 2006, 26, 183–190. [Google Scholar] [CrossRef]
  61. Steiakakis, E.; Gamvroudis, C.; Komodromos, A.; Repouskou, E. Hydraulic conductivity of compacted kaolin–sand specimens under high hydraulic gradients. Electron. J. Geotech. Eng. 2012, 17, 783–799. [Google Scholar]
  62. Polito, C.P.; Martin, J.R. Effects of nonplastic fines on the liquefaction resistance of solids. J. Geotech. Geoenviron. Eng. 2001, 127, 408–415. [Google Scholar] [CrossRef]
  63. Zlatovic, S.; Ishihara, K. Normalized behavior of very loose non-plastic soils: Effects of fabric. Soils Found. 1997, 37, 47–56. [Google Scholar] [CrossRef] [Green Version]
  64. Thevanayagam, S.; Shenthan, T.; Mohan, S.; Liang, J. Undrained fragility of clean sands, silty sands and sandy silts. J. Geotech. Geoenviron. Eng. 2002, 128, 849–859. [Google Scholar] [CrossRef]
  65. Chang, C.S.; Meidani, M.; Deng, Y. A compression model for sand–silt mixtures based on the concept of active and inactive voids. Acta Geotech. 2017, 12, 1301–1317. [Google Scholar] [CrossRef]
  66. Konishi, Y.; Hyodo, M.; Ito, S. Compression and undrained shear characteristics of sand-fines mixtures with various plasticity. J. Geotech. Geoenviron. Eng. 2007, 63, 1142–1152. [Google Scholar] [CrossRef]
  67. Jafari, M.K.; Shafiee, A. Mechanical behaviour of compacted composite clays. Can. Geotech. J. 2004, 41, 1152–1167. [Google Scholar] [CrossRef]
  68. Tarantino, A.; De Col, E. Compaction behaviour of clay. Géotechnique 2008, 58, 199–213. [Google Scholar] [CrossRef] [Green Version]
  69. Chang, C.S.; Wang, J.Y.; Ge, L. Maximum and minimum void ratios for sand-silt mixtures. Eng. Geol. 2016, 211, 7–18. [Google Scholar] [CrossRef] [Green Version]
  70. Schruff, T.; Liang, R.; Rüde, U.; Schüttrumpf, H.; Frings, R.M. Generation of dense granular deposits for porosity analysis: Assessment and application of large-scale non-smooth granular dynamics. Comp. Part. Mech. 2018, 5, 59–70. [Google Scholar] [CrossRef]
  71. Chang, C.S.; Deng, Y.; Meidani, M. A multi-variable equation for relationship between limiting void ratios of uniform sands and morphological characteristics of their particles. Eng. Geol. 2018, 237, 21–31. [Google Scholar] [CrossRef]
  72. Patra, C.R.; Sivakugan, N.; Das, B.M.; Rout, S.K. Correlations for relative density of clean sand with median grain size and compaction energy. Int. J. Geotech. Eng. 2010, 4, 195–203. [Google Scholar] [CrossRef]
  73. Zou, R.P.; Yu, A.B. Evaluation of the packing characteristics of mono-sized non-spherical particles. Powder Technol. 1996, 88, 71–79. [Google Scholar] [CrossRef]
  74. Chapuis, R.P. Predicting the saturated hydraulic conductivity of soils: A review. Bull. Eng. Geol. Environ. 2012, 71, 401–434. [Google Scholar] [CrossRef]
  75. Ren, X.W.; Zhao, Y.; Deng, Q.L.; Kang, J.Y.; Li, D.X.; Wang, D.B. A relation of hydraulic conductivity-void ratio for soils based on Kozeny-Carman equation. Eng. Geol. 2016, 213, 89–97. [Google Scholar] [CrossRef]
  76. Das, B.M. Advanced Soil Mechanics; CRC Press: New York, NY, USA, 2008. [Google Scholar]
  77. Yin, H. Acoustic Velocity and Attenuation of Rocks: Isotropy, Intrinsic Anisotropy, and Stress Induced Anisotropy. Ph.D. Thesis, Stanford University, Stanford, CA, USA, 1992. [Google Scholar]
  78. Walling, D.E. The evolution of sediment source fingerprinting investigations in fluvial systems. J. Soils Sediments 2013, 13, 1658–1675. [Google Scholar] [CrossRef]
  79. Yang, H.; Shi, C. Sediment Grain-Size Characteristics and its Sources of Ten Wind-Water Coupled Erosion Tributaries (the Ten Kongduis) in the Upper Yellow River. Water 2019, 11, 115. [Google Scholar] [CrossRef] [Green Version]
  80. Baiyegunhi, C.; Liu, K.; Gwavava, O. Grain size statistics and depositional pattern of the Ecca Group sandstones, Karoo Supergroup in the Eastern Cape Province, South Africa. Open Geosci. 2017, 9, 554–576. [Google Scholar] [CrossRef]
Figure 1. Prediction of porosity as function of fine particles mass fraction for: (a) coarse and fine sand mixture (data from Choo et al. [33]); (b) sand-clay mixture (data from Marion et al. [20]). The prediction of the ideal packing model is shown in dashed curve while the prediction of non-ideal packing model (Choo et al. [33]) is shown in solid curve. All equations can be found in Choo et al. [33]. f f * refers to the critical fine fraction at which the minimum porosity is observed.
Applsci 10 00562 g001
Figure 2. Porosity as function of particle size for glass beads (in grey and black circles) and natural sands and fines (in blue). Data sources for the sand and fines: [11,34,52,53,54,55,56]. The red dashed line represents the particle size value of 0.15 mm.
Applsci 10 00562 g002
Figure 3. Porosity, n, (or void ratio, e) as function of fines fraction for mixtures M1 to M9 [(ai) respectively] from Table 1. Black circles refer to the experimental data (data sources are provided in Table 1), dashed curve is the prediction of ideal packing [Equations (1)–(4) assuming r = 0], while red curve is the current model prediction [Equations (1)–(6)] assigning p = 0.15.
Applsci 10 00562 g003
Figure 4. Porosity, n, (or void ratio, e) as function of fines fraction for mixtures (a) M10 and (b) M11. Prediction of ideal packing model is shown in dashed curve while the current model (p = 0.15) is shown in solid red curve.
Applsci 10 00562 g004
Figure 5. Parameter x as function of large particle size d l as described by Equation (6) for d c r i = 0.15, while d l = 0.75 mm is highlighted by dashed vertical red line, for which x = 0.95.
Applsci 10 00562 g005
Figure 6. Porosity as function of fines fraction as predicted by current model for two cases: the first one (green dotted curve) d l = 0.75 mm and d f = 0.002 mm, while the second case (red solid curve) d l = 0.25 mm and d f = 0.00067 mm. R is the same for both cases but the green curve is much closer to the ideal packing case (dashed black curve). n l and n f = 0.4 and 0.59 respectively for all cases.
Applsci 10 00562 g006
Figure 7. Measured maximum packing density versus predicted values obtained using three different approaches: ideal packing (black squares), incorporating R only (blue open diamond) and current model (red circles). The prediction of the three methods are close to each other only for mixtures M10 and M11 which have near-ideal packing and are characterized by high maximum packing density (>0.75).
Applsci 10 00562 g007
Figure 8. Representative particle size ( d r e p ) as function of fines fraction. Black circles refer to the calculated values of d r e p based on porosity and permeability measurement for sand-clay mixtures from Reference [77] which is the same data set used for mixture M1 (Marion et al. [20]. The red curve is calculated using Equations (8) and (9) for a = 10, while f l * value is obtained from the current packing model.
Applsci 10 00562 g008
Figure 9. Permeability as function of fines fraction for mixtures: (a) M1, (b) M11. Same mixtures described in Table 1. K prediction was done using Equations (8)–(10) considering current model to estimate n (red solid curve) or ideal packing (dashed black curve).
Applsci 10 00562 g009
Table 1. Materials properties of selected published experimental results for sand-fines mixtures used in the model evaluation. P and T in the third column refers to the poured and tapped packing conditions respectively.
Sand-Fines MixtureData SourcePacking d l (mm) d f (mm) R = d f / d l n l   o r   e l n f   o r   e f p
M1: Ottawa-Kaolinite[20]P0.2800.00250.0090.3890.6240.13
M2: Hokksund sand-silt[60]P0.4400.0320.0730.9491.480.13
M3: Crushed sand-Kaolinite[61]T0.2500.0250.10.330.420.17
M4: Monterey sand-silt[62]P0.4300.0300.070.821.730.14
M5: Monterey sand-silt[62]T0.4300.0300.070.630.730.15
M6: Toyoura sand-silt[63]T0.1700.0100.0590.5910.6090.15
M7: Foundry sand-silt[64]T0.2500.0100.040.82.10.15
M8:Assyros sand-silt[62]T0.3000.0200.0670.8020.770.17
M9: Fujian sand-crushed silica[56]P0.4270.0610.10.8551.3850.15
M10: Large-fine washed sand[28]P4.4700.0900.020.6050.739[0:1]
M11: Sand-Kaolinite[38]P0.7500.0020.0030.40.6[0:1]

