1. Introduction
Approximately 1500 volcanoes are considered active worldwide [
1]. However, the high costs and difficulties of maintaining instrumentation in volcanic environments results in fewer than half of the potentially active volcanoes being regularly monitored with ground-based sensors and fewer still are considered well-monitored even within countries with relatively well-resourced volcanological observatories [
2,
3,
4].
Island volcanoes present particular problems in this regard, both because of difficulties with accessibility and because on small islands the instrumentation has to be placed close to volcanic vents and so is especially vulnerable to damage from even mild background-level activity. Furthermore, island volcanoes present particular hazards because lateral collapses, including large sector collapses, at coastal and island volcanoes can occur with little or no precursory activity to provide unambiguous warning of impending collapses and have the potential to generate regionally destructive tsunamis [
5,
6].
Numerous volcanic crises have proven that the lack of monitoring capabilities can have dramatic consequences when violent events occur at remote volcanoes with little or no monitoring in place. Notable historical examples include Lamington, Papua New Guinea, 1951 [
7,
8] and El Chichon, Mexico, 1982 [
9,
10] but the potential for such unexpected and destructive events still persists.
Recent years have presented a number of examples of the challenges of managing rapid-onset volcanic events (e.g., Nabro, Eritrea, 2011 [
11]; Calbuco, Chile 2015 [
12] and Fuego, Guatemala 2018 [
13]); the most recent example of was the lateral collapse at Anak Krakatau (AK) in Indonesia on 22 December 2018, which occurred during an eruptive episode that had begun in June 2018 [
14]. The lateral collapse generated a tsunami which killed 437 people and displaced more than 16,000 according to the ASEAN (Association of Southeast Asian Nations) Coordinating Centre for Humanitarian Assistance on Disaster Management (AHA) [
15].
Satellite remote sensing can provide crucial and unique observations to identify pre-eruptive, syn-eruptive and post-eruptive signals when ground- or airborne-based acquisitions are not available [
16] because these areas are difficult to reach due to the danger of working on active volcanoes, as emphasized in particular by the 1993 incident at Galeras, Colombia [
17,
18]. Indeed, volcanologists and civil protection agencies need continuous data over a long period to evaluate the level of hazard volcanoes pose. Instruments on board the latest Earth Observation (EO) spacecraft have the ability to supply this much-needed time series information and to provide the data required to accurately map hazardous areas and exposed elements.
The aim of this work is to analyze shoreline changes associated with the AK activity for the period May 2018–November 2019, which includes the lateral collapse event. However, as discussed below there is a gap in the data during the period within which the collapse itself occurred, as well as episodes of intense eruptive activity causing rapid post-collapse regrowth—these were obscured from optical sensors by cloud and by the post-collapse eruption plumes for a period of almost two months (68 days). Nevertheless, in this study we show how satellite remote sensing provides data on shoreline change patterns at AK both before and after this data gap, which can be used to understand how the post-collapse regrowth of the island may be increasing the potential for future tsunamigenic lateral collapses at AK.
In this paper, we consider the shoreline as the physical interface of land and water according to Dolan et al. (1980) definition [
19]. Coastal areas and shorelines are the ever-changing boundary between the land and the sea, whose evolution is the product of mutual adjustments in topography, marine processes and, for volcanic islands, also volcanic activity [
20]. Since AK itself is uninhabited and without infrastructure except for that supporting volcano monitoring, there are no direct risks from these coastal changes. However, as noted above, the cascading hazard effects that may extend into the marine realm (e.g., tsunamigenic potential of landslides from the island) means that it presents significant risks to a much wider area. In addition, volcanic activity at the island presents more temporary risks to tourists, tourist boat crews, fishermen and others visiting the Krakatau islands as a whole.
The volcano description and the chronology of the most recent activity of AK is briefly described in
Section 2 along with the most recent published Earth Observation works already published on the 2018–2019 eruption. The adopted materials and methodology is described in
Section 3; results are presented and discussed in
Section 4. Conclusions are in
Section 5.
2. The AK 2018–2019 Activity
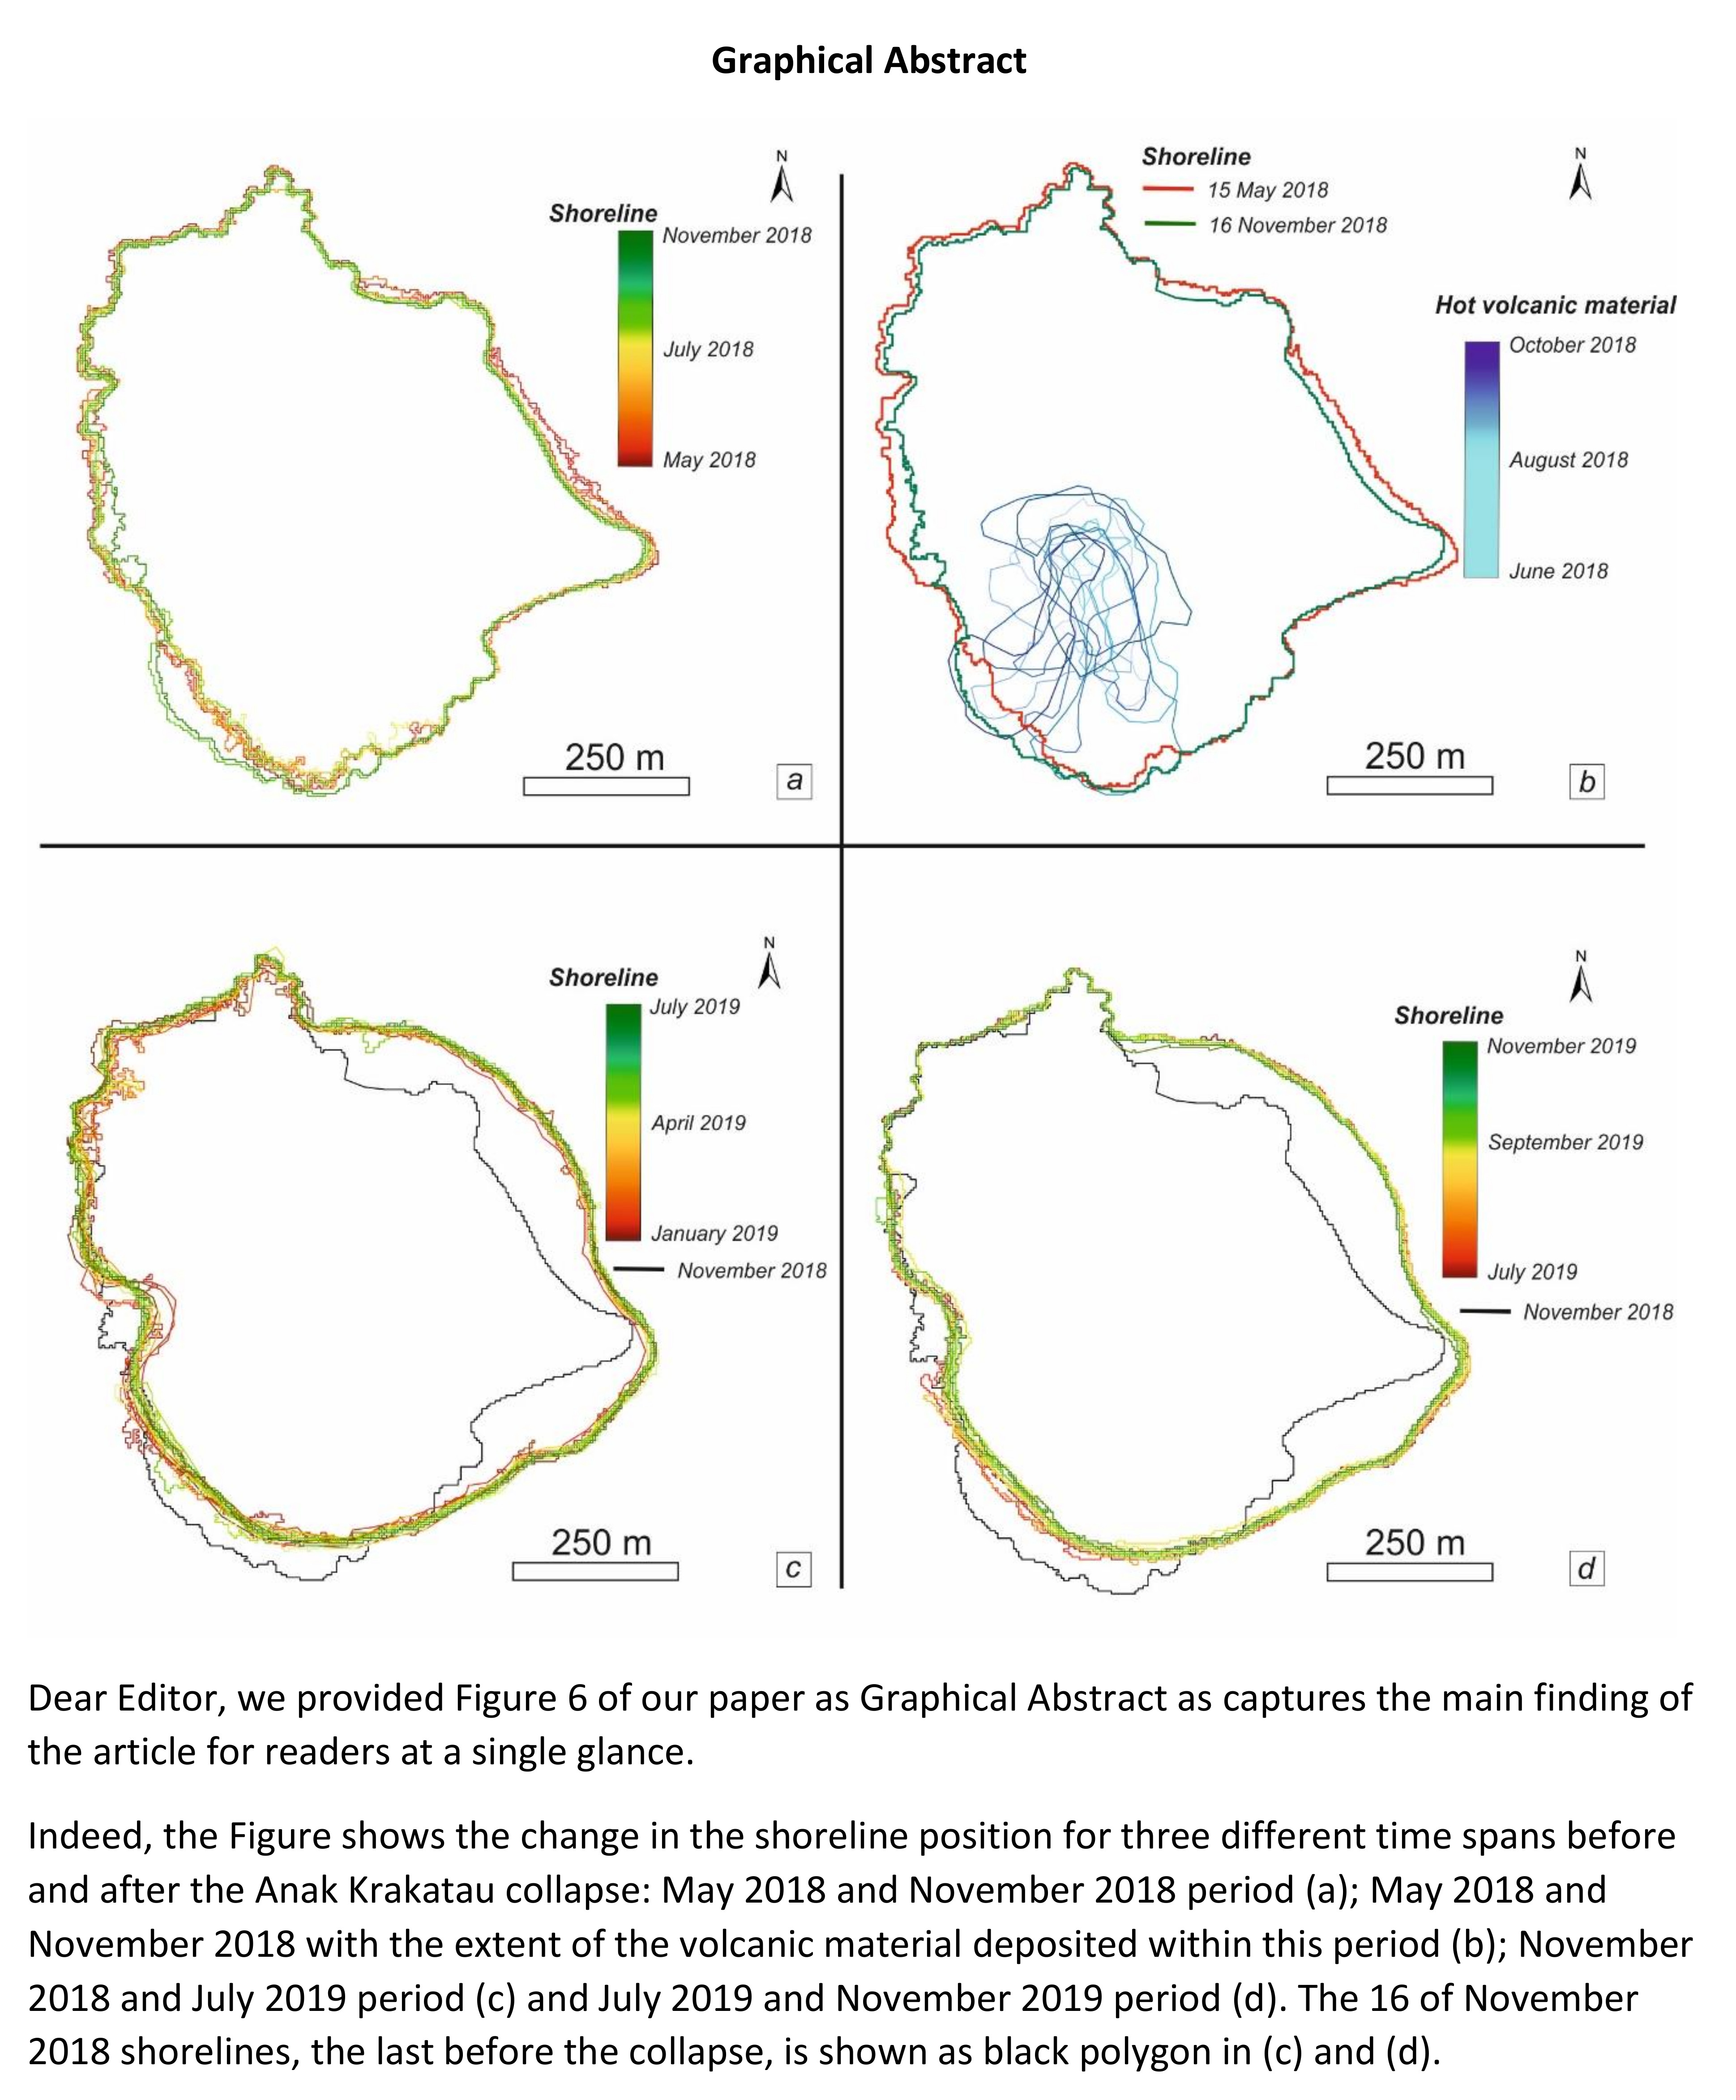
The Krakatau volcanic complex (
Figure 1), nestled between the islands of Java and Sumatra (Indonesia), is one of the most famous volcanoes worldwide due to the caldera-forming and tsunamigenic eruption of 1883 [
21,
22,
23] and the near-continuous eruptions (at least 45 over the last century) [
24] that led to the formation in late 1927 of a new subaerial volcanic cone, called AK or “child of Krakatau” that lies within the remnants of the collapsed caldera [
25,
26]. The volcanic complex is currently an archipelago with the volcanically active AK surrounded by Sertung island to NW, Panjang island to NE and Rakata island to SE (
Figure 1). Rakata is a remnant of the island that was volcanically active in 1883, whereas Sertung and Panjang are remnants of a caldera wall that pre-dates this.
Since its subaerial emergence, eruptive activity at AK has continued periodically [
27] and the shoreline has undergone substantial changes as the planform of the island has evolved—from an aerial extent of 1.55 km
2 in 1935 [
28], 2.29 km
2 in 1940 [
29], 1.52 km
2 in 1950 [
30], 2.2 km
2 in 1952 [
30], 3.16 km
2 in July 1996 [
31] and 3.03 km
2 in December 2018 [
32]. These fluctuations reflect the many eruptive episodes [
24] during which the island has grown through emission of lava flows and deposition of tephra [
27]. Such activity led to periods of coastal erosion both during and between eruptions and possibly also small earlier flank collapses, although no large and destructive tsunamis are known to have been produced in the Krakatau group since 1883, before that of 22 December 2018.
After 15 months of quiescence AK began a new eruption phase on 21 June 2018 (and currently ongoing), characterized by Strombolian activity that generated low-level ash plumes and ballistic ejecta, alongside lava flows [
24]. This activity was typical in style of that which occurred in preceding decades, although there is evidence that the overall magmatic flux was notably high in this period [
32]. On the 22 December 2018, several months after eruptive activity had begun, a lateral collapse event reduced the height of the island from 320 to 120 m [
32] and approximately halved the island area [
33]. The south-west flank is thought to have collapsed, partially as a result of its over steepening due both to long-term growth on this side of the island, which is built on a submarine scarp of the 1883 caldera and the additional volume erupted between June and December 2018 [
32,
33].
The lateral collapse cut the active vent beneath sea-level, resulting in a transition to phreatomagmatic explosive activity. Particularly intense phreatomagmatic activity in the days following the collapse caused rapid-regrowth of the island with a very different morphology, including a largely new coastline whose development we document in this paper.
In contrast to previous studies focusing on exploiting satellite imagery from cloud-based platforms like Google Earth Engine (GEE) for multi-decadal [
34] or worldwide assessment of shorelines [
35], here we present and validate a methodology developed in GEE based on the adaptation of Reference [
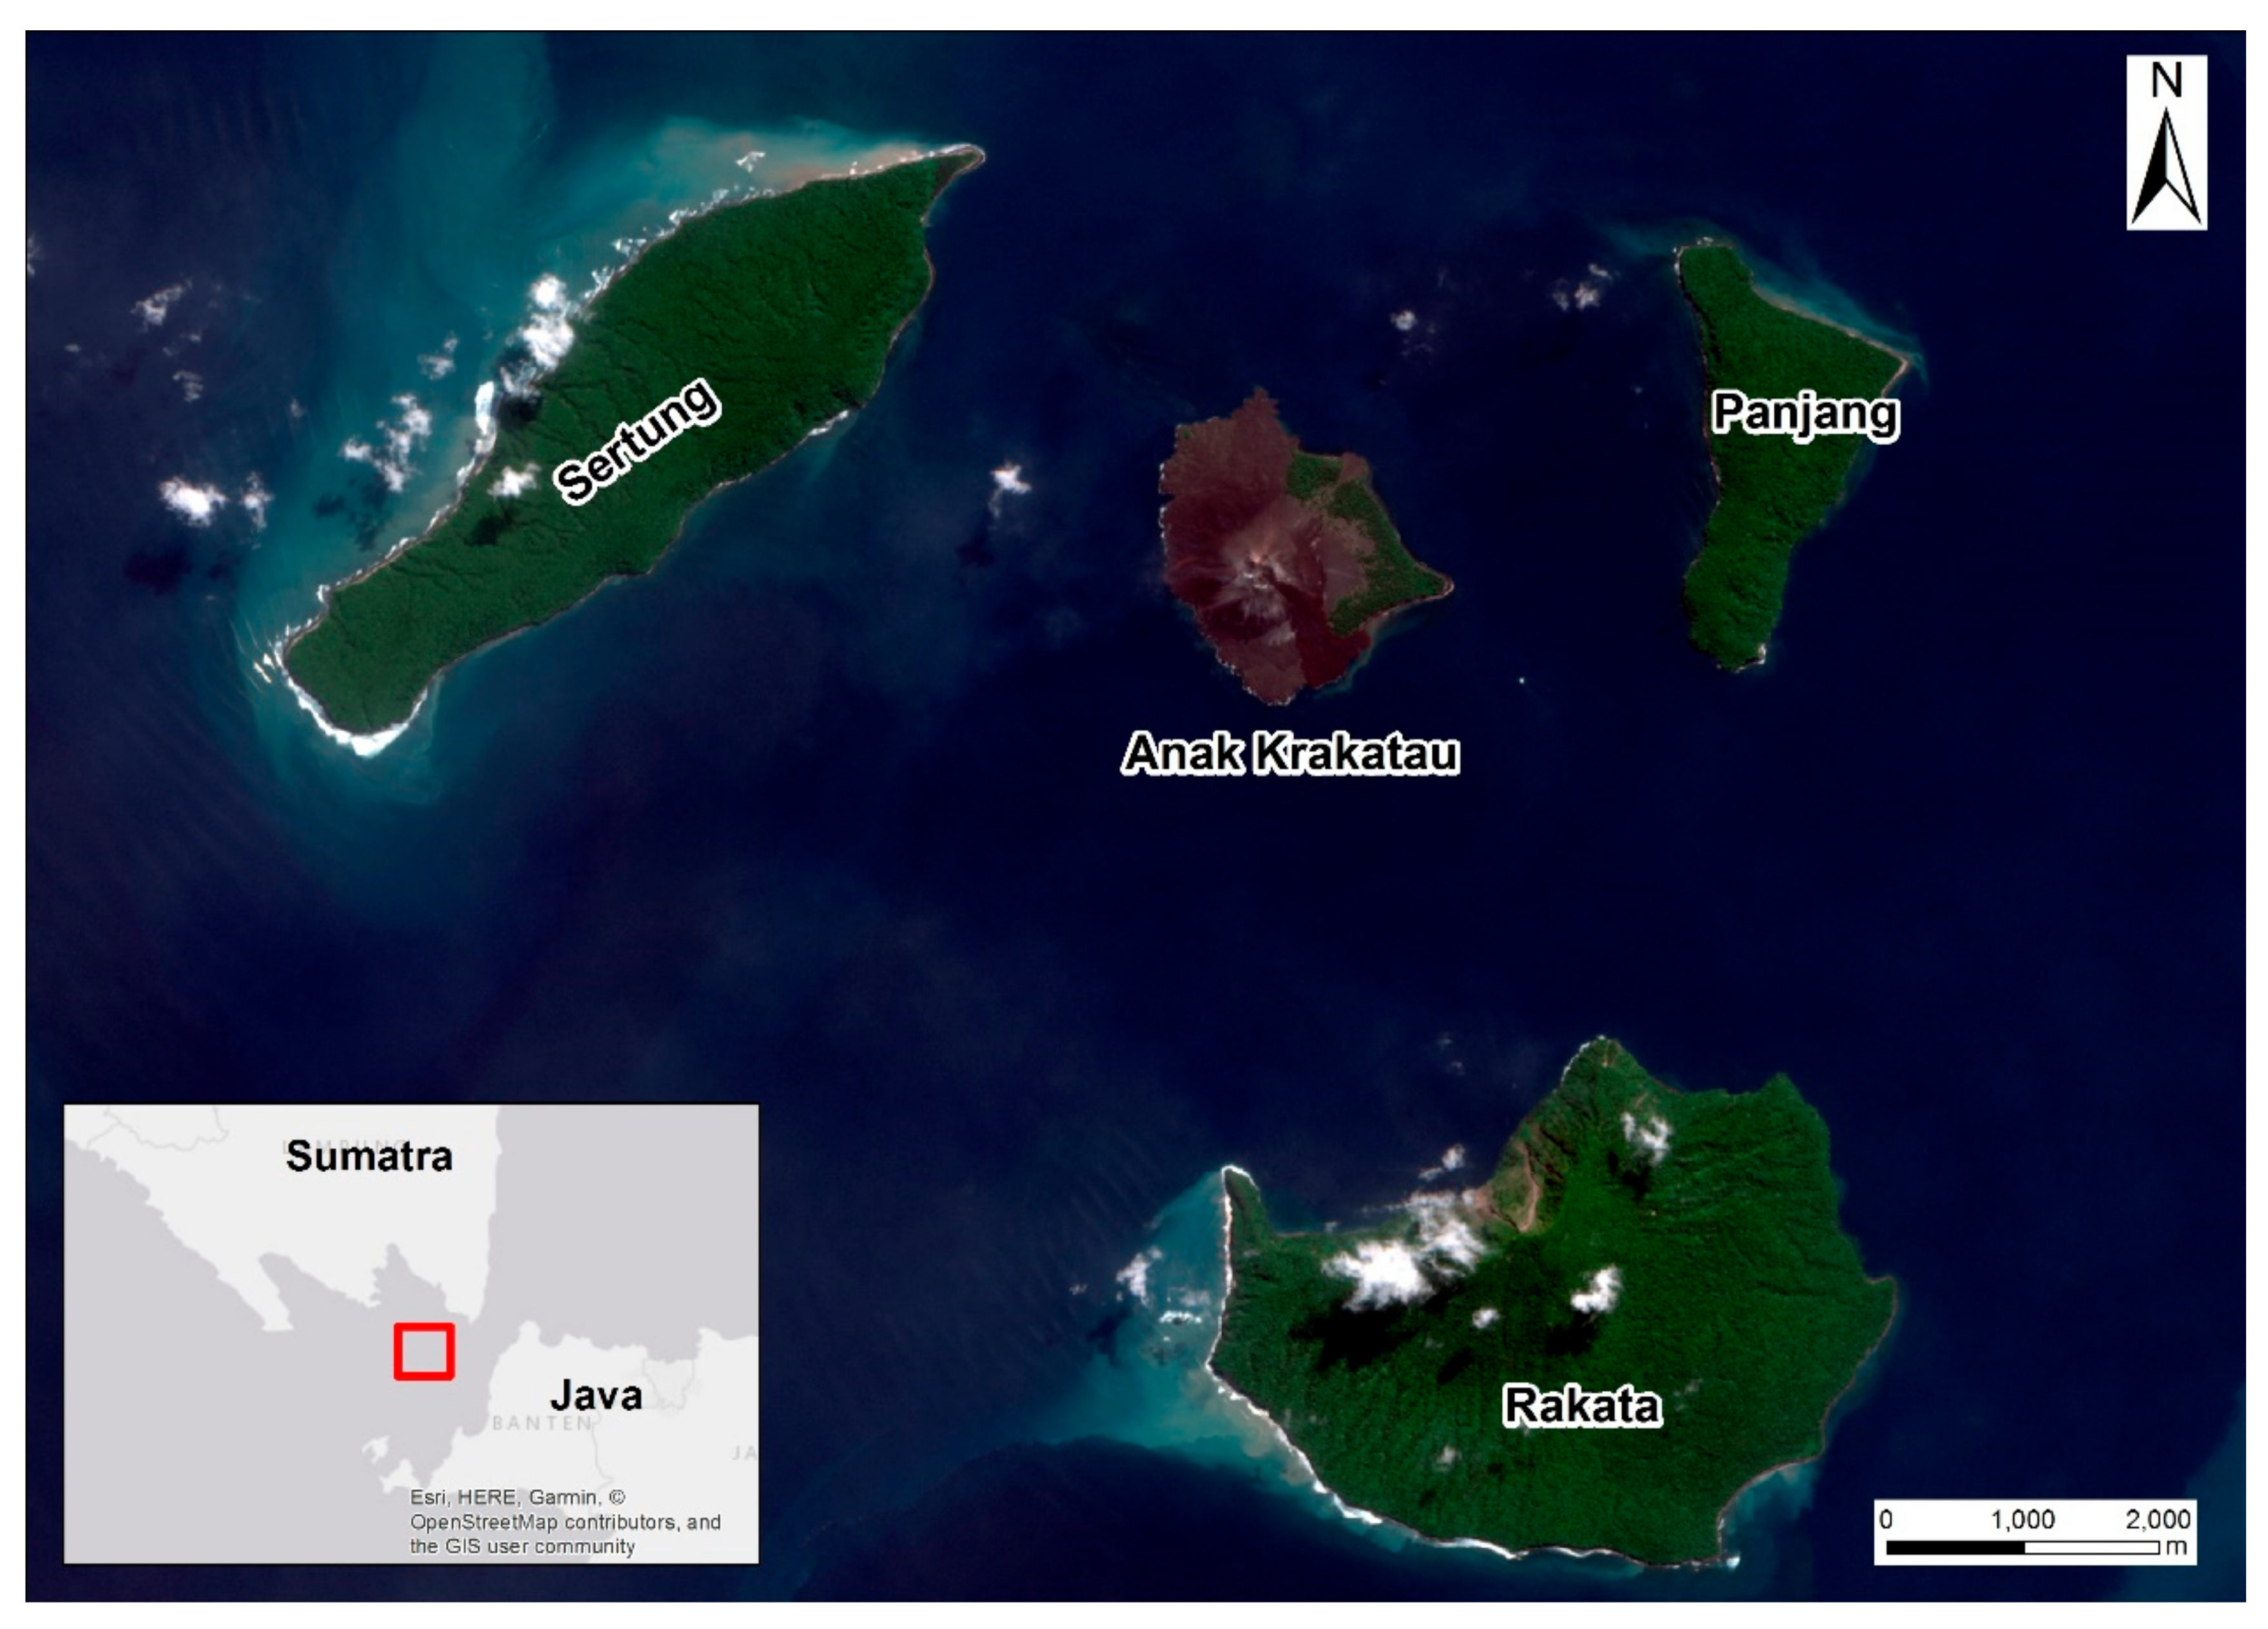
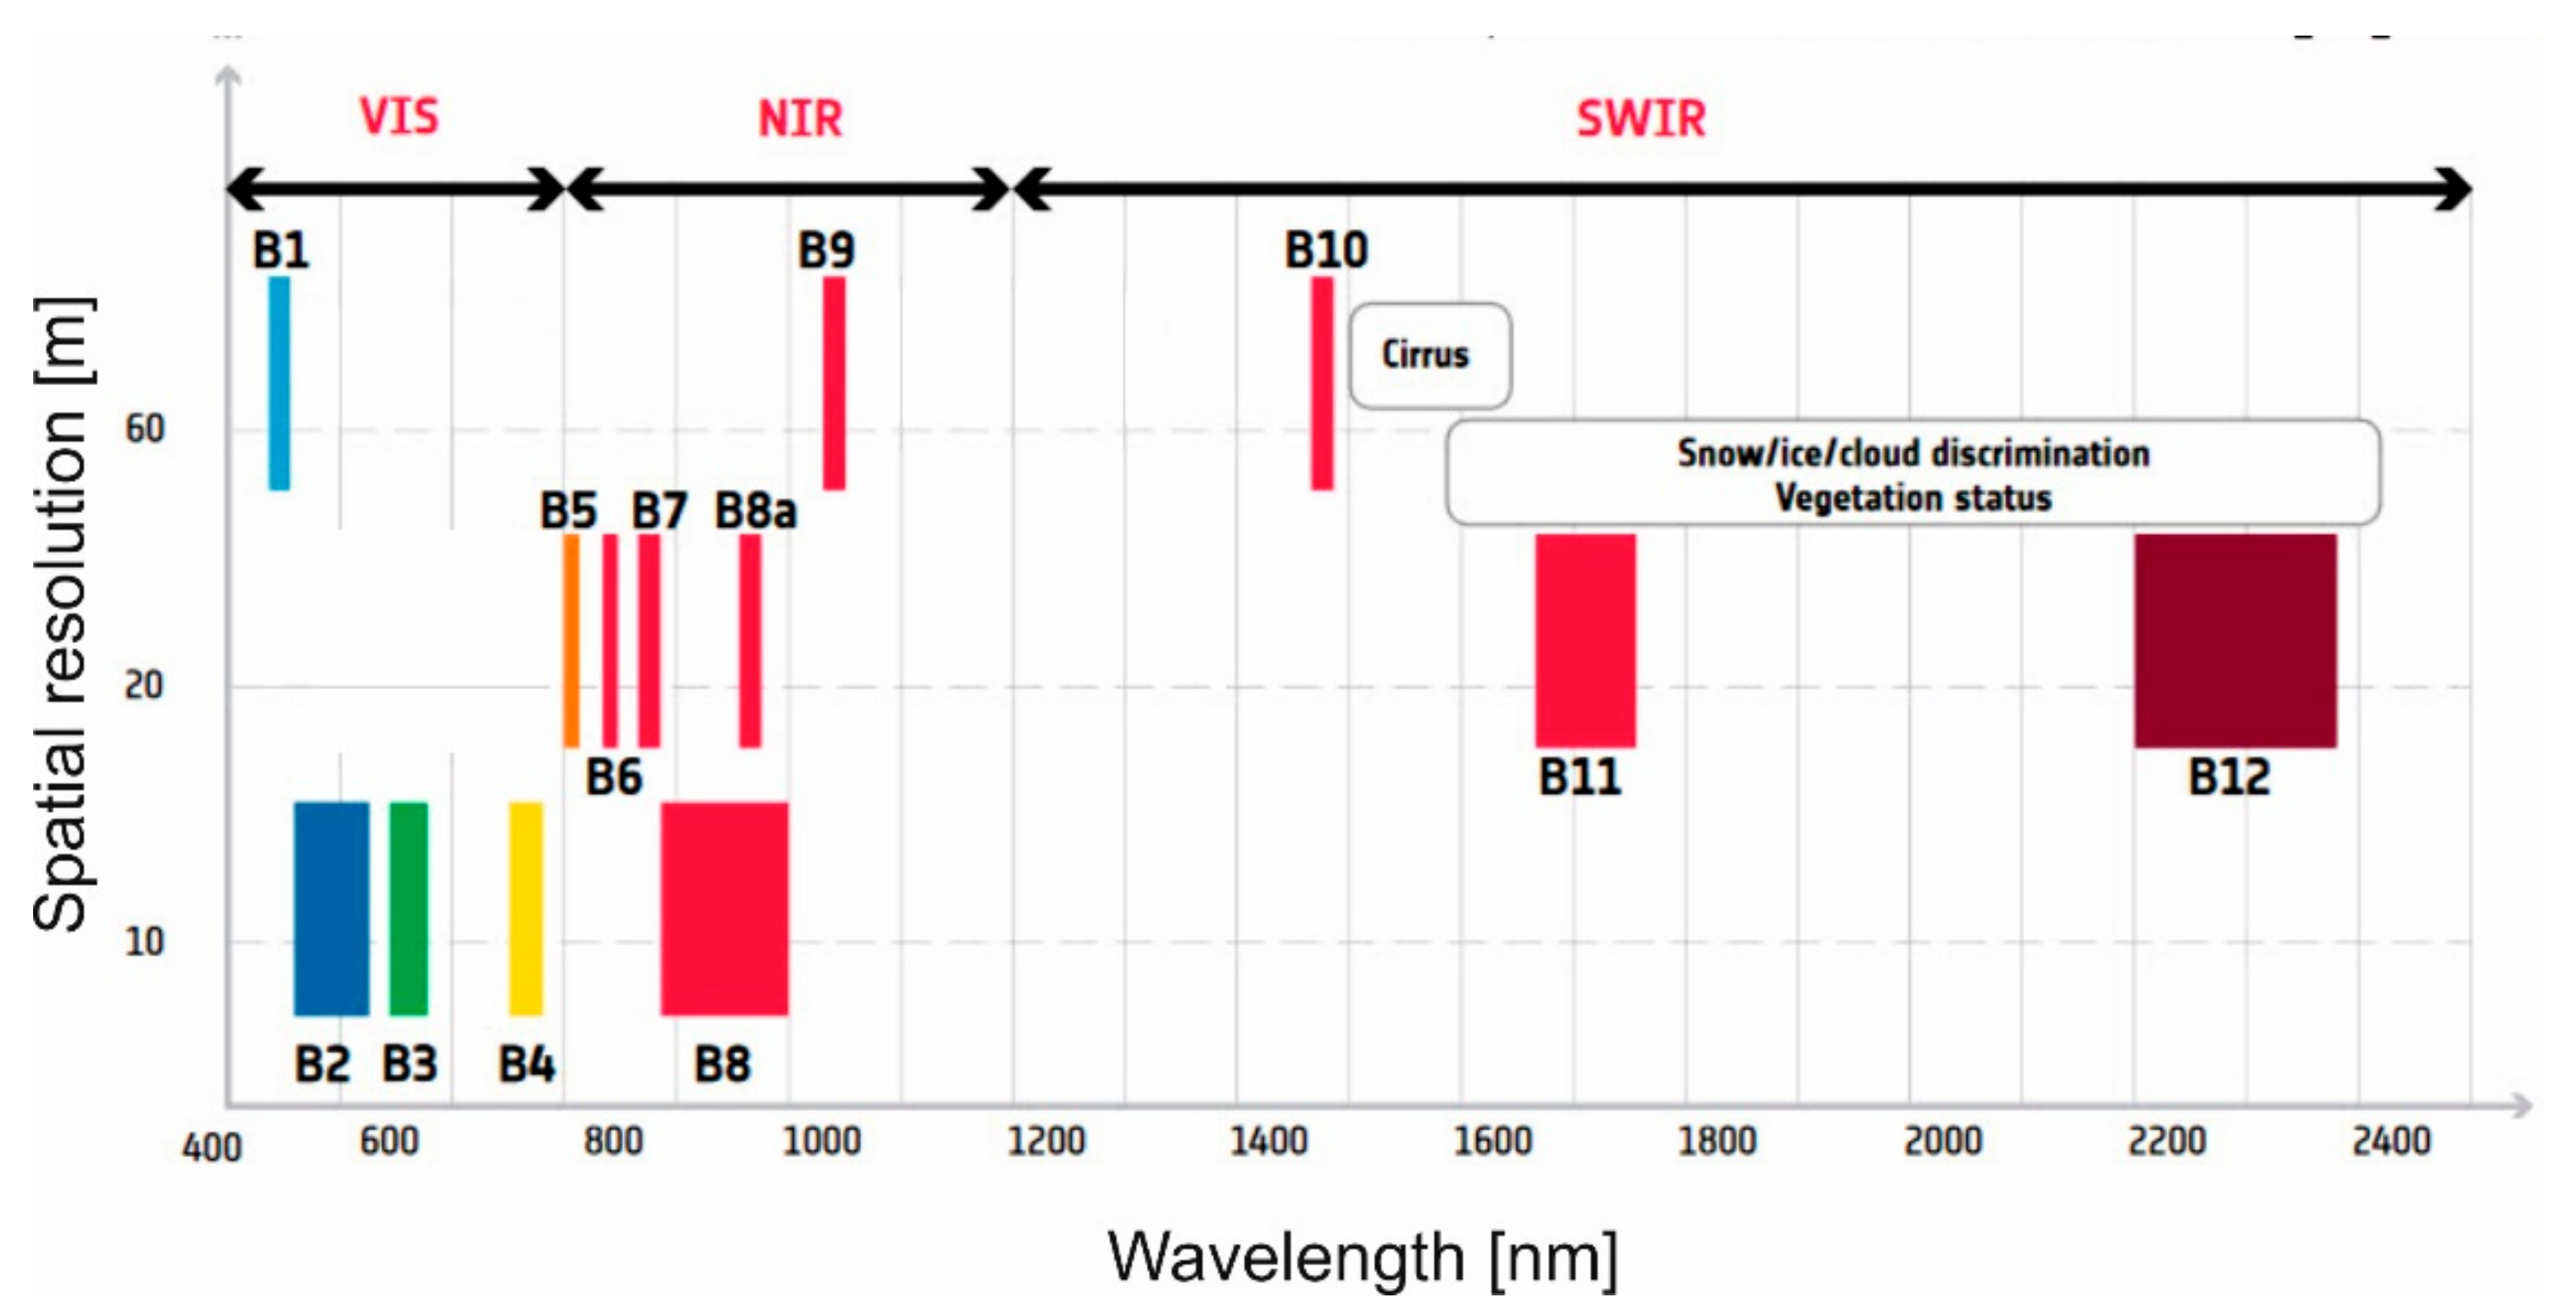
36] and using the freely-available Sentinel-2 multi-spectral satellite data. The methodology is applied for the detailed analysis, both in space and time, of the shoreline evolution of AK and provides constraints on the volcanic activity for the 2018–2019 period. Sentinel-2 is a constellation of twin satellites (Sentinel-2A and Sentinel-2B) developed and operated by the European Space Agency within the Copernicus program—the European Union’s EO program. The constellation collects multi-spectral data with 13 bands in the visible, near-infrared and short wave infrared part of the spectrum (
Figure 2) with a systematic global coverage of land surfaces at latitudes of 56° S to 84° N.
3. Materials and Methods
Despite a combined revisiting time of the Sentinel-2 constellation of between 2 and 5 days, the analysis has been conducted on only 45 of the 177 images available for the period 15 May 2018–1 November 2019 (
Table A1). This is because only these images provide a clear unobscured view of the whole island without the presence of significant cloud cover or plumes. As mentioned above, this has meant that there is a ca. 2 month gap in the data sequence around the time of the lateral collapse and the immediately post-collapse intense explosive activity (16 November 2018 to 23 January 2019).
The shoreline detection algorithm based on the 45 useable Sentinel-2 images, whose workflow is summarized in
Figure 3, comprises three stages—image pre-processing and land-sea segmentation developed in GEE and the edge detection executed in QGIS. This workflow is applied individually to each of the Sentinel-2 images.
The 45 Sentinel-2 images used as input to the workflow comprised Level-1C image products. These are composed of 100 × 100 km
2 tiles that are ortho-images in cartographic geometry according to the UTM/WGS84 projection, with radiometric corrections applied to convert each pixel value from the digital number (DN) to Top of Atmosphere (TOA) reflectance. The TOA images are suited to time series analysis as they provide a standardized comparison between images acquired on different dates or by different sensors. Level-1C products are resampled with a ground sampling distance (i.e., pixel size) of 10, 20 and 60 m, depending on the native resolution of the different spectral bands (see
Figure 2).
To avoid potential interference on the spectral identification of the land-sea interface, the presence of any partial cloud cover is detected and masked in the Level-1C products by using thresholds for band 10 and 11 in the short-wave infrared (SWIR) (
Figure 3). The cloud mask enables cloud-free and cloudy pixels to be identified, with the mask indicating the cloud type (i.e., dense clouds or cirrus clouds). Dense clouds are characterized by a high reflectance in the blue spectral region (Sentinel-2, band 2) and also the SWIR, differently from snow, whereas the low reflectance in band 2 and high reflectance in band 10 is used to identify cirrus clouds. Initially, the cloud mask is generated at a spatial resolution of 60 m, before being resampled at spatial resolutions of 10 m and 20 m to mask each corresponding spectral band. The re-sampling is not a geometric transformation but a radiometric interpolation (
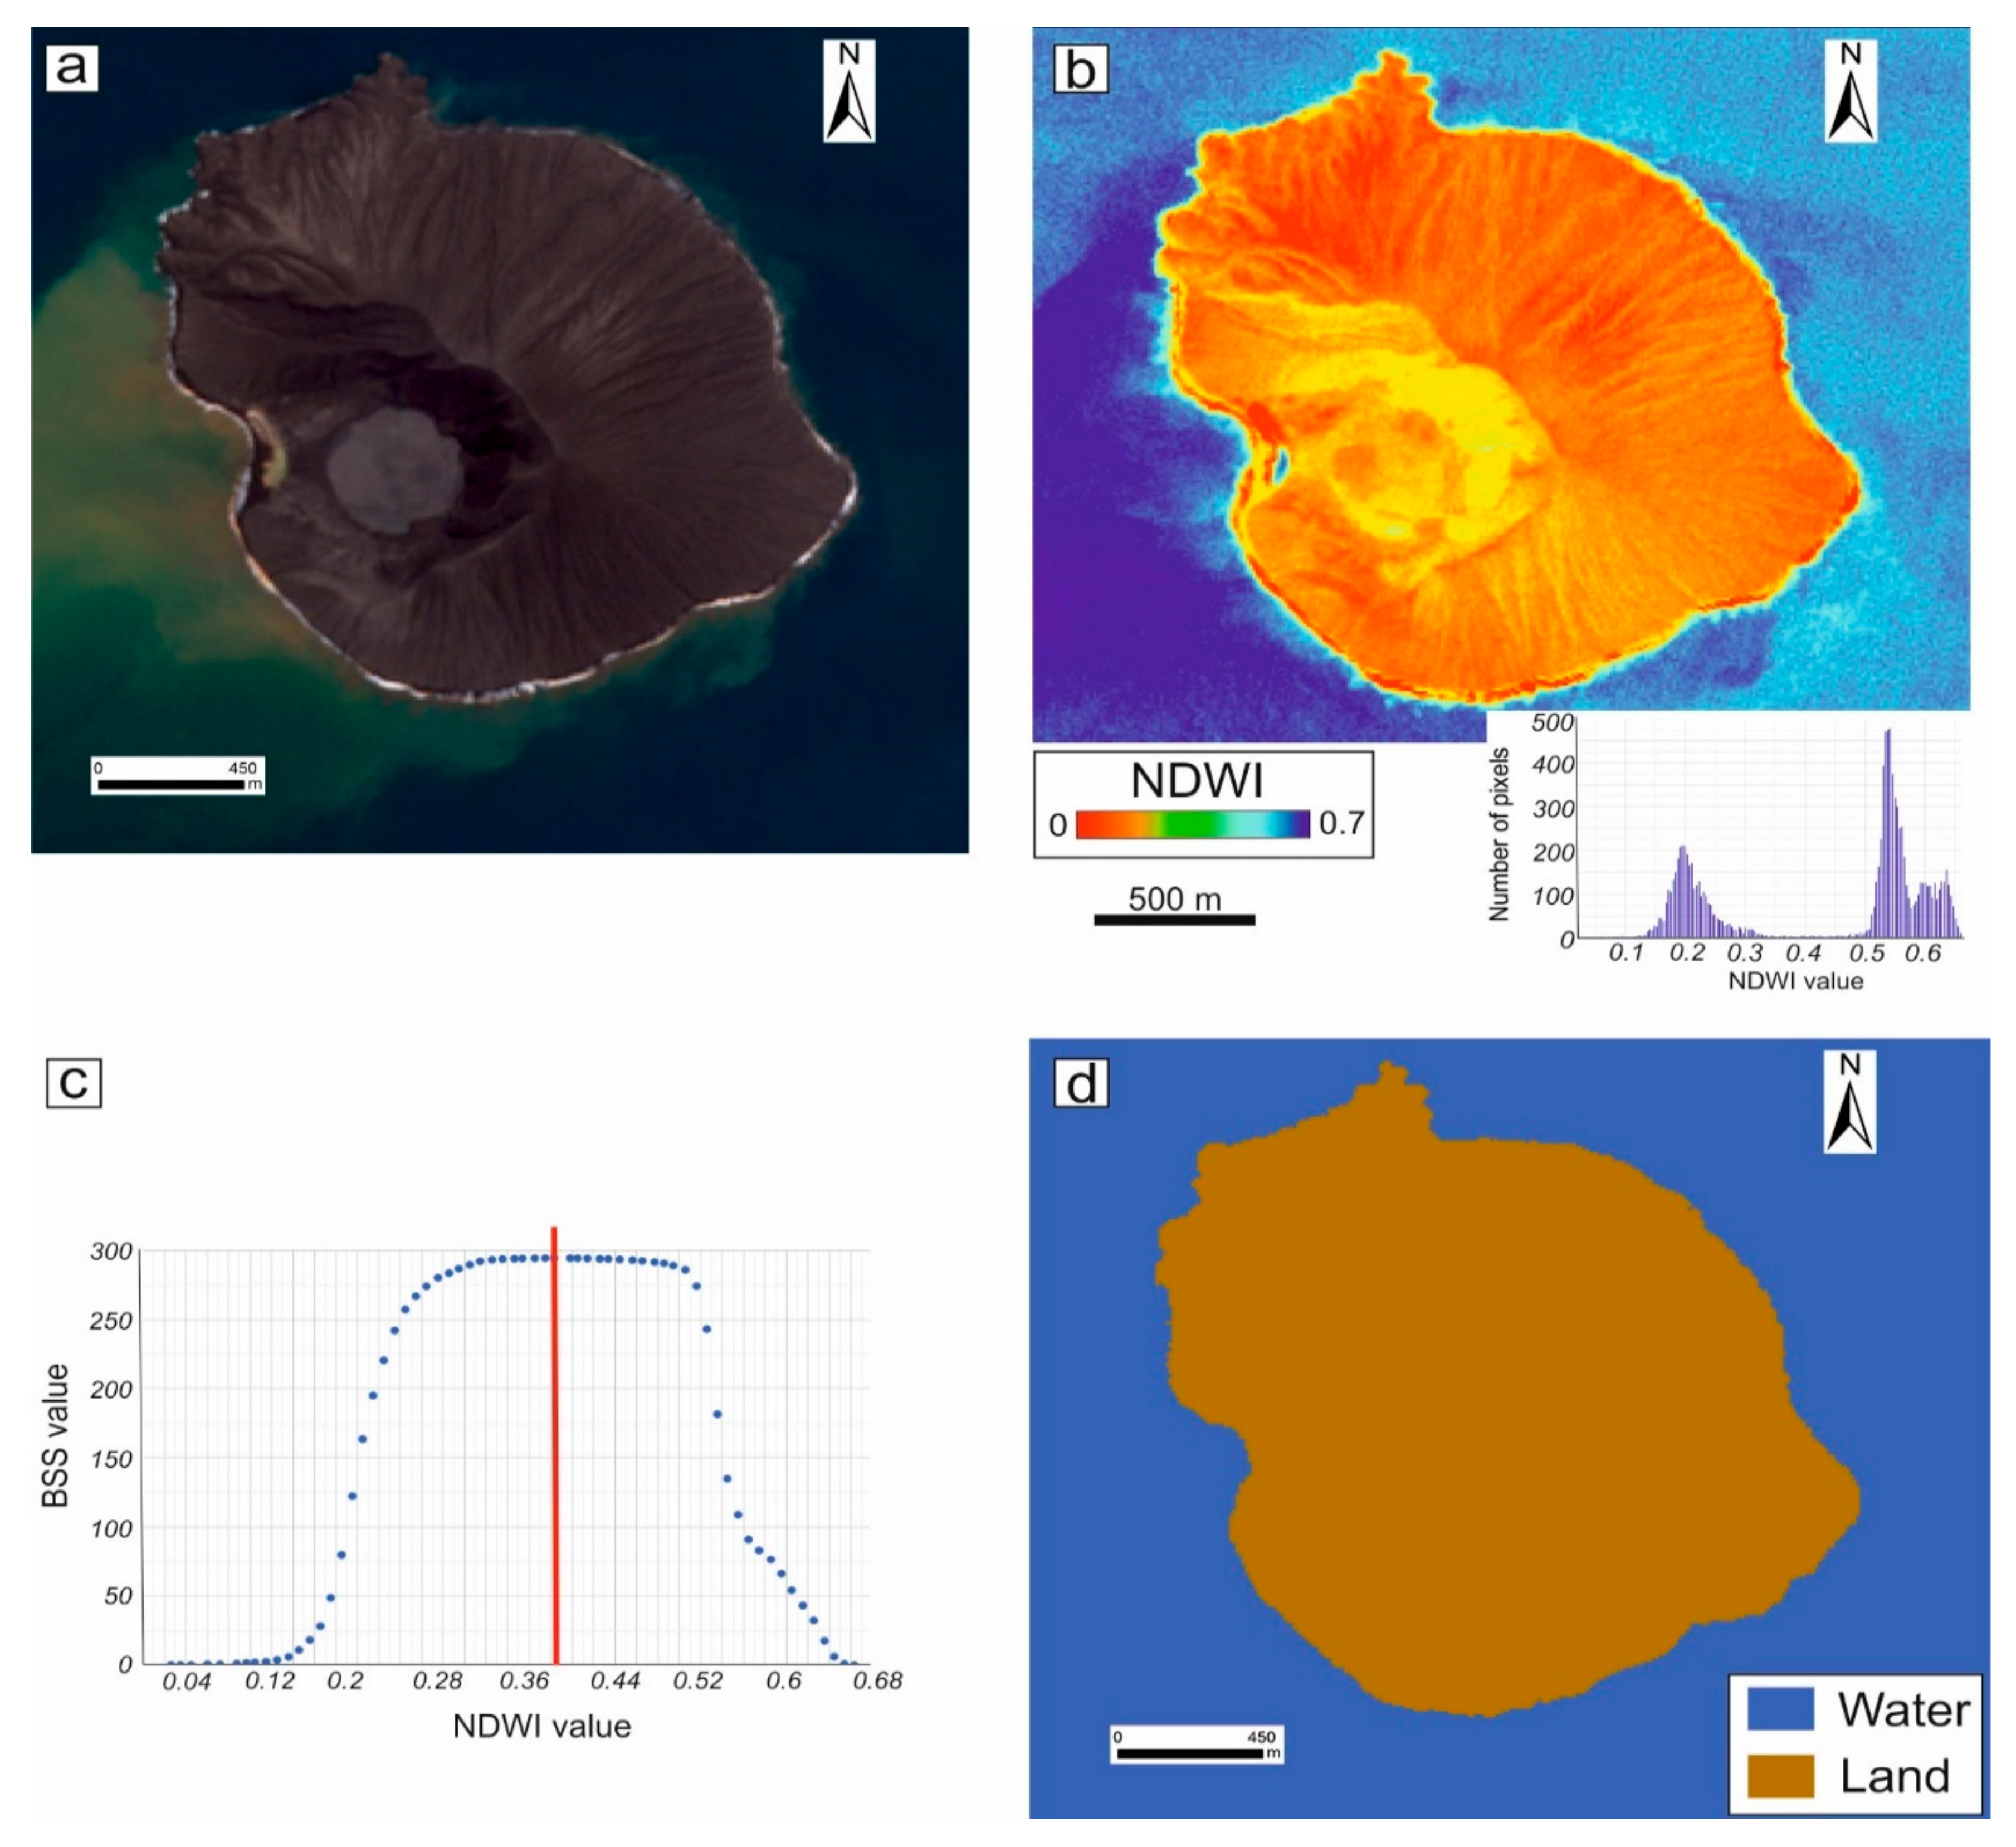
Figure 4a).
The subsequent objective thresholding-based classification of a spectral index involves utilizing the spectral information contained within each pixel to differentiate between classes (e.g., different cover types). Here, the Normalized Difference Water Index (NDWI) is used to as a basis to discriminate between the land and sea based on their spectral characteristics. Following McFeeters (1996) [
37], the NDWI has been calculated in GEE by using the ‘image.normalizedDifference’ function as follow:
where GREEN is the TOA spectral reflectance acquired in the green waveband (central wavelength of 560 nm in Sentinel-2, band 3) and NIR is the TOA spectral reflectance acquired in the near-infrared region (central wavelength of 842 nm for Sentinel-2, band 8).
The resulting NDWI map contains pixel values ranging between −1.0 and +1.0 (
Figure 4b), where, in our imagery, values ≤0.2 correspond to land surfaces (vegetated and not) and turbid waters and values ≥0.2 are associated with the presence of clouds, cloud shadows and clear waters. The subsequent differentiation between land and sea is straightforward because the NDWI values have a bimodal distribution due to the distinct spectral characteristics of the two surfaces types (
Figure 4b).
In
Figure 4b crater and crater walls have higher NDWI than the outer slopes to the north, east and south, which might reflect hydrothermal alteration of the deposits in the crater walls and floor or be a shadowing effect.
Next, a two-class segmentation is computed to discern land from water by finding the optimum threshold that separates the two classes through an automatic data-driven method, called Otsu’s method [
38]. The threshold is found by whatever partition of the data that maximizes the between-class (i.e., inter-class) variance by considering the following formula:
where
BSS is the between-sum-of-squares,
p is the number of classes (2 in our case),
k indicates the mean NDWI pixel value in class
k and
is the mean NDWI pixel value of the entire dataset. Class
k is defined by every NDWI less than some threshold and the between-class variance is defined as
BSS/
p.
Otsu’s method looks at every possible partition of the input data based on different
values for class
k (
Figure 4c) and requires only a single pass over the data. At each bin of the histogram, the approach defines class
k as all the pixels in that bin and lower while class
k + 1 represents everything else. The threshold is set where the
BSS calculated with (2) is highest.
Once found, the threshold is then applied to the NDWI map to generate a binary raster map where areas of sea and land have been discriminated (
Figure 4d). The Otsu’s method works better when a region in the image that has water and land in approximately equal proportion is strategically chosen so we subset the Sentinel-2 image to an area of interest extended ~10 km
2.
The edge detection stage consists of converting the boundary raster into polygons and then extracting the land-sea boundary as the coastline.
Additionally, for the period June 2018–October 2018, we have the possibility to compare the shoreline changes with the deposition of the volcanic material thanks to the thermal emission recorded by 12 Sentinel-2 images (
Table A2) by using the SWIR spectrum (see
Figure 2) who is sensible to the temperature of hot emitting surfaces [
39].
4. Results and Discussion
The methodology detailed in
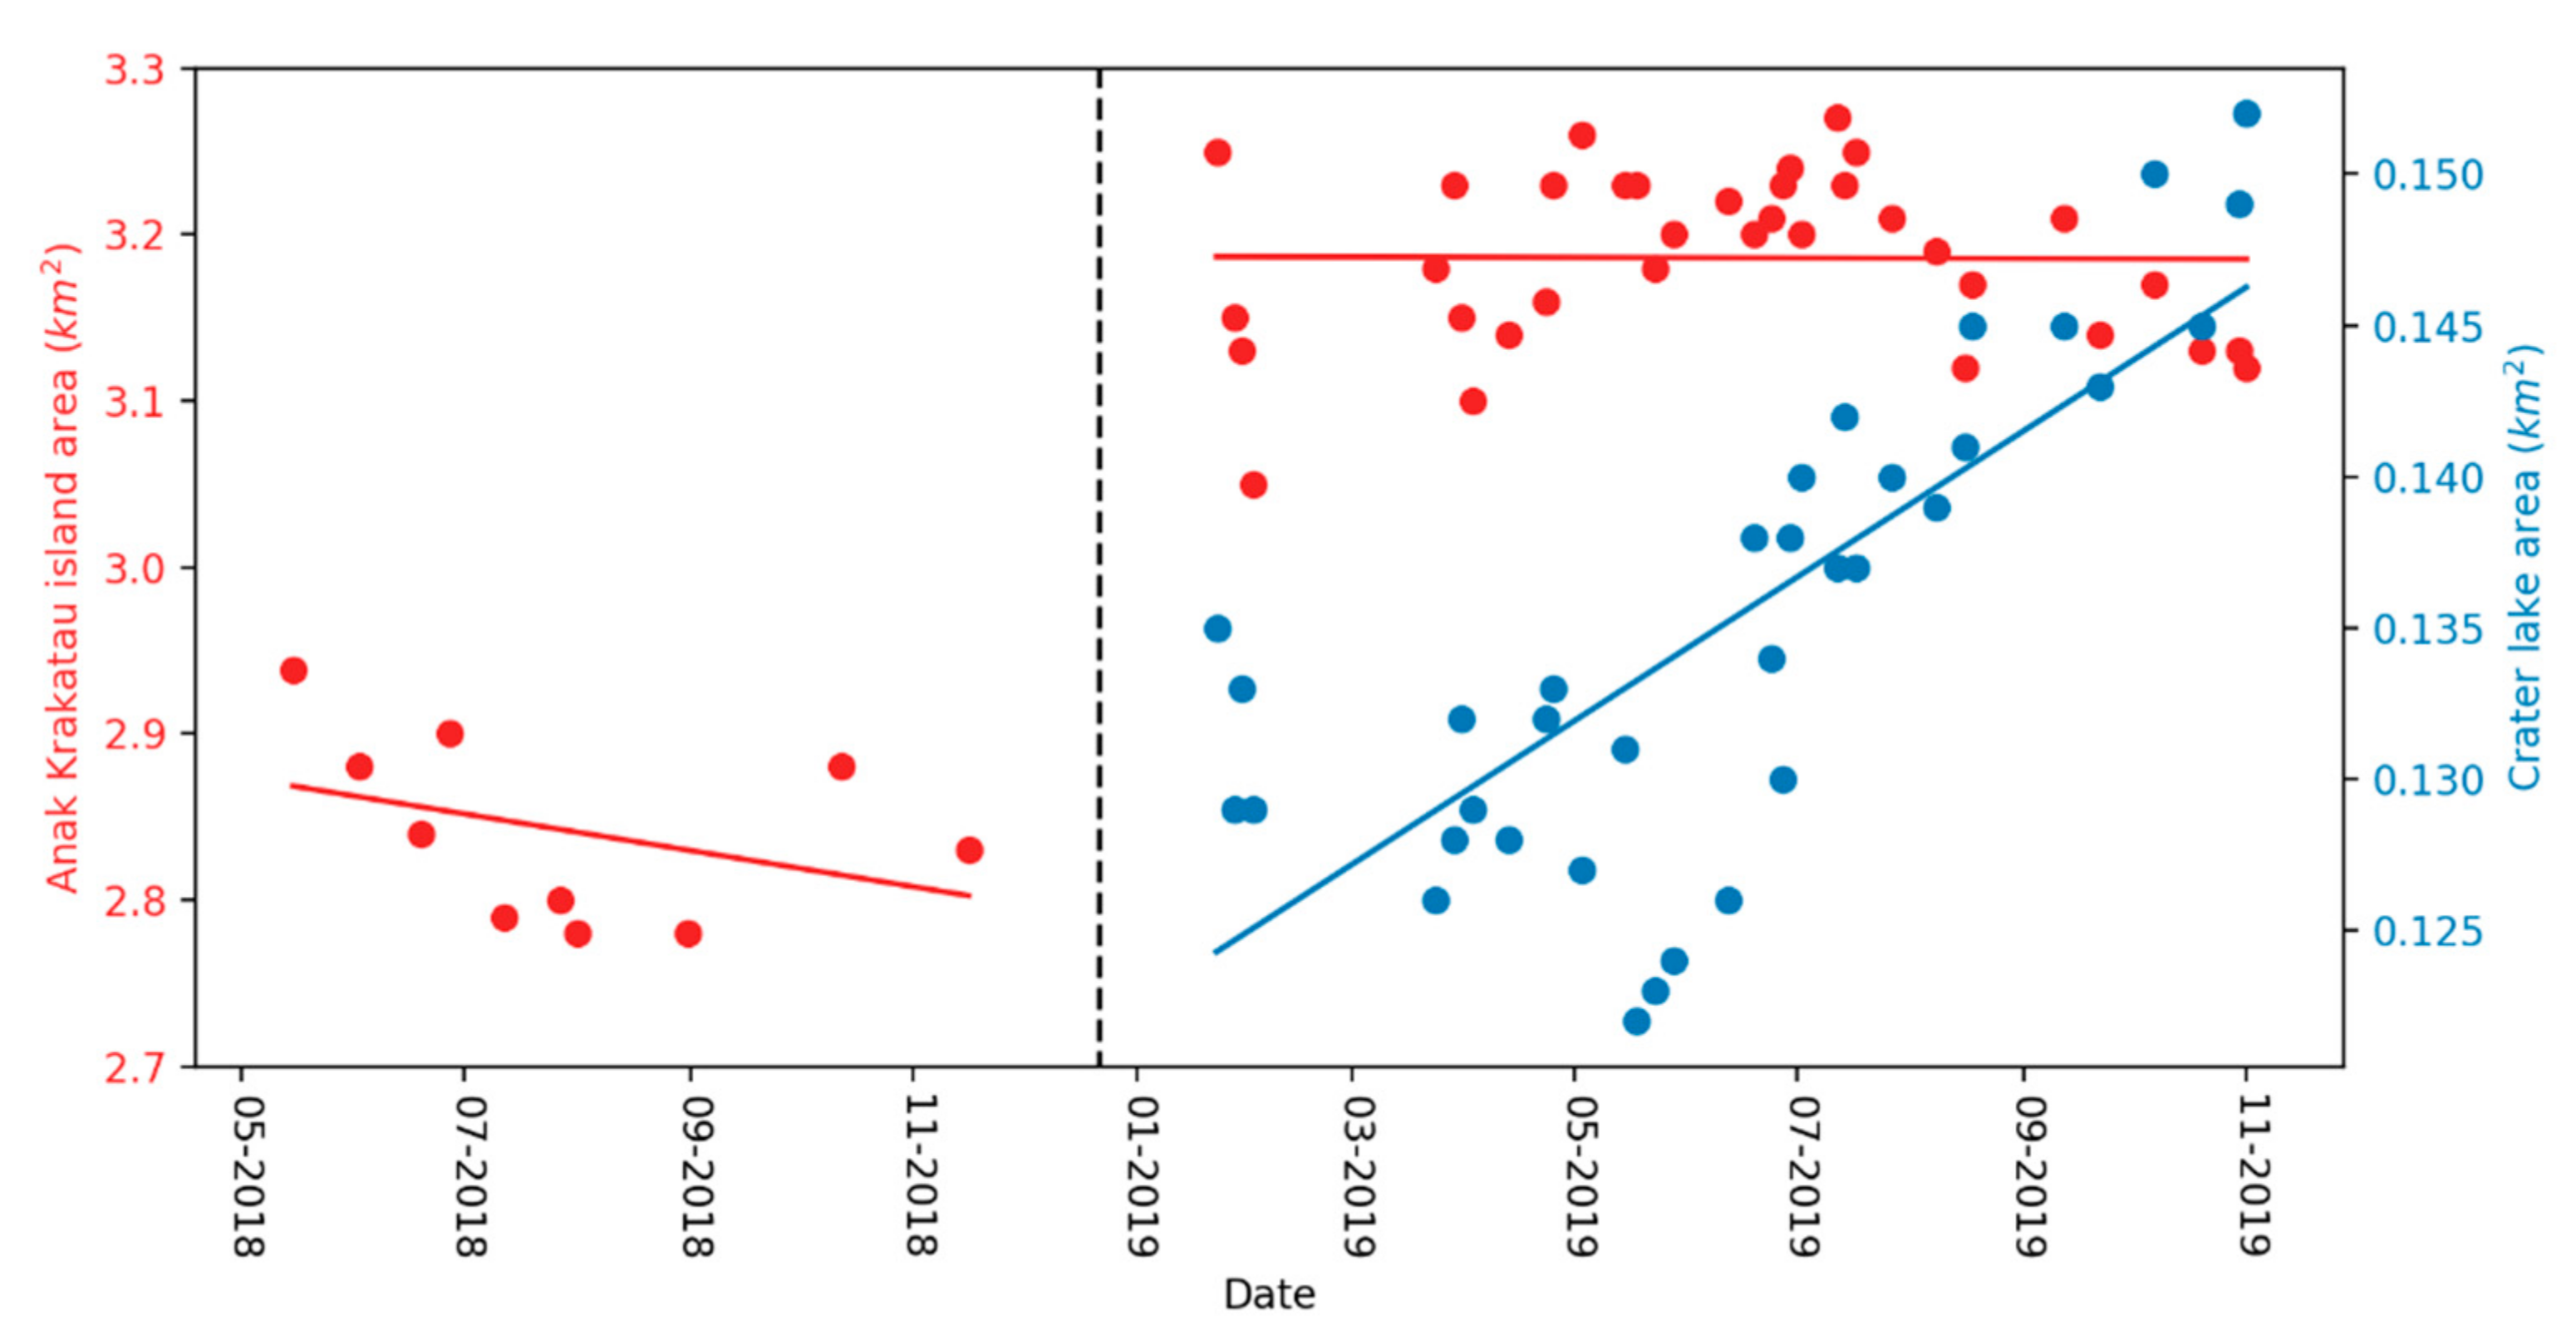
Section 3, provides information on the areal extent of the island since 15 May 2018, as well as the area of the crater lake that formed following the December 2018 collapse (which only became visible after 13 January 2019) as part of the volcanic rebuilding phase (
Figure 5) and is considered land in our results having a similar NDWI range.
Within our area of interest, NDWI thresholds values range from 0.08 when clouds, waves or turbid water (including both sediment-laden water containing tephra from the eruption and/or water clouded by hydrothermal precipitates) perturb the Sentinel-2 acquisitions to 0.38 when calm sea conditions prevail.
With an overall standard deviation of 0.16 km
2, the results reveal that the area of the island has varied between 2.78 km
2 (1 August 2018) and 3.27 km
2 (12 July 2019) with a sharp increase in area following the lateral collapse due to rapid post-collapse regrowth (not captured in
Figure 5 due to the gap in data). The wider scatter in the measurements in February 2019 and April 2019 mainly relates to the continuous changes over the newly regrown western side of the island.
Starting from May 2018, the shoreline changes show no increase in the island area, despite the elevated eruptive activity in Summer 2018 noted by Walter et al. (2019) [
32] but a slight decrease from 2.93 km
2 in May 2018 to 2.83 km
2 in November 2018. Within this period, there is a small increase in area from August to October 2018, due to the shoreline advancement towards the south given by the newly erupted material.
Large and rapid changes in area, characterized by an initial decrease due to the lateral collapse (not observable on
Figure 5) and then an increase due to the post-collapse intense explosive activity, took place in December 2018 and January 2019. Based on the reduction in island volumes of 49% stated by Grilli et al. (2019) [
33], the post-collapse island had an area of ~1.5 km
2, which then increased to over 3 km
2 in the following two months after the collapse. The finer detail of these changes is not observable in our dataset and only seen as a large net increase because of the data gap around the time of the lateral collapse.
The first Sentinel-2 image available after the collapse shows that the size of the island rapidly increased of >15%, from 2.83 km2 on 16 November 2018 to now, where the island is consistently larger at 3.19 km2.
Such an abrupt change in 68 days can only be explained by the extreme intensity of the post-collapse Surtseyan activity [
40], which emplaced pyroclastic deposits much faster than they could be eroded by waves and currents at the coast. In contrast, with the decline of volcanic activity and perhaps also increased wave activity in the southern hemisphere winter (with long swell waves originating from winter storm systems in the southern Indian Ocean and Southern Ocean entering Sunda Strait from the south-west), there has been a slight but consistent decrease in an area of 0.08 km
2 between July 2019 and November 2019.
In contrast to the variation in the coastline of the island, the crater lake area since its formation in January 2019 shows a gradual initial decrease in area (January to May 2019) followed by an almost regularly growth from 0.14 to 0.15 km
2 (
Figure 5) since May 2019.
Our drone data, acquired in August 2019, indicate that the lake level has remained constant and at the same level as the surrounding sea, despite the rapid evaporation from the steaming lake surface due to input of magmatic heat via the subsurface hydrothermal system. This implies an inflow of sea water to balance evaporation via an efficient hydraulic connection through intergranular and fracture permeability in the tephras and rocks forming the island and its below-sea-level substructure. Therefore, the change in the surface area of the lake through time after its formation implies a change in the shape of its bed or alternatively larger-scale subsidence and uplift of the entire island. The latter seems unlikely because it would produce marked changes in the position of the sheltered north-east coastline of the island, as this has a relatively gentle slope and perhaps also of the largely bare lava coast on the north-west side depending on the shoreline gradient in that area. We therefore consider it most likely that the change in the size and shape of the lake reflects (i) initial infilling as loose tephra is eroded from the crater walls (hence the continuous exposure of older deposits that has developed) and deposited on the lake shore; (ii) subsequent depression or subsidence of the lake bed alone. This could in principle be due to a significant amount of excavation by further explosions, which have indeed occurred but have been mild; but most of the tephra from these small explosions would be deposited in and around the lake and therefore be prone to be transported back to the shoreline to continue infilling of the lake basin. Another possibility, that tephra beneath the lake has contracted due to compaction, is potentially problematic because this would tend to reduce its permeability, although since the porosity-permeability relationship is not known this cannot be excluded at present because the permeability may still be high enough to allow inflow of seawater to balance the evaporation from the lake surface. A final explanation is that as the activity has declined through 2019, the conduit at greater depths beneath the lake has contracted and so there has been localized subsidence in the area of the lake only, rather than affecting the entire island, which allows the lake area to increase without also causing coastline retreat.
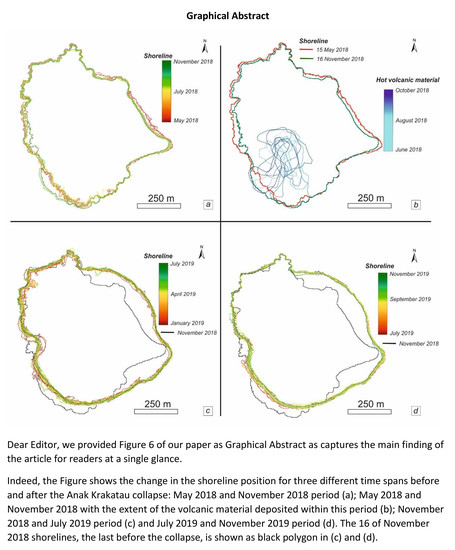
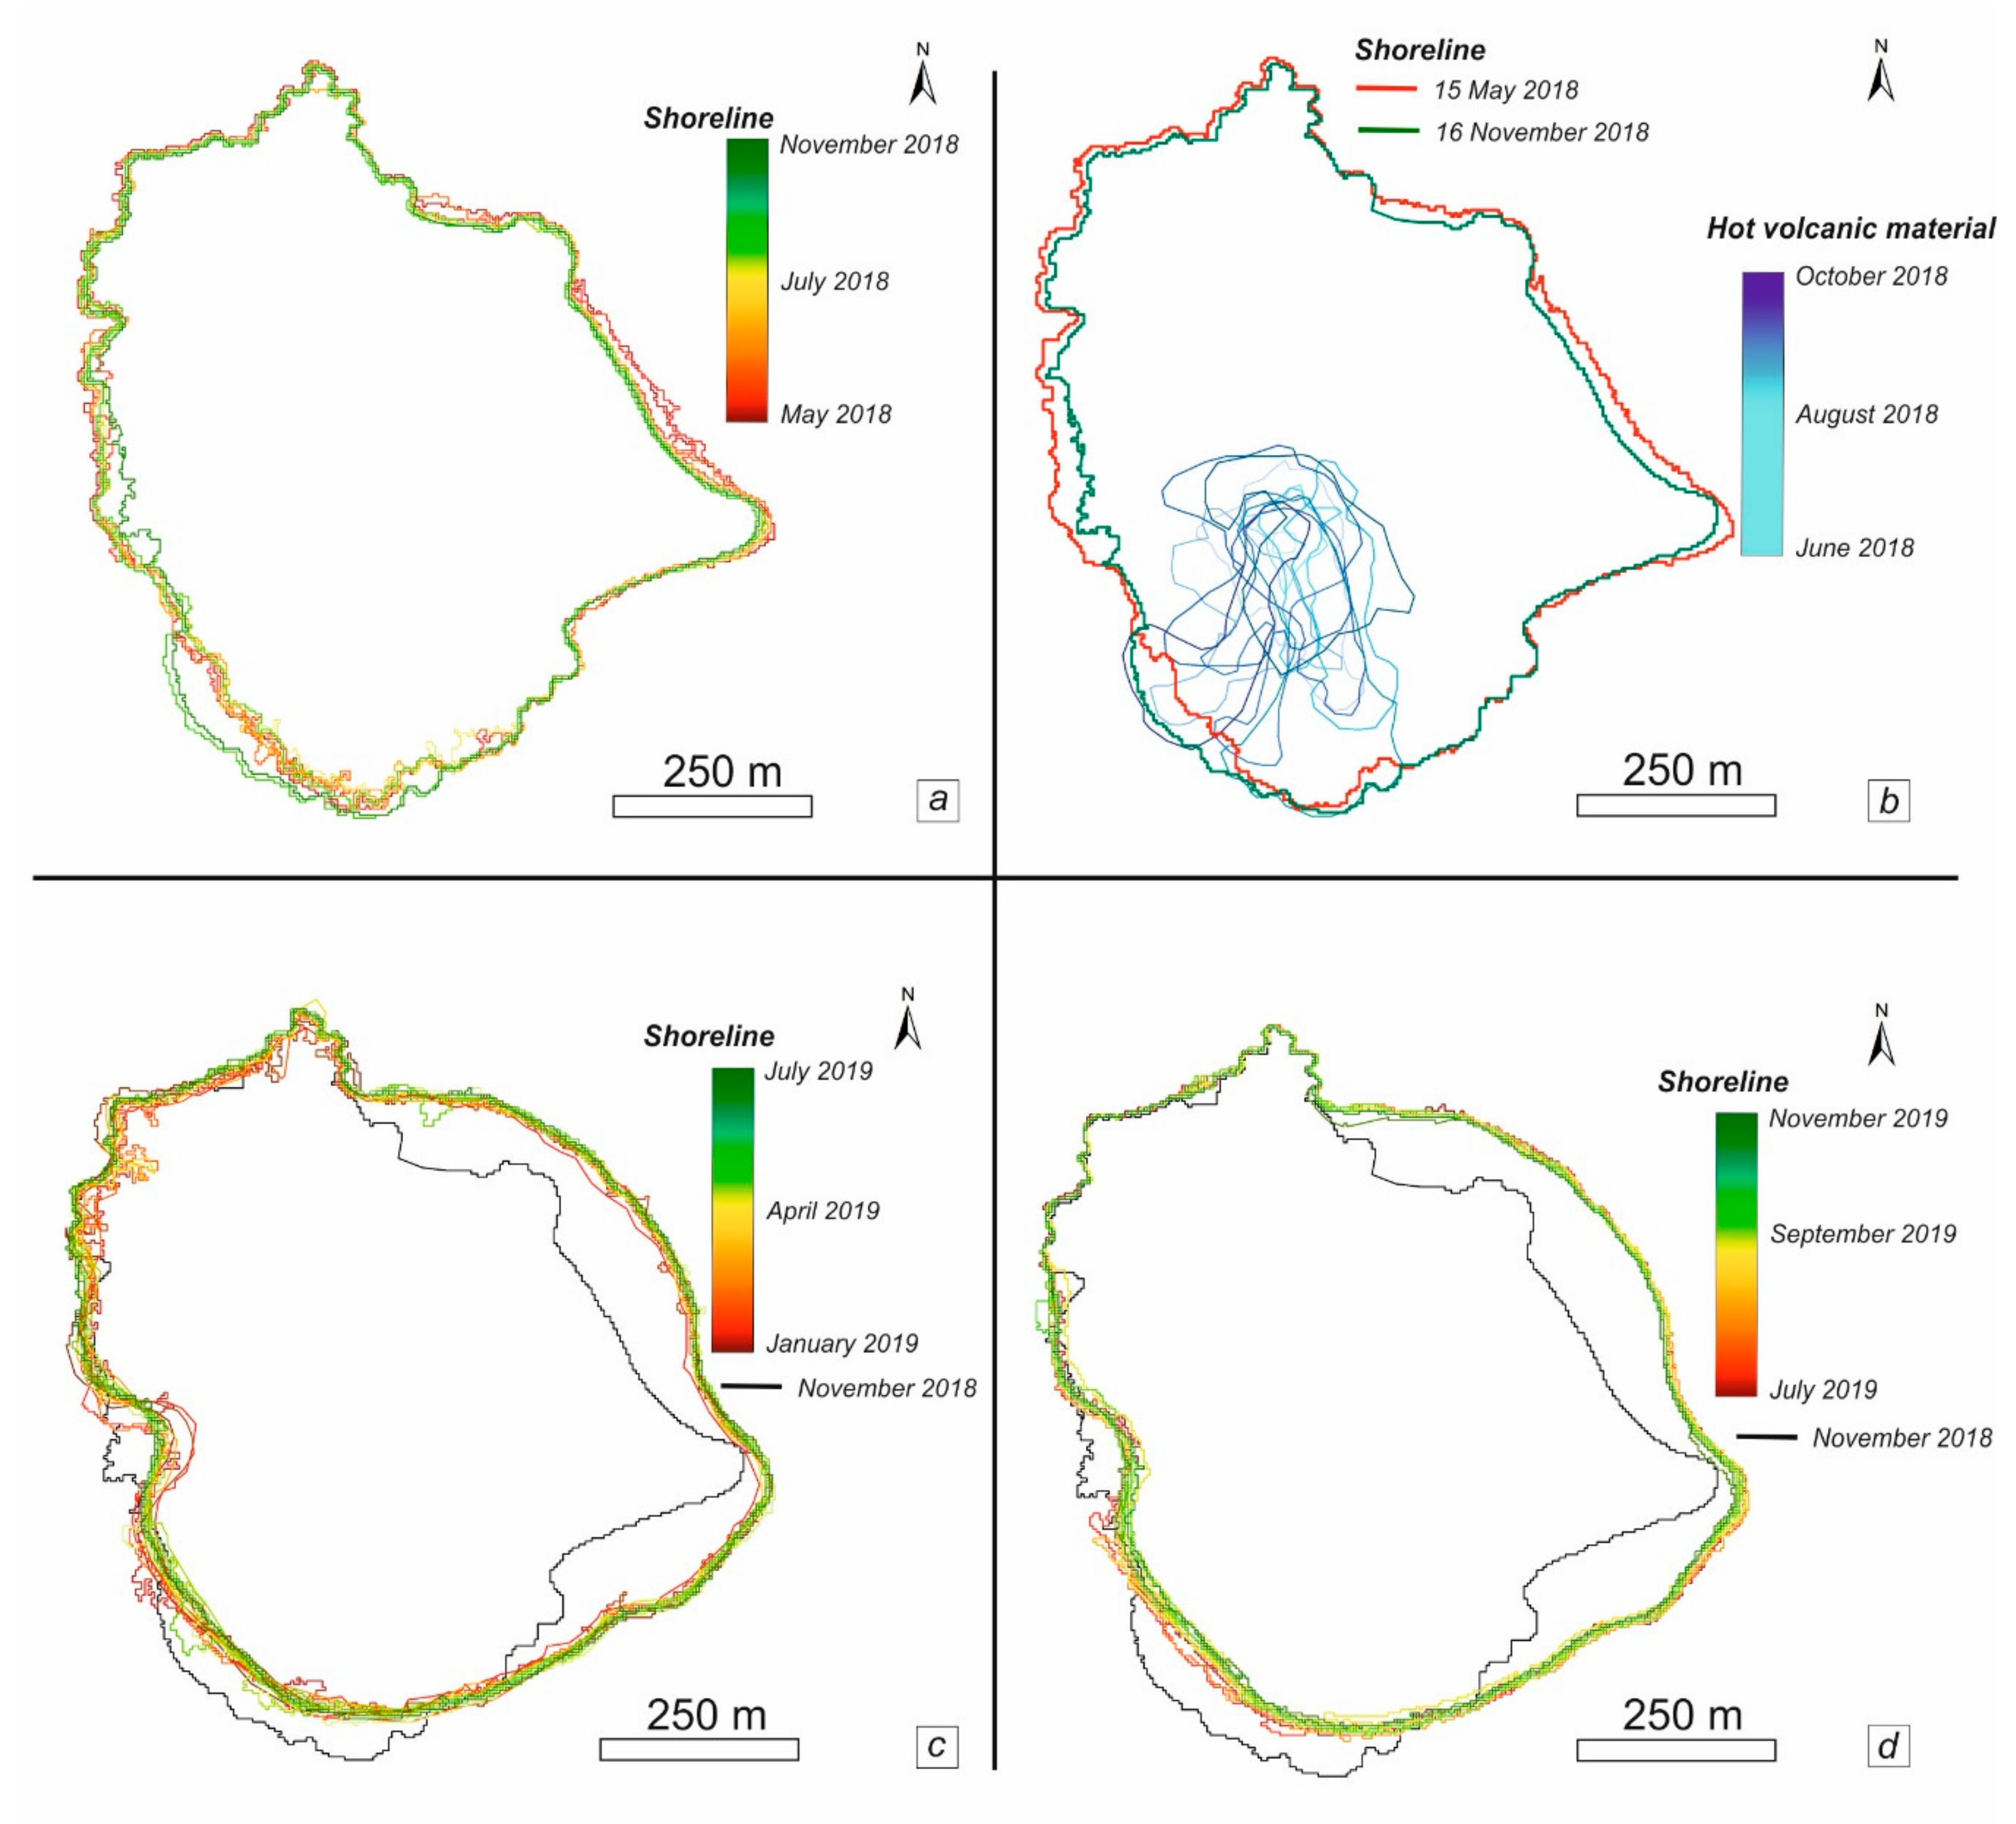
Spatially, during the May 2018–November 2019 period the shoreline change has followed a distinct compartmentalization pattern, with the shoreline prograding/advancing up to 300 m offshore in the northeastern and southeastern sectors and retreating inland up to 230 m on the western flank (
Figure 6).
The westward advancement of the shoreline is particularly evident in the May 2018–November 2018 period (
Figure 6a), mostly due to the deposition of volcanic materials on this sector that, despite being concentrated in the July 2018–September 2018 period (
Figure 6b), does contribute to increase the size of the island only from August 2018.
The eastward advancement pattern seems to have dominated between January 2019 until July 2019 (
Figure 6c) followed by a slight but consistent decrease in area from that time (
Figure 6d). In particular the shoreline retreat on the SW sector begins as early as April 2019.
Overall, shorelines in the northern and southern sectors in the pre-collapse period are irregular, as a result of the lobate form and steep fronts of lava flow margins that have extended the coastlines in this part of the island since the 1960s. This irregular coastline contrasts with the eastern sector, which exhibits a gentler slope angle, since it has been constructed by the relatively uniform deposition of tephra built up from phreatomagmatic activity between 1927 and the 1960s and subsequently mantled by Strombolian pyroclastic deposits. In the post-collapse period, regrowth via phreatomagmatic ash deposition has resulted in a smoother coastline around the S and W, as well as the eastern sectors, with lava deltas surviving from the pre-collapse period in the north.
The original contrast between the mantling of tephra on the east coast and the presence of lava deltas on the west coast (particularly evident in the pre-collapse shoreline) is a consequence of the growth of the AK vent on the steep wall of the basin formed by the caldera collapse in 1883. As Anak was constructed from 1927, erosion of the early cone resulted in a crater-wall structure open to the west. When the activity of AK became fully subaerial, this structure helped direct lava flows more towards the south and west [
27], while tephra were deposited on the eastern flank, which also preserved the shape of the earlier tuff cone [
27].
This erosional pattern also reflects the strong current that is generally running from SW to NE [
41] and long period swell waves entering Sunda Strait from the Indian Ocean to the south west.
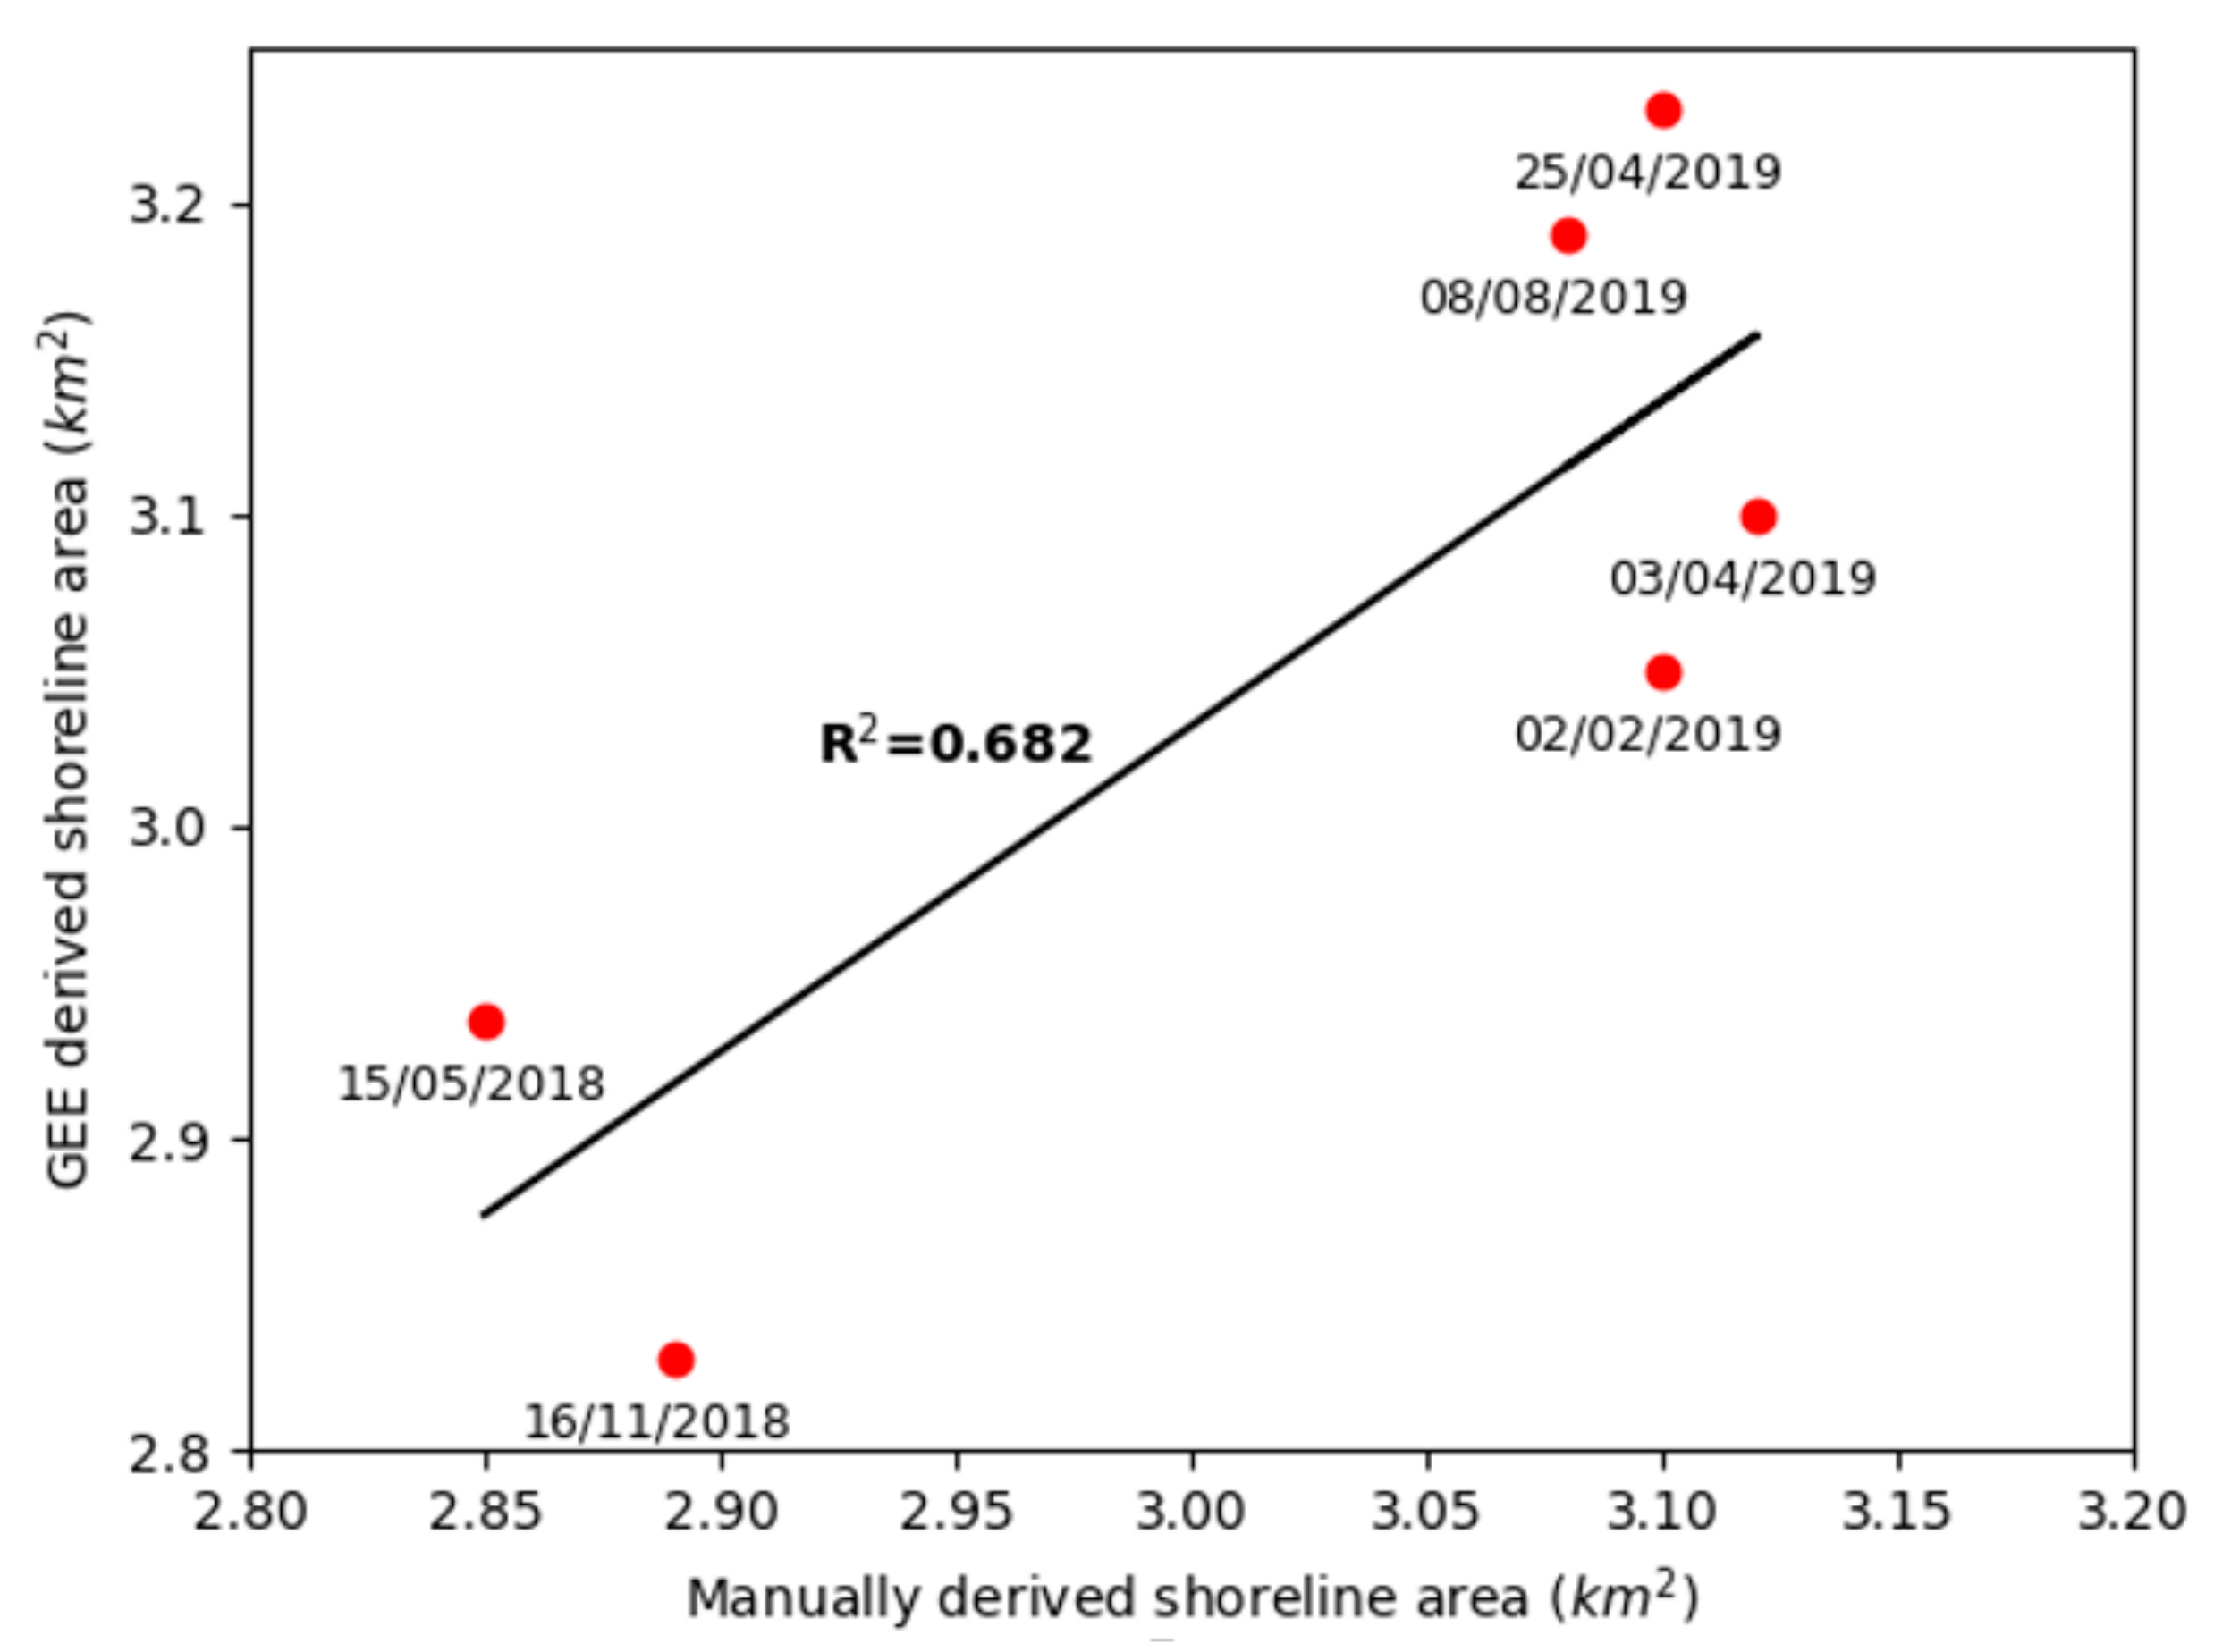
The positional accuracy of the measurements obtained using the automated shoreline mapping algorithm were assessed through comparison with manually digitized shorelines for six of Sentinel-2 RGB images (two acquired before and four acquired after the flank collapse), specifically (
Figure 7)—15 May 2018, 16 November 2018, 2 February 2019, 3 April 2019, 25 April 2019 and 8 August 2019. This assessment comprised analyzing the correlation coefficient between the areal extents derived using the two methods (
Figure 7). The high correlation coefficient (R
2 = 0.68) with a maximum differences in the order of 0.13 km
2 (<5% of the AK island initial area) demonstrates that the shoreline data derived using the proposed algorithm is reliable for the shoreline change analysis.

 ,
, 


