Abstract
The influences of rockfall on human engineering have been increasing in Tibet with the rapid development of the western region of China. This study proposed a multi-approach to carry out rockfall investigation and hazard assessment. As a case study, the rockfall hazard from Nang County to Jiacha County in Tibet was assessed. Firstly, we summarized the characteristics of spatial distributions of typical rockfall sources using Digital Elevation Model (DEM) and unmanned aerial vehicle (UAV) aerial images with resolution of 10 m. According to the thresholds of slope angle, slope aspect and elevation distribution of typical rockfall sources, we obtained all of the rockfall source areas in study area semi-automatically in ArcGIS platform. Secondly, we improved the efficiency and accuracy of detailed field investigation by using a three-dimensional (3D) point cloud model and rock mass structure extraction software. According to the analysis result, the dominant joint set was J1, whose orientation was basically consistent with the Yarlung Tsangpo Fault. The combination of J1, J2 and J4 cut the rock mass into blocks of wedge with J1 as potential sliding planes. It was indicated that the stability of the rock mass in study area was mainly controlled by the characters of joint sets. Finally, we applied the improved reclassification criteria of the Rockfall Hazard Vector (RHV) method in rockfall hazard assessment according to protection capabilities of the current protection facilities, making the result more valuable for geohazards prevention work. Based on this multi-approach, we obtained that 10.92% of the 306 provincial highway and 9.38% of the power line were threatened by potential rockfall hazards in study area. The hazard assessment results of study area were also of certain guiding value to the linear project planning and geohazards prevention work.
1. Introduction
Tibet Region is the main part of the Qinghai-Tibet plateau and located at the first rung of terrain in China. In addition, Tibet area is located at the boundary of Indus-Asia plate with frequent tectonic activities, which lead to the extremely high frequency of geological disasters such as rockfalls and landslides. The volumes of failure rock masses in this area are often very large, such as the Yigong landslide on 9 April 2000, whose volume was 2.8 × 10⁸ to 3.0 × 10⁸ m3 [1] and the Motuo County Gande Township avalanche on 22 December 2008, whose volume was about 6.128 × 10⁸ m3 [2]. Comparing with other geohazards, rockfall occurs more frequently and widely. With the development of the National Western Development Plan, the Belt and Road, Global Economic Interconnection Strategy, the number of highway and railway projects in Tibet has been gradually increasing. The impacts of the rockfall disasters on these projects have received considerable attention. For example, Liu [3], Zhang et al. [4,5], and Li et al. [6] made deep analysis and risk assessment on the occurrence mechanisms and movement characteristics of the rockfall disasters along the Sichuan-Tibet railway and highway, respectively. In recent years, with the launching of ultra-high voltage transmission projects such as Central Tibet Grid Interconnection Project and Strategic Electricity Transmission Passage of Sichuan-Tibet Plateau, the threats of rockfall and landslide have become the key points and difficulties in design, construction and operation periods of power grid engineering.
Rockfall is one of the main geohazards that deeply constrain the development of mountain area. In order to manage the prevention work and reduce the loss of rockfall disaster, many researchers have applied different methods to carry out rockfall investigation and hazard/risk analysis. Mineo et al. applied event tree analysis to assess the rockfall risk along a transportation corridor [7]. F. A. Mutar et al. made use of laser scanning data to identify rockfall sources, and three-dimensional (3D) modeling in Geographic Information System (GIS) to carry out the hazard zonation [8]. Michoud et al. added normalized cumulative distribution function of cliff unit to the Slope Angle Distribution procedure to quantify rock-mass-failure susceptibilities [9].
Rockfall hazard assessment is mainly about evaluating the occurrence probability of an event of certain magnitude and kinematic characteristics (velocity, energy, etc.) over the period from blocks leaving the parent rock to reaching the impacted body [10,11]. In order to satisfy more detailed engineering design requirements, researchers gradually change the method of rockfall hazard assessment from qualitative analysis to quantitative analysis. This is largely due to the increasingly mature three-dimensional (3D) numerical simulation technology of rockfall. Researchers can obtain the trajectory, velocity, energy, and other information of falling blocks and conduct the quantitative analysis of rockfall hazard in the 3D space by 3D numerical simulation technology. There are already a lot of software available for 3D numerical simulations of rockfall, such as STONE/HY-STONE [12], RAMMS: Rockfall [13], Rockyfor3D [14] et al.
Nowadays, the methods for quantitative analysis of rockfall hazard with trajectory data are mainly divided into the following two kinds. The first kind of methods combined the frequency of rockfall. For example, the Cadanave method proposed by Jaboyedoff et al. [15] considered the probability of the rock block breaking away from the parent rock, the number of falling blocks and the probability of the blocks reaching the target. Improved Cadanave method developed by Abbruzzese et al. [10] improved the shortcomings of data classification and approximate processing in original method. The Matterock method combined the occurrence probability, arrival probability, energy and other parameters to analyze the hazard of rockfall [16]. The second kind of methods did not take frequency of rockfall into account, such as the A.D.R.G.T. method [17] that only evaluated the arrival probability of rockfall, the Rockfall Hazard Vector (RHV) method [18] combining arrival probability, energy, and jump height of falling blocks, and the Rock Analyst code [19]. The last two methods mentioned above were based on the calculation results of 3D numerical simulation to carry out quantitative rockfall hazard assessment [20].
Based on the regional geological background conditions from Nang County to Jiacha County along the Yarlung Tsangpo River, and combining with remote sensing interpretation, field investigation and Rockyfor3D numerical simulation, this paper proposed a multi-approach to carry out rockfall investigation and hazard assessment. With this method, we preliminarily revealed the occurrence mechanism and distribution characteristics of the rockfall in the area from Nang County to Jiacha County, and assessed the rockfall hazard quantitatively. Location of study area is shown in Figure 1a,b.
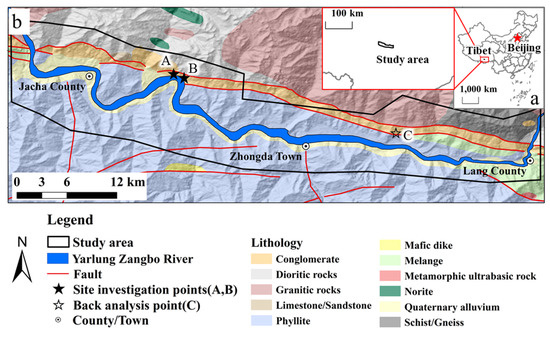
Figure 1.
Location and regional geological map of study area (a). Location of study area (b). Regional geological map of study area (modified from [21,22])).
2. Basic Geological Conditions of the Study Area
The study area locates in Yarlung Tsangpo River basin, and contains the range from Nang County to Jiacha County (Figure 1b) in Linzhi City, Tibet autonomous region. It is 56 km long in the east-west direction and about 7 km wide on each sides of the Yarlung Tsangpo River, with an area about 540 km2. According to the “Plan for the prevention and control of geological disasters in Linzhi City, Tibet” [23], Linzhi City was divided into nine key geological hazard prevention areas combined with the risk of geological hazards, population density and the scale of major human engineering construction activities. The study area is located in the third key prevention area of Linzhi city, where landslides and rockfalls are the major geological hazards. There are more than 20 habitations including towns, villages and counties in study area, such as Nang County, Zhongda Town, and Nang Town. There are also many major projects, such as provincial highway 306 and Central Tibet Grid Interconnection Project distributed along Yarlung Tsangpo River. These urban settlements, highways, power lines, and other major projects are the main victims of geological disasters along the Yarlung Tsangpo River.
The altitude of the study area is between 3000 m to 5200 m (as shown in Figure 2), and the maximum relief is up to 2200 m, which is the alpine topography in plateau areas. This area crosses the Yarlung Tsangpo Structure Zone (YTSZ) and Gangdise-Nianqintanggula tectonic plate in a north-south direction, located at the north margin of the eastern section of the YTSZ, and adjoins with the southern edge of the Gangdise magmatic arc. Since the Miocene, the Indian plate has been subducting northward, and the Qinghai-Tibet plateau has been uplifted continuously, which lead to extremely strong tectonic activities in the study area. Many researchers have investigated the influences of tectonic activity on geohazards through geomorphological analysis, geophysical surveys, and finite-difference analysis etc., and proved that tectonic activity was one of the main factors impacting the slope stability [24,25,26]. The faults in the area are mainly distributed along the east-west direction, and the rest are distributed along the north-south direction. The famous Great Count Thrust (GCT) is distributed in parallel with the YTSZ from east to west [27]. Along the YTSZ, earthquakes over magnitude MS7.0 have occurred for many times, such as the MS7.7 earthquake in 1947 in the southeast of Nang County [28], and the MS7.0 earthquake in 1947 in Longzi County [29].
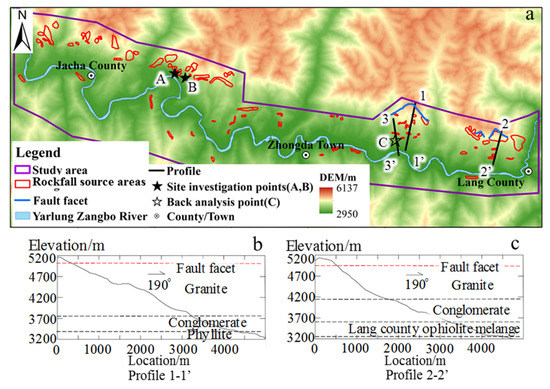
Figure 2.
Elevation distributions of different lithology and distribution of rockfall source areas in study area (a). Distribution of rockfall source areas and positions of typical profiles (b,c). Elevation distributions of different lithology are in profile 1-1′ and 2-2′.
Lithologies in the study area are mainly dioritic rocks, granitic rocks, conglomerate, Lang County ophiolite melange rocks, phyllite rocks from north to south. The metamorphism grade of rock mass in the study area is gradually deepened from west to east, and the deformation is also gradually strengthened.
3. Methodology
The assessment of rockfall hazard is an extremely complicated work. The procedure of our study is shown as follows: firstly, identify the source areas of rockfalls; secondly, analyze the passage number, passing height, and kinetic energy of falling blocks along the trajectory by numerical simulation; finally, analyze the rockfall hazard in the study area by using the RHV method with an improved reclassification criterion of evaluation parameters.
In this study, we identified the typical source areas of rockfalls firstly based on aerial photos, remote sensing interpretations, and field investigations. Using a Digital Elevation Model (DEM) with a resolution of 10 m, we summarized the distribution characteristics of typical rockfall source areas in lithology, elevation, slope aspect, slope angle, and other factors in the study area. Then, we used these characters to identify other unstable blocks semi-automatically by inputting the distributing thresholds of rockfall source areas into ArcGIS platform [30,31]. This method was used to identify the rockfall sources in the area from Nang County to Jiacha County in detail.
RHV is a rockfall hazard evaluation method proposed by Crosta and Agliardi based on a three-dimensional numerical simulation. This method mainly considers three factors, including the passage number, kinetic energy, and passing height of falling blocks. The values of the three factors can be obtained by the 3D numerical simulation, and reclassified to facilitate the comprehensive evaluation [18]. In this study, Rockyfor3D numerical simulation software was used to obtain the kinematic characteristics of falling blocks. The parameters mentioned above were re-classified by an improved re-classification standard based on the one proposed by Crosta et al. [18]. Finally, a rockfall hazard assessment map of the study area was obtained based on comprehensive analysis of each parameter after re-classification.
Rockyfor3D numerical simulation software was developed based on a large number of field investigations and physical experiments [14]. By inputting the parameters such as locations, shapes and sizes of the unstable blocks, and terrain condition, roughness of slope materials, and vegetation factors into the software, we can obtain the trajectory, passing height, kinetic energy, reach probability, and other kinematic characteristics of the falling blocks [14]. Combined with Rockyfor3D numerical simulation and the parameters calibrated by deposition conditions of historical rockfalls in Zhaxilin Village, we analyzed the trajectory and other kinematic parameters of falling blocks in the study area.
The methodology flow chart of this study is shown in Figure 3.

Figure 3.
The methodology flow chart of this study.
4. Distribution Characteristics and Mechanism of Rockfall Source Areas
The identification of rockfall source areas was mainly based on the DEM of 10 m resolution, assisted by aerial photos and remote sensing images. In total, 41 source areas of typical rockfalls were identified according to aerial photos, remote sensing interpretation, and field verification in study area. Based on the geological map and the DEM, the principal distribution characters of 41 source areas of typical rockfalls were obtained. The slope angles were mainly between 40° to 90°, slope aspects were mainly between 160° to 260°, and elevations were mainly between 3600 m to 4900 m. By inputting these distributing thresholds into ArcGIS, 90 source areas of rockfalls in study area were identified in detail (Figure 2a) [31]. Based on the DEM with 10 m resolution, the identification of rockfall sources was limited to rockfalls greater than a scale of 10 m. Furthermore, it was not possible to locate and map each rockfall source area, especially on sub-vertical slopes.
Final identification results show that the sources of rockfalls are mainly distributed in the altitude between 3600 and 4800 m (as shown in Figure 4), and mainly on the adrets (Figure 2a.). The elevation distributions of each lithology in the typical profile are shown in Figure 2b,c. Conglomerate is mainly distributed between 3400–4200 m and granite is above 3700 m. Lang county ophiolite melange and phyllite are distributed below elevation of 3600 m. Comparing the elevation data above, we can obtain that rockfall source areas are mainly distributed in conglomerate and granite areas. We have confirmed the correctness of this conclusion by field investigation works.
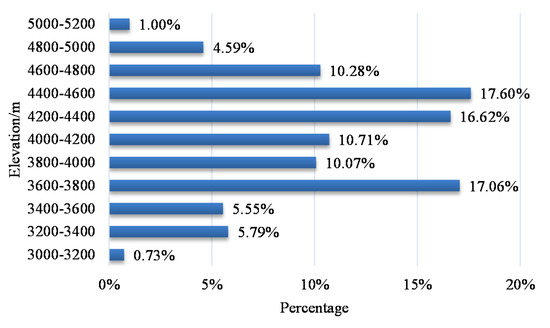
Figure 4.
The elevation distributions of rockfall source areas in the study area.
The study area located at the YTSZ. Profiles in Figure 2b,c show that the fault facets are mainly distributed in the granite area within the elevation range of 4800–5100 m, with a dip direction of southwest and dip angle of 40°–55°.
We conducted detailed field investigation at two sites in study area (locations of site A and B are shown in Figure 1b), where the lithologies of the both outcrops are conglomerate rocks. The orientation of slope is 210° ∠ 45° on both site of A and B. We used GPS real-time kinematic (GPS-RTK) technology and DJI Mavic2Pro unmanned aerial vehicle (UAV) to carry out aerial photographic survey, Agisoft Photoscan to build 3D point cloud model, and COLTOP software to extract structural feature of rock mass. The slope was too steep to climb and the limiting flight altitude of DJI Mavic2Pro UAV was 500 m, thus, we could only get the aerial photographs of conglomerate area and phyllite area which were distributed in the lower part of the slope. As mentioned above, phyllite area was not the typical area of rockfall. Therefore, we only analyzed the rock mass structure of the conglomerate area. Figure 5 shows the data of field investigation. The black frames in Figure 5 are the statistical window of joints, with the length of 50 m. According to the results of field measurement and COLTOP analysis, there are four sets of joints for rock masses in study area. The attitudes of J1, J2, J3, and J4 are about 193° ∠ 43°, 311° ∠ 81°, 116° ∠ 67°, and 232° ∠ 80°, respectively. Details for the four sets of joints are shown in Figure 5. J1 is almost dipping towards the valley whose orientation is in accordance with Yarlung Tsangpo Fault. The combination of J1, J2, and J4 cuts the rock mass into wedges. When there are heavy rainfalls, earthquakes, or other trigger factors, it is extremely possible for these unstable blocks to move downward in the form of rockfalls.
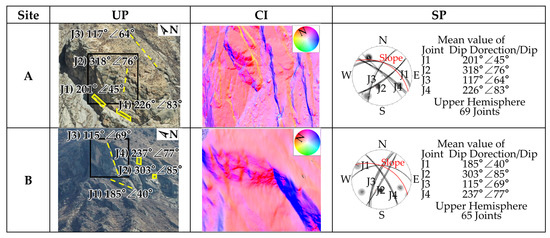
Figure 5.
UAV photos of the two site investigation areas (UP) (see Figure 1b for locations), Coltop images in colors representing the local orientation (CI) and stereographic projection (SP).
According to the analysis above, the joints of the rock mass in the study area are well developed. The stability of the rock mass is mainly affected by these joints. The lithology on both sides of Yarlung Tsangpo River is mainly phyllite, conglomerate, and granite. Affected by the structure of phyllite and many groups of joints, the rock masses of phyllite are severely fragmented, leading to the phyllite zone to be the prone area of landslide disasters. Brittle conglomerate and granite [32] are cut by several sets of joints to form blocks, wedges, and other geometric forms that are likely to move downward from the parent rocks in the form of rockfall. Therefore, the rockfall sources in the study area are concentrated on the conglomerate and granite areas.
5. Numerical Simulation of Rockfall
To obtain the kinetic energy, trajectory and other characters of falling blocks by the simulation software, we have to input rebound parameters to the program firstly. In general, rebound parameters are divided into two kinds. One is the property of slope material, which contains hardness, roughness, vegetation coverage, etc. The other is the property of block, which contains shape, size, density, etc. Back analysis is essential to obtain these parameters. For local rockfall analysis, the rebound parameters are better to be calibrated at the site of interest [33]. However, for regional analysis, we can only choose the typical rockfall site to carry out the back analysis. Calibration of the rebound parameters for this study is carried out at a typical rockfall (point C in Figure 1b) in Zhaxilin Village. The lithologies of back analysis area are mainly conglomerate, phyllite and quaternary alluvium, which contains the typical classes of rock and soil mass of the study area. Moreover, the slope angle, vegetation coverage and the size of blocks at the site of Zhaxilin Village rockfall are typical for entire study area according to the field investigation. Therefore, we chose the rockfall in Zhaxilin Village as the back analysis area for rebound parameters.
5.1. Back Analysis of Rebound Parameters
As mentioned above, a typical rockfall in Zhaxilin Village (Figure 6a) was selected as the back analysis area for rebound parameters. The elevation range from the foot to the top of the slope is 3140–5180 m, and the slope direction is 170°. It is an ancient rockfall site, confirmed by the morphology and deposit conditions of rocks around the slope. The rear edge of the slope is extremely steep with sparse shrubs grown around the foot of the relief (as shown in Figure 6b). The Yarlung Tsangpo River passes the front of the slope from west to east. Along the bank of the river, there are many conglomerate blocks deposited with different sizes, in which the maximum volume is up to 7 × 5 × 5 m3 (as shown in Figure 6c). The source area of this rockfall is mainly located at the exposed conglomerate belt in back analysis area, as shown in Figure 6b,d.
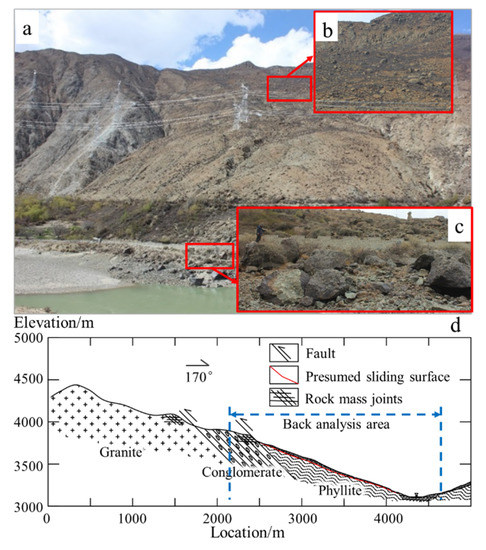
Figure 6.
Picture of rockfall in Zhaxilin village (a). Full view of the rockfall (b). The deposition around the rear edge of the slope; (c). Deposited rocks along the river bank (d). A brief geological profile of the slope (profile 3-3′ in Figure 2).
According to the lithology, roughness, and the vegetation coverage, the slope materials from the relief to the other side of the Yarlung Tsangpo River are divided into four categories (as shown in Figure 7). Subareas ①–④, respectively, correspond to the brittle rock zone, soft rock zone, quaternary alluvium zone, and the Yarlung Tsangpo River. For the whole study area, the brittle rock zone contains conglomerate and granite, while the soft rock zone contains phyllite and melange. Due to the accessibility limitation of the back analysis area, we use conglomerate and phyllite to obtain the parameters of the brittle rock area and the soft rock area, respectively. The selected size of falling block is based on the statistical analysis result of the size of deposited blocks around the slope. The mean size is taken as 4 × 3 × 3 m3, and the size variation range is ±20%. The shape is set as cuboid, and the density of rock mass is set as 2800 kg/m3 considering the experimental data of conglomerate and granite rocks. In Figure 7, there are 553 grids in the source area. The calculation is set for 1000 times, which means 5.53 × 10⁵ blocks are thrown down. Using Rockyfor3D numerical simulation software, based on the distribution of deposited blocks on the slope surface, the parameters for 3D rockfall simulation were back analyzed. It was calculated that the deposited numbers of blocks in the three regions A, B, and C in Figure 7 account for 34%, 61%, and 5% of the total amount of thrown blocks, respectively, which was in line with the distribution characteristics of deposited blocks observed on site. It is considered that the selected parameters were reasonable. The parameters of slope materials obtained by back analysis are shown in Table 1.
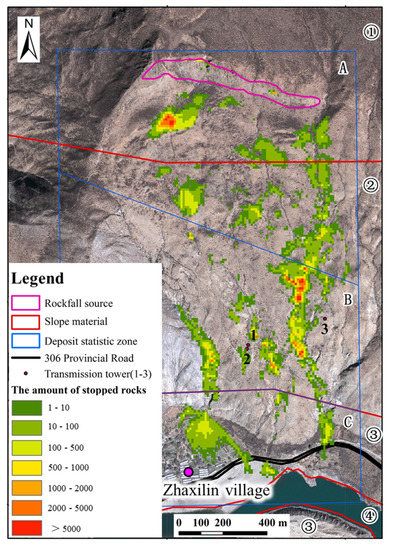
Figure 7.
Classification of slope materials and the result of parameter back analysis.

Table 1.
Numerical simulation parameters of rockfalls in study area.
5.2. 3D Numerical Simulation
Based on a semi-automatic approach for identifying rockfall sources, we obtained the source areas of rockfalls. The input parameters of the unstable rocks were evaluated as Table 2. We run 100 blocks from each source grid.

Table 2.
Parameters of unstable rock masses.
Based on the parameters obtained by back analysis and the source areas obtained by the semi-automatic approach, the kinematic characteristics of rockfalls from Nang County to Jiacha County were simulated and analyzed. The results are shown in Figure 8.
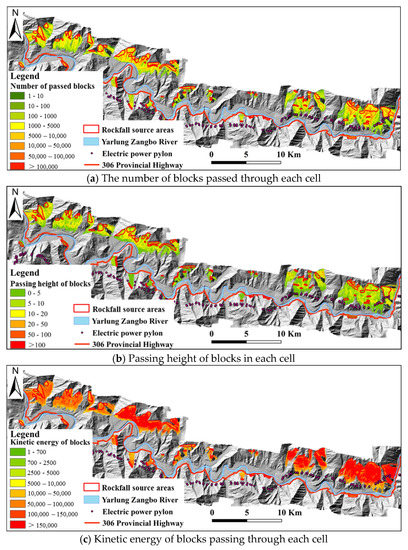
Figure 8.
Numerical simulation results of rockfalls in the study area.
6. Rockfall Hazard Assessment in the Study Area
6.1. Reclassification of Rockfall Calculation Parameters
The passage number, kinetic energy, and jump height of falling blocks obtained by numerical simulation were not uniform. In order to obtain rockfall hazard rating index by superimposing these evaluation parameters, it is necessary to reclassify these parameters.
The number of blocks passed through the slope was standardized firstly. Crosta et al. indicated that a certain part of the slope is dangerous until at least five or more blocks passed through [18]. Therefore, they proposed that the number of falling blocks passed through a certain position on the slope should be standardized by (5 × n) (where n was the number of falling blocks from one grid). In the numerical simulation of this study, the number of falling blocks from one grid is 100; thus, the number of standardized passed blocks is c/(5 × 100) (c is the number of blocks passed through a certain position of the slope). The kinetic energy classification criterion is mainly based on the protection capabilities of the current flexible protection and rigid protection facilities. At present, the maximum protection level of the flexible protective net can reach about 2500 kJ, and the general rockdam can reach about 40,000 kJ [34,35]. Due to the large size of conglomerate blocks in the rockfall source area of this study area (as shown in Figure 6c), and the high kinetic energy after they break away from the parent rock (as shown in Figure 8c), the flexible protective net is basically incapable to intercept them. However, we can still choose 2500 kJ and 40,000 kJ as the energy grading standards. In recent protection engineering, the height of the flexible protective net is generally about 5–7 m, and the designed height of the rock retaining wall is generally about 10 m. Thus, we chose 5 m and 10 m as the grading standards for the heights of the blocks when they pass through the slope. The parameter reclassification criteria of rockfall hazard assessment are shown in Table 3.

Table 3.
The parameter reclassification criteria of rockfall hazard assessment (Modified from Crosta et al. [18]).
6.2. Rockfall Hazard Assessment
According to the reclassification results of the kinetic energy, passing height, and passage number of falling blocks, the vector values of (R, H, V) for all the rasters were obtained. According to values of |RHV| (as shown in Table 4), the rockfall hazard in the study area was divided into three levels: I [4.123, 5.196], II [3, 4.123], and III [1.732, 3], corresponding to a hazard level of high, medium, and low, respectively. The hazard mapping results are shown in Figure 9.

Table 4.
Classification criteria of rockfall hazard assessment in study area.
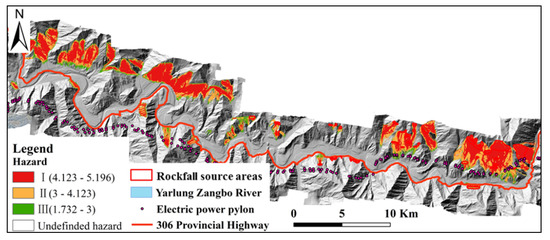
Figure 9.
Hazard assessment map of study area.
Provincial highway 306 in the study area is located on the right bank of the Yarlung Tsangpo River; thus, it is mainly affected by the rockfalls on the right bank. The length of the 306 provincial highway is 91,620 m in the study area, and the length affected by rockfall is 10,010 m, accounting for 10.92% of the 306 provincial highway in the study area. The total length of the transmission line is about 60,860 m in the study area, and the length affected by rockfall is 5710 m, accounting for 9.38% of the transmission line in the study area. The number of pylons affected by rockfall is 17, and the numbers located in high, medium, and low hazard areas are 6, 6, and 5, respectively. Here, we have mentioned that the public infrastructure was exposed at rockfall hazard. According to Corominas et al., this is one of the components of risk [36]. Since the highway and pylons are inanimate objects, the rockfall risks they take basically depend on the rockfall hazards of the locations where they are. Therefore, pylons within high risk zones of rockfalls are concentrated on the east part of the study area. The partitions of highway within high risk zones are concentrated on the central and east parts of the study area.
7. Conclusions
The study area is strongly affected by neotectonic movement, which results in its complex formation lithology and fragmented rock mass. Rockfall is one of the main geohazards in this study area. A multi-approach for rockfall investigation and hazard assessment was proposed in this paper, combining with DEM of 10 m resolution, UAV and RTK techniques, COLTOP and Rockyfor3D software, and an improved RHV assessment method. Through this multi-approach, we can quickly obtain large amounts of data, and thus, overcome the shortcoming of time consuming and limitation on viewing angle of the traditional field identification work. We also improved the parameters re-classification criterion of the RHV rockfall hazard assessment method (Crosta et al. [18]) for getting more helpful results. Considering that Tibet is one of the most rugged environments for field investigation, the multi-approach applied to this area could also be applied to other areas where conditions are similar or better.
This multi-approach for rockfall investigation and hazard assessment solved the problem of lacking detailed historical data of rockfalls for the areas that are needed to carry out quantitative hazard assessment. In this study, the rockfall hazard from Nang County to Jiacha County in Tibet was assessed. The result indicated that 10.92% of the 306 provincial highway and 9.38% of the power line were threatened by potential rockfall hazard in study area. It also has a certain guiding value to the linear project planning and future geohazards prevention work in the study area.
Certainly, there are some limitations of our study, such as the elevation limitation of the point cloud data caused by ability limitation of the UAV and the identification limitation of rockfall sources in sub-vertical areas. We would need to carry out more field investigation and comparative analysis under different conditions to improve this multi-approach in further research, and verify its applicability to different areas in subsequent research.
Author Contributions
H.L. and X.W. designed the theoretical framework; H.L., X.W., J.S., and S.Z. conducted the field investigation; J.S. and S.Z. carried out the formal analysis; H.L. carried out the numerical simulation and wrote the paper. X.W. and X.L. reviewed and edited the paper. All authors have read and agreed to the published version of the manuscript.
Funding
This research was funded by the Strategic Priority Research Program of Chinese Academy of Sciences (Grant No. XDA23090402), Second Tibetan Plateau Scientific Expedition and Research Program (STEP) (Grant No. 2019QZKK0904), Application of Synthetic Aperture Radar-Based Geological Hazard Analysis Technology on the Strategic Electricity Transmission Passage of Sichuan-Tibet Plateau (Grant No. 52199918000C), and the National Natural Science Foundation of China (Grant No. 41672321).
Conflicts of Interest
The authors declare no conflict of interest.
References
- Yin, Y. Study on Characteristics and Disaster Reduction of Giant Landslide along Bomi-Yigong Highway in Tibet. Hydrogeol. Eng. Geol. 2000, 27, 8–11. [Google Scholar] [CrossRef]
- Tan, L.; Ye, D.; Li, P.; Peng, Q.; Tan, Y. Application of 3S Technology in Hydrological Monitoring on Motuo Barrier Lake in Tibet. J. China Hydrol. 2013, 33, 47–51. [Google Scholar] [CrossRef]
- Liu, W. Study on the characteristics of huge scale-super highspeed-long distance landslide chain in Yigong, Tibet. Chin. J. Geol. Hazard Control 2002, 13, 9–18. [Google Scholar] [CrossRef]
- Zhang, L.Q.; Xu, B.; Shang, Y.J.; Zhu, J.W.; Yang, Z.F. Engineering Geological Investigation and Assessment on Rockfall Hazard Along Basu-Linzhi Section of South Line of Sichuan-Tibet Highway. Chin. J. Rock Mech. Eng. 2004, 23, 1551–1557. [Google Scholar] [CrossRef]
- Zhang, L.; Yang, Z. Risk Analysis of Encountering Rockfalls On Highway-A Case Study. Chin. J. Rock Mech. Eng. 2004, 23, 5543–5548. [Google Scholar] [CrossRef]
- Li, X.Z.; Zhong, W.; Zhang, X.G.; Bian, J.H.; Cui, Y.; Huang, S.W. Hazard Ways of Landslide and Avalanches On Road Engineering In Sichuan-Tibet Traffic Corridor. J. Eng. Geol. 2017, 25, 1245–1251. [Google Scholar] [CrossRef]
- Mineo, S.; Pappalardo, G.; D’Urso, A.; Calcaterra, D. Event tree analysis for rockfall risk assessment along a strategic mountainous transportation route. Environ. Earth Sci. 2017, 76, 620. [Google Scholar] [CrossRef]
- Mutar, F.A.; Biswajeet, P. A novel rockfall hazard assessment using laser scanning data and 3D modelling in GIS. Catena 2019, 172, 435–450. [Google Scholar] [CrossRef]
- Michoud, C.; Derron, M.H.; Horton, P.; Jaboyedoff, M.; Baillifard, F.J.; Loye, A.; Nicolet, P.; Pedrazzini, A.; Queyrel, A. Rockfall hazard and risk assessments along roads at a regional scale: Example in Swiss Alps. Nat. Hazards Earth Syst. Sci. 2012, 12, 615–629. [Google Scholar] [CrossRef]
- Abbruzzese, J.M.; Labiouse, V. New Cadanav methodology for quantitative rock fall hazard assessment and zoning at the local scale. Landslides 2014, 11, 551–564. [Google Scholar] [CrossRef]
- Ferrari, F.; Giacomini, A.; Thoeni, K. Qualitative Rockfall Hazard Assessment: A Comprehensive Review of Current Practices. Rock Mech. Rock Eng. 2016, 49, 2865–2922. [Google Scholar] [CrossRef]
- Guzzetti, F.; Crosta, G.; Detti, R.; Agliardi, F. STONE: A computer program for the three-dimensional simulation of rock-falls. Comput. Geosci. 2002, 28, 1079–1093. [Google Scholar] [CrossRef]
- Christen, M.; Bartelt, P.; Gruber, U. RAMMS—A modelling system for snow avalanches, debris flows and rockfalls based on IDL. Photogramm. Fernerkund. Geoinf. 2007, 4, 289–292. [Google Scholar]
- Dorren, L.K.A. Rockyfor3D (V5. 2) Revealed—Transparent Description of the Complete 3D Rockfall Model; EcorisQ Paper; Association ecorisQ: Geneva, Switzerland, 2015. [Google Scholar]
- Jaboyedoff, M.; Labiouse, V. Etablissement d’une méthodologie de Mise en Œuvre des Cartes de Dangers Naturels du Canton de Vaud Cadanav—Méthodologie Instabilities Rocheuses; Rapport Pour le Canton de Vaud; LMR-EPFL: Lausanne, Switzerland, 2002. [Google Scholar]
- Rouiller, J.D. Pentes instables dans le Pennique valaisan: Matterock: une méthodologie d’auscultation des falaises et de détection des éboulements majeurs potentiels; vdf Hochschulverlag AG: Zurich, Switzerland, 1998. [Google Scholar]
- Desvarreux, P. Considérations sur le zonage en France, Lecture notes. In Université Européenne d’été sur les Risques Naturels 2002: Glissements de Terrain et Instabilités de Falaise; European University: Sion, Switzerland, 2002. [Google Scholar]
- Crosta, G.B.; Agliardi, F. A methodology for physically based rockfall hazard assessment. Nat. Hazards Earth Syst. Sci. 2003, 3, 407–422. [Google Scholar] [CrossRef]
- Lan, H.; Martin, C.D.; Lim, C.H. RockFall analyst: A GIS extension for three-dimensional and spatially distributed rockfall hazard modeling. Comput. Geosci. 2007, 33, 262–279. [Google Scholar] [CrossRef]
- Mavrouli, O.C.; Abbruzzese, J.; Corominas, J.; Labiouse, V. Review and Advances in Methodologies for Rockfall Hazard and Risk Assessment. In Mountain Risks: From Prediction to Management and Governance; Springer: Dordrecht, The Netherlands, 2014. [Google Scholar] [CrossRef]
- Tibet Geology and Mining Bureau. Report of Regional Geological Survey, 8-46-(27), Scale 1:200,000. 1995. Available online: http://www.ngac.org.cn/Data/FileList.aspx?MetaId=F5F68B3497B81B60E0430100007F0760&Mdidnt=x00086428 (accessed on 25 October 2019).
- Yunnan Geological Survey. Report of Regional Geological Survey, H46C003003, Scale 1:250,000. 2003. Available online: http://www.ngac.org.cn/Data/FileList.aspx?MetaId=F5F68B34856D1B60E0430100007F0760&Mdidnt=d00122708 (accessed on 25 October 2019).
- Bureau of Land and Resources of Tibet. Plan for the Prevention and Control of Geological Disasters in Linzhi City, Tibet. 2008. Available online: http://www.gtzyj.linzhi.gov.cn/gtzyj/c104614/201901/7b4784624e3f4b7ba9d60ee89e83d353.shtml (accessed on 10 August 2019).
- Pappalardo, G.; Imposa, S.; Barbano, M.S.; Grassi, S.; Mineo, S. Study of landslides at the archaeological site of Abakainon necropolis (NE Sicily) by geomorphological and geophysical investigations. Landslides 2018, 15, 1279–1297. [Google Scholar] [CrossRef]
- Martino, S.; Moscatelli, M.; Mugnozza, G.S. Quaternary mass movements controlled by a structurally complex setting in the central Apennines (Italy). Eng. Geol. 2004, 72, 33–55. [Google Scholar] [CrossRef]
- Seyitoglu, G.; Kazancl, N.; Karadenizli, L.; Şen, S.; Varol, B.; Karablylkoglu, T. Rockfall avalanche deposits associated with normal faulting in the NW of Çanklrl basin: Implications for the postcollisional tectonic evolution of the Neo-Tethyan suture zone. Terra Nova 2000, 12, 245–251. [Google Scholar] [CrossRef]
- Dong, H.; Xu, Z.; Zhou, X.; Badeng, Z.; Li, H.; Yi, Z.; Chen, X.; Ma, X.; Wu, C. Activity Timing and Tectonic Evolution of the Eastern Segment of the Great Count Thrus in the Northern Margin of the Himalayan Orogen Belt. Acta Geol. Sin. 2016, 90, 3011–3022. [Google Scholar]
- Li, B.; Diao, G.; Zou, L.; Xu, X.; Ma, X. Review of source papameters of the M7.7 earthquake in southeastern Nang County, Tibet, 1947. Seismol. Geomagn. Obs. Res. 2014, 85–91. [Google Scholar] [CrossRef]
- Jaeger, J.J.; Courtillot, V.; Tapponnier, P. Paleontological view of the ages of the Deccan Traps, the Cretaceous/Tertiary boundary, and the India-Asia collision. Geology 1989, 17, 316–319. [Google Scholar] [CrossRef]
- Wang, R. Identification and Hazard Assessment of Collapse in Southeastern Tibet—Taking the Area along the Central Tibet Grid Interconnection Project as an Example. Master’s Thesis, University of Chinese Academy of Sciences, Beijing, China, 2019. [Google Scholar]
- Wang, R. Identification and main controlling factor analysis of collapse and landslide based on fine DEM—Taking Jiacha-Langxian section of Yarlung Zangbo structure zone as an example. J. Eng. Geol. 2019, 27, 1146–1152. [Google Scholar] [CrossRef]
- Zhou, J.; Lan, H.X.; Zhang, L.Q.; Yang, D.X.; Song, J.; Wang, S. Novel grain-based model for simulation of brittle failure of Alxa porphyritic granite. Eng. Geol. 2019, 251, 100–114. [Google Scholar] [CrossRef]
- Volkwein, A.; Schellenberg, K.; Labiouse, V.; Agliardi, F.; Berger, F.; Bourrier, F.; Dorren, L.; Gerber, W.; Jaboyedoff, M. Rockfall characterisation and structural protection-a review. Nat. Hazards Earth Syst. Sci. 2011, 11, 2617–2651. [Google Scholar] [CrossRef]
- Su, J.; Zhou, C.; Chen, S.S.; He, J.C.; Wu, Y.J.H.; Zhang, G.R. Numerical simulation of flexible gabion arch dam to prevent and control debris flow blocks. Chin. J. Geotech. Eng. 2015, 37, 269–275. [Google Scholar] [CrossRef]
- Wang, X.; Ran, Y.; Li, J. Analysis of Shock Resistance of New Debris Flow Dam with Continuous Crash Bearers. J. Disaster Prev. Mitig. Eng. 2017, 3, 474–480. [Google Scholar] [CrossRef]
- Corominas, J.; van Westen, C.; Frattini, P.; Cascini, L.; Malet, J.P.; Fotopoulou, S.; Catani, F.; van den Eeckhaut, M.; Mavrouli, O.; Agliardi, F.; et al. Recommendations for the quantitative analysis of landslide risk. Bull. Eng. Geol. Environ. 2014, 73, 209–263. [Google Scholar] [CrossRef]
© 2019 by the authors. Licensee MDPI, Basel, Switzerland. This article is an open access article distributed under the terms and conditions of the Creative Commons Attribution (CC BY) license (http://creativecommons.org/licenses/by/4.0/).