Article

An Approach to Industrial Automation Based on Low-Cost Embedded Platforms and Open Software

1
School of Engineering and Sciences, Tecnologico de Monterrey-Guadalajara, Gral. Ramón Corona 2514, Guadalajara 45138, Mexico
2
Department of Electrical Engineering, Universidad Católica de Cuenca, Ave. de las Americas y Humboldt, Cuenca 010105, Ecuador
*
Author to whom correspondence should be addressed.
Appl. Sci. 2020, 10(14), 4696; https://doi.org/10.3390/app10144696
Submission received: 6 June 2020 / Revised: 27 June 2020 / Accepted: 30 June 2020 / Published: 8 July 2020

Abstract

:
This paper presents a performance evaluation of the development of the instrumentation, communications and control systems of a two-tank process by using low-cost hardware and open source software. The hardware used for automating this process consists of embedded platforms (Arduino and Raspberry Pi) integrated into programmable logic controllers (PLCs), which are connected to a supervisory control and data acquisition (SCADA) system implemented with an open source Industrial Internet of Things (IIoT) platform. The main purpose of the proposed approach is to evaluate low-cost automation solutions (hardware and software) within the framework of modern industry requirements in order to determine whether these technologies could be enabling factors of IIoT. The proposed control strategy for regulating tank levels combines the classic PID algorithm and the fuzzy gain scheduling PID (FGS-PID) approach. Fault detection capabilities are also enabled for the system through a fault detection and diagnosis module (FDD) implemented with an extended Kalman filter (EKF). The distributed controller’s (DC) algorithms are embedded into the PLC’s processors in order to demonstrate the flexibility of the proposed system. Additionally, a remote human to machine interface (HMI) is deployed through a web client of the IIoT application. Experimental results show the proper operation of the overall system.

1. Introduction

Industrial automation is currently dominated by solutions which are implemented only with distributed controllers, such as programmable logic controllers (PLCs). The programming of these devices is mainly based on the standard IEC 61131, which does not comply with the requirements of the object-oriented programming (OOP) approach of large-scale distributed systems. Since industrial control systems are not generic computing systems, OOP must comply with other requirements [1]: the direct configuration of I/O signals, multiparadigm programming, etc. Additionally, PLCs have limited processing capabilities, which could be a barrier to scaling their applications to more complex tasks.
The majority of technical solutions deployed in the industrial market have been developed by proprietary technology manufacturers, which causes great difficulties in communication between devices. These interoperability problems have generated technology dependency in most cases. As a consequence, until there is a standardization of interfaces, protocols and applications, the interconnection required for the implementation of Industry 4.0 will be potentially expensive, inefficient and possibly an unsafe option [2]. Therefore, continuous innovation in open hardware and software is important to boost developments in the areas of supervision, industrial control and interoperability of manufacturing plants, keeping affordable prices for small and medium-sized factories.
Several solutions have been proposed to meet the requirements of supervision, control and communications between production processes using low-cost technologies. For instance, in [3], a liquid flow monitoring system is detailed that uses a LAN network to transmit data from a microcontroller, Arduino, which measures liquid flow and controls a solenoid valve, to a microcomputer, Raspberry Pi, which implements a web server to enable remote control and monitoring. In [4], the design of supervisory control and data acquisition (SCADA) systems using open hardware and software is proposed. The structure consists of four elements: a master terminal unit (MTU), a communication protocol, a remote terminal unit (RTU) and field devices. The MTU consists of a computer with an HMI, while the RTU is an embedded platform based on Arduino. The communication protocol is Modbus. In [5], a testbed consisting of six Raspberry Pis is presented to illustrate a method of troubleshooting communication protocols in intelligent industrial systems. In [6], an architecture is proposed for a multi-agent system based on OPC-UA for the integration of systems at manufacturing sites. In [7,8,9], architectures based on OPC servers with communication and data logging functionalities between multiple protocols are proposed. In [10], the implementation of industrial communication protocols using FPGAs is presented.
The research works previously reported have a common disadvantage, which is the low level of robustness of the prototypes. The implementation results are oriented to simple systems with constant operating points and controlled operation conditions (laboratory environment). On the other hand, in [11], the authors propose a distributed service-oriented architecture to make PLC controllers compatible with Industry 4.0. This solution implies the use of PLCs whose firmware is easily upgradable to an IEC 61131 programming environment which integrates basic web technologies, network data processing and communications. Legacy PLCs typically lack these programming features; therefore, PLCs with embedded processors such as Arduino and Raspberry Pi emerge as feasible industrial solutions.
This work presents the design, implementation and evaluation of the instrumentation, communications, control and supervision systems of a multi-tank system by using low-cost PLCs and communication interfaces compatible with the thinger.io local server IoT platform. The purpose of this research is to explore low-cost embedded platforms through PLCs based on Arduino and Raspberry Pi, enabling communication functions, variable preprocessing and advanced control schemes, in the context of the computer integrated manufacturing (CIM) scheme. Experimental results demonstrate the operational capacity of the system under various operating conditions.
This document is organized as follows: Section 2 describes the multi-tank system. Section 3 details the implementation of the instrumentation, communications and control systems of the multi-tank system. Section 4 presents experimental and simulation results. Section 5 presents the limitations of the proposed system. Section 6 presents the conclusions.

2. System Description

The process selected for the demonstration of the methodology proposed in this article corresponds to a multi-tank system. Figure 1 shows the P&ID diagram of this system. The plant consists of three tanks: two reserve tanks and another one used for pumping purposes. The description of the measuring and control devices is as follows:
  • The check valve (FV-100) protects the pump from water hammer.
  • The pressure relief valve (FV-108) protects the pump and the pipe from pressure increases caused by the closing of the flow control valve (FCV-101).
  • The control valves FCV-101, FCV-103 and FCV-106 regulate the levels of the reserve tanks.
  • The level transmitters (LT-104 and LT-105) record the levels of tanks 1 and 2 and transmit them to the main controller (FC-201).
  • The multi-tank system input and output flows are monitored by flow sensors (FT-102 and FT-107).
  • The electrical signals from the level and flow sensors are calibrated by the nodes (LY-200 and FY-200). These data are sent to the node that performs control and supervision functions (FC-201), which then sends information to a data logger server (UR-300).
  • The process is locally monitored by a human to machine interface (HMI) (UG-301), which communicates directly with the controller node, while a SCADA system (UG-302) exchanges real-time data with the UR-300.

3. System Implementation

The CIM architecture integrates the processes involved in the automation of industrial production, from the manufacturing of the product to the level of business management. The CIM model consists of five levels: (1) the field level, (2) process level, (3) level of supervision, (4) management level and (5) the company level [12].
The architecture proposed in this work involves the first three levels of the CIM pyramid model. Figure 2 shows the proposed automation system architecture for the multi-tank system. The field level consists of ultrasonic sensors, flow sensors, a hydraulic pump and three solenoid valves. The process level consists of two low-cost embedded PLCs: (i) PiXtend based on the Raspberry Pi platform, which implements the control and fault detection algorithms in the system, and (ii) M-Duino based on the Arduino platform, which preprocesses the signals from the sensors. This configuration allows the demonstration of the integration of different platforms (heterogeneity) within the same system. The supervisory level is made up of an Internet of Things (IoT) local server installed in a Raspberry Pi connected to the local Wi-Fi router via an Ethernet cable, such that only the devices connected to the network—either wired or wireless—can access the data hosted on the thinger.io local server. It is important to mention that both PLCs, M-Duino and PiXtend, are CE certified and have compliance with the IEC61131 standard. These features offer robustness in industrial applications.
Details regarding the implementation of each level are given below.

3.1. Field Level

The series HC-SR04 ultrasonic sensors (LT-104 and LT-105) are used to measure tank levels. The DIGITEN FL-408 flow sensors (FT-102 and FT-107) are used to monitor the input and output flow of the process, respectively. The level of the tanks is controlled by varying the inflows and outflows of each tank. The variation of the flows is carried out through the regulation of solenoid valves. The solenoid valves used are the following models: 1 / 2 ball type Winner WVA4-3 solenoid valve (FCV-101), BACOENG 2W-15 (FCV-103) solenoid type 1 / 2 , and the solenoid valve US SOLID USSMSV00002 3 / 4 ball type (FCV-106). The entire system is powered by the Favson F3012 pump.

3.2. Process Level

This level comprises the DCs, whose operation involves the control and fault detection systems. These systems are implemented in the PiXtend PLC (FC-201). The control systems implemented are based on the PID and FGS-PID control algorithms. The fault detection system uses an EKF. The proposed control system is of the decentralized type, as shown in Figure 3. Each tank has a reference of the desired level ( r e f h 1 and r e f h 2 ). The error signals are processed to obtain the control signals u 1 , u 2 , and u 3 , which command the valves. Finally, the EKF receives the tank levels and the control signals as input signals to estimate the tank levels ( h ˜ 1 and h ˜ 2 ).
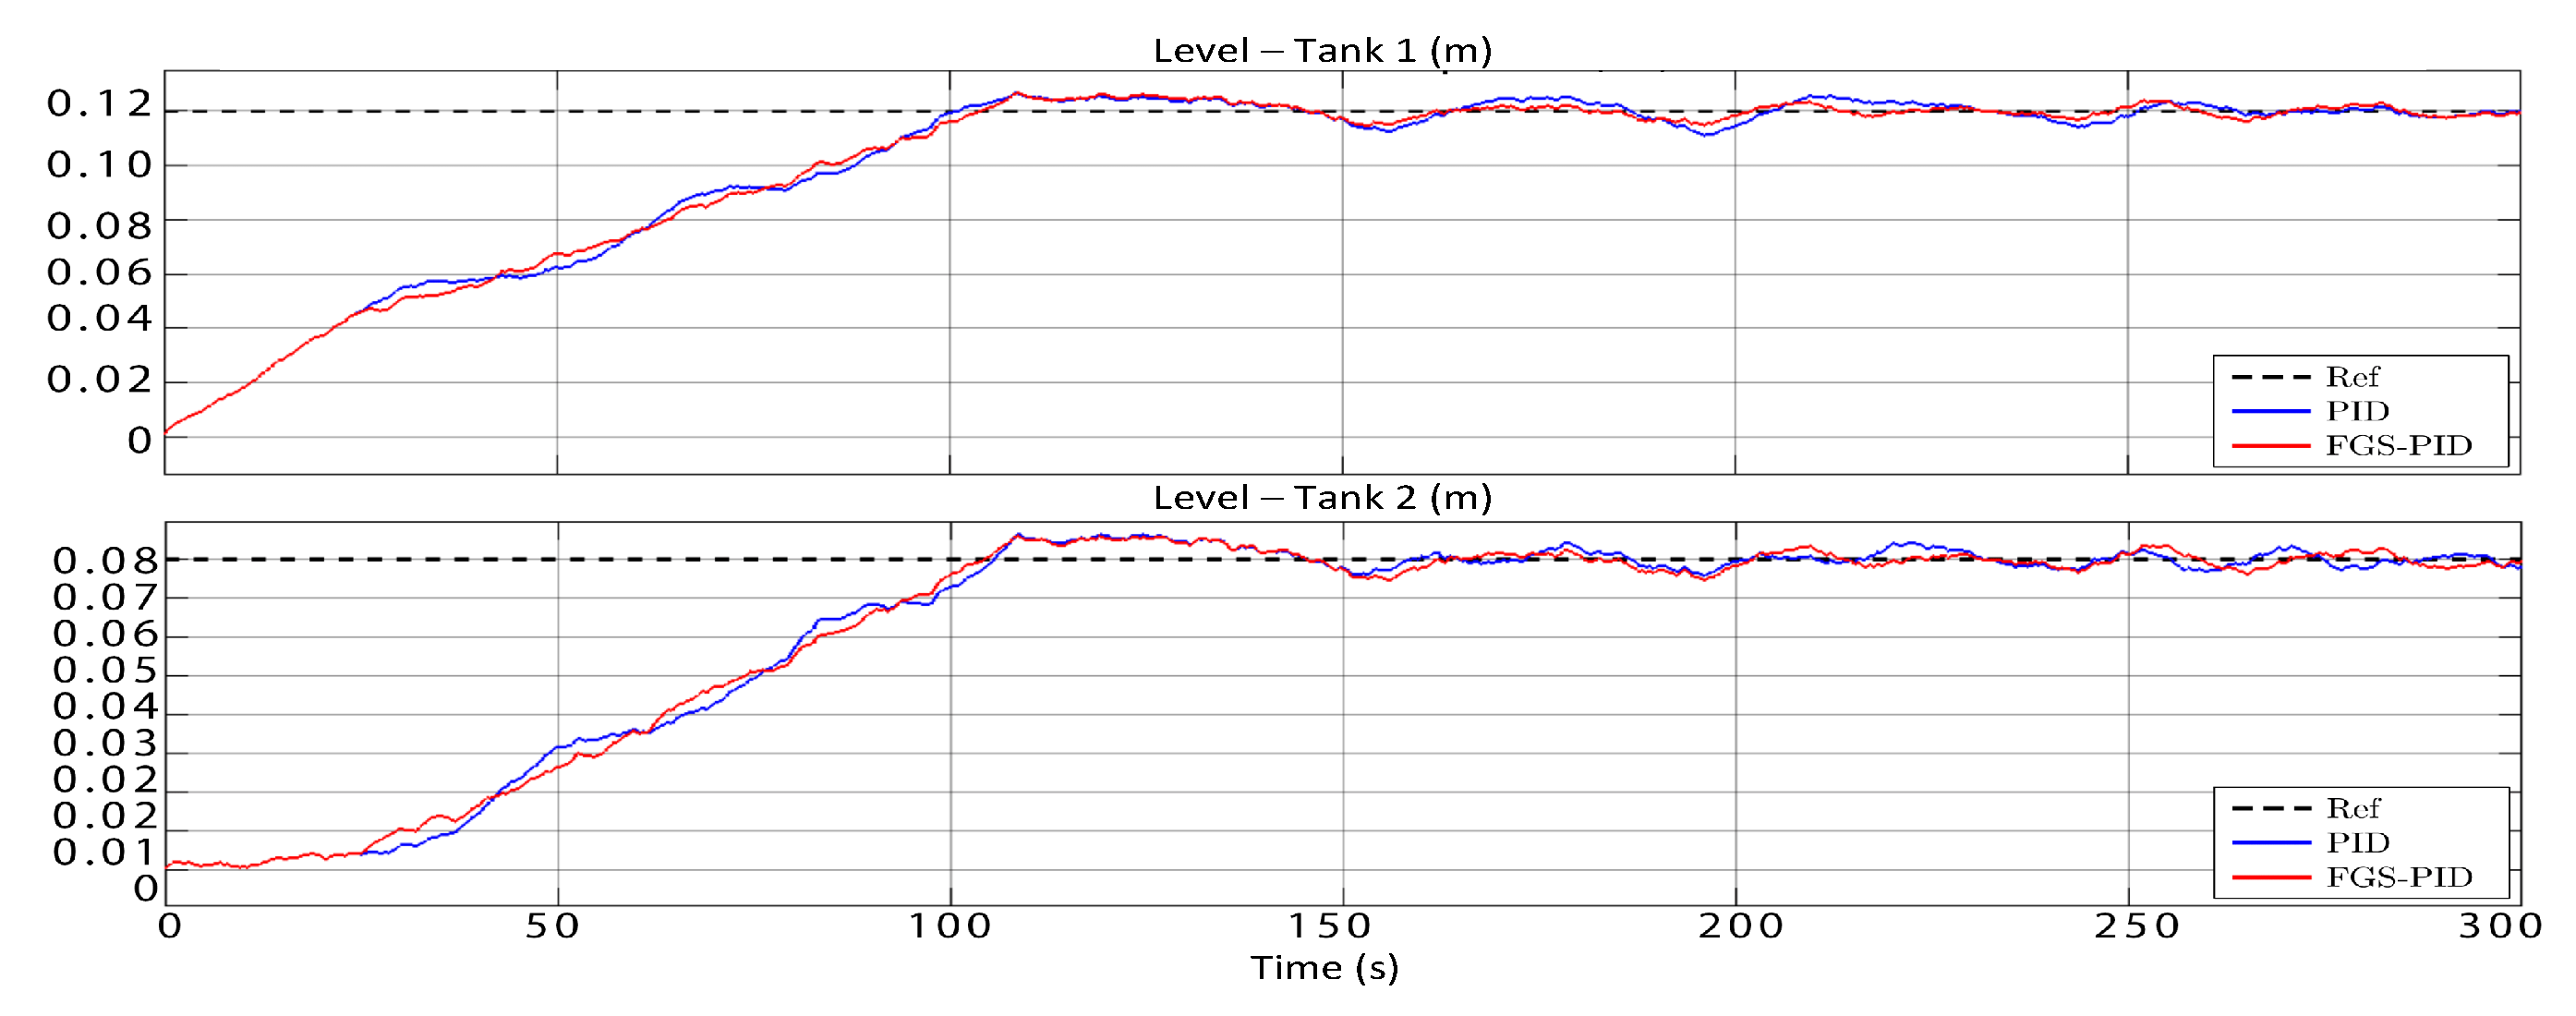
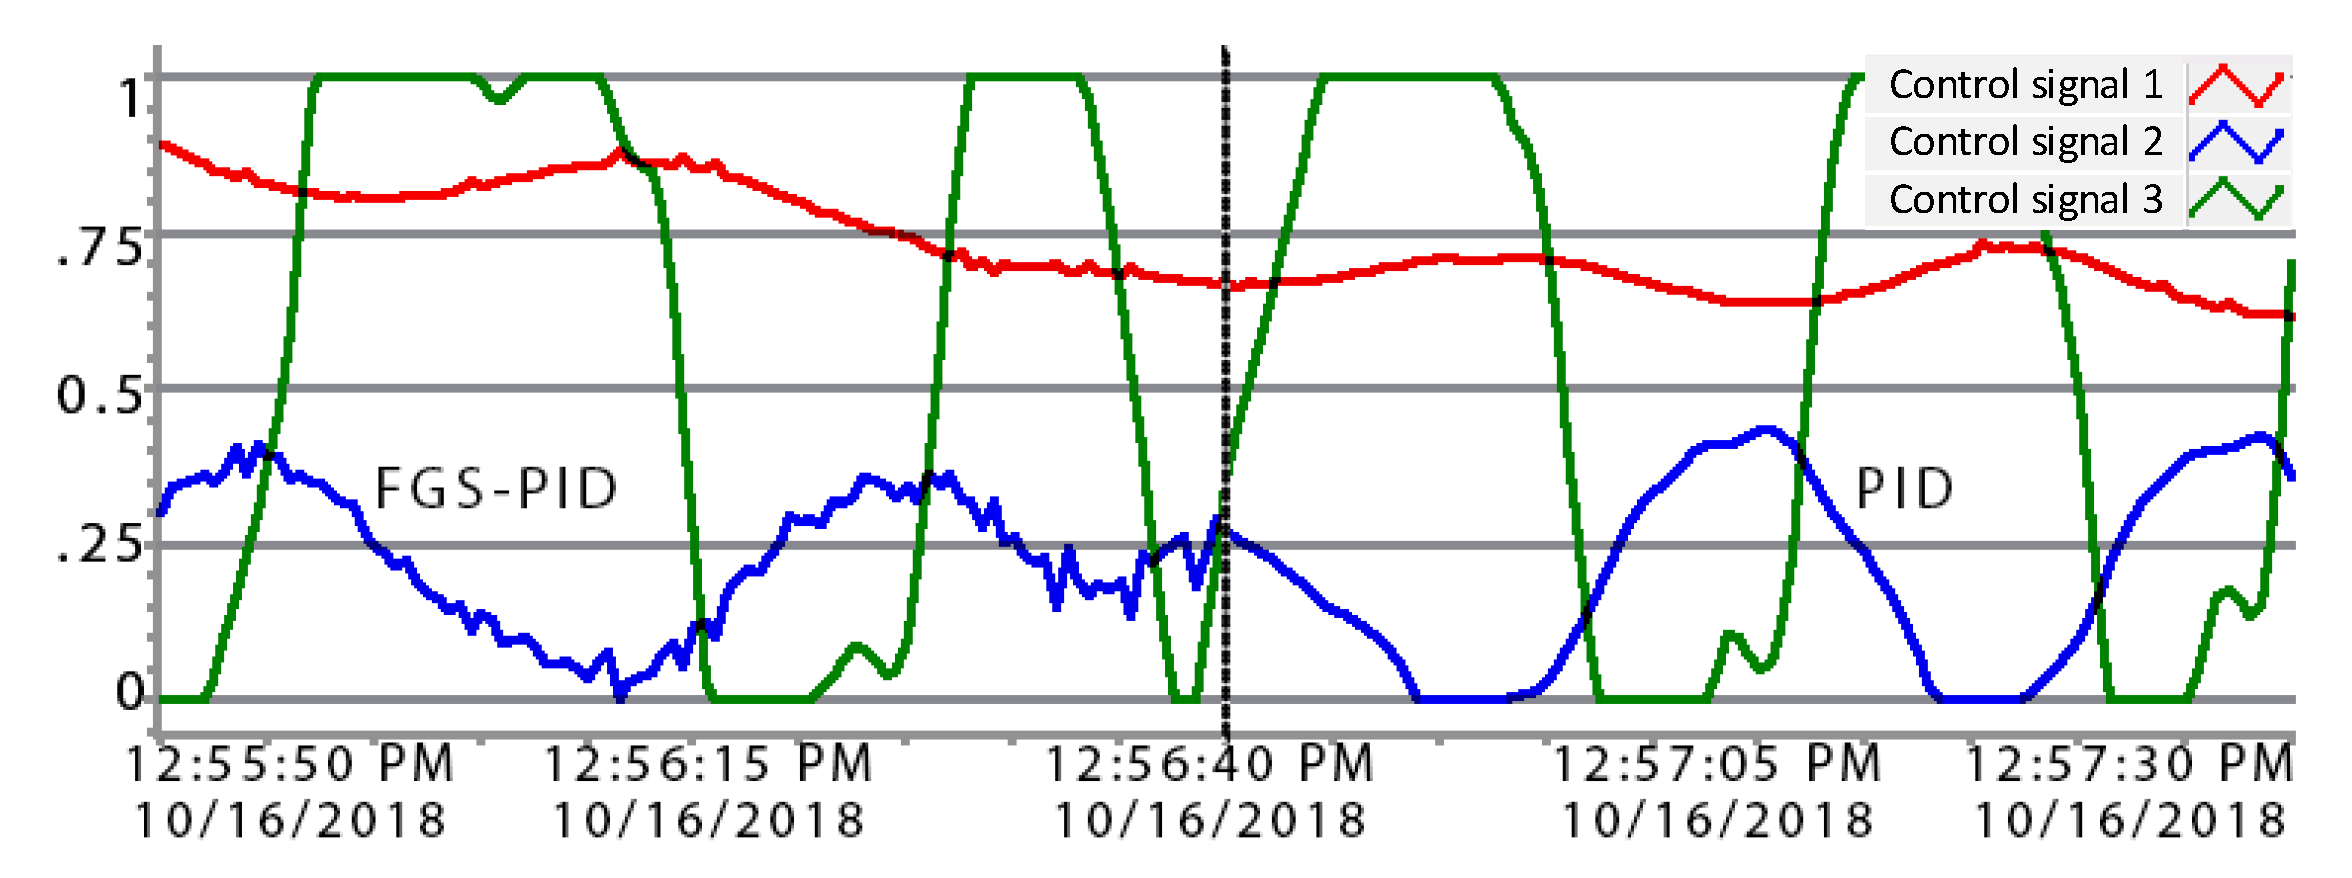
In this work, two control schemes are proposed and compared: classic PID and fuzzy + PID. The classic PID scheme uses three PID controllers, one for each valve of the multi-tank system. The fuzzy + PID scheme implements the fuzzy gain scheduling (FGS)-PID algorithm for valve 2, while the controllers for valves 1 and 3 correspond to classic PIDs. This configuration shows significantly better performance than other combinations of FGS-PID applied to valves 1 and 2.
Control schemes, including the fault detection and diagnosis module (FDD) system based on the EKF, are designed from the process model, determined by
d h 1 d t = 1 A 1 u 1 q 0 u 2 a 2 2 g h 1 d h 2 d t = 1 A 2 u 2 a 2 2 g h 1 u 3 a 3 2 g h 2
where
h 1 , h 2 :Liquid level at tanks 1, 2
u 1 , u 2 , u 3 :% of opening of valves (0 u 1 , 2 , 3 1)
A 1 , A 2 :Cross-section area of tanks 1, 2
a 2 , a 3 :Cross-section area of valves 2, 3
q 0 :Nominal valve flow ( q 0 = 4 lt/min)
g:Gravity constant (g = 9.81 m/s 2 ).
Faults to be detected correspond to leaks in tanks 1 and 2. A leak is modeled as an outflow caused by a hole located at the bottom of the tank, as follows:
d h 1 d t = 1 A 1 u 1 q 0 u 2 a 2 2 g h 1 l 1 d h 2 d t = 1 A 2 u 2 a 2 2 g h 1 u 3 a 3 2 g h 2 l 2 l 1 = k l 1 a l 1 2 g h 1 l 2 = k l 2 a l 2 2 g h 2 k l 1 , 2 = 0 , no leak 1 , leakage
where
l 1 , l 2 :Flow due to leaks in the tanks 1, 2
a l 1 , a l 2 :Leak hole area in tanks 1, 2
k l 1 , k l 2 :Fault indicator for tank 1, 2.
Table 1 presents the physical values considered for the calculation and deployment of the system.

3.2.1. PID Controller

Equation (3) presents the discrete control algorithm of the PID controller. Tuning parameters K p , K i and K d of the controllers are obtained from the Ziegler–Nichols final gain method. Additionally, through recursive MATLAB simulations, the overshoot vs. settling time ratio min K p , K i , K d M p t s s was minimized.
u k = u k 1 + K p e k e k 1 + K i e k + K d e k 2 e k 1 + e k 2

3.2.2. FGS-PID Controller

The FGS-PID controller design uses the methodology presented in [13]. The inputs to the control system correspond to the error variables ( e ( t ) ) and the first derivative of the error ( e ˙ ( t ) ), while the outputs are the variables K p , K d and α , which determine the parameters of the PID controller by
K p = K p min + ( K p max K p min ) K p K d = K d min + ( K d max K d min ) K d K i = K p 2 α K d
For the linguistic variables ( e ( k ) ) and ( e ˙ ( k ) ), the following membership functions are implemented: big negative values (NB), medium negative (NM), negative small (NS), zero (ZO), small positive (PS), medium positive (PM) and big positive (PB) values. Figure 4 shows the error membership functions. Figure 5 shows the membership functions of the error derivative.
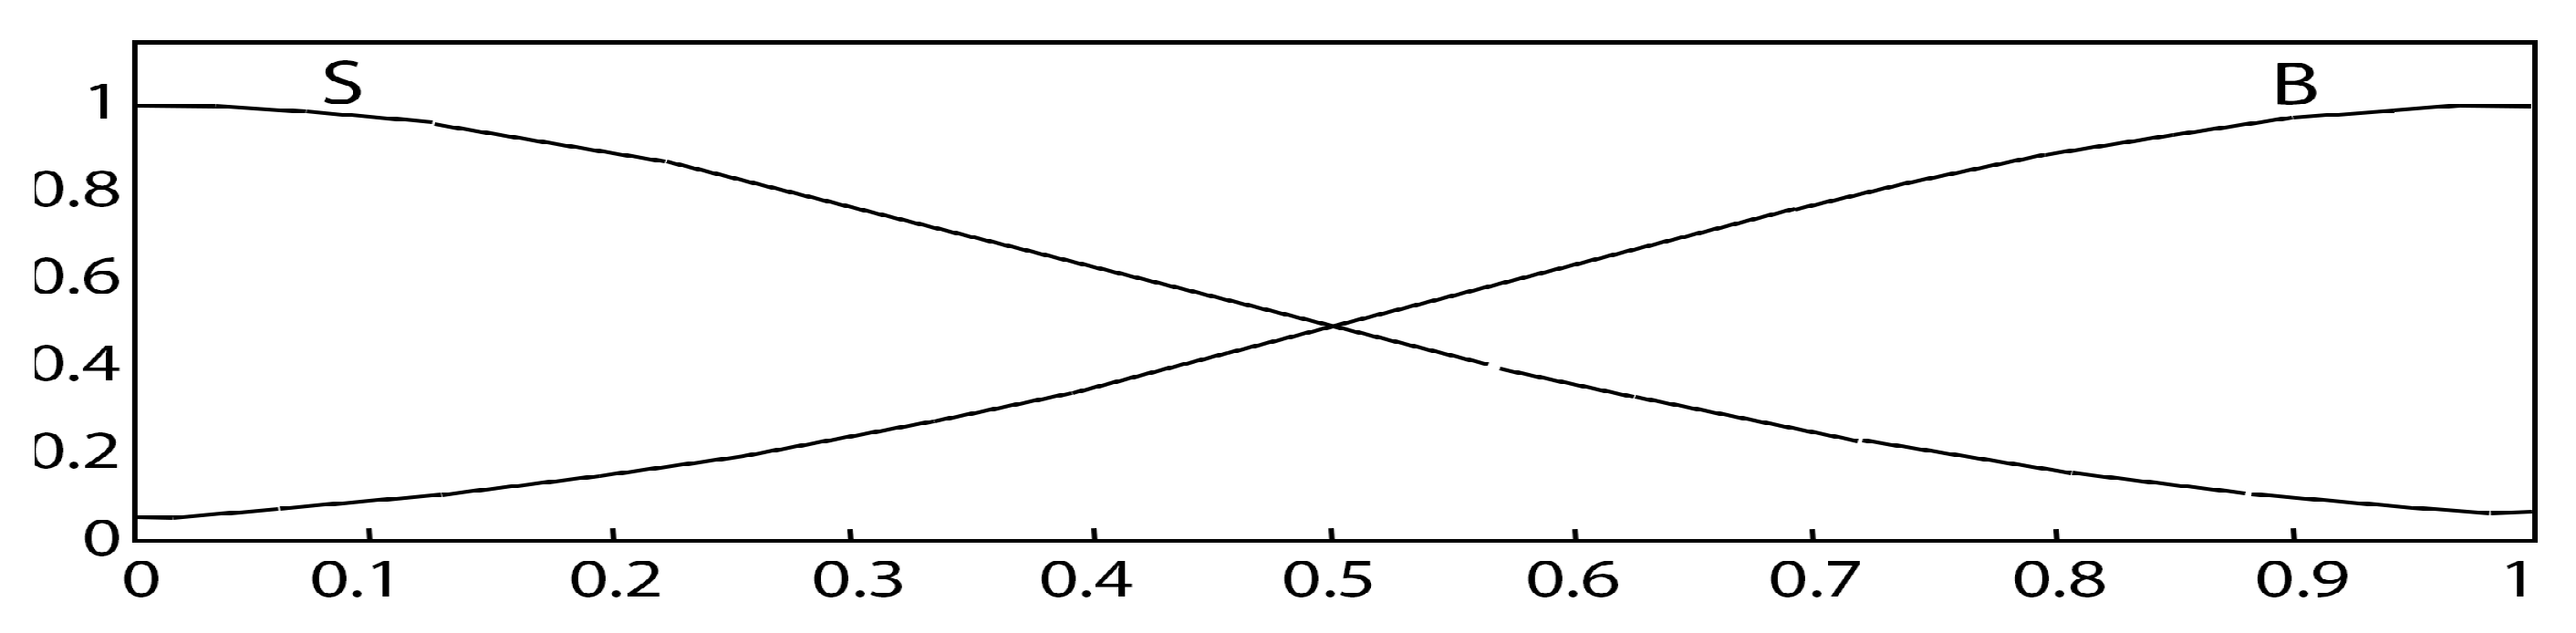
The output variables K p and K d have two membership functions, small (S) and big (B), which are of the Gaussian type with standard deviation 0.4247 and center at 0 and 1, respectively. These membership functions are shown in Figure 6. The output variable α has four membership functions, described as 2, 3, 4 and 5, which are implemented as triangular functions. These membership functions are shown in Figure 7.
The calculation rules of K p , K d and α are synthesized in Table 2, Table 3 and Table 4, respectively.

3.2.3. Extended Kalman Filter

The EKF is a variation of the Kalman filter, applied to nonlinear systems. The EKF linearizes the system over an average value, applying the Jacobian to obtain the state matrices A k , H k , W k and V k , where W k and V k are the Jacobians calculated with respect to the random variables w k and v k , respectively [14]. With these considerations, the equations that define the EKF are
x ¯ k = f ( x ^ k 1 , u k 1 , 0 ) P ¯ k = A k P k 1 A k T + W k Q k W k T K k = P ¯ k H k T ( H k P ¯ k H k T + R k ) 1 x ^ k = x ¯ k + K k ( z k H k x ¯ k ) P k = ( I K k H k ) P ¯ k
To design the EKF, it is necessary to describe the process as a linear system, as follows:
x ˙ = Ax + Bu y = Cx + Du
where x ˙ represents the derivative of x , u represents the control vector u 1 u 2 u 3 , x = h 1 h 2 T and y = x .
For the Jacobian linearization of the model, the equilibrium point of the system is established at an operating point. The balance points x e = h e 1 h e 2 T are obtained considering the control signals u e = u e 1 u e 2 u e 3 T . The relationships to obtain the equilibrium points are
h e 1 = 1 2 g q 0 u e 1 a 2 u e 2 2 h e 2 = h e 1 a 2 u e 2 a 3 u e 3 2
The result of the linearization is presented below:
A = a 2 A 1 g 2 u e 2 h e 1 0 a 2 A 2 g 2 u e 2 h e 1 a 3 A 2 g 2 u e 3 h e 2 B = q 0 A 1 a 2 A 1 2 g h e 1 0 0 a 2 A 2 2 g h e 1 a 3 A 2 2 g h e 2 C = 1 0 0 1 ; D = 0 0 0 0 0 0
The parameters Q , R and P k of the EKF are adjusted through recursive simulations in MATLAB, where P k = I R 2 × 2 and Q = 1 × 10 8 I . The R matrix setting considers two scenarios. The first scenario considers the transition during step-type reference changes, in which the correction component of the EKF is prioritized to track the measured signal. The value selected for this case is R = 1 × 10 8 I . The second scenario is presented when the tank levels enter a range of ± 5 % error with respect to their references (steady state); in this case, the EKF estimation component is prioritized, selecting R = 1 × 10 2 I . The EKF delivers the h ˜ 1 and h ˜ 2 estimations of tank levels as outputs. Equations (9) and (10) present the residues obtained from the comparison of the estimated and measured values.
r 1 = h 1 h ˜ 1
r 2 = h 2 h ˜ 2
Leak detection is performed by using thresholds. Experimentally, a threshold is determined as l i m = 0.010 . When the residue is smaller than this limit, the existence of a leakage is concluded. The data set that pertains to a leakage is
l e a k r = r = r 1 r 2 T | r r 1 r 2 < l i m

3.3. Supervision Level

The automation architecture proposed in this work involves the first three levels of the CIM model (see Figure 2). The PiXTend PLC works as a Modbus slave node and receives the information from every device in the network in order to upload selected data to an IoT platform (thinger.io) by using the open source Linux client library provided in [15]. As seen in Figure 2, the supervision level uses an IoT local server installed in a Raspberry Pi 3, which is connected to a local Wi-Fi router through an ethernet cable, meaning that only the devices connected to the network can access the data on the thinger.io local server by using the fixed IP address of the Raspberry Pi. This configuration warranties security by creating a virtual industrial network, where PLCs are connected in a different subnet from the SCADA platform, performing communication tasks among them via Modbus TCP, while the SCADA platform, running in a separate subnet, isolates the process controllers from external access to the network.

4. Results

4.1. Simulation Results

The control systems described in Section 3.2 are first simulated in MATLAB using the module for the solution of ordinary differential equations. To compare the performance of the proposed control schemes, the tracking performance index described by Equation (12) is used. This index represents the ability of the controller to track a reference. A lower value of this index represents a better performance of the controller [16].
J = k = 1 + h 1 ( k ) r 1 ( k ) 2 + h 2 ( k ) r 2 ( k ) 2
The simulation model is configured using the parameters described in Table 1, considering a sampling period ( T s ) of 500 ms and introducing measurement noise with power 1 × 10 7 . Simulation tests are performed with the purpose of evaluating the performance of the classic PID and fuzzy + PID control schemes before implementing them.
Table 5 shows the results of the overshoot and settling time obtained in simulation for the two control schemes. The FGS-PID reduces the settling time and overshoot in tank 2.
Table 6 shows the performance index (Equation (12)) of the control schemes for different tests. The first test stabilizes the tank levels at particular set points. The second test consists of making reference changes in the two tanks. The third test consists of simulating leaks in the tanks to evaluate the fault detection system. It can be seen that, in general, the use of the FGS-PID controller improves the overall system performance.
Figure 8 shows the simulation results of the control schemes in terms of stabilizing the system at a reference value. Figure 9 shows the residue obtained in the presence of leaks. The system detects leaks when the value of the residue is below a defined threshold l i m = 0.010 . When the system leak disappears, the residue increases its value and allows the identification of the fault-free operating state.

4.2. Experimental Results

Table 7 shows the results of the overshoot and settling time obtained in the experimental tests for the two control schemes. Figure 10 shows a screenshot of the local HMI of the process during operation, where the tank levels are registered. The FGS-PID reduces the settling time and overshoot in tank 2. Compared to simulation results (Table 5), the experimental results of the control system show similar performances. This fact is important because it demonstrates reliability in the design of the control schemes implemented in the low-cost PLCs. Additionally, these results demonstrate that there is moderate uncertainty in the dynamic model of the multi-tank system.
Figure 11 shows the behavior of the control signal for valve 2 when the two proposed control schemes are used. The first part of the signal, in blue (first half, left of the graphic capture), corresponds to the control signal generated by the FGS-PID algorithm, where some chattering is observed due to changes in the PID parameters. The second part of the signal, in blue (second half, right of the graphic capture), corresponds to the control signal generated by the PID controller; this signal has a smoothed behavior. The overall performance of the system, as shown in Table 7, is better with the fuzzy + PID scheme.
Figure 12 shows the behavior of the estimation in the presence of a leak in tank 1 when using the PID scheme. The residue signal, in red, reduces its value, allowing the leak to be detected when its value is below the threshold.
To evaluate the fault detection system, leaks are induced in tanks 1 and 2, as well as simultaneous leaks. Alarm activation and deactivation times are determined while the fault is present. These tests were repeated 10 times to obtain their average and 95% confidence interval. The confidence intervals of the alarm activation time are shown in Figure 13; the labels with * on the x-axis indicate the existence of simultaneous leaks in the two tanks. In the case of tank 2, the use of the FGS-PID controller considerably reduces the alarm activation time by 51.33%. On the other hand, in the case of tank 1, when there are simultaneous leaks, the use of the FGS-PID controller increases the alarm activation time by 27.93%. In the other cases, due to the overlap between the confidence intervals, the times are considered to be equal using the two control schemes proposed.

4.3. Supervision Level

The results related to the supervision level consist mainly of reports from the SCADA system running in the thinger.io local server IoT platform, which supports the integration of Arduino-compatible hardware, or Linux-powered devices such as the Raspberry Pi in this case. The platform has a web browser console with an easy-to-use front end in which users can manage the devices connected to the server and visualize information in real time. The thinger.io local server runs in a Raspberry Pi (see Figure 2). Using the local version of the thinger.io platform allows the user to have better control of the server, extended flexibility for customization and data storage.
The thinger.io platform allows the creation of real-time visualization dashboards and charts for remote monitoring. Figure 14 shows the dashboard of the multi-tank system, which shows important data of the system remotely by using a web browser pointing to the address of the Raspberry Pi. The platform supports notifications via email and also provides an Android or IOS mobile app that can be connected to a registered device in the server by scanning a QR barcode, displayed in the API explorer of the platform. The thinger.io Linux client library, written in C++, has been modified to accomplish the purpose of the proposed topology. A Modbus TCP C++ library [17] is added to the library’s core of the thinger.io; the implementation of threads inside the main program is needed to generate individual communication channels between PLCs connected to the local network configured as Modbus master devices allowing the PiXtend PLC to share data between control units. Modbus data resources are created inside the PiXtend PLC (coils, holding registers, etc.) and are linked to variables in the master devices; for this particular test, variables of sensors and actuators were defined in the main API. These sampled variables are mapped to the thinger.io library to allow data to be published in the API server explorer and dashboards. Figure 15 shows a waveform chart of the level corresponding to tank 2, which was queried from the local IoT server through the dashboard application.

5. System Limitations

Table 8 presents a comparison of the characteristics of the solution proposed in this work with a generic commercial solution. In this case, enhanced flexibility of the proposed system is highlighted in terms of the use of programming languages and the control algorithms implemented. Additionally, it should be noted that the commercial solution typically uses controllers from a single manufacturer, and the inclusion of equipment from other manufacturers increases the cost of the system due to the acquisition of programming licenses and communication drivers, meaning that the heterogeneity in this system is not guaranteed. On the other hand, the robustness of the system proposed in this work should still be studied in long-term operations and in more aggressive industrial conditions (dust, noise, etc.).
In addition to the advantages/disadvantages analyzed in Table 8, it is important to remark that the current development of this project still has a low technology readiness level (TRL). Current evaluation of the technology proposed throughout this paper corresponds to a TRL 4, which means the stage of verification in a representative laboratory [18]. Reaching a higher TRL implies further research and development (R&D) in order to achieve technological transfer in an effective way to industries with requirements to be fulfilled by the solutions proposed in this paper. In [18], a thorough methodology is offered for achieving technological transfer through a process which implies a technological maturity level (TRL 7).

6. Conclusions

The main conclusions from this research work are listed below.
  • Interoperability between devices from manufacturing processes is an essential requirement which still needs to be fulfilled. Among the alternatives available to meet this requirement, this paper adopts a simple—yet robust—IIoT solution that is compatible with control devices in a plant process by using low-cost embedded platforms and open software. Additionally, a virtual interconnection of the control level with the supervisory level was evaluated, with satisfying results, through the use of the thinger.io IIoT platform.
  • The automation devices used in the proposed architecture, the PLCs PiXtend and M-Duino, are low-cost devices with higher capacities in terms of the processing speed, memory and read speed of input ports compared to classic automation devices of equal commercial value. Therefore, they are useful devices to enhance control, communication and automation systems of small and medium-sized production processes, such as the case study presented in this article.
  • This work also evaluates two control schemes with fault detection capabilities: a classic PID control scheme for the three valves of the process, which regulates the inflow and outflow of the multi-tank system, and another control approach based on an FGS-PID algorithm, which regulates the opening of valve 2 that limits the outflow of the first reserve tank. The two schemes showed good performance; however, the scheme implementing the FGS-PID controller reduced the overshoot of tank 2 by 45.71% and the settling time by 12.76%. Fault detection and diagnosis was implemented successfully, using an EKF, in the PiXtend PLC.

Author Contributions

Conceptualization, L.I.M.; data curation, J.P. and P.M.-Q.; formal analysis, L.I.M.; funding acquisition, J.R.; investigation, J.P., J.P.-Q., and L.I.M.; methodology, L.I.M. and J.P.; project administration, J.R.; resources, J.R. and P.M.-Q.; software, J.P.; supervision, L.I.M.; visualization, J.P. and L.I.M.; writing, original draft, L.I.M. and P.M.-Q.; writing, review and editing, L.I.M. All authors have read and agreed to the published version of the manuscript.

Funding

The authors acknowledge funding from the research direction of Universidad Catolica de Cuenca through the project “Low cost advanced automation through equipment overhauling in classic industrial environments”

Acknowledgments

The authors acknowledge funding from the Research Direction of Universidad Católica de Cuenca through the project “Low-cost device for expanding automation capabilities in traditional automation equipment”. L.I.M. appreciates support from Tecnológico de Monterrey and Universidad Católica de Cuenca. J.P., P.M.Q. and J.R.C are grateful for the support received from Universidad Católica de Cuenca.

Conflicts of Interest

The authors declare no conflict of interest.

References

  1. Obermeier, M.; Braun, S.; Vogel-Heuser, B. A Model-Driven Approach on Object-Oriented PLC Programming for Manufacturing Systems with Regard to Usability. IEEE Trans. Ind. Inform. 2015, 11, 790–800. [Google Scholar] [CrossRef]
  2. Gilchrist, A. Industry 4.0: The Industrial Internet of Things; Apress: New York, NY, USA, 2016. [Google Scholar]
  3. Suresh, N.; Balaji, E.; Anto, K.J.; Jenith, J. Raspberry Pi Based Liquid Flow Monitoring And Control. Int. J. Res. Eng. Technol. 2014, 3, 122–125. [Google Scholar]
  4. Pinzón, J.E.S. Diseño e Implementación de Sistemas SCADA para Automatismos, Basados en Hardware y Software Libre. Ph.D. Thesis, Universidad Tecnológica de Pereira, Risaralda, Colombia, 2015. [Google Scholar]
  5. Kadera, P.; Novák, P. Performance modeling extension of directory facilitator for enhancing communication in FIPA-compliant multiagent systems. IEEE Trans. Ind. Inform. 2017, 13, 688–695. [Google Scholar] [CrossRef]
  6. Hoffmann, M.; Thomas, P.; Schütz, D.; Vogel-Heuser, B.; Meisen, T.; Jeschke, S. Semantic integration of multi-agent systems using an OPC UA information modeling approach. In Proceedings of the 2016 IEEE 14th International Conference on Industrial Informatics (INDIN), Poitiers, France, 19–21 July 2016; pp. 744–747. [Google Scholar]
  7. Sauter, T.; Lobashov, M. How to access factory floor information using internet technologies and gateways. IEEE Trans. Ind. Inform. 2011, 7, 699–712. [Google Scholar] [CrossRef]
  8. Minchala, L.I.; Ochoa, S.; Velecela, E.; Astudillo, D.F.; Gonzalez, J. An open source SCADA system to implement advanced computer integrated manufacturing. IEEE Lat. Am. Trans. 2016, 14, 4657–4662. [Google Scholar] [CrossRef]
  9. Merchán, D.F.; Peralta, J.A.; Vazquez-Rodas, A.; Minchala, L.I.; Astudillo-Salinas, D. Open Source SCADA System for Advanced Monitoring of Industrial Processes. In Proceedings of the 2017 International Conference on Information Systems and Computer Science (INCISCOS), Quito, Ecuador, 23–25 November 2017; pp. 160–165. [Google Scholar]
  10. Urbina, W.M.; Lazaro, J.; Astarloa, A.; Acosta Perez, T. CPPS Gateway-Implementation of Modbus and Profibus on a SoC programmable platform. IEEE Lat. Am. Trans. 2018, 16, 335–341. [Google Scholar] [CrossRef]
  11. Langmann, R.; Stiller, M. The PLC as a Smart Service in Industry 4.0 Production Systems. Appl. Sci. 2019, 9, 3815. [Google Scholar] [CrossRef] [Green Version]
  12. Rachidi, A.; Khatory, A.; Talbi, A. Toward an automation increasingly interconnecting. Int. J. Sci. Eng. Res. 2014, 5, 96–101. [Google Scholar]
  13. Zhao, Z.Y.; Tomizuka, M.; Isaka, S. Fuzzy gain scheduling of PID controllers. IEEE Trans. Syst. Man Cybern. 1993, 23, 1392–1398. [Google Scholar] [CrossRef] [Green Version]
  14. Kai, X.; Wei, C.; Liu, L. Robust Extended Kalman Filtering for Nonlinear Systems With Stochastic Uncertainties. IEEE Trans. Syst. Man Cybern. Part A Syst. Hum. 2010, 40, 399–405. [Google Scholar] [CrossRef]
  15. Thinger.io. Open Source IoT Platform. 2017. Available online: https://github.com/thinger-io/Linux-Client (accessed on 25 June 2020).
  16. Minchala-Avila, L.I.; Palacio-Baus, K.; Ortiz, J.P.; Valladolid, J.D.; Ortega, J. Comparison of the performance and energy consumption index of model-based controllers. In Proceedings of the Ecuador Technical Chapters Meeting (ETCM), Guayaquil, Ecuador, 12–14 October 2016; pp. 1–6. [Google Scholar]
  17. Lyu, F. A C++ Library for Modbus TCP Protocol. 2018. Available online: https://github.com/fanzhe98/modbuspp (accessed on 25 June 2020).
  18. Sastoque Pinilla, L.; Llorente Rodríguez, R.; Toledo Gandarias, N.; López de Lacalle, L.N.; Ramezani Farokhad, M. TRLs 5–7 Advanced Manufacturing Centres, Practical Model to Boost Technology Transfer in Manufacturing. Sustainability 2019, 11, 4890. [Google Scholar] [CrossRef] [Green Version]
Figure 1. P&ID diagram of the multi-tank system.
Applsci 10 04696 g001
Figure 2. Automation system architecture.
Applsci 10 04696 g002
Figure 3. Proposed control system.
Applsci 10 04696 g003
Figure 4. Membership functions of e ( t ) .
Applsci 10 04696 g004
Figure 5. Membership functions of e ˙ ( t ) .
Applsci 10 04696 g005
Figure 6. Membership functions of K p and K d .
Applsci 10 04696 g006
Figure 7. Membership functions of α .
Applsci 10 04696 g007
Figure 8. Simulation results of the control systems.
Applsci 10 04696 g008
Figure 9. Residue simulation results to evaluate fault detection.
Applsci 10 04696 g009
Figure 10. Human to machine interface (HMI) screenshot.
Applsci 10 04696 g010
Figure 11. Control signal comparison for tank 2 when operating FGS-PID and PID control schemes.
Applsci 10 04696 g011
Figure 12. Fault detection on tank 1 during operation of the PID classic scheme.
Applsci 10 04696 g012
Figure 13. Confidence intervals for the activation time of the fault detection.
Applsci 10 04696 g013
Figure 14. Dashboard of the IoT application.
Applsci 10 04696 g014
Figure 15. Waveform chart of h 2 queried from the dashboard application.
Applsci 10 04696 g015
Table 1. Physical constants of the system.
ParameterValue
a 2 4.380 × 10 5 m 2
a 3 4.601 × 10 5 m 2
A 1 0.04 m 2
A 2 0.04 m 2
q 0 6.667 × 10 5 m 3 /s
g9.81 m/s 2
a l 1 3.1416 × 10 4 m 2
a l 2 3.1416 × 10 4 m 2
Table 2. Fuzzy rules for K p [13].
e ˙ ( k )
NBNMNSZOPSPMPB
NBBBBBBBB
NMSBBBBBS
NSSSBBBSS
e ( k ) ZOSSSBSSS
PSSSBBBSS
PMSBBBBBS
PBBBBBBBB
Table 3. Fuzzy rules for K d [13].
e ˙ ( k )
NBNMNSZOPSPMPB
NBSSSSSSS
NMBBSSSBB
NSBSBSBBB
e ( k ) ZOBBBBBBB
PSBBBSBBB
PMBBSSSBB
PBSSSSSSS
Table 4. Fuzzy rules for α [13].
e ˙ ( k )
NBNMNSZOPSPMPB
NB2222222
NM3322233
NS4332334
e ( k ) ZO5433345
PS4332334
PM3322233
PB2222222
Table 5. Simulation results of the controllers’ transient response.
ControlOvershootOvershootSettling
SchemeTank 1Tank 2Time
PID5.58%8.21%225 s
FGS-PID5.58%7.65%200 s
Table 6. Controller performance comparison during simulation.
Test AppliedPerformance Index (12)
PIDFGS-PID
Settling over a reference1.4301.425
Step reference changes1.5431.522
Leaks during the operation1.4511.436
Table 7. Experimental results of the controllers’ transient response.
ControlOvershootOvershootSettling
SchemeTank 1Tank 2Time
PID3%8.75%243 seg
FGS-PID3%4.75%212 seg
Table 8. General characteristics comparison between commercial supervisory control and data acquisition (SCADA) systems and the proposed approach.
CommercialProposed
SolutionSystem
Supervisory control system
Distributed control system
Fault detection systemNot warranted
Communications heterogeneityNot warrantedNot warranted
FlexibilityMediumHigh
Industry 4.0 scalabilityMediumHigh
RobustnessLow

