Visual Workflow Process Modeling and Simulation Approach Based on Non-Functional Properties of Resources


Abstract
Featured Application
Abstract
1. Introduction
2. Materials and Methods
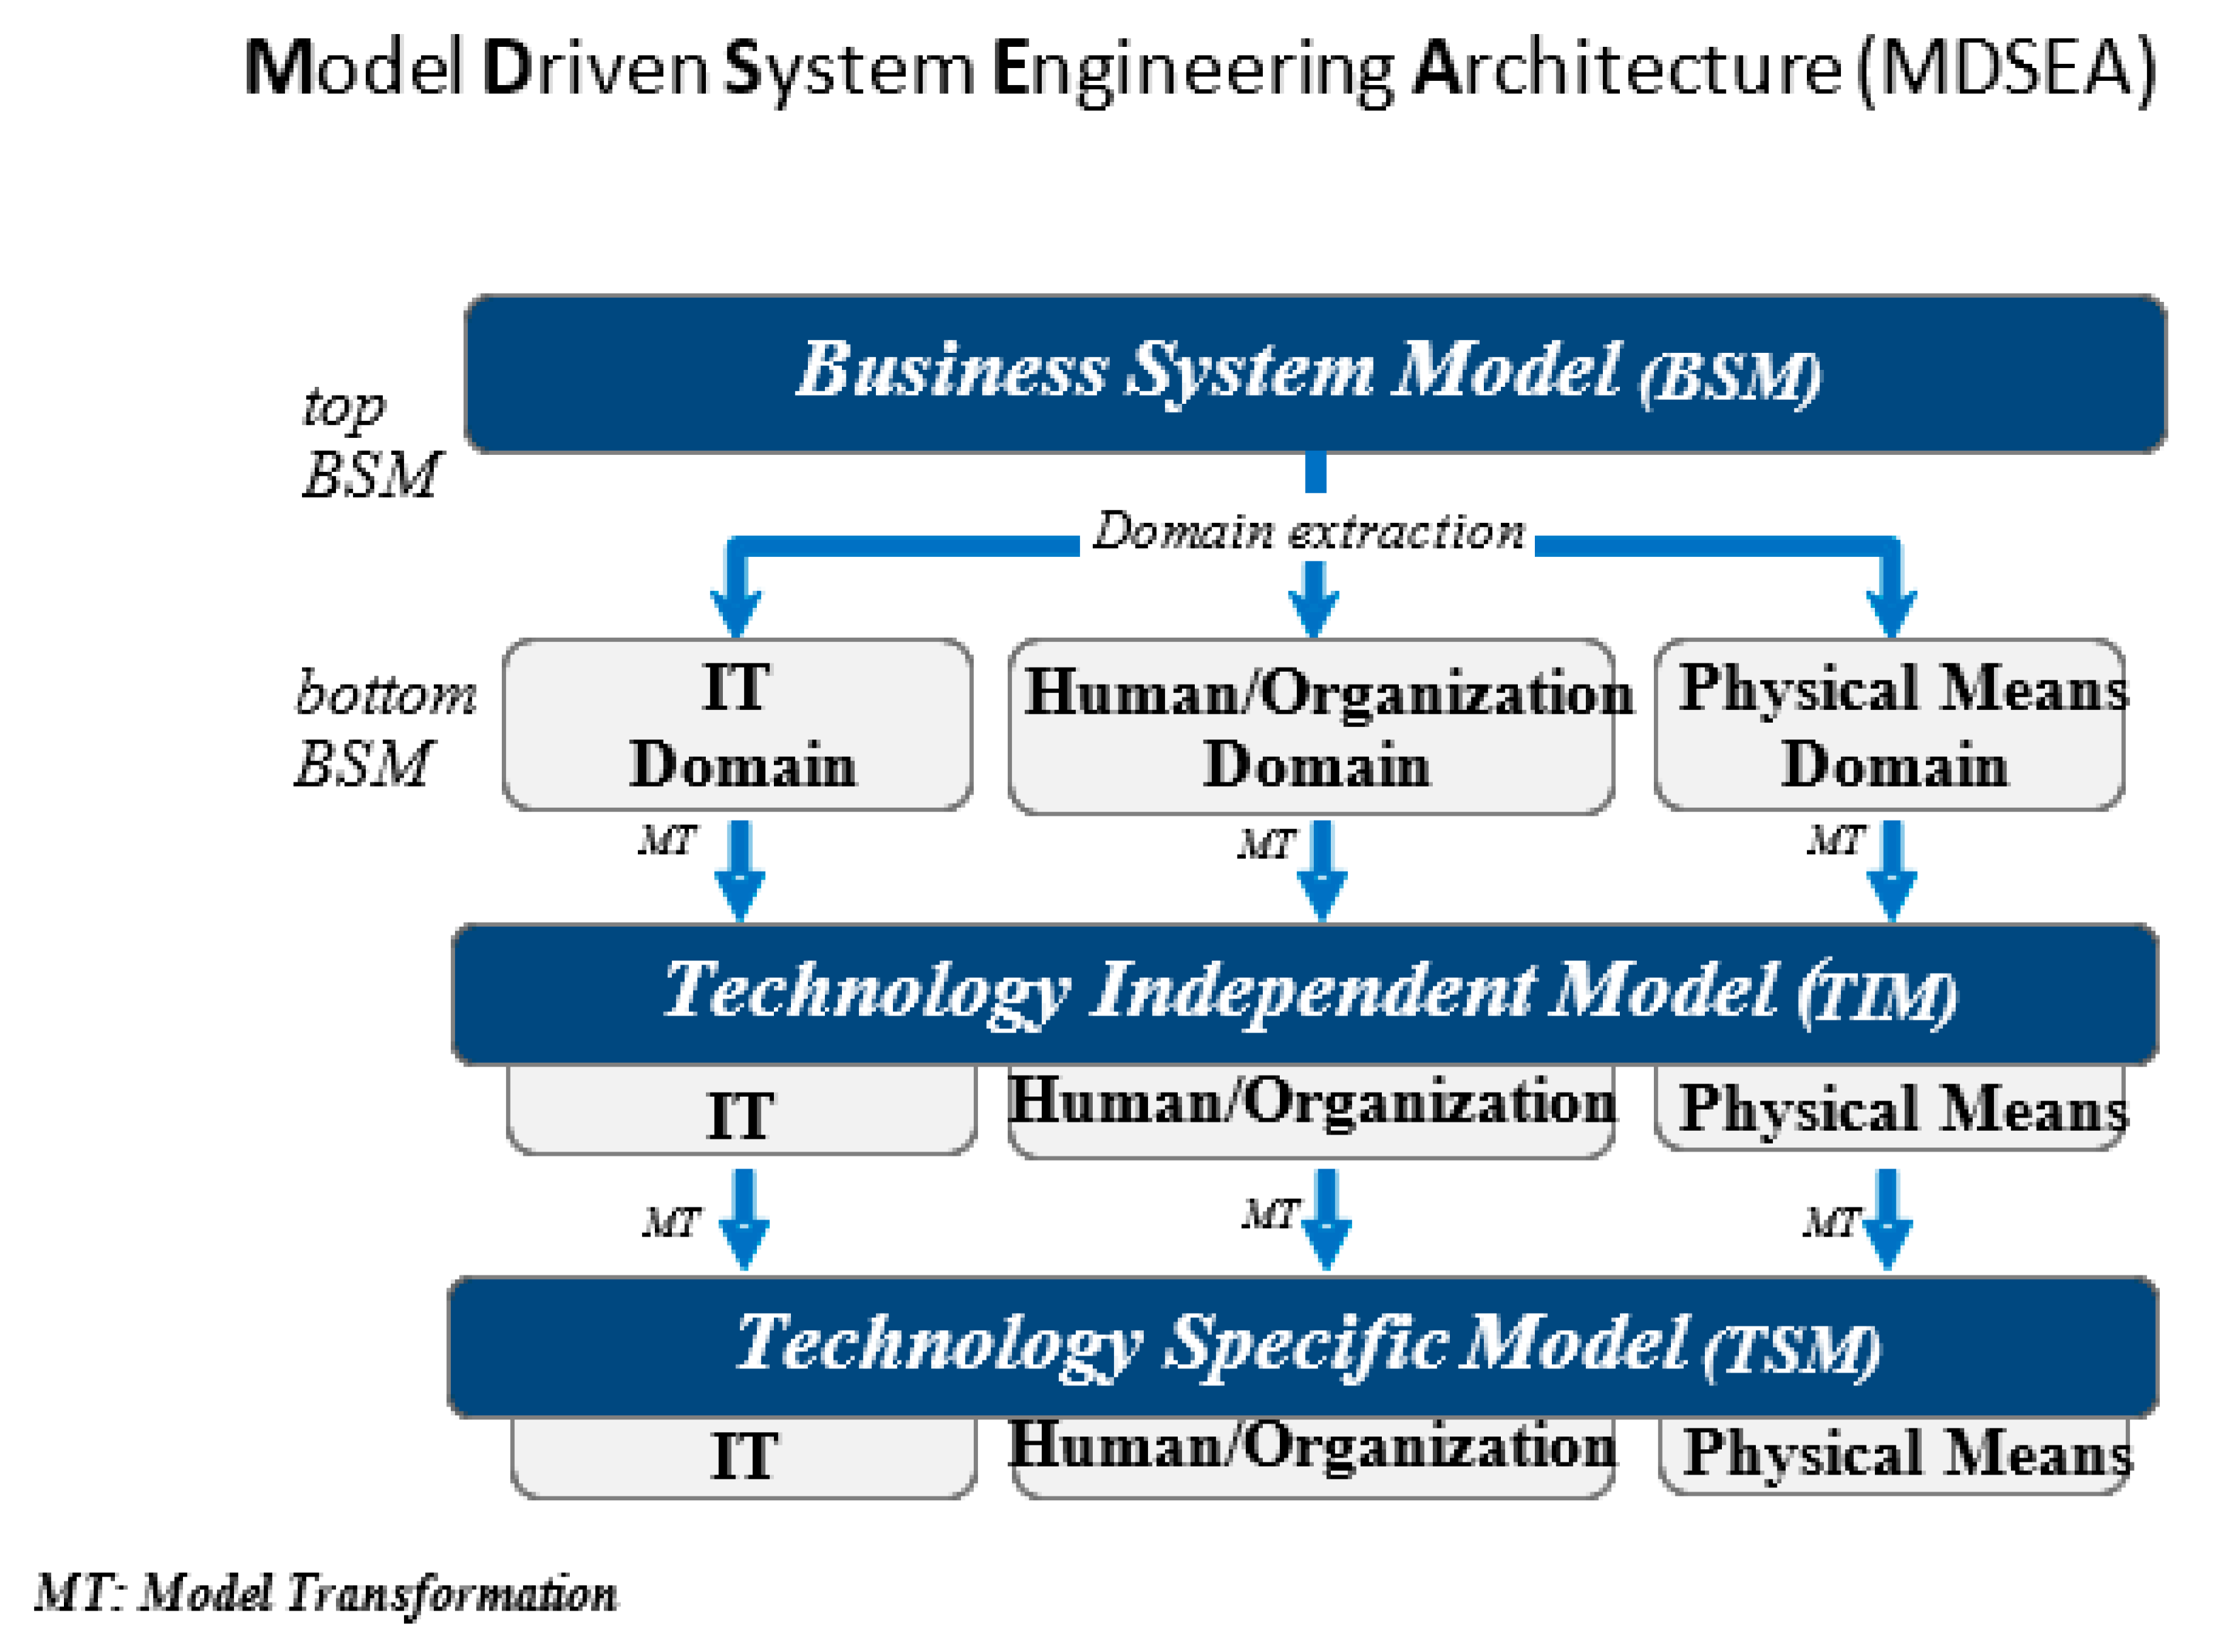
2.1. Model Driven Service Engineering Architecture
- Business system model (BSM): This top layer gives a general model of the system (top BSM). Leading down from this (bottom BSM) is the breakdown of the three resource domains, giving the details for each individually;
- «Technology-independent» model (TIM): This level focuses on describing the operational details of the system, including the three components, without detailing any implementation specificities;
- «Technology-specific» model (TSM): This level focuses on describing the specificities of each resource implementation.
2.2. Business Process Modeling Notation
2.3. eBPMN
- Merge modeling and simulation in the same step using a «model-driven» method to automatically build executable simulation code from BPMN;
- Guarantee the compatibility of the model by not modifying the BPMN metamodel and implementing eBPMN according to the BPMN execution semantics using token concepts;
- Allow non-functional simulation through process resources by using text annotation;
- Take into consideration composite resources;
- Handle non-predictable variables by using pseudo-random number generation and exponential distribution approximation.
2.4. Performance Aggregation
3. Results
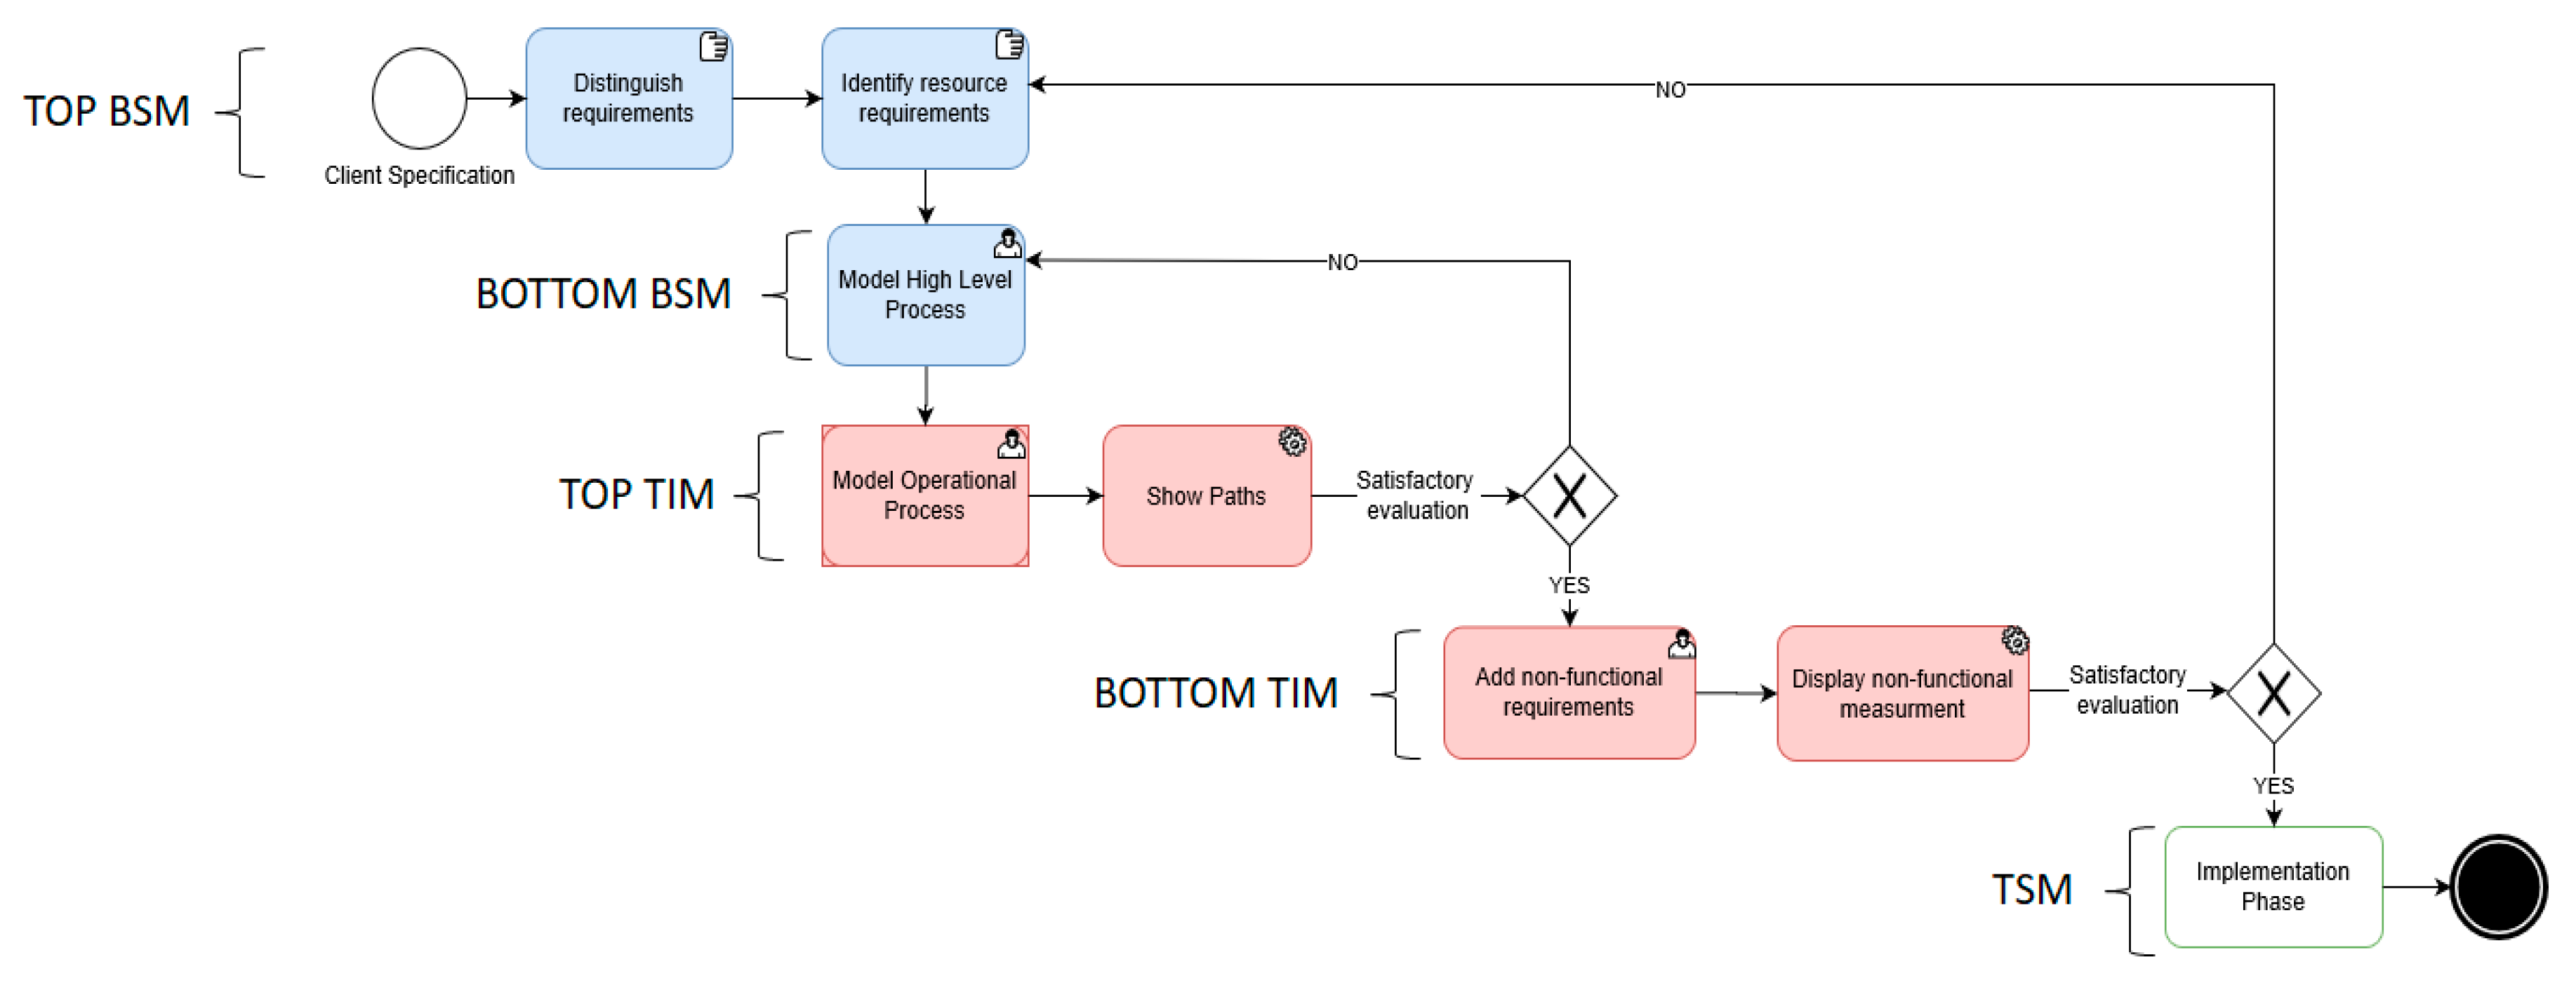
3.1. Methodology Description
- TOP BSM: This step aims to clarify conceptually with the client functional and non-functional requirements from the specification needs to provide a better understanding of the goals to be reached. This is followed by the identification of resource requirements to accomplish these objectives using grid evaluation, as explained in Section 3.2.1. The business analyst, as well as any other analysts (IT and other sectors) involved in the study system are included, as gathering information and reaching agreements are collaborative tasks.
- BOTTOM BSM: This step consists of modeling more formally the process at a high level of abstraction using the BPMN language. For this step, resource distinction is included by using only the task types provided by BPMN (user task, manual task, service task, etc.). This step does not require the presence of an IT analyst, since the technical implementation details are not discussed.
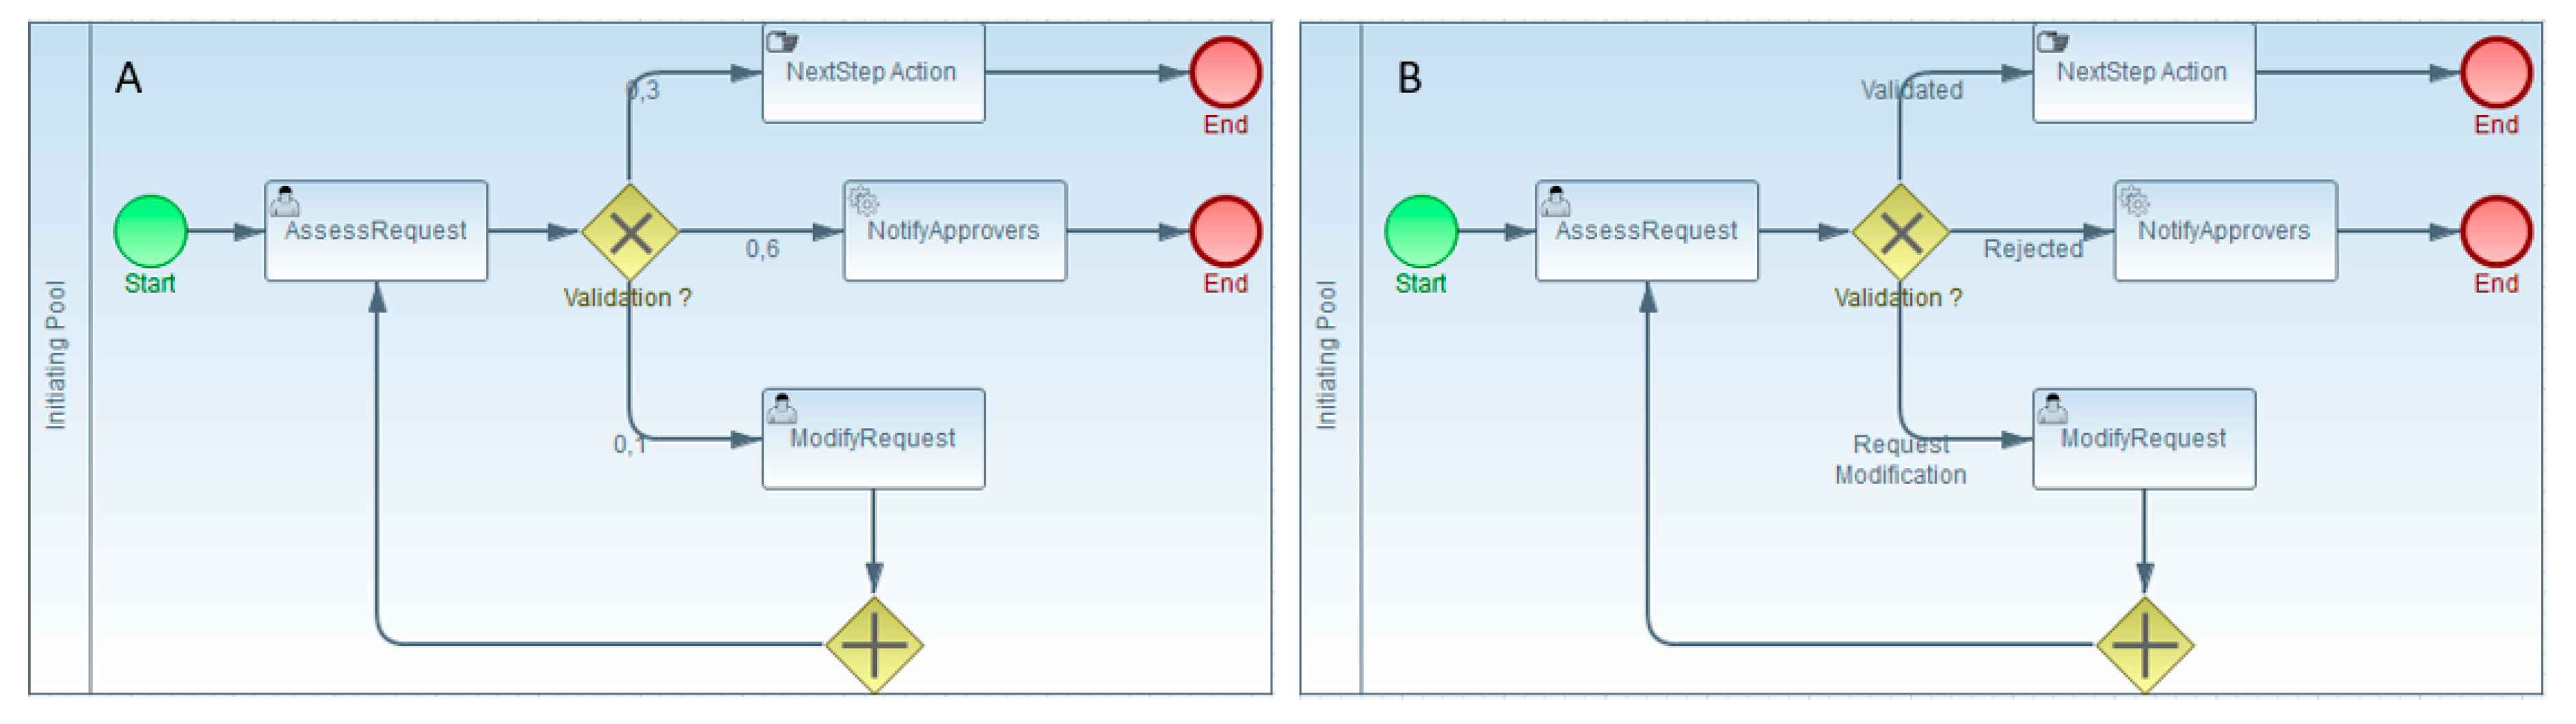
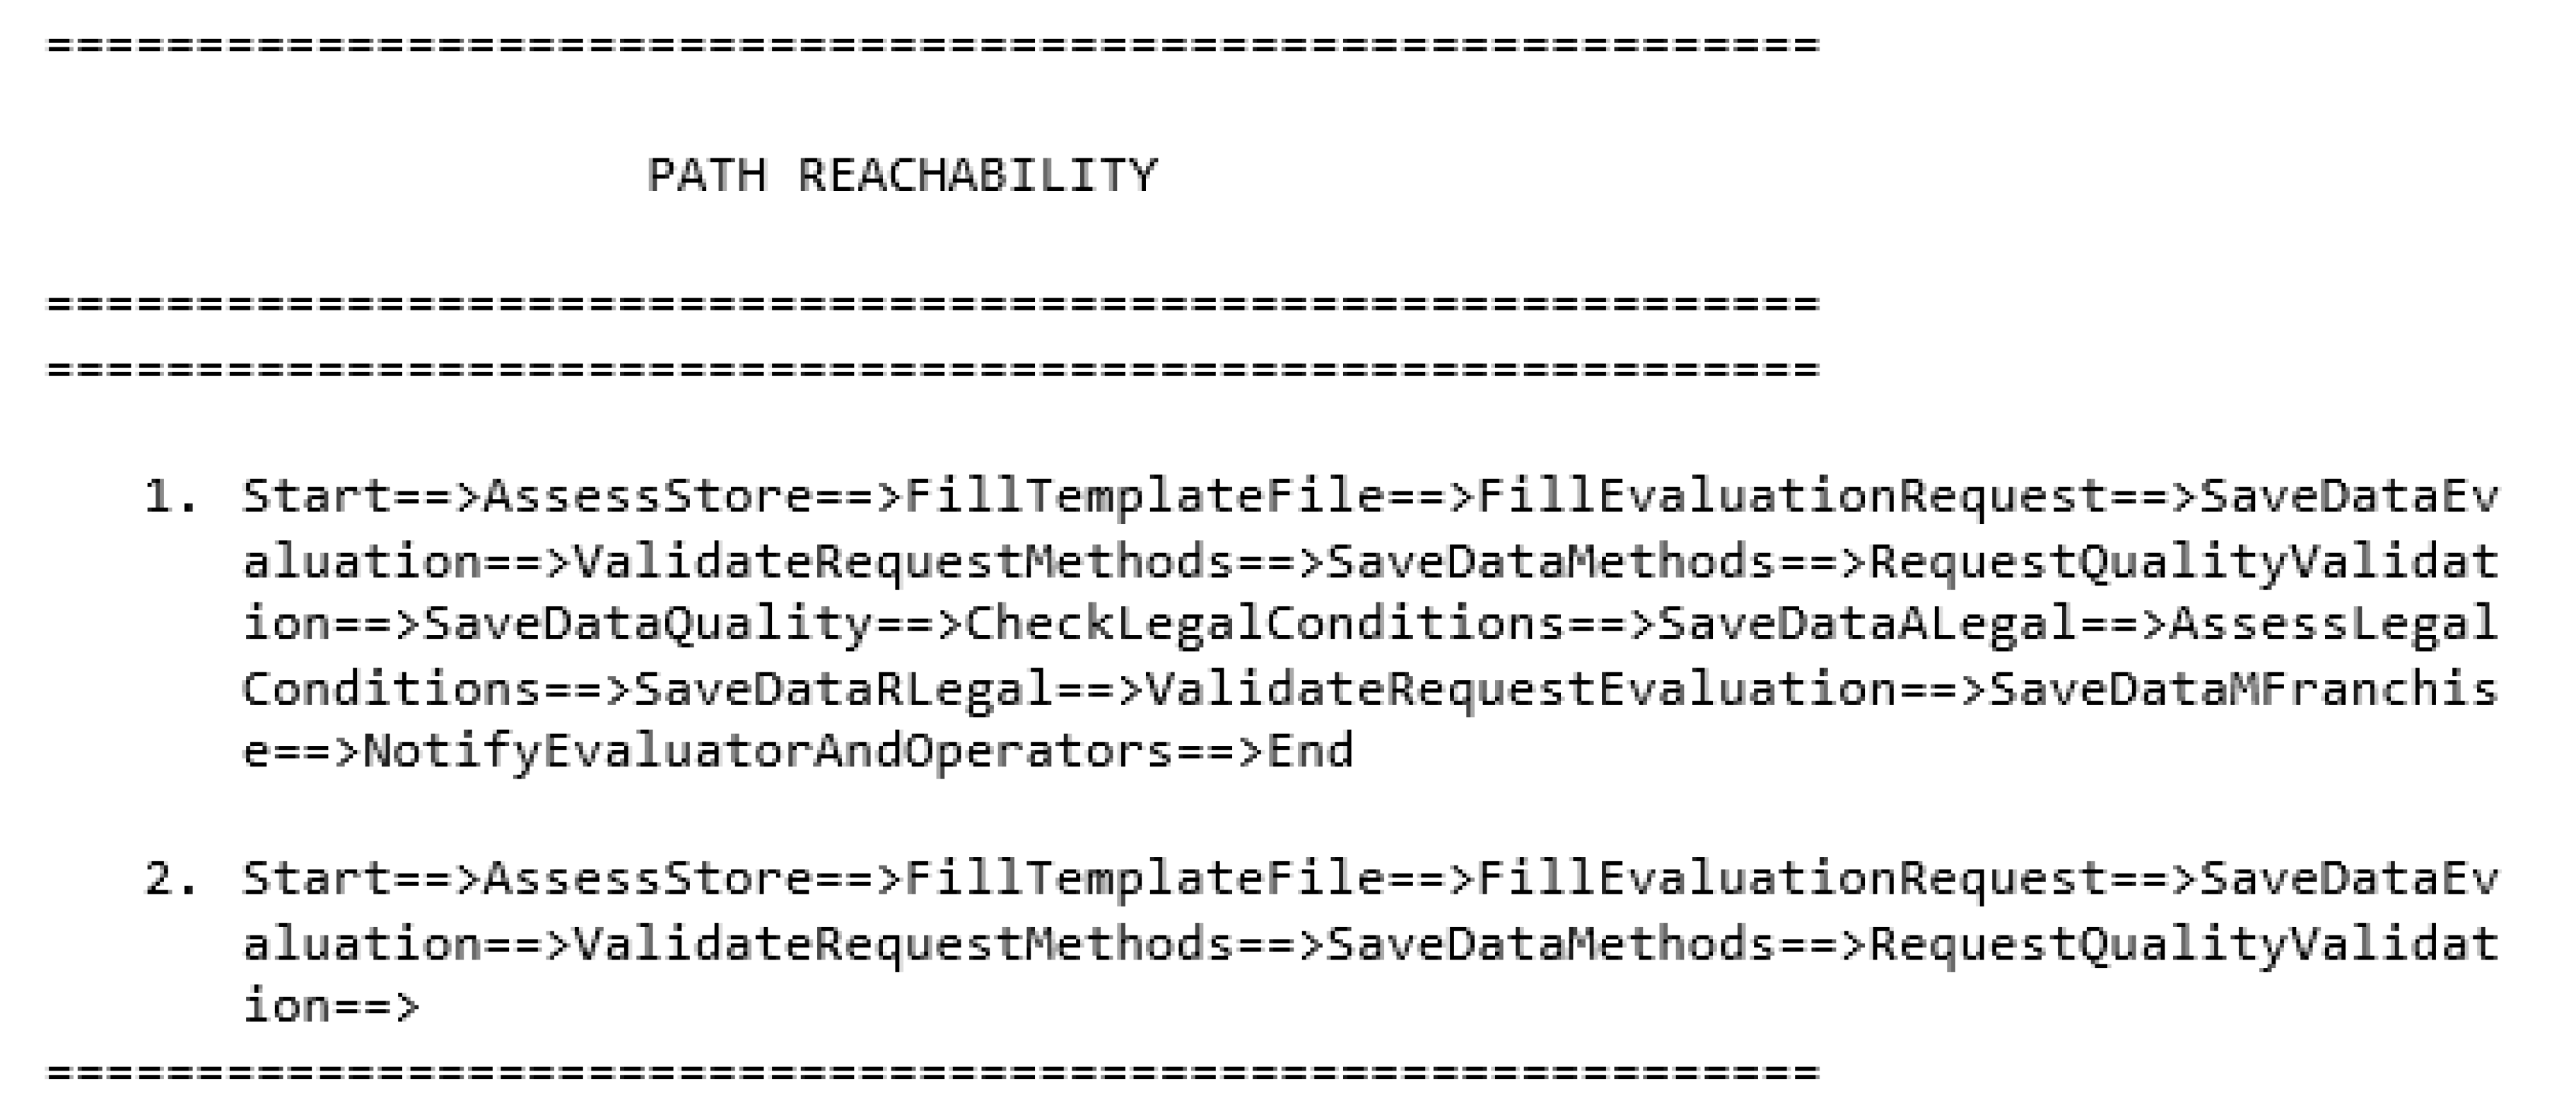
- TOP TIM: This step models detailed process operations using BPMN by describing operational details whilst hiding ones of any particular implementation. A path verification is then carried out by explicitly choosing one to check, or by assigning 50% probability to each process path to display them all. This mechanism is described in Section 3.5. If the desired paths are reachable and are compliant with the functional requirements, then the next step can be carried out. As with the BOTTOM BSM step, an IT analyst’s presence is not required. Before moving on to the next phase, it is important to verify that all the desired paths to be studied are reachable.
- BOTTOM TIM: This step consists of adding in details of the non-functional requirements of each type of resource using the grid evaluation filled in during the TOP BSM step. Each of these resources is assigned to the corresponding task. A simulation with eBPMN is then performed to display non-functional measurements for the chosen path. If the results are compliant with the non-functional goals to be reached, the implementation phase (TSM) can be carried out. At this step, it is recommended for all analysts to be present, especially when implementation scenario cases are simulated. Several simulation scenarios could be run and evaluated before finding the configuration that satisfies the requirement goals.
- TSM: This step describes in more detail how the implementation of a system uses a particular type of resource among those chosen at the BOTTOM TIM step. This step is also required to decide on the precautions to be taken in order to increase the reliability of the process as much as possible. All stakeholders are involved during this stage.
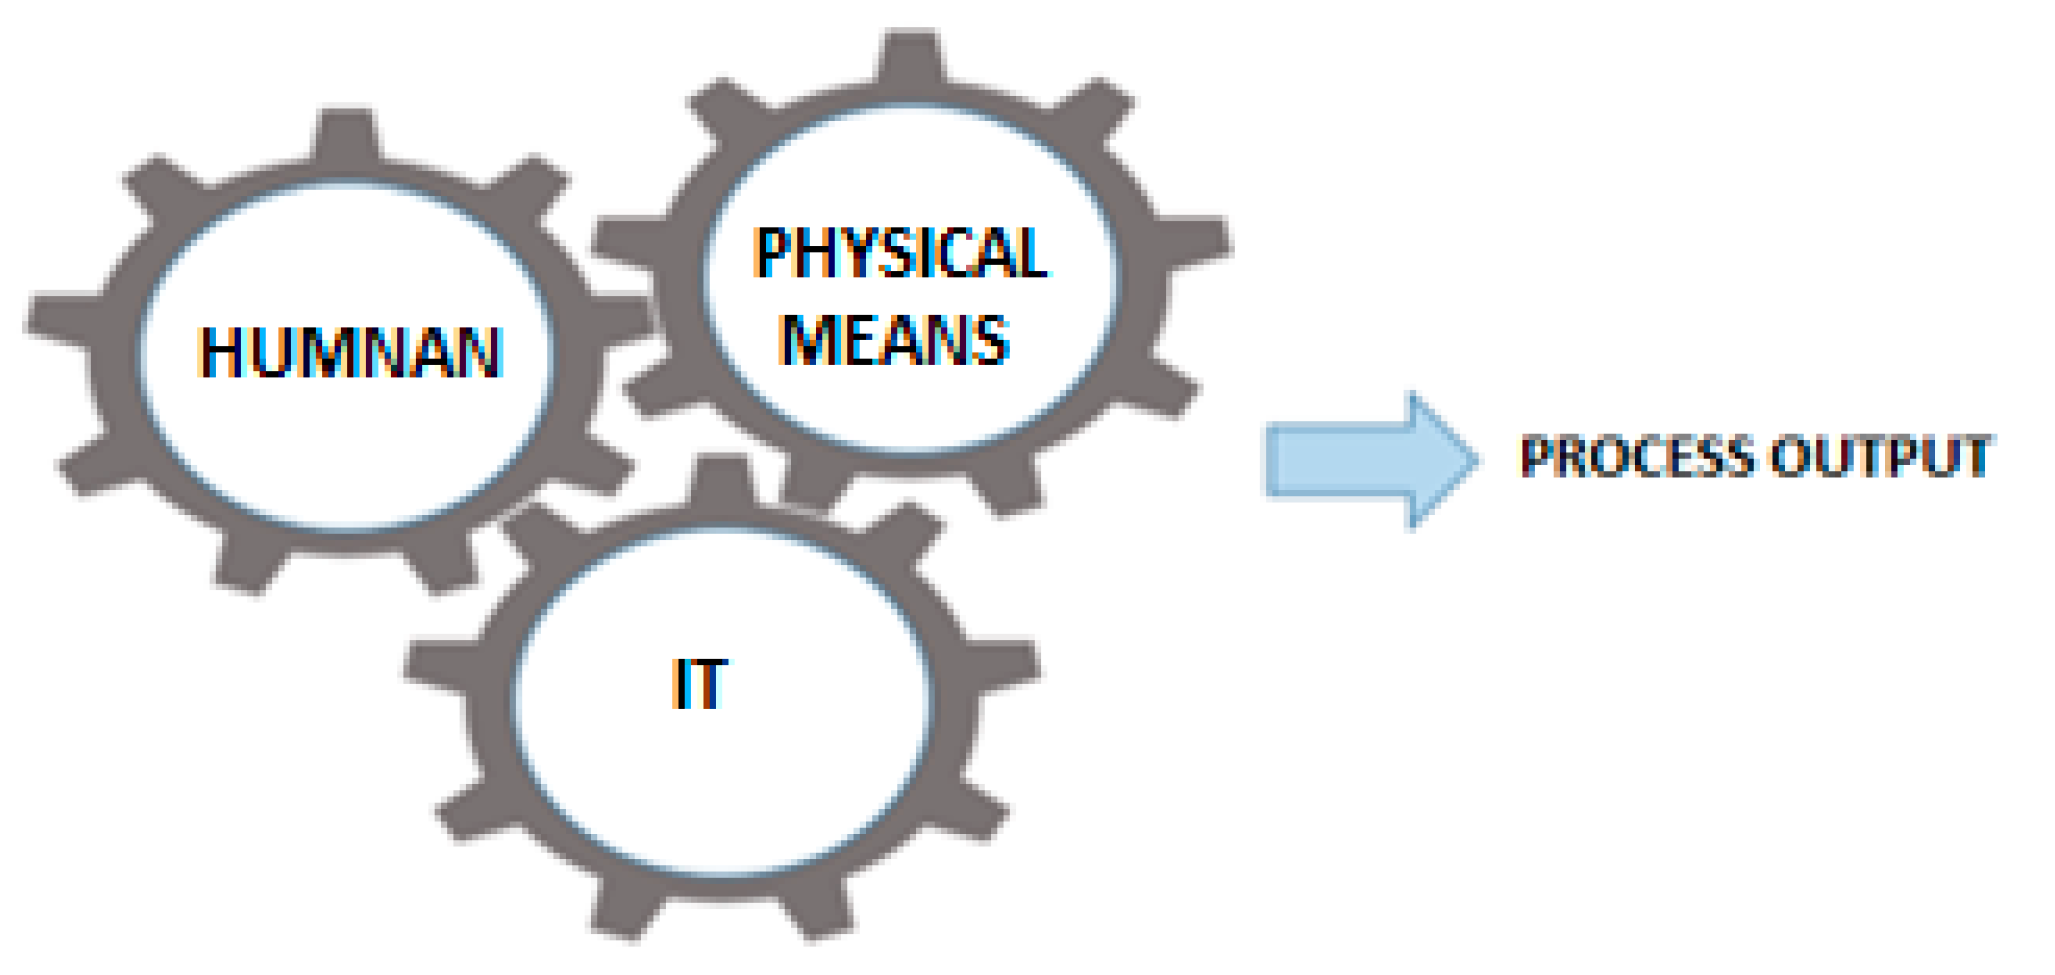
3.2. Distinguishing Resource Types
- Human resources or employees are individuals who work to fulfill their tasks according to their roles within a process. Human attributes can be perceived as constraints for the accomplishment of tasks. Their attributes can be defined as overloaded or underloaded, experienced or inexperienced, etc. Employees cannot be repaired or changed, they must adjust their own actions to specific or common constraints as explained in Reference [27]. Thus, human resources’ efficiency is not static and varies from time to time depending on the employees’ own attributes, their work behavior, etc. Alvaro Segura et al (2020) [28] proposed a conceptual framework showing how the application of different visual computing technologies can empower the human factor.
- Physical means resources are tangible items used in a process to carry out its activities. These include a wide range of specific goods and objects depending on the nature of the business, such as machines, robots, or any other physical device. The choice of their efficiency metrics depends on the type of business and on the goal to reach. Generally, the efficiency of physical resources is measured by performance, availability, reliability, etc. [29].
- Information technology (IT) resources are everywhere in the business field, and they are considered important enablers of business success and innovation. IT resources are the technological foundation that allows a company to provide real-time, accurate, and comprehensive information for communication. IT is about all the hardware, software, and infrastructure on which IT tools are built. The definition of adequate IT resources depends on the goal to be reached. For example, some focus on hardware performance aspects such as processor usage, while others focus on software performance such as number of licenses, and others focus on infrastructure performance. The metrics used are bit rate, transmission delay, availability, throughput, etc. [30].
3.2.1. Evaluation Grid
- Criterion: The criterion used to evaluate a resource. Each criterion can be divided into sub-criteria;
- Score: A score between 0 and 2 is given to each criterion, with 2 being the best score;
- Weight: The weight of a criterion is intended to capture its relative importance.
- Common measurement: we work with several business sectors, so we needed to choose a measurement that is common to all business activities, with the possibility of new ones being added at the client’s demand;
- Objective measurement: choosing a clearly defined and easily calculable criterion. Thereby, the stakeholders involved with filling in the grid will reach the same results because they are quantifiable in nature.
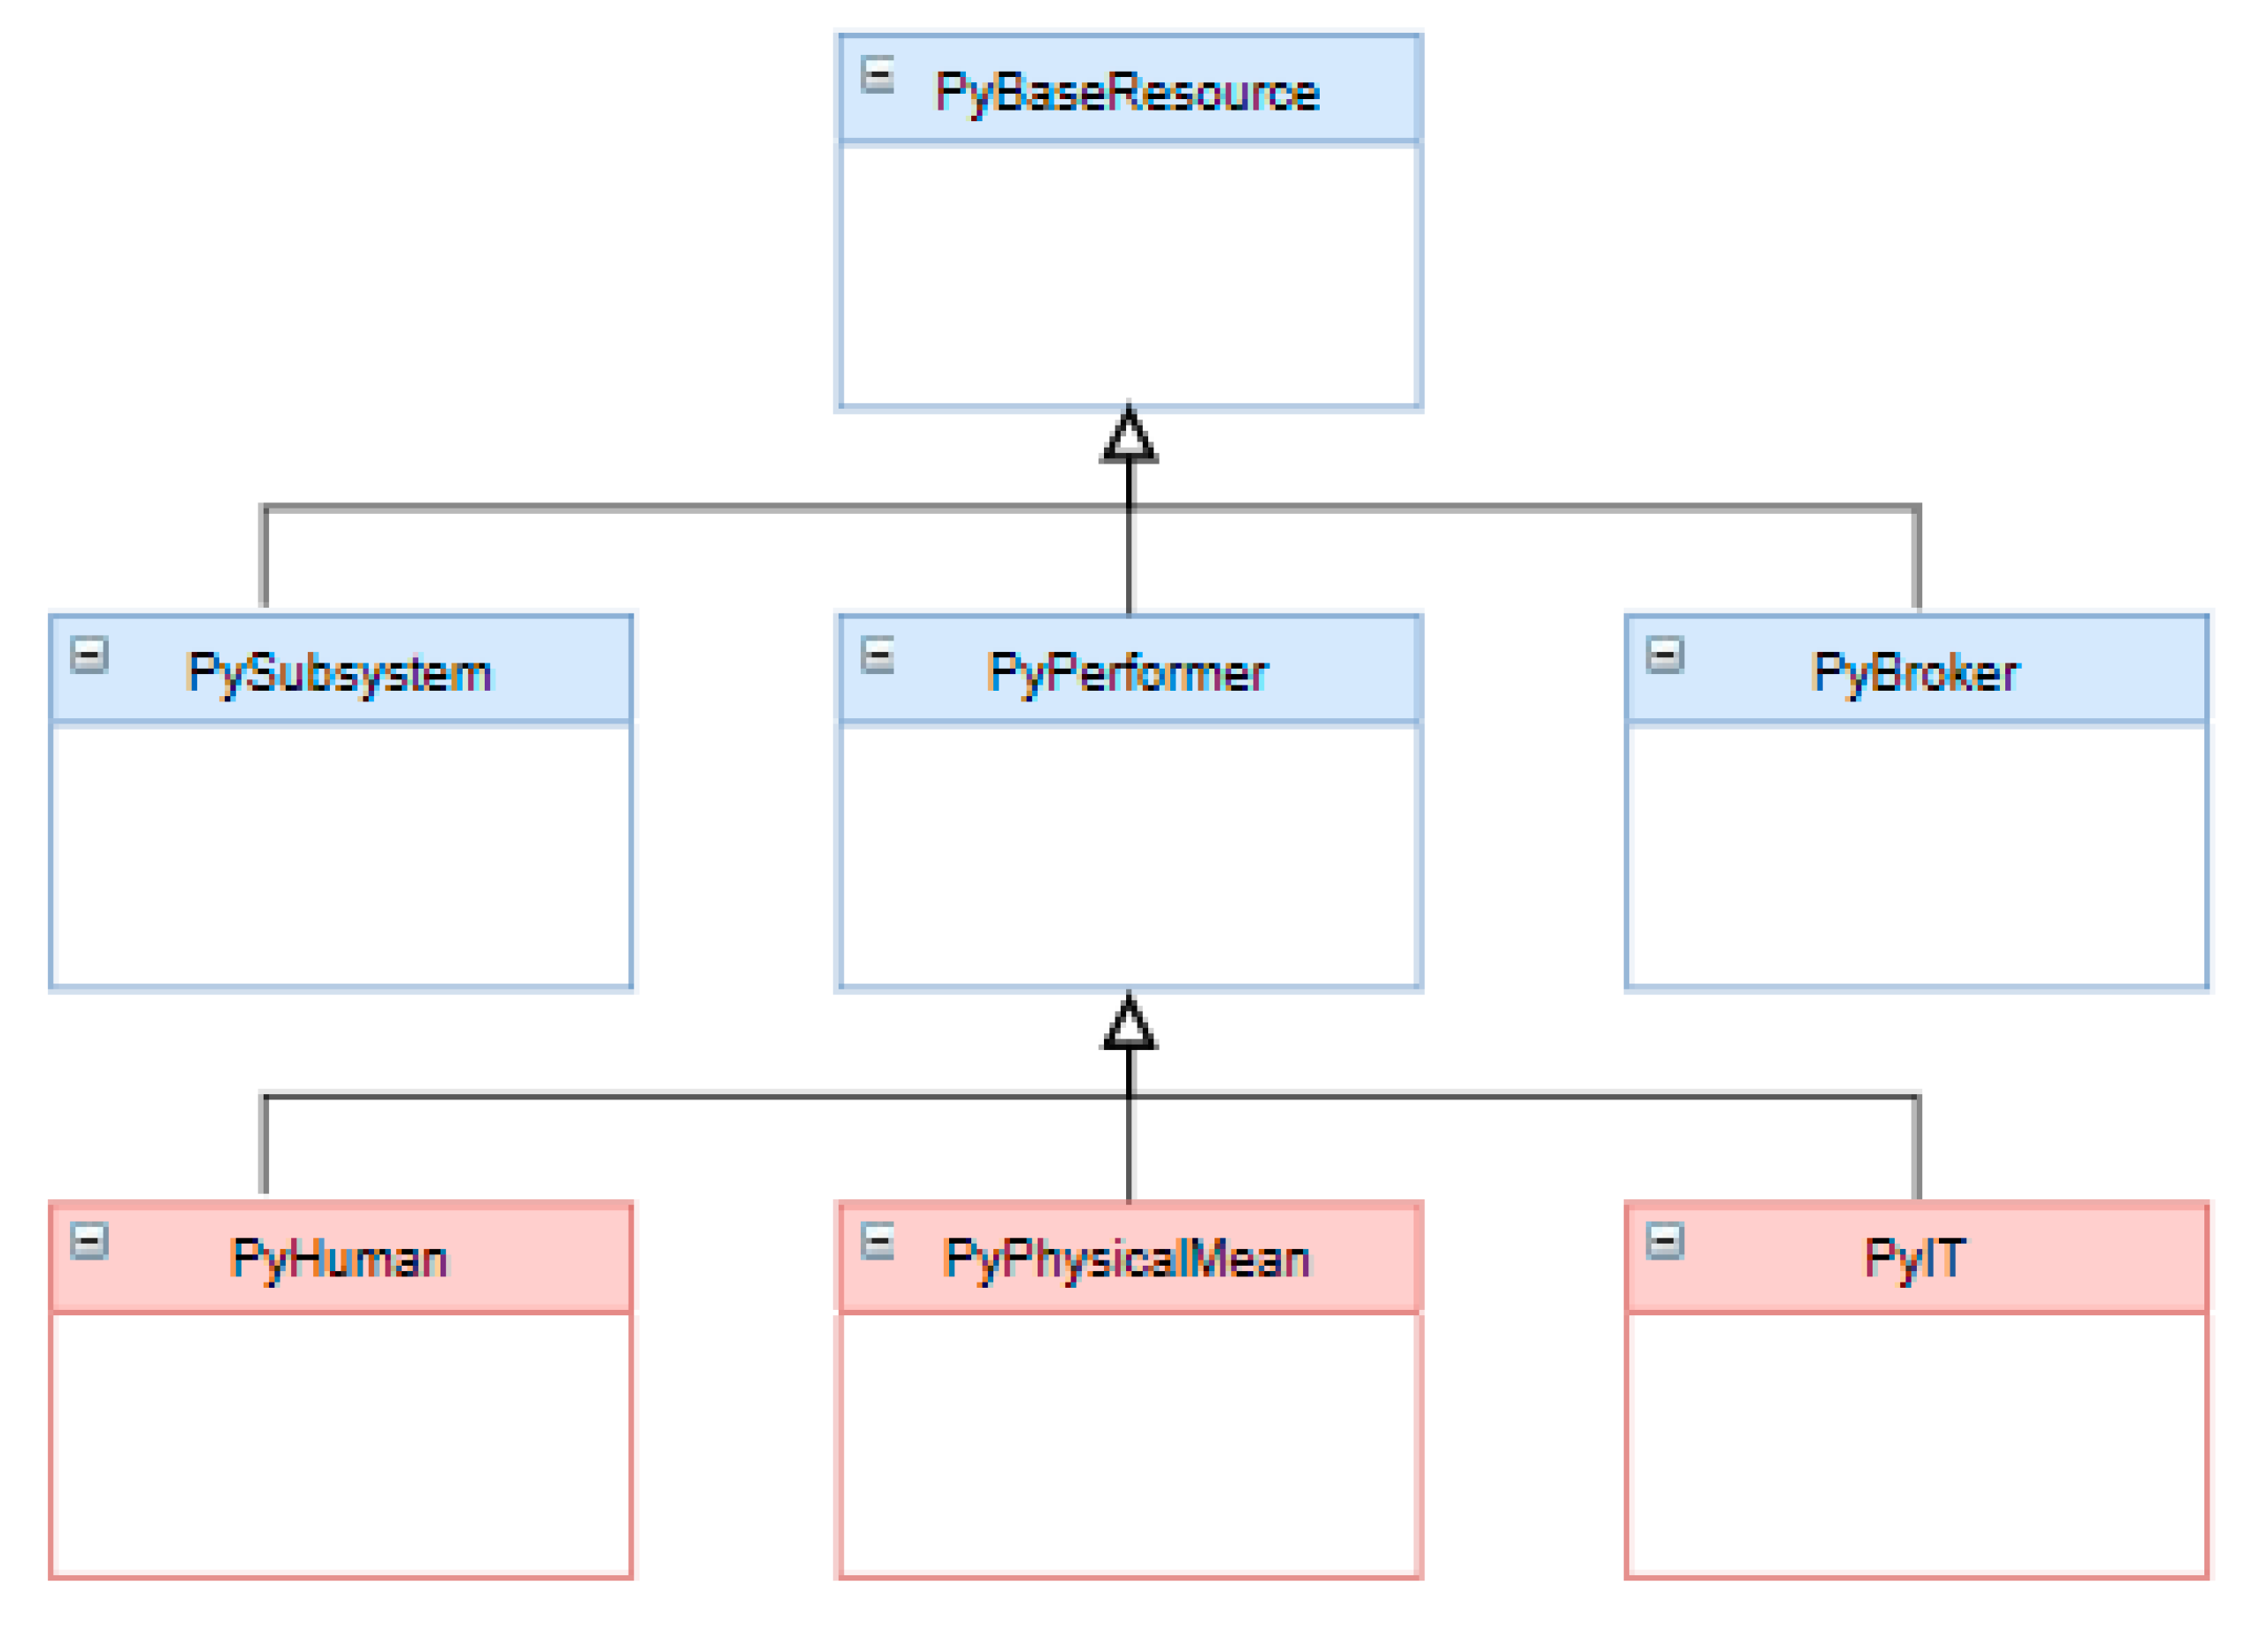
3.2.2. Extension of the PyBPMN Metamodel
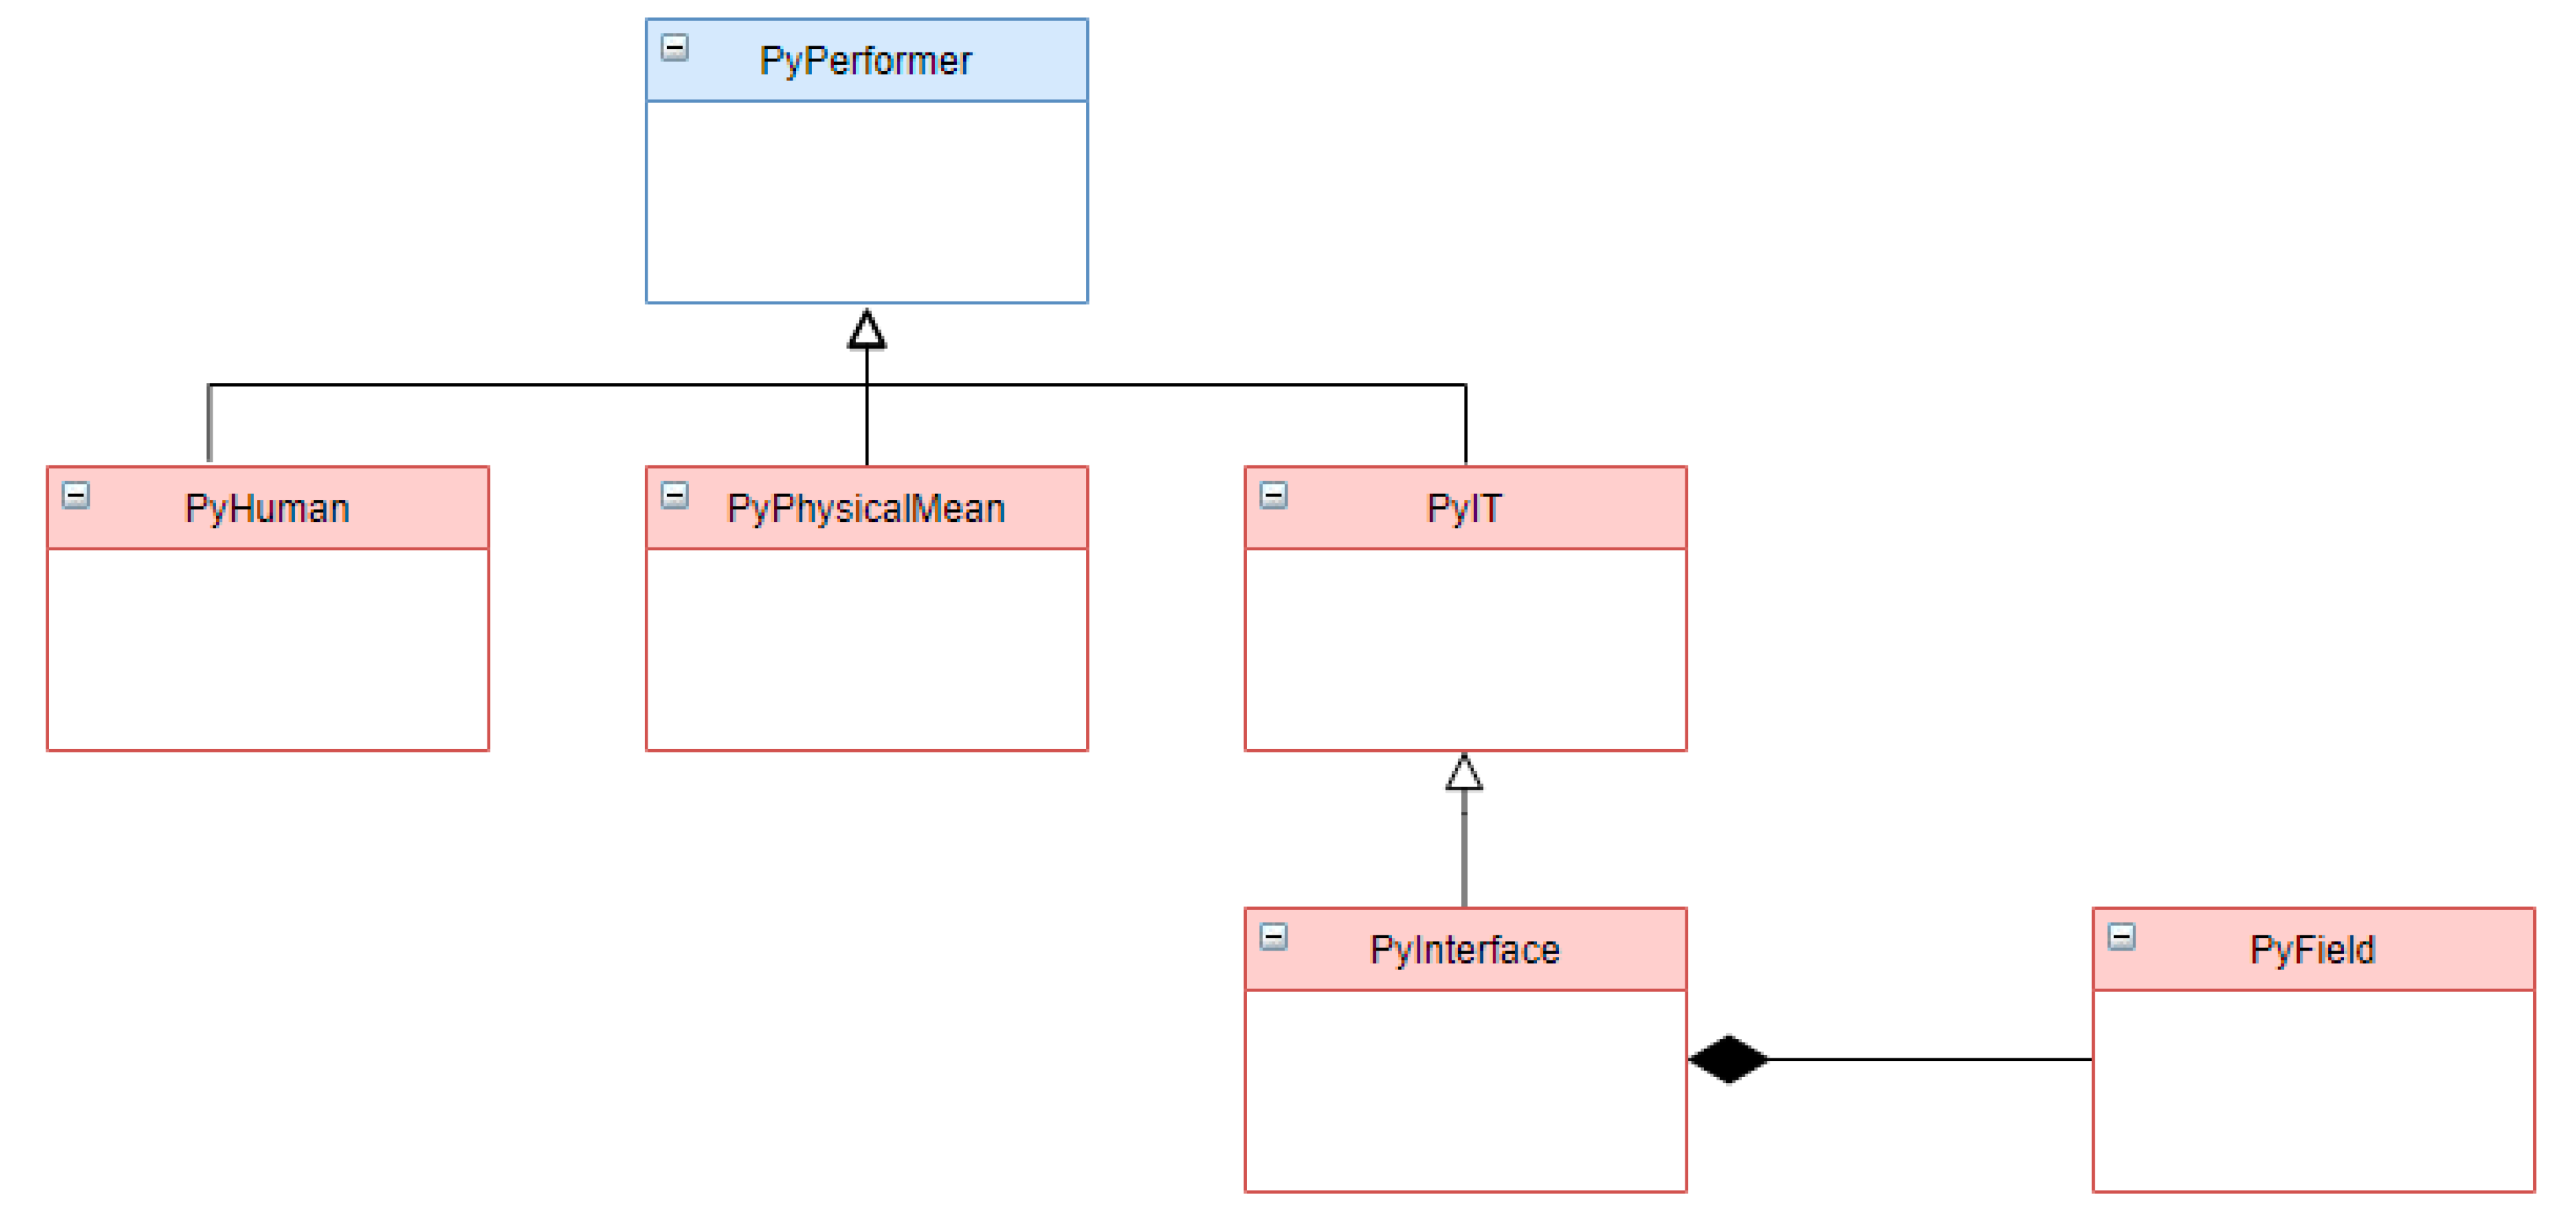
- The PyBaseResource class represents the resources and is specialized in PyPerformer, PySubSystem, and PyBroker;
- PyPerformer represents unique and atomic resources,
- PySubSystem represents composite resources, groups of resources required to carry out a task,
- PyBroker represents groups of alternative resources that could carry out a task,
3.2.3. eBPMN Extension Usage
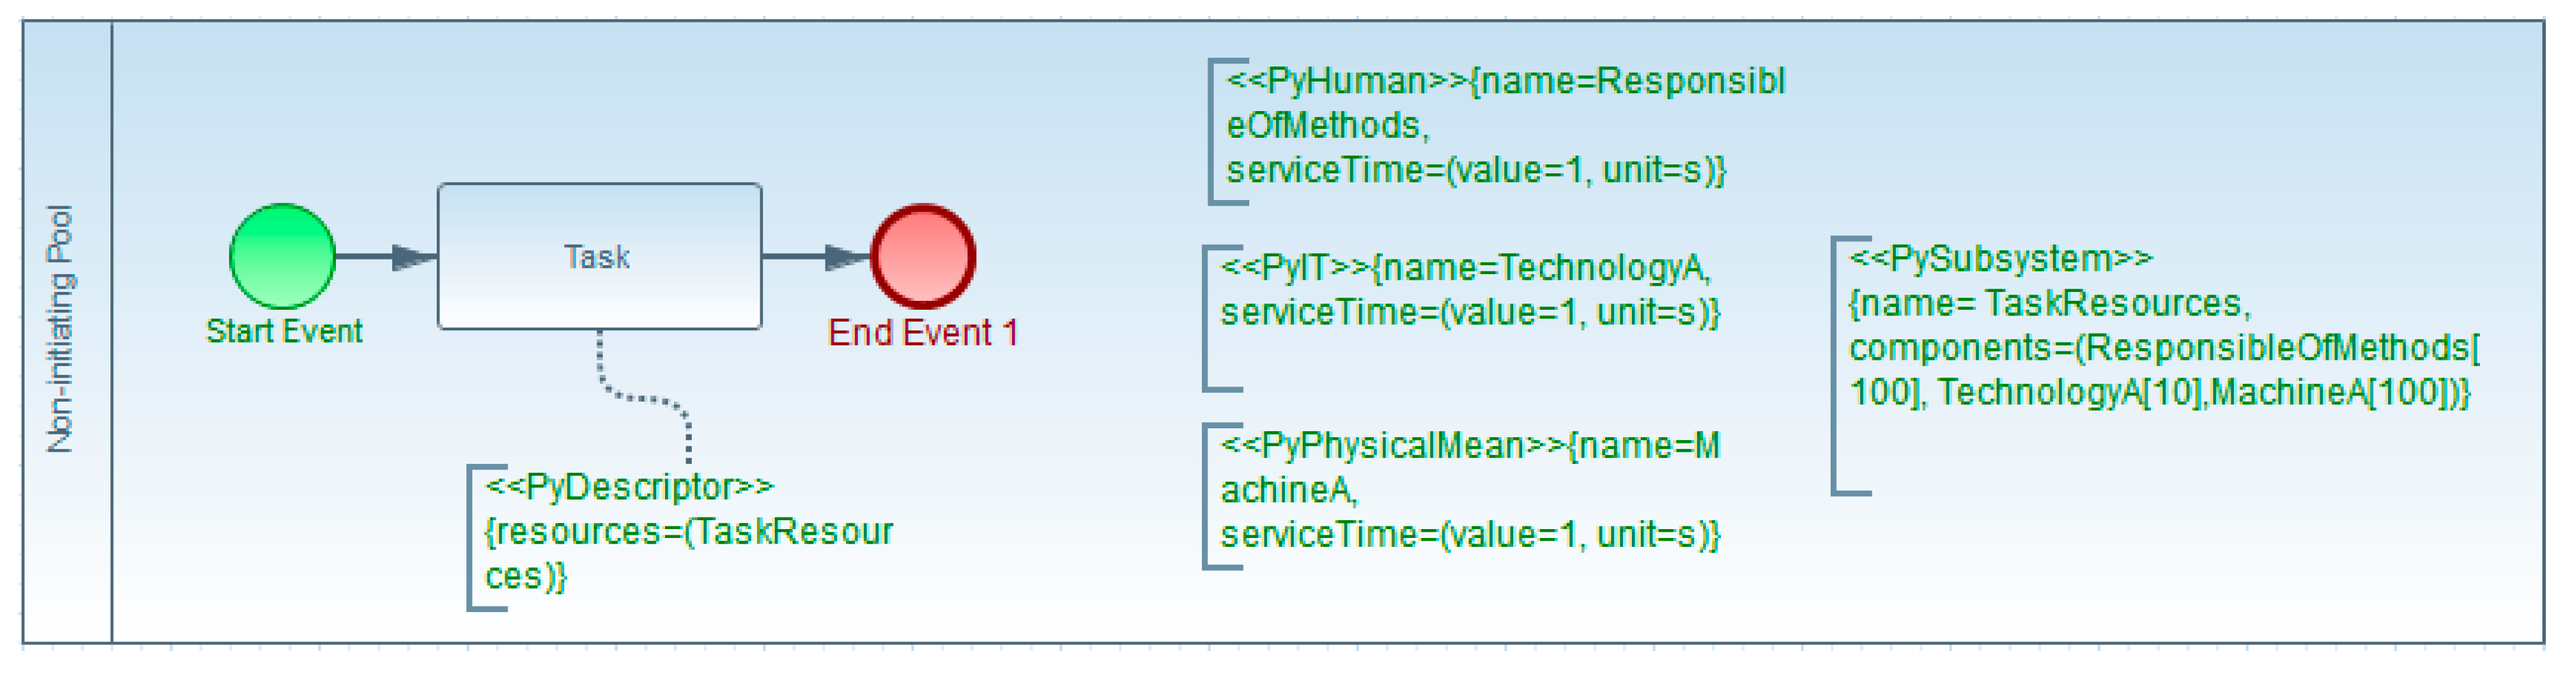
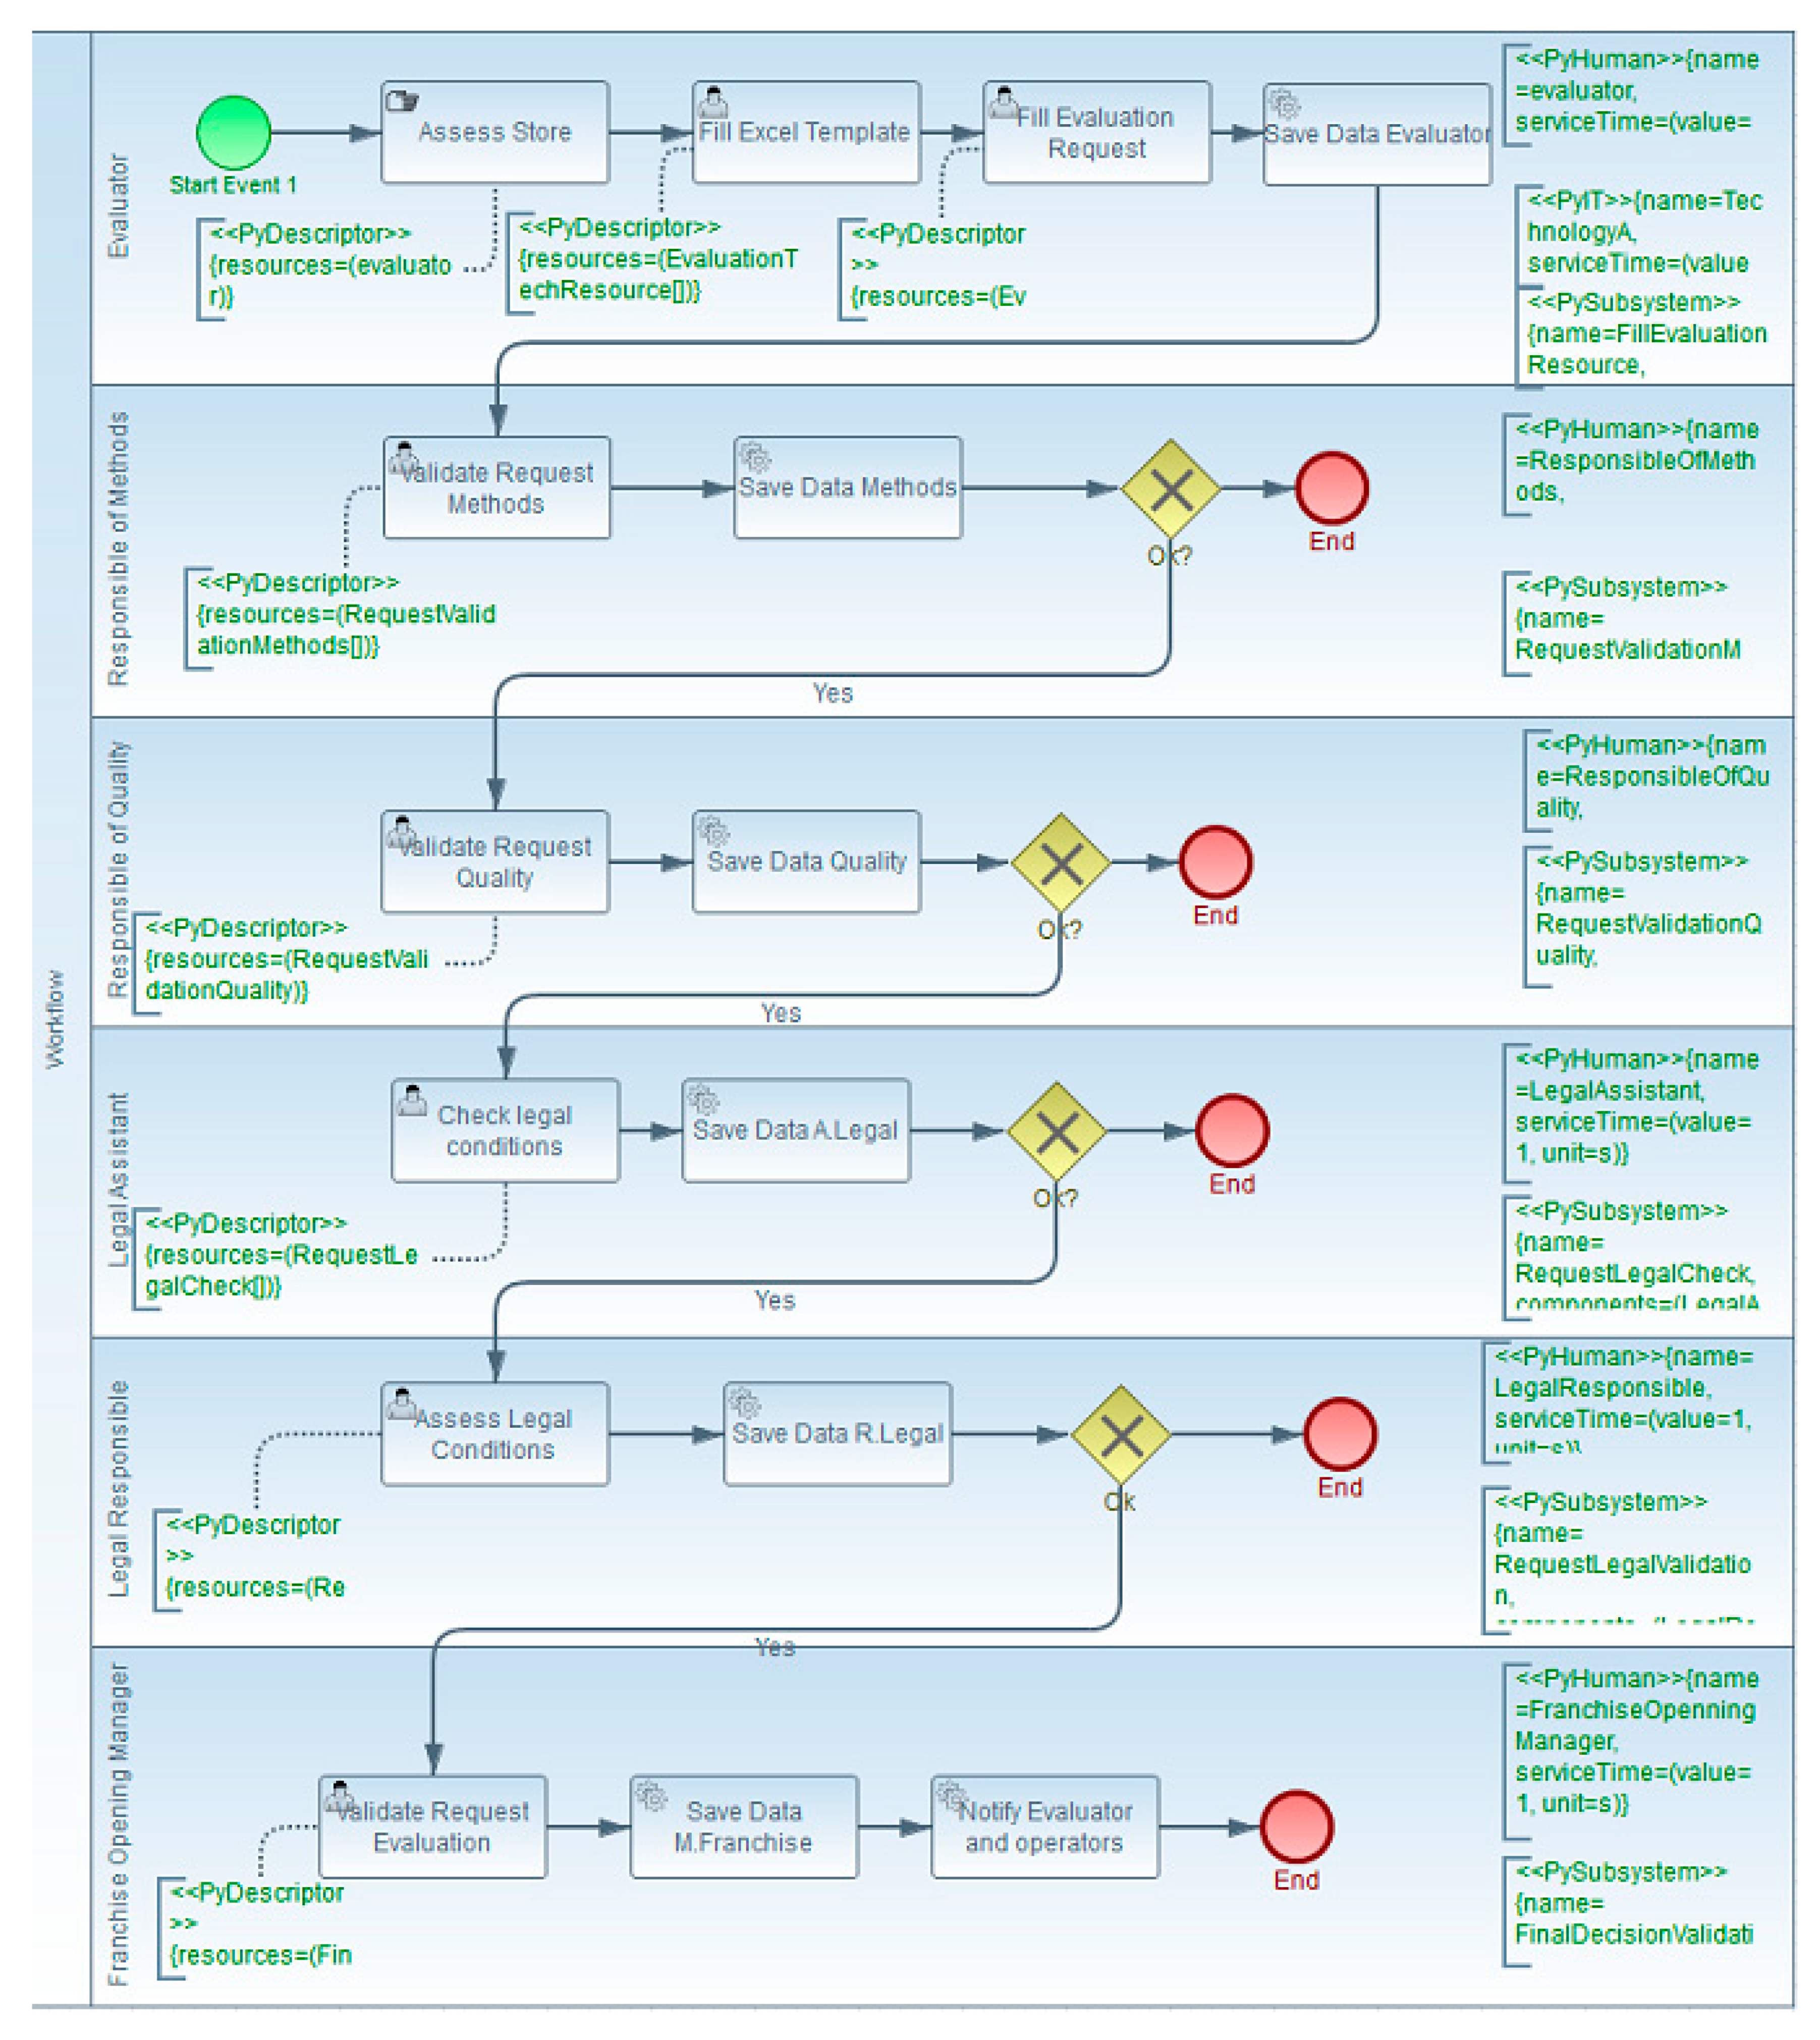
- The description of an atomic human resource with the name ResponsibleOfMethods with a service time of 100 seconds; the service time is mentioned in PySubSystem, as described in the next point (the same syntax is used for the other types of resources):<<PyHuman>> {name = ResponsibleOfMethods, serviceTime = (value = 1, unit = s)}
- To define a composite task resource with the name of TaskResources containing the three type of resources, ResponsibleOfMethods, ThechnologyA, and MachineA:<<PySubSystem>> {name = TaskResources, components = (ResponsibleOfMethods[100], TechnologyA[10], MachineA[100])}
- The specification that a BPMN task uses the PySubsystem named “TaskResources” is realized through a text annotation associated to the task in the model with the following definition:<<PyDescriptor>> {resources = (TaskResources)}
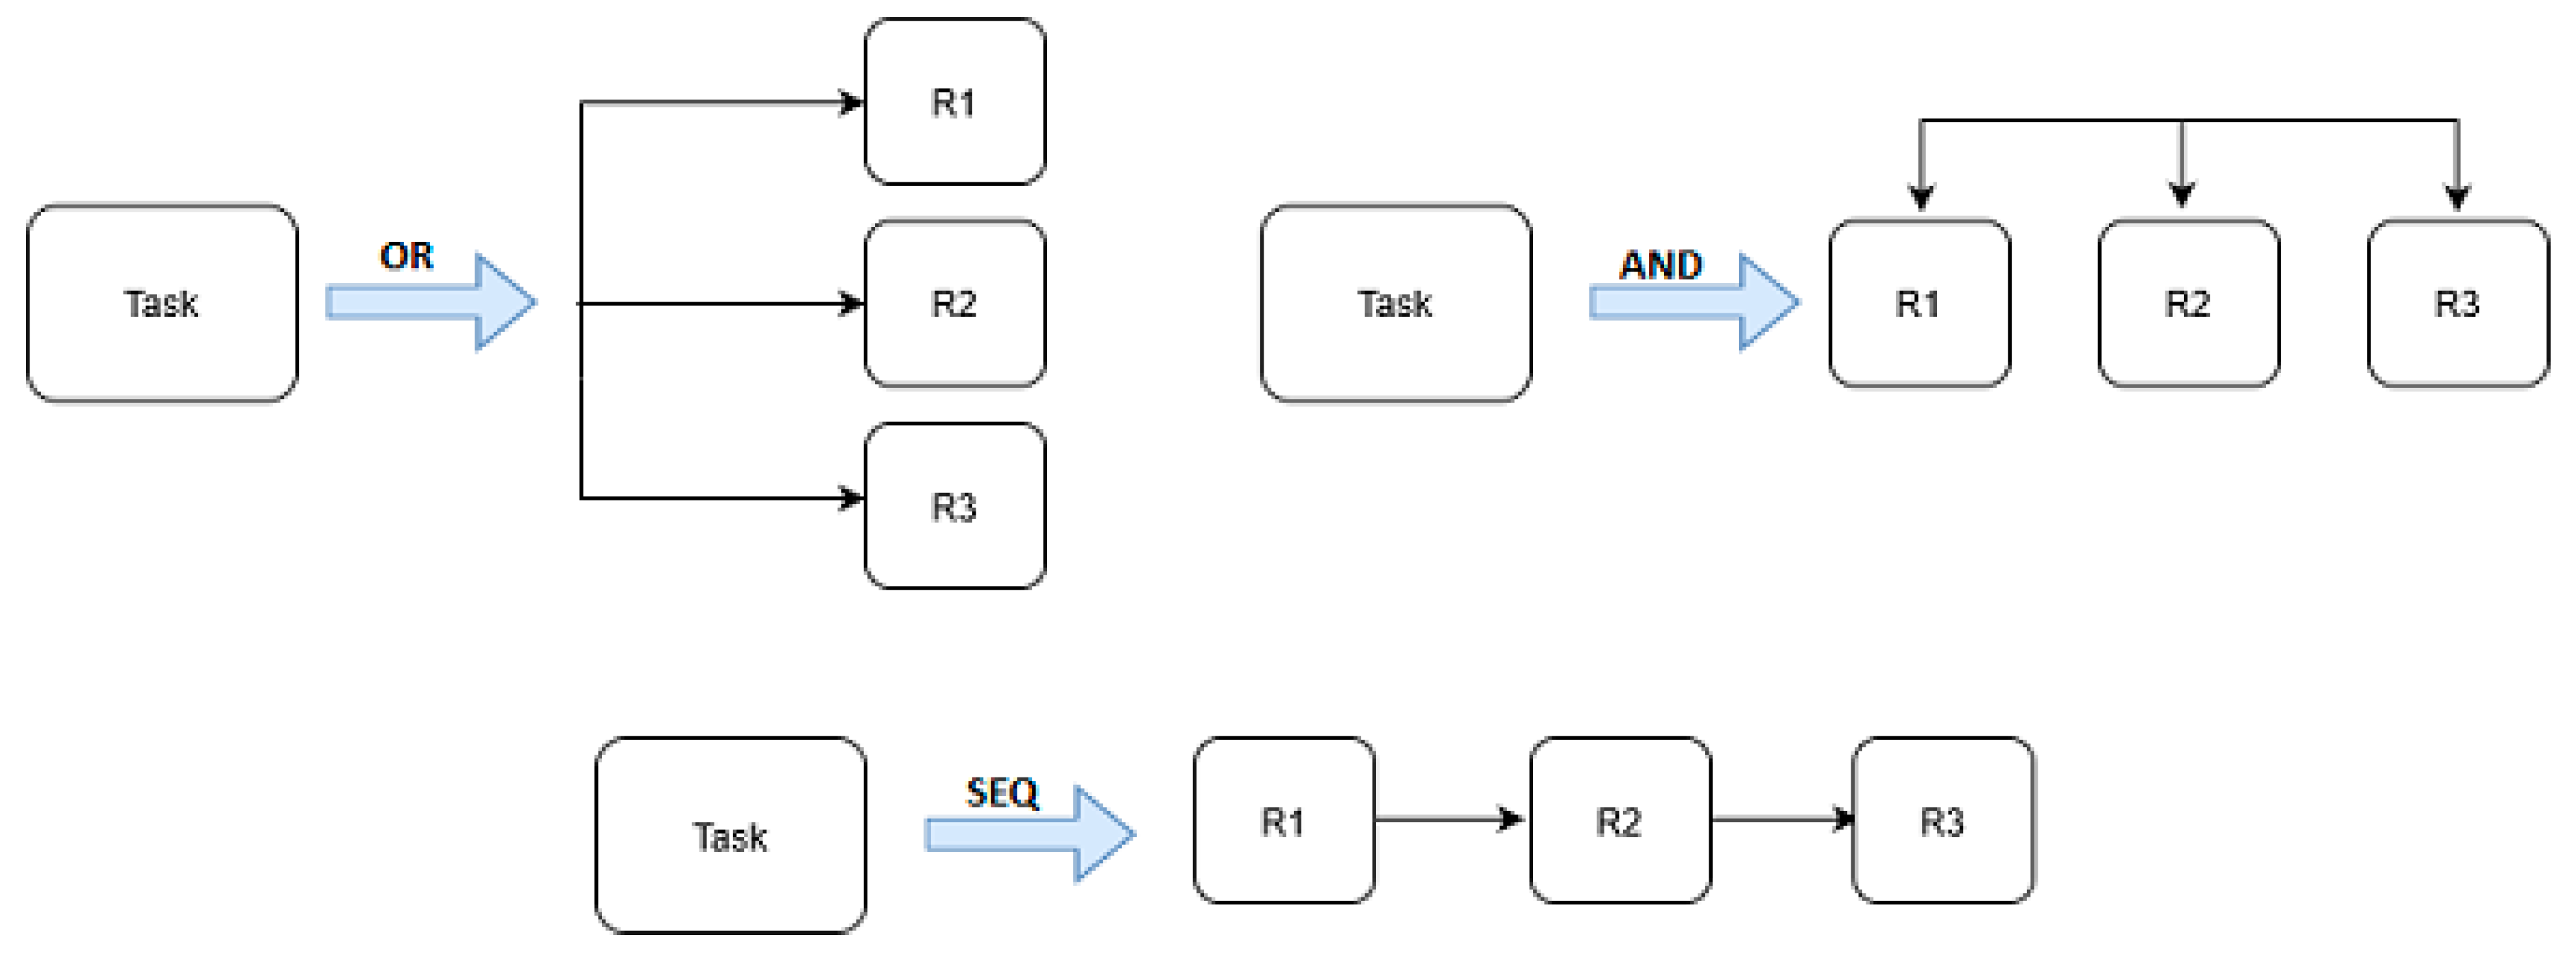
3.3. Aggregation of Resource Performance
- Sequential (SEQ): All tasks are executed consecutively,
- OO: Only one of the tasks is executed,
- AND: Both tasks are executed simultaneously.
3.4. User Interface
- Choose the best development techniques to implement the interface user, e.g., to fill some fields automatically or provide some aid that will help the worker in filling them;
- Assign the best worker for a considered task, by taking into consideration workers’ experience, their strengths, and their shortcomings when carrying out similar tasks.
3.4.1. PyBPMN Metamodel Extension to Include User Interface Component
3.4.2. PyInterface Usage
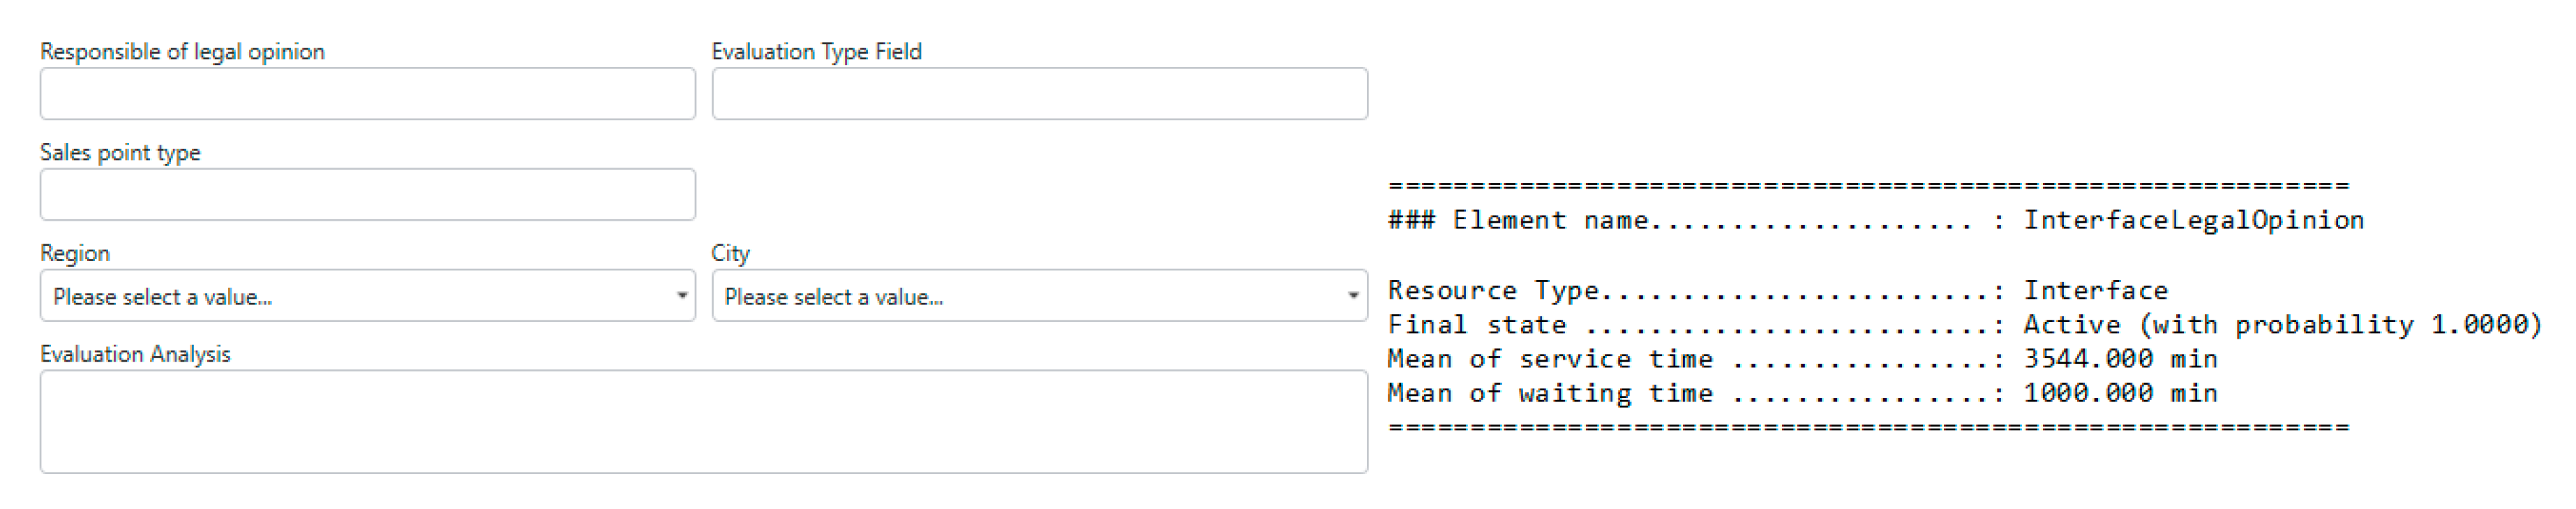
- The description of a field of a task with the name “Description” with a service time of 5 min; the service time is mentioned in PyInterface as described in the next point:<<PyField>>{name = Description, serviceTime = (value = 1, unit = min)}
- To define a user interface composite resource with the name of UserInterface:<<PyInterface>>{name = UserInterface, fields = (Name[3], Department[2], RequestData[2], Description[5])}
- The specification that a BPMN user task, uses the PyInterface named “UserInterface” is realized through a text annotation associated to the task in the model:<<PyDescriptor>>{resources = (User_Interface)}
3.5. Performance Measurement of the Process Path
- eBPMN objects corresponding to the original BPMN metamodel,
- eBPMN objects derived from the PyBPMN metamodel.
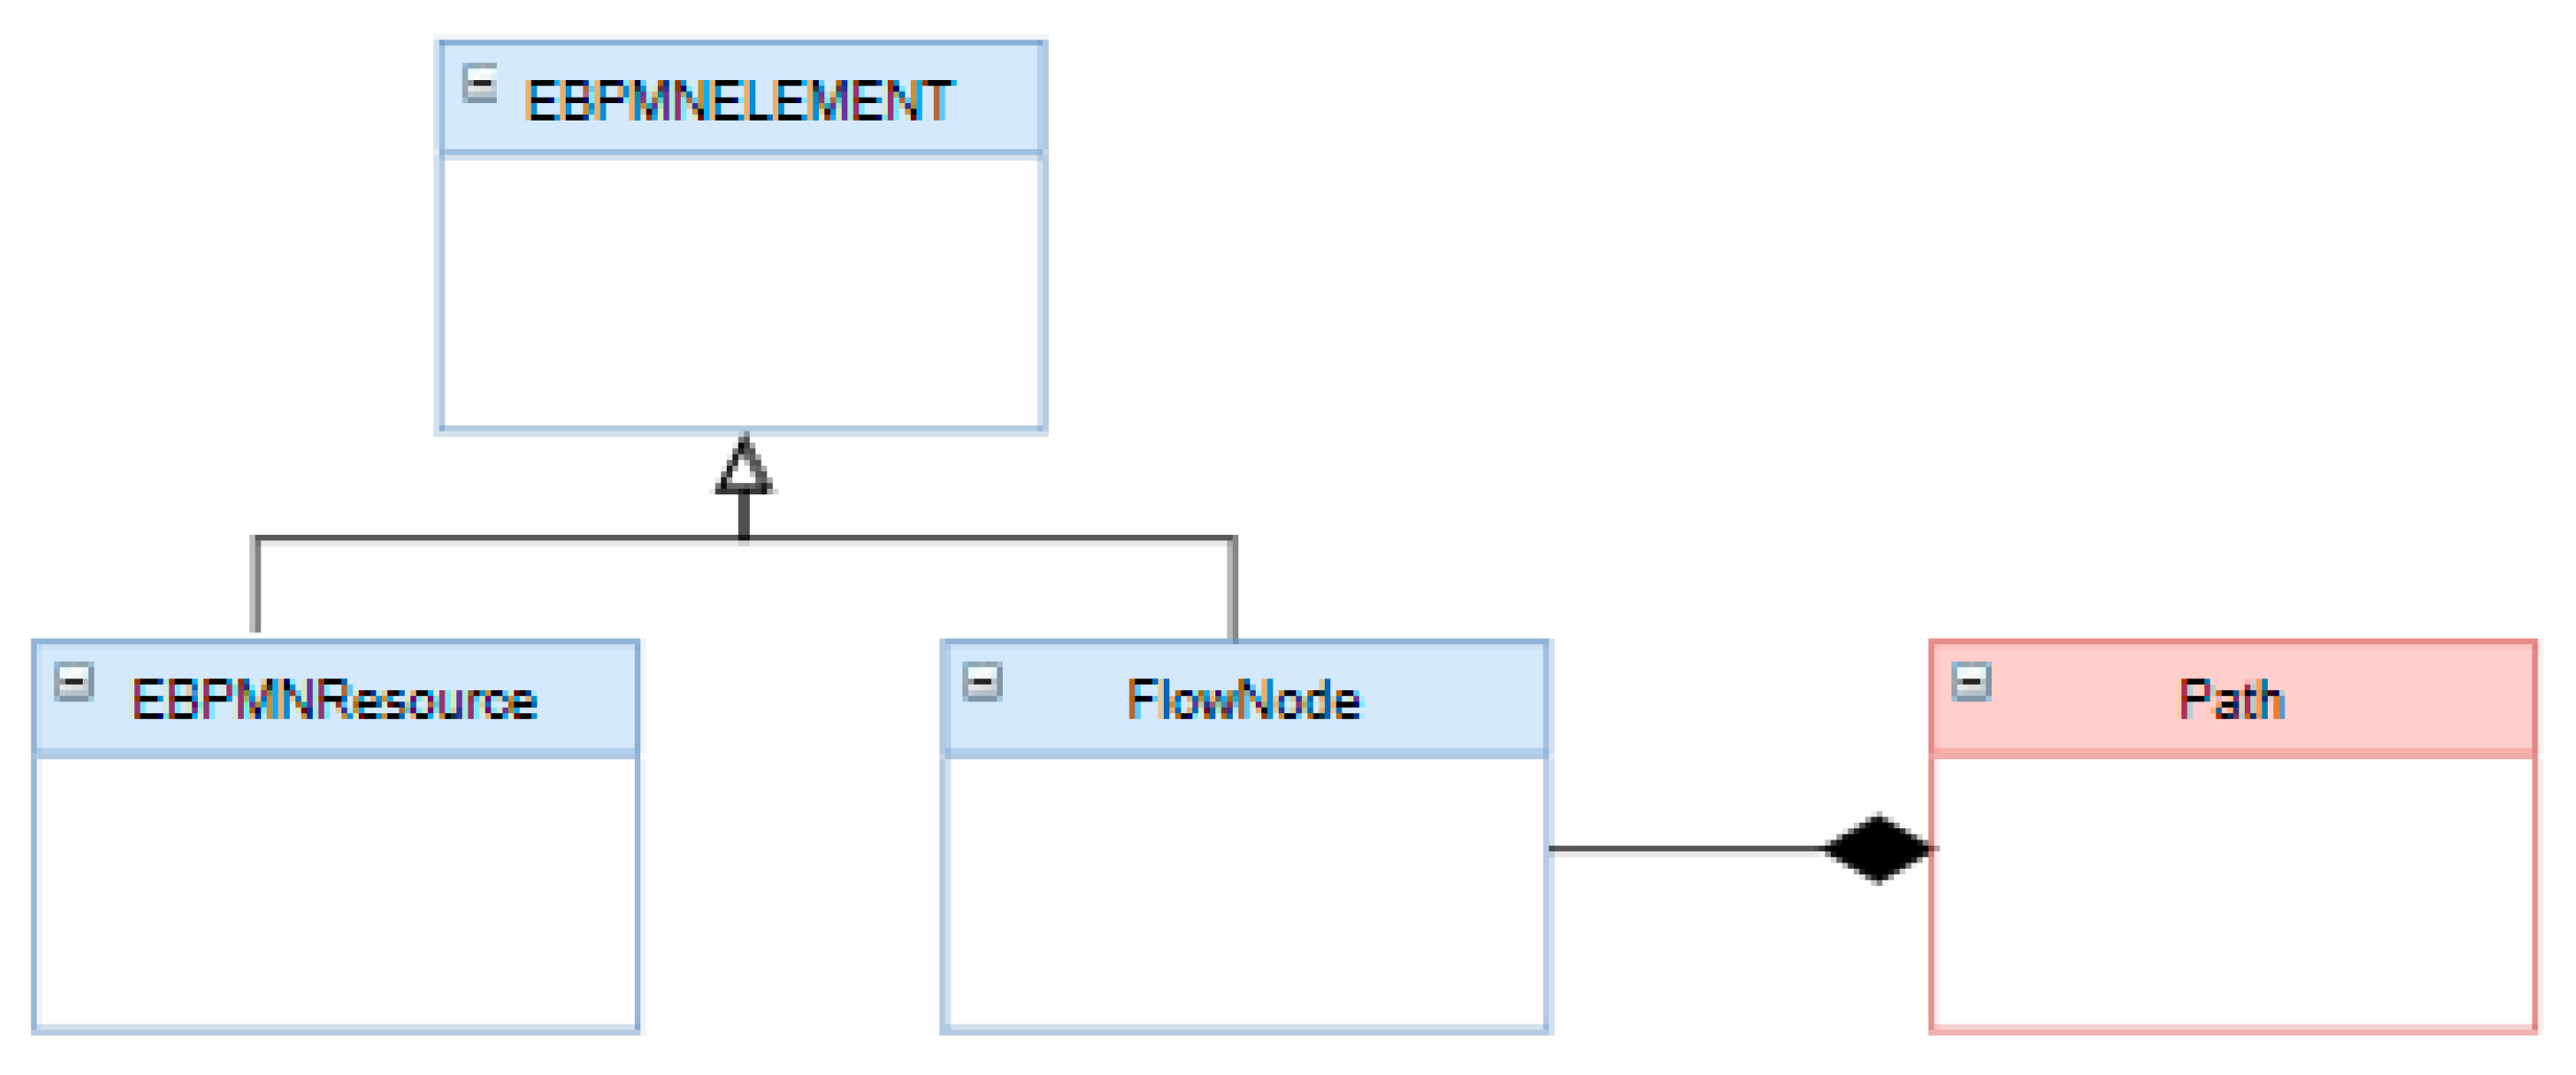
- EBPMN ELEMENT class: is the superclass of every simulation entity of the Ebpmn implementation. It is specialized into two further general classes, FlowNode and EBPMNResource classes;
- EBPMNResource class: represents the entities corresponding to the execution behavior of resource elements according to the PyBPMN metamodel as shown in Figure 4;
- FlowNode class: represents the entities corresponding to the execution behavior of BPMN FlowNode elements.
3.6. Case Study
3.6.1. Top BSM
- ➢
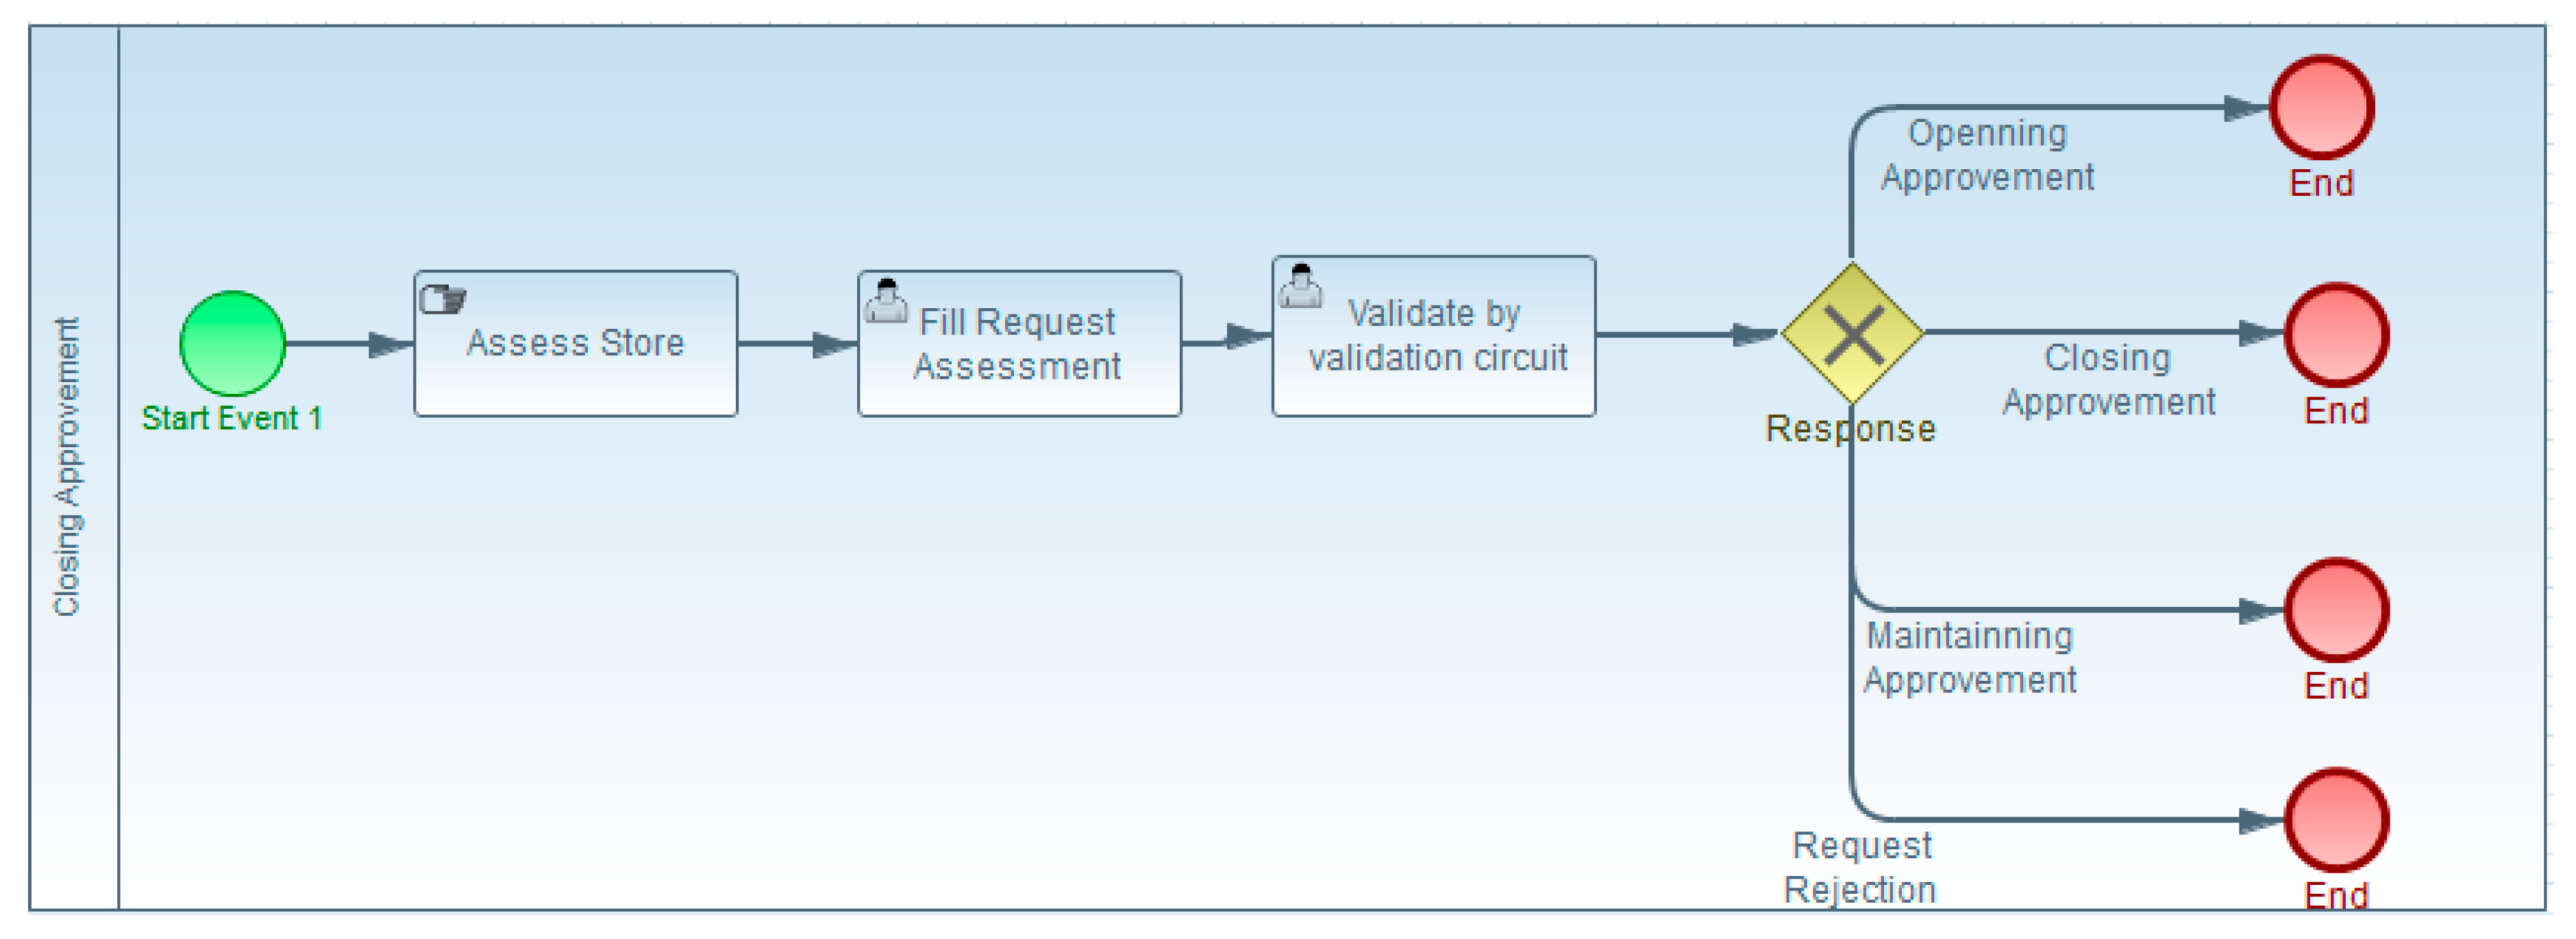
- Functional requirements: In order to open new franchise stores, maintain, or close the existing ones, Brand wants to use a workflow to automate the evaluation of the methods and practices used in those stores. The evaluation is based on qualitative criteria assessed by a qualified evaluator. The request is then submitted for validation to a validation circuit.
- ➢
- Non-functional requirements: Their principal goals are
- •
- To increase internal efficiency for managing opening and closing requests,
- •
- To be able to process more requests while improving response and decision delay,
- •
- Late closing of an inadequate franchised store could be harmful to their image,
- •
- Late opening of a good potential store could decrease their sales.
3.6.2. Bottom BSM
3.6.3. Top TIM
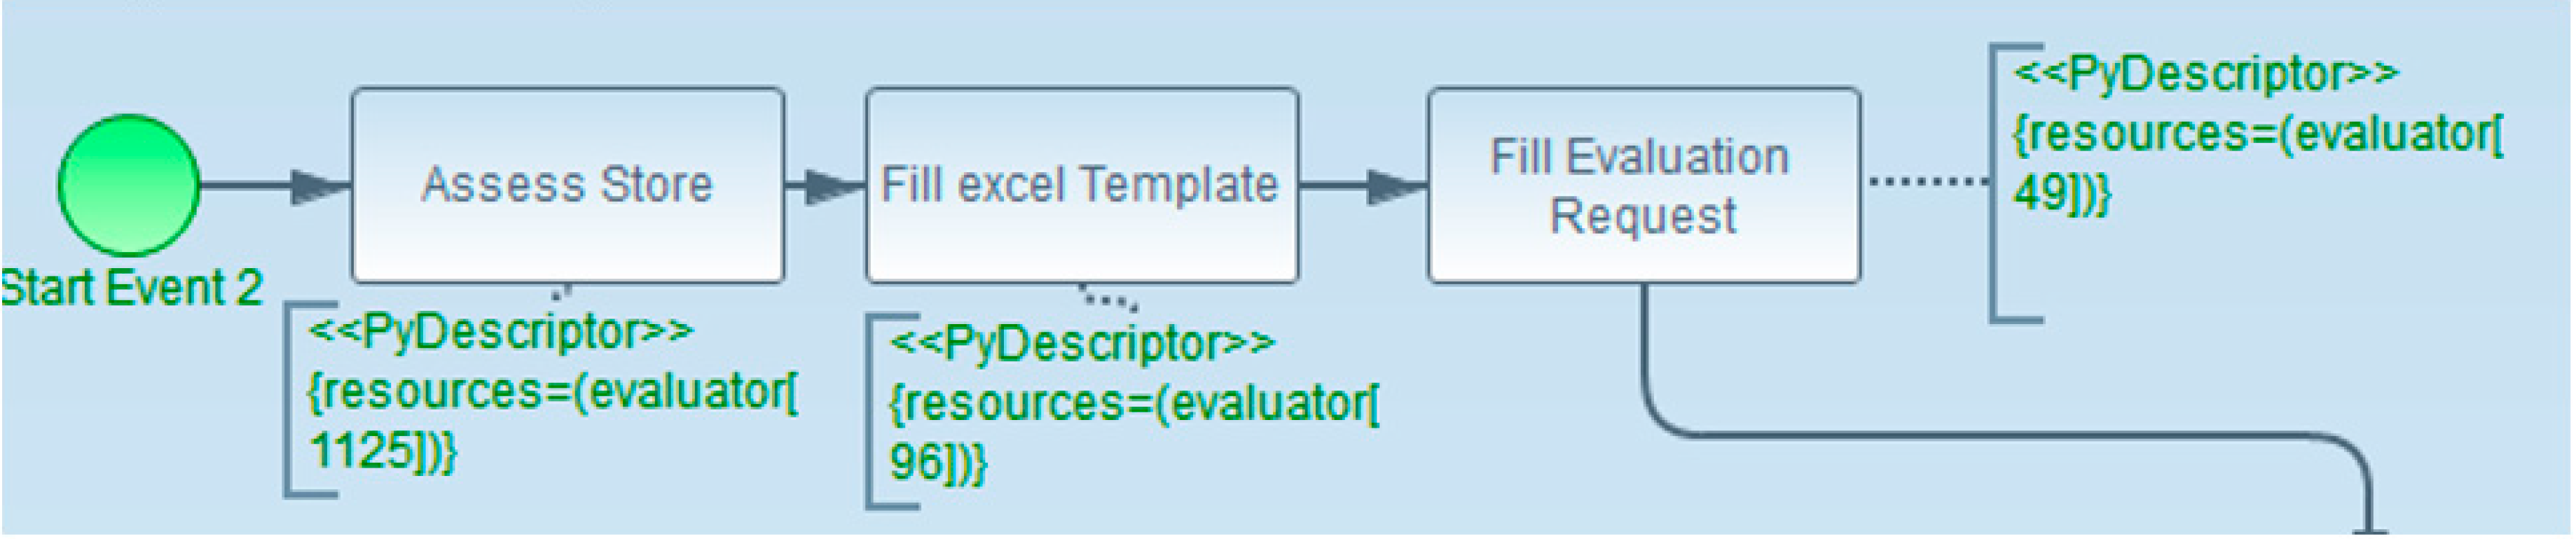
3.6.4. Bottom TIM
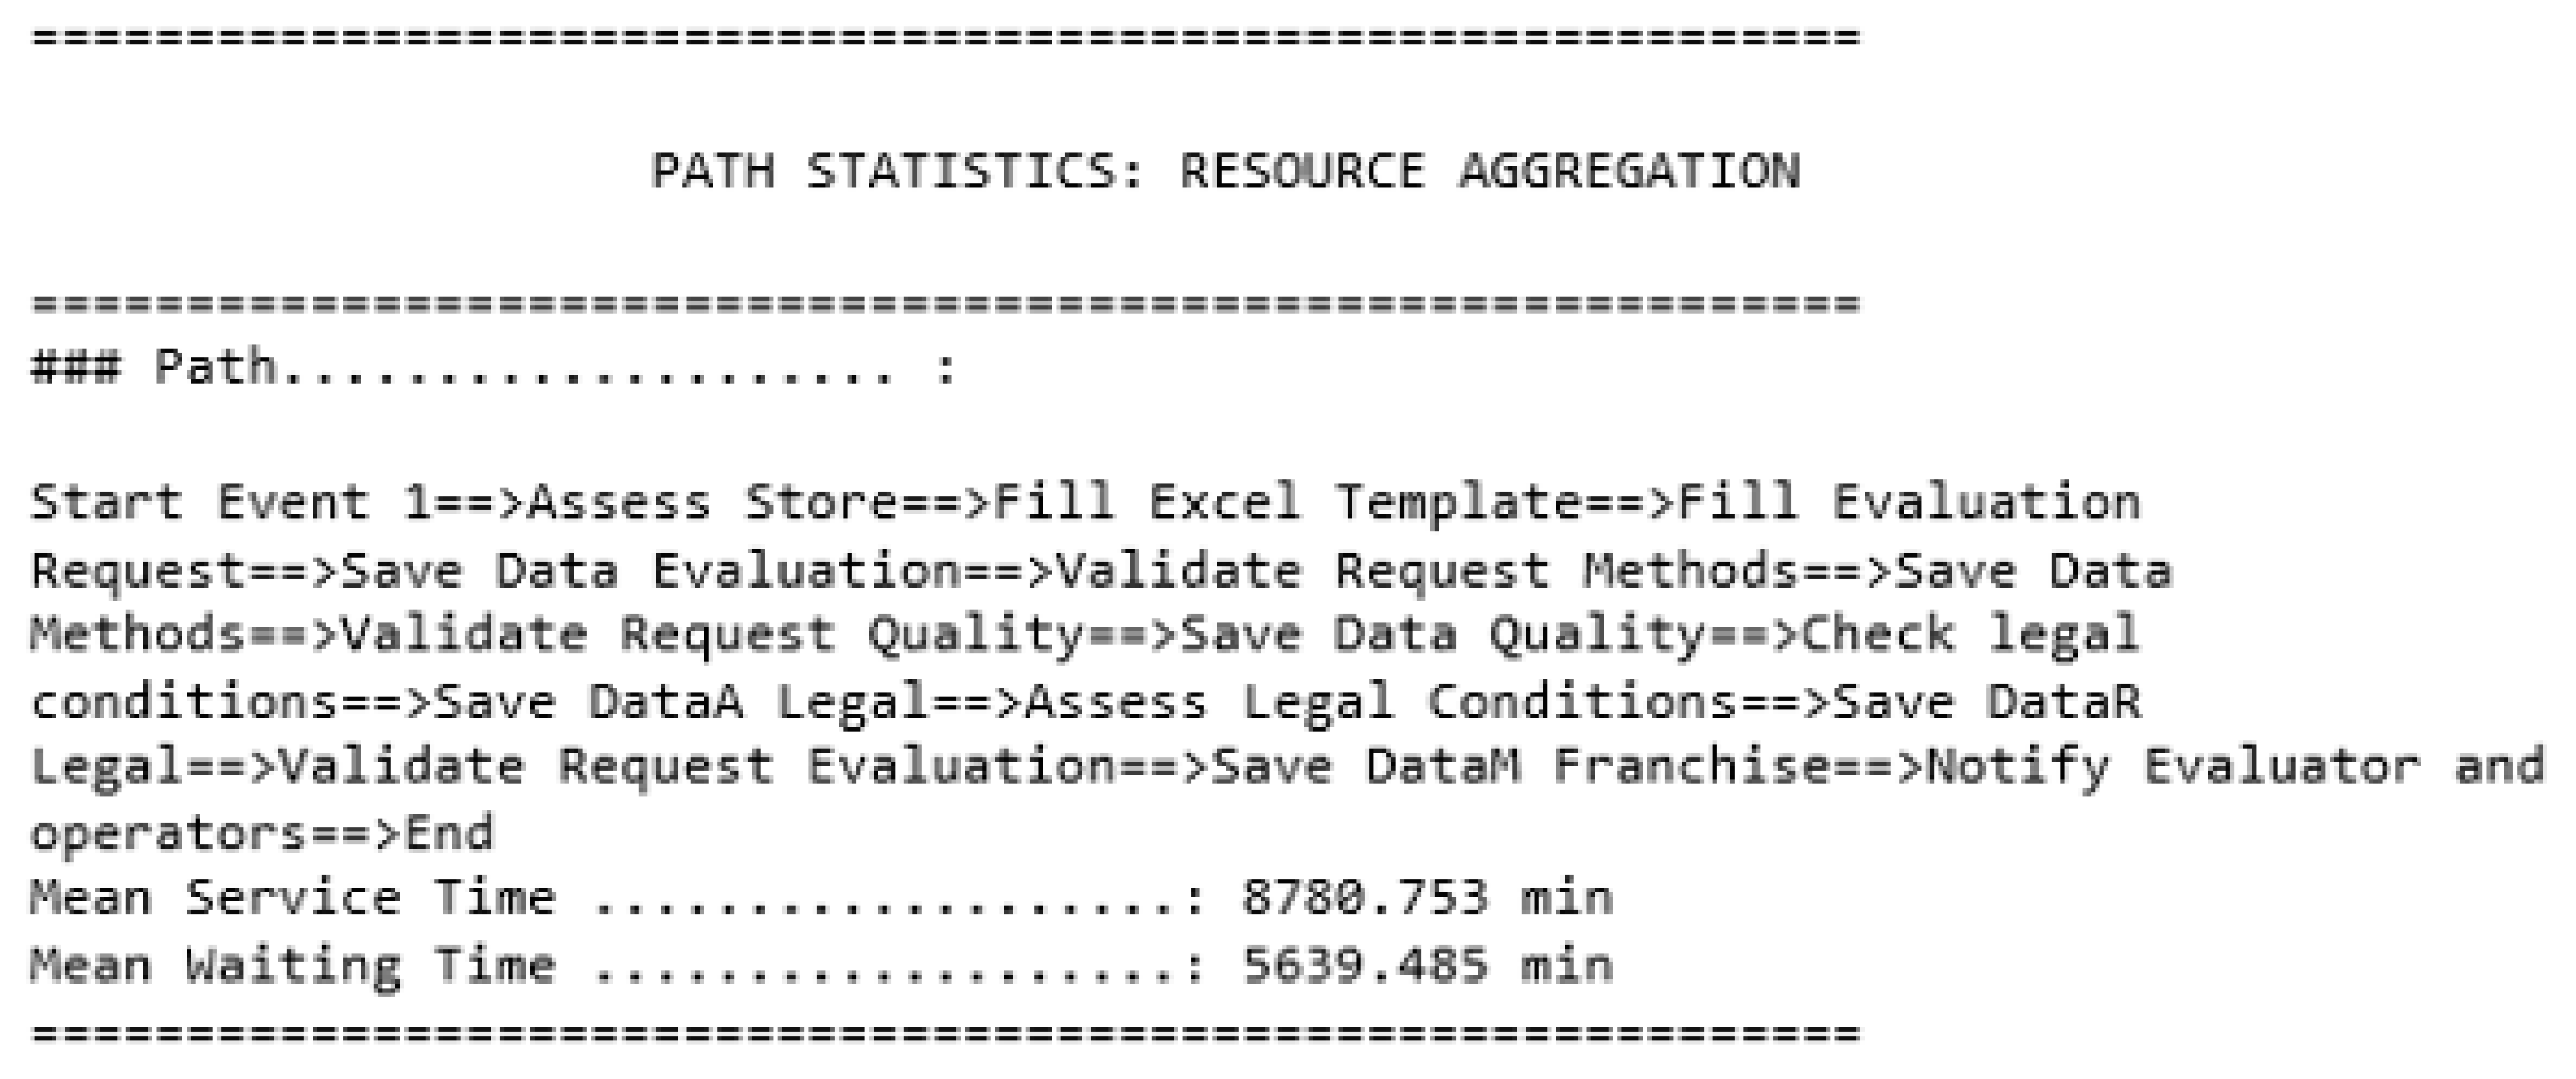
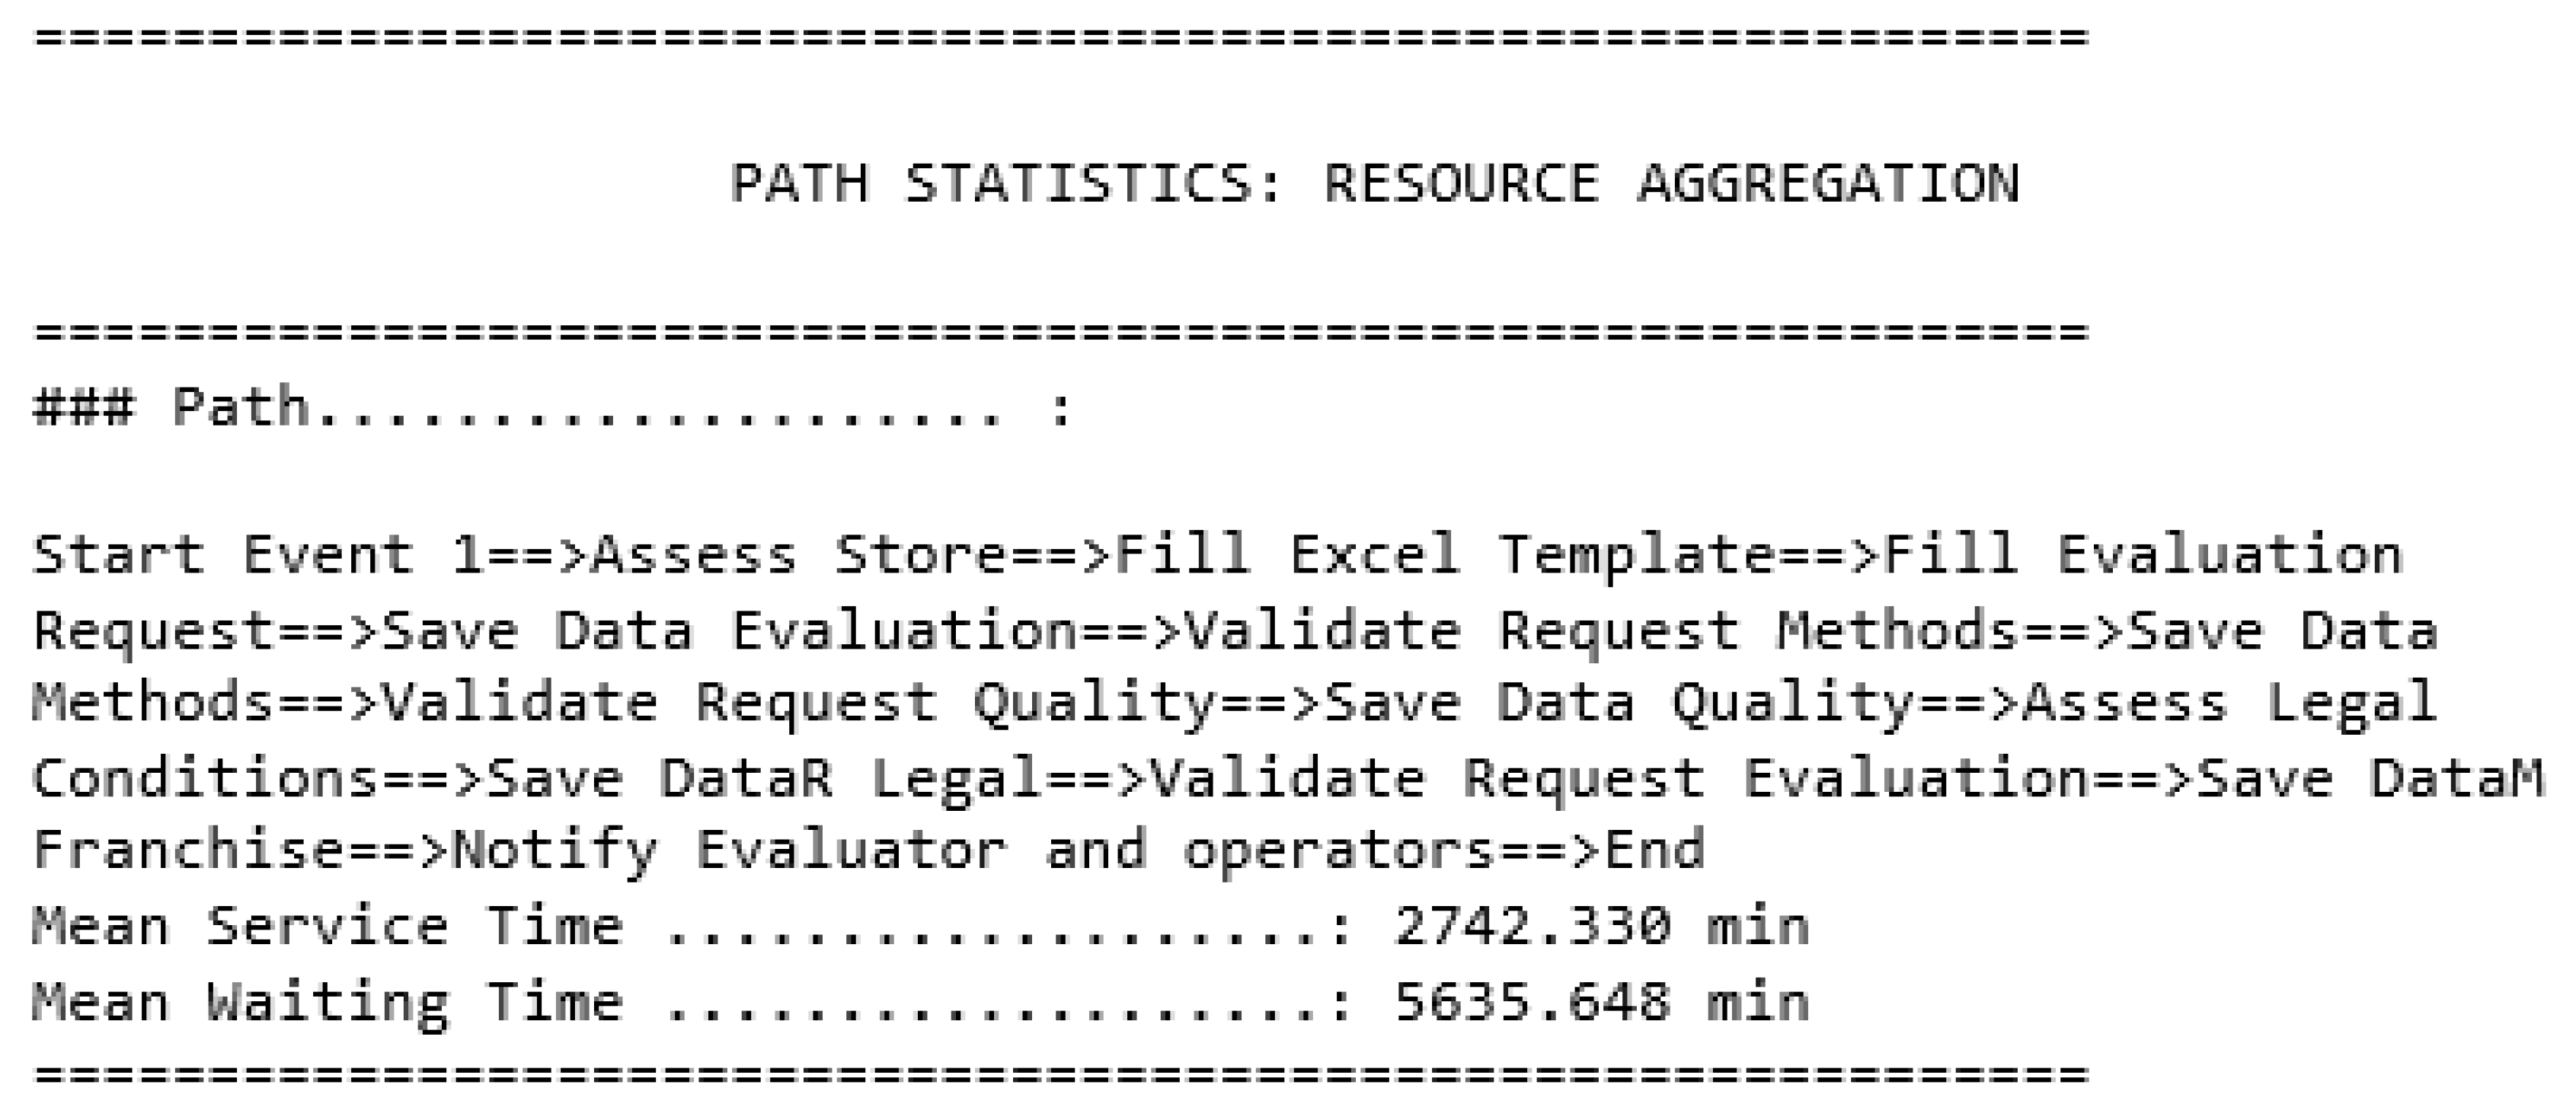
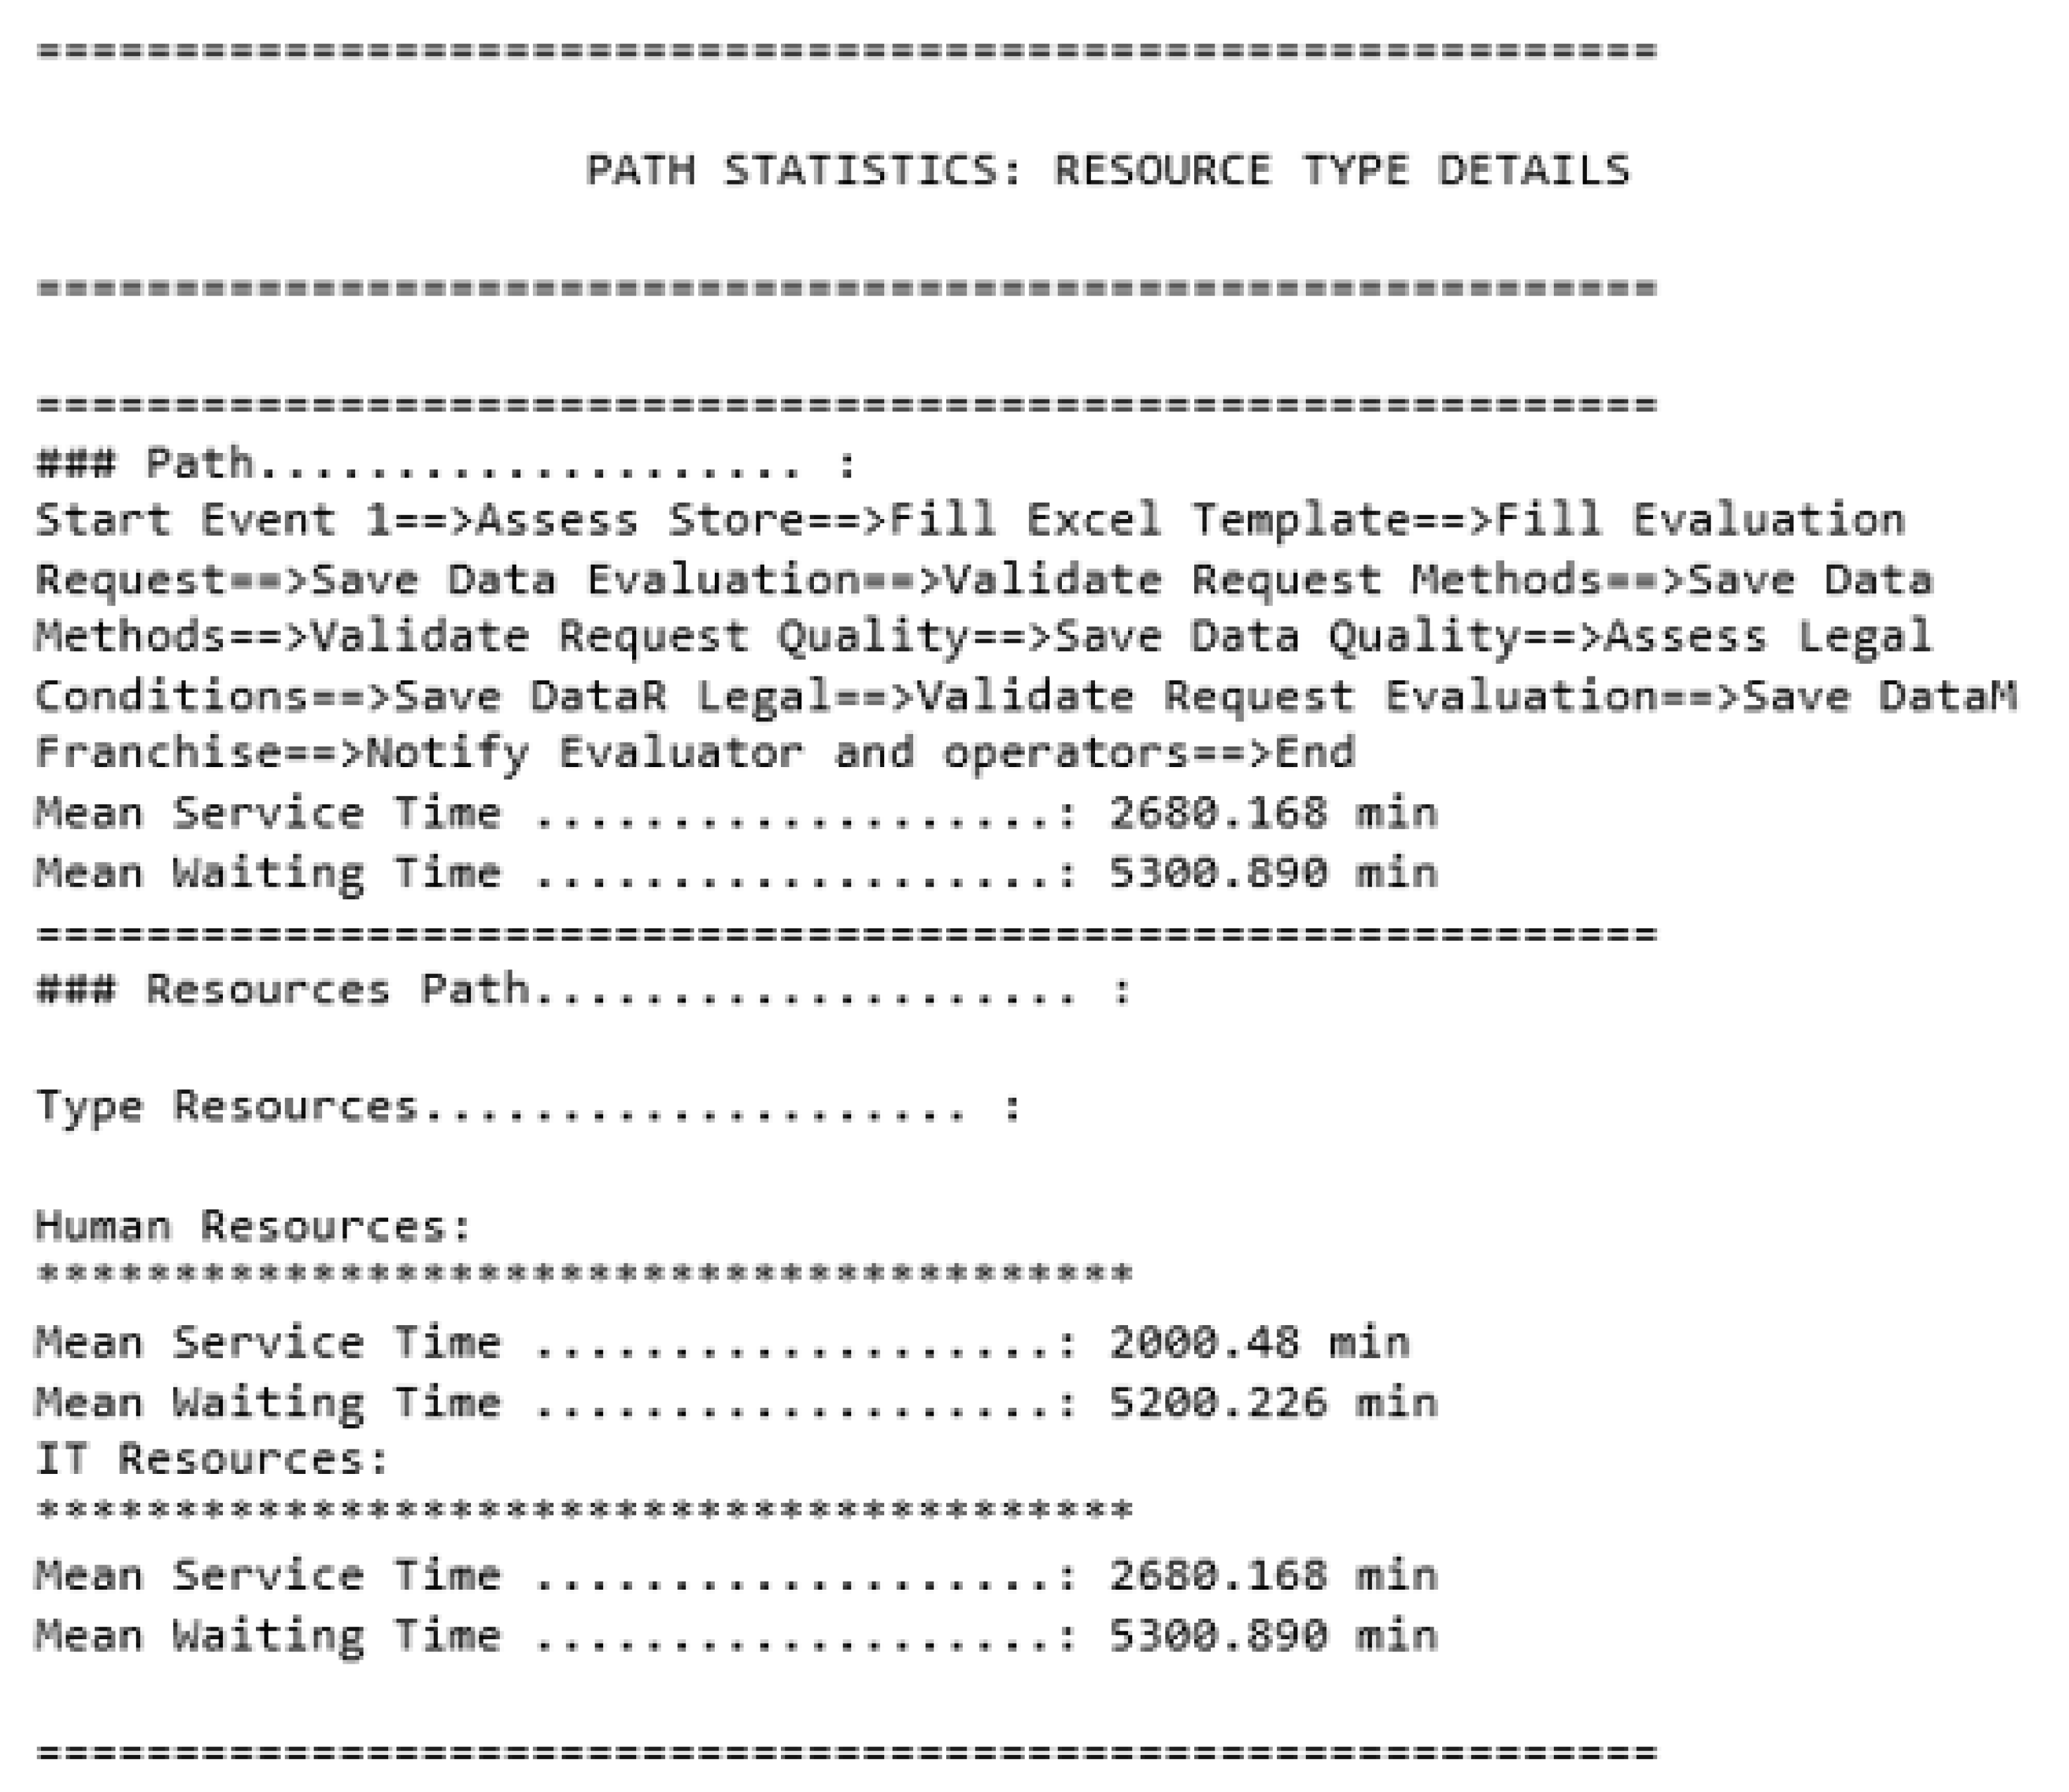
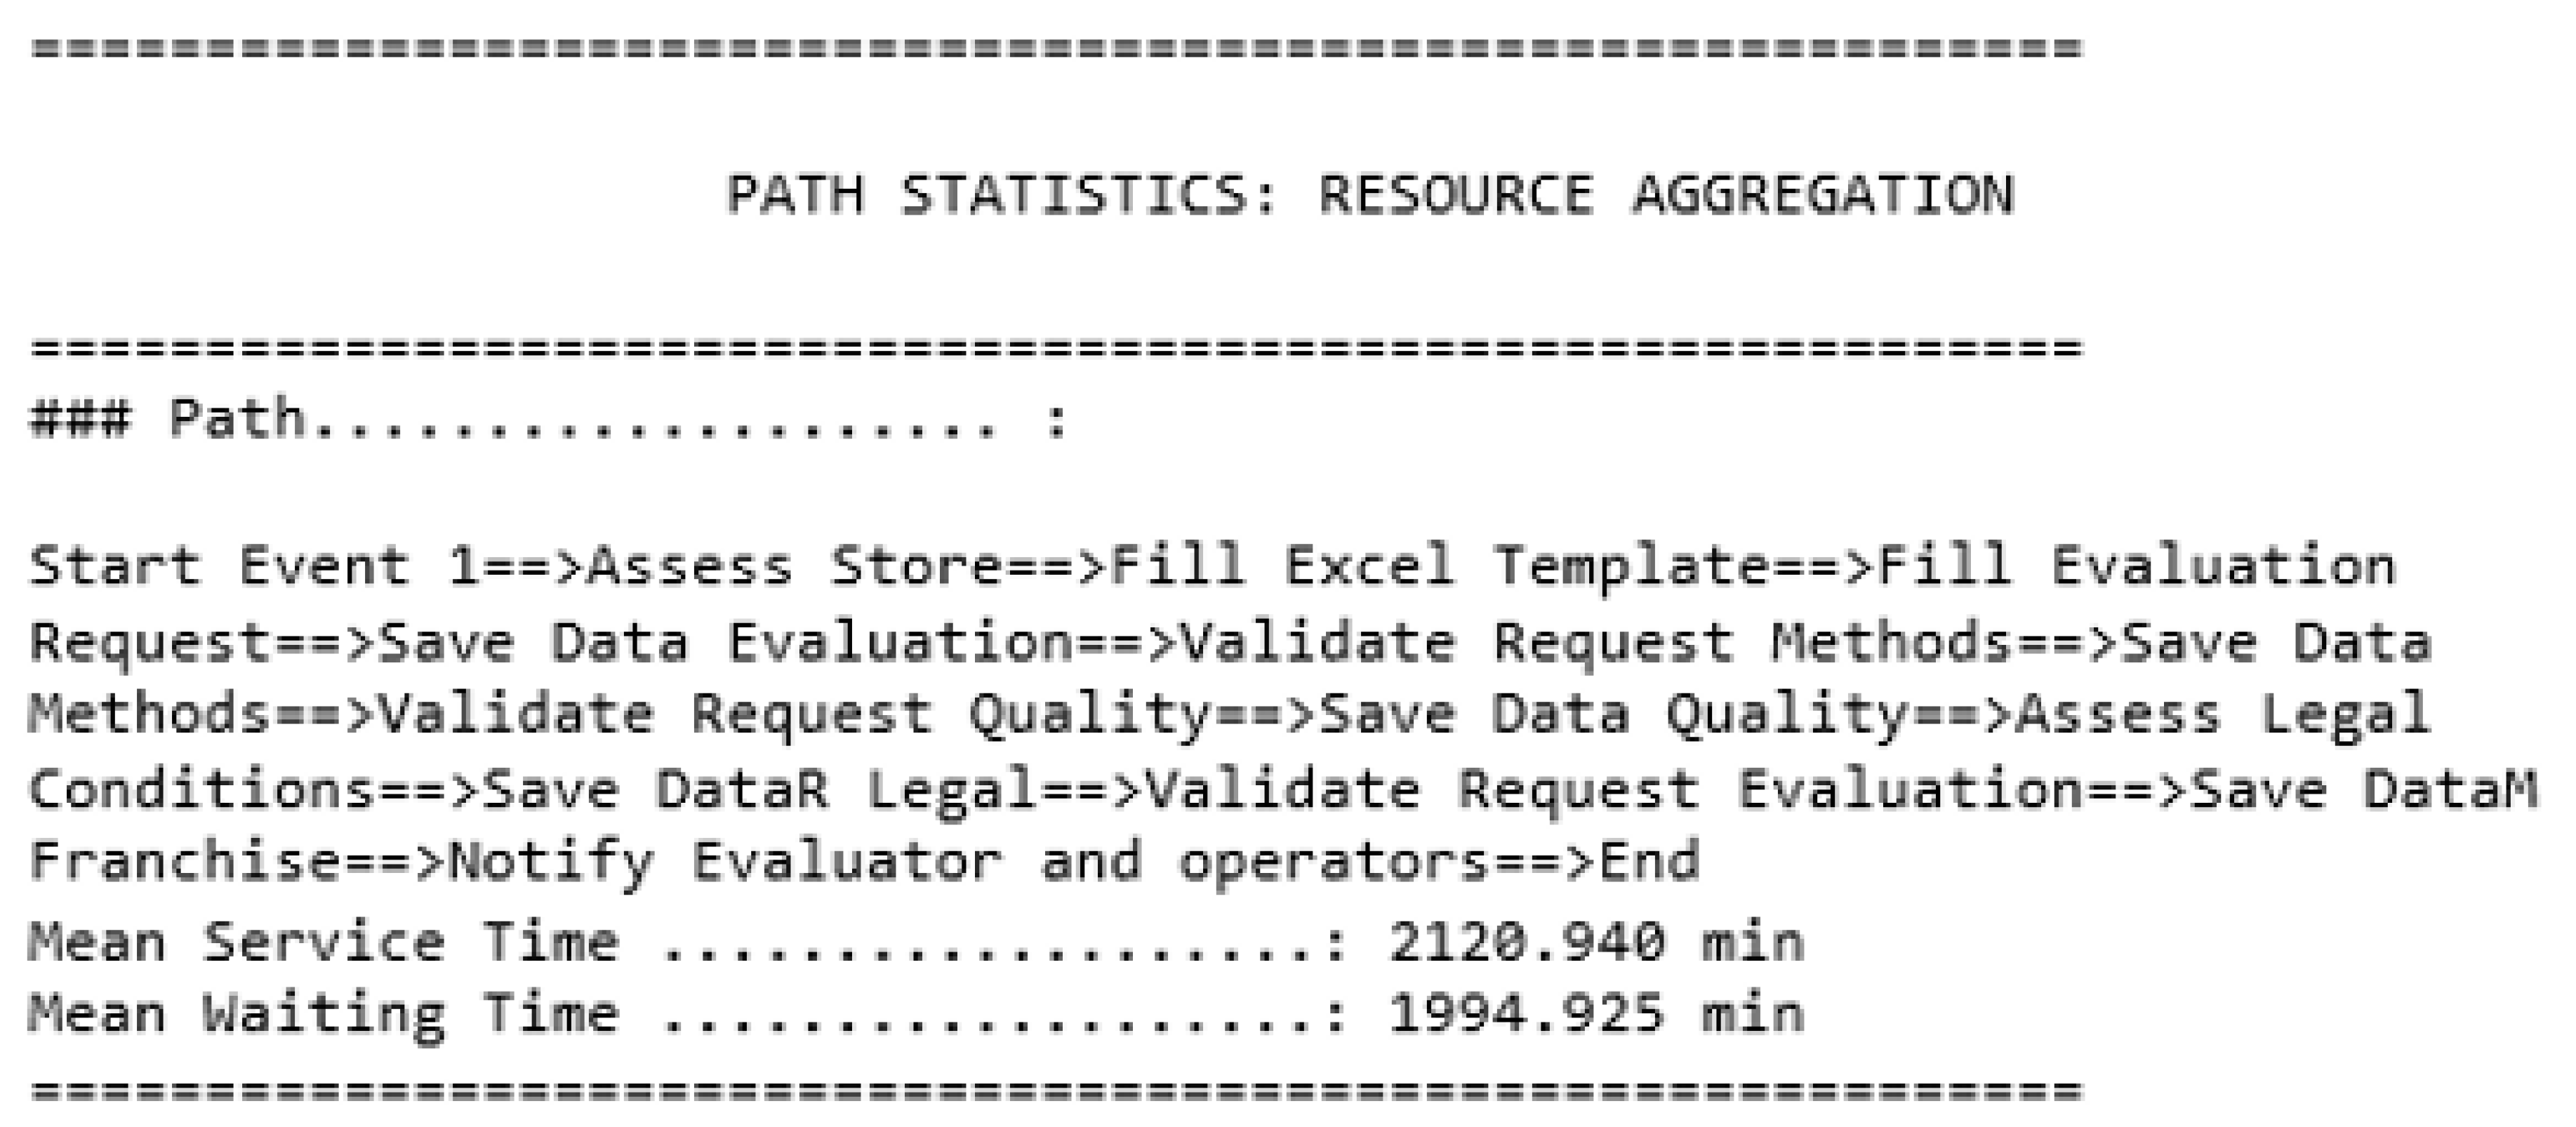
- Getting global results using resource aggregation: processing time of each path the simulation ran using the resource aggregation technique,
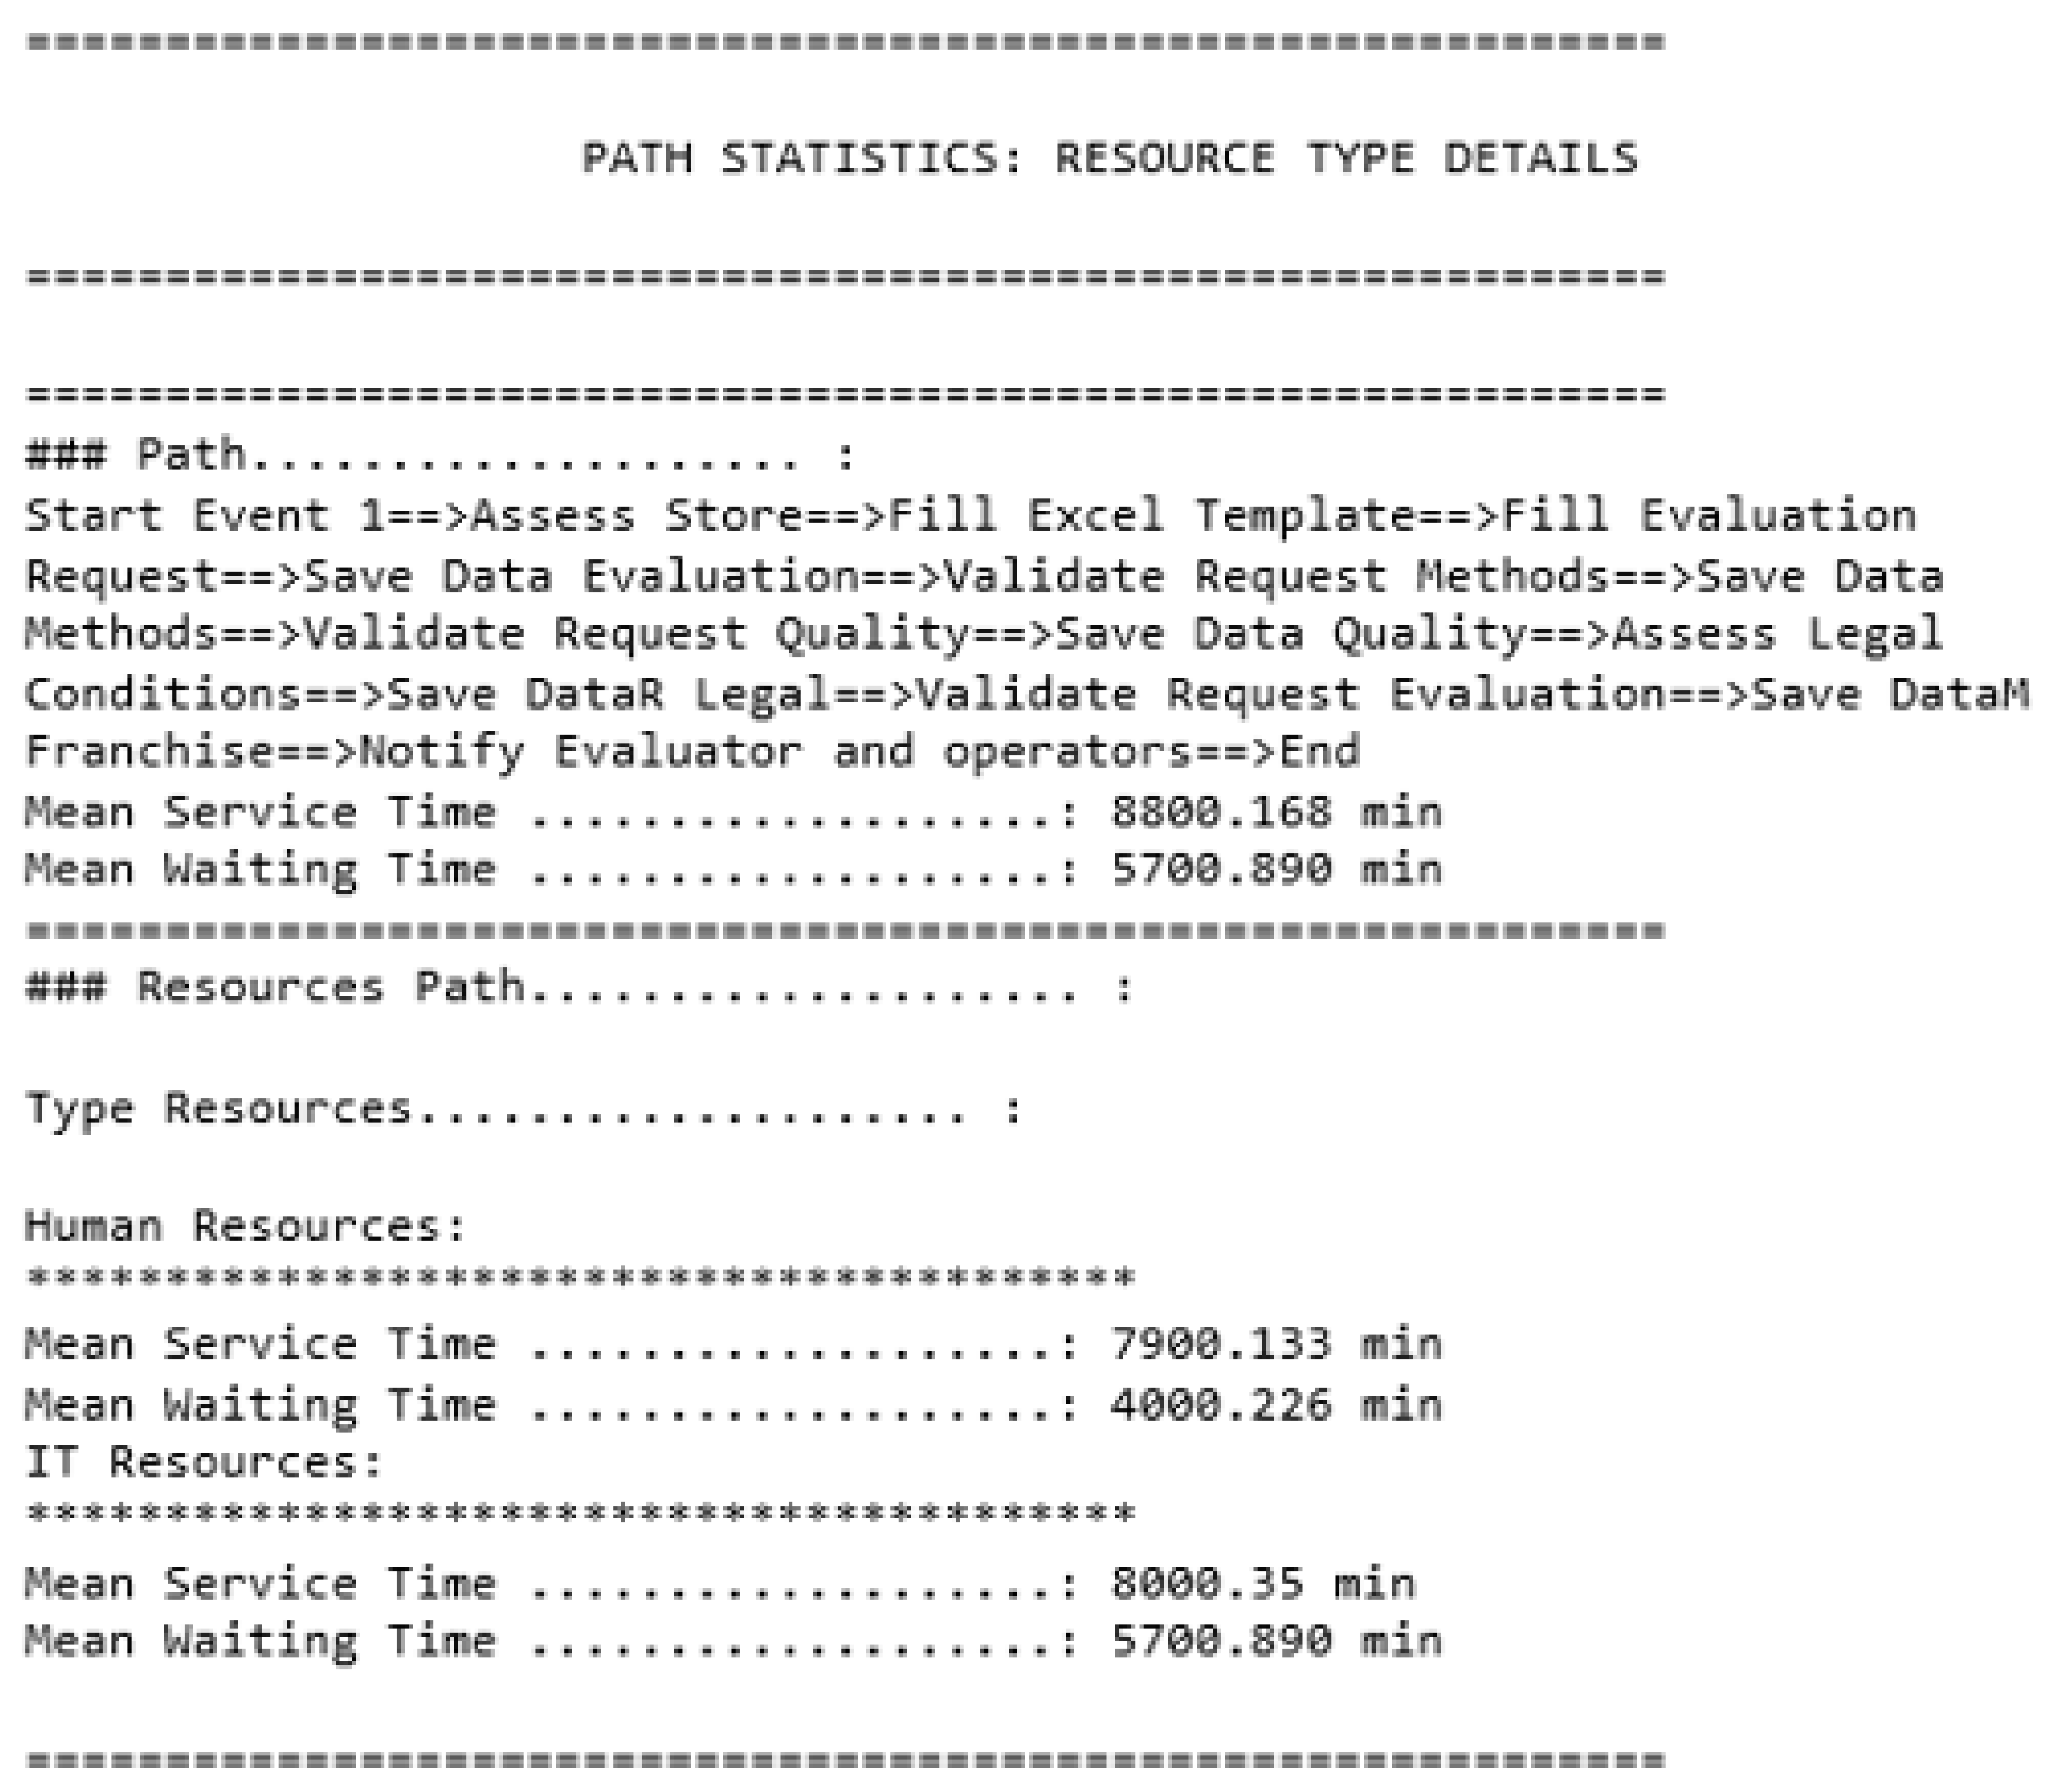
- Getting global results including the type of each resource: processing time of each path the simulation ran through, and the processing time of each type of results,
- Getting detailed results: processing time of each task and each resource on their own.
Global Results Using Resource Aggregation
Global Results Showing the Results of Each Type of Resource
User Interface
4. Discussion
5. Conclusions
Author Contributions
Funding
Acknowledgments
Conflicts of Interest
References
- Alcácer, V.; Cruz-Machado, V. Scanning the Industry 4.0: A Literature Review on Technologies for Manufacturing Systems. Eng. Sci. Technol. Int. J. 2019, 22, 899–919. [Google Scholar] [CrossRef]
- Weske, M. Business Process Management: Concepts, Languages, Architectures; Springer: Berlin/Heidelberg, Germany, 2019; ISBN 978-3-662-59431-5. [Google Scholar]
- Rodrigues da Silva, A. Model-driven engineering: A survey supported by the unified conceptual model. Comput. Lang. Syst. Struct. 2015, 43, 139–155. [Google Scholar] [CrossRef]
- Earnshaw, R. Visual Computing. In Data Science and Visual Computing; Advanced Information and Knowledge Processing; Springer International Publishing: Berlin/Heidelberg, Germany, 2019; pp. 33–38. ISBN 978-3-030-24366-1. [Google Scholar]
- Posada, J.; Toro, C.; Barandiaran, I.; Oyarzun, D.; Stricker, D.; de Amicis, R.; Pinto, E.B.; Eisert, P.; Dollner, J.; Vallarino, I. Visual Computing as a Key Enabling Technology for Industrie 4.0 and Industrial Internet. IEEE Comput. Grap. Appl. 2015, 35, 26–40. [Google Scholar] [CrossRef] [PubMed]
- Zacharewicz, G.; Pirayesh-Neghab, A.; Seregni, M.; Ducq, Y.; Doumeingts, G. Simulation-Based Enterprise Management. In Guide to Simulation-Based Disciplines; Mittal, S., Durak, U., Ören, T., Eds.; Simulation Foundations Methods and Applications; Springer International Publishing: Cham, Switzerland, 2017; pp. 261–289. ISBN 978-3-319-61263-8. [Google Scholar]
- Bocciarelli, P.; D’Ambrogio, A.; Giglio, A.; Paglia, E.; Gianni, D. Empowering Business Process Simulation through Automated Model Transformations; Spring Simulation Multiconference. In Proceedings of the Symposium on Theory of Modeling & Simulation—DEVS Integrative, Tampa, FL, USA, 13–16 April 2014. [Google Scholar]
- D’Ambrogio, A.; Zacharewicz, G. Resource-based Modeling and Simulation of Business Processes. In Proceedings of the 2016 Summer Computer Simulation Conference (SCSC 2016), Society for Modeling and Simulation International (SCS), Montreal, QC, Canada, 24–27 July 2016. [Google Scholar]
- Dumas, M.; La Rosa, M.; Mendling, J.; Reijers, H.A. Fundamentals of Business Process Management; Springer: Berlin/Heidelberg, Germany, 2018; ISBN 978-3-662-56508-7. [Google Scholar]
- Ducq, Y. An Architecture for Service Modelling in Servitization Context: MDSEA. In Enterprise Interoperability; Zelm, M., van Sinderen, M., Pires, L.F., Doumeingts, G., Eds.; John Wiley & Sons, Ltd: Chichester, UK, 2014; pp. 1–19. ISBN 978-1-118-84699-5. [Google Scholar]
- Schmidt, D.C. Guest Editor’s Introduction: Model-Driven Engineering. Computer 2006, 39, 25–31. [Google Scholar] [CrossRef]
- Drozdova, M.; Kardos, M.; Kurillova, Z.; Bucko, B. Transformation in Model Driven Architecture. In Information Systems Architecture and Technology: Proceedings of 36th International Conference on Information Systems Architecture and Technology—ISAT 2015—Part I; Borzemski, L., Grzech, A., Świątek, J., Wilimowska, Z., Eds.; Advances in Intelligent Systems and Computing; Springer International Publishing: Cham, Switzerland, 2016; pp. 193–203. ISBN 978-3-319-28553-5. [Google Scholar]
- Bourey, J.-P.; Grangel, R.; Ducq, Y. Report on Model Driven Interoperability; INTEROP Interoperability Research for Networked Enterprises Applications and Software: Lille, France, 2007. [Google Scholar]
- Rolstadås, A.; Andersen, B. Enterprise Modeling; Springer US: Boston, MA, USA, 2000; ISBN 978-1-4613-7016-1. [Google Scholar]
- Object Management Group. Business Process Model and Notation (BPMN)—Version 2.0. 2011. Available online: https://www.omg.org/spec/BPMN/2.0 (accessed on 29 June 2020).
- van der Aalst, W.M.P. Business Process Simulation Survival Guide. In Handbook on Business Process Management 1; vom Brocke, J., Rosemann, M., Eds.; Springer: Berlin/Heidelberg, Germany, 2015; pp. 337–370. ISBN 978-3-642-45099-0. [Google Scholar]
- Korherr, B.; List, B. Extending the EPC with performance measures. In Proceedings of the 2007 ACM Symposium on Applied Computing—SAC ’07; ACM Press: Seoul, Korea, 2007; p. 1265. [Google Scholar]
- Gagne, D.; Trudel, A. Time-BPMN. In Proceedings of the 2009 IEEE Conference on Commerce and Enterprise Computing; IEEE: Vienna, Austria, 2009; pp. 361–367. [Google Scholar]
- Saeedi, K.; Zhao, L.; Sampaio, P.R.F. Extending BPMN for Supporting Customer-Facing Service Quality Requirements. In Proceedings of the 2010 IEEE International Conference on Web Services; IEEE: Miami, FL, USA, 2010; pp. 616–623. [Google Scholar]
- Bocciarelli, P.; D’Ambrogio, A. A BPMN Extension for Modeling Non Functional Properties of Business Processes. In Proceedings of the Spring Simulation Multi-conference, SpringSim; ACM, Boston, MA, USA, 3–7 April 2011. [Google Scholar]
- Stroppi, L.J.R.; Chiotti, O.; Villarreal, P.D. Defining the resource perspective in the development of processes-aware information systems. Inf. Softw. Technol. 2015, 59, 86–108. [Google Scholar] [CrossRef]
- Bocciarelli, P.; D’Ambrogio, A.; Giglio, A.; Paglia, E. A BPMN Extension to Enable the Explicit Modeling of Task Resources; CEUR Workshop Proceedings. In Proceedings of the INCOSE Italia Conference on Systems Engineering, Turin, Italy, 14–16 November 2016; Volume 1728, pp. 40–47. [Google Scholar]
- Heguy, X.; Zacharewicz, G.; Ducq, Y.; Tazi, S.; Vallespir, B. A Performance Measurement Extension for BPMN: One Step Further Quantifying Interoperability in Process Model. In Enterprise Interoperability VIII; Popplewell, K., Thoben, K.-D., Knothe, T., Poler, R., Eds.; Proceedings of the I-ESA Conferences; Springer International Publishing: Cham, Switzerland, 2019; pp. 333–345. ISBN 978-3-030-13692-5. [Google Scholar]
- Cardoso, J.; Sheth, A.; Miller, J.; Arnold, J.; Kochut, K. Quality of service for workflows and web service processes. J. Web Semant. 2004, 1, 281–308. [Google Scholar] [CrossRef]
- Ducq, Y.; Vallespir, B. Definition and aggregation of a performance measurement system in three aeronautical workshops using the ECOGRAI method. Prod. Plan. Control 2005, 16, 163–177. [Google Scholar] [CrossRef]
- Posada, J.; Wundrak, S.; Stork, A.; Toro, C. Semantically Controlled LMV Techniques for Plant Design Review. In Proceedings of the Volume 4: 24th Computers and Information in Engineering Conference; ASMEDC: Salt Lake City, UT, USA, 2004; pp. 329–335. [Google Scholar]
- Rangra, S.; Sallak, M.; Schon, W.; Vanderhaegen, F. A Graphical Model Based on Performance Shaping Factors for Assessing Human Reliability. IEEE Trans. Rel. 2017, 66, 1120–1143. [Google Scholar] [CrossRef]
- Segura, Á.; Diez, H.V.; Barandiaran, I.; Arbelaiz, A.; Álvarez, H.; Simões, B.; Posada, J.; García-Alonso, A.; Ugarte, R. Visual computing technologies to support the Operator 4.0. Comput. Ind. Eng. 2020, 139, 105550. [Google Scholar] [CrossRef]
- Moore, P.V.; Briken, K.; Engster, F. Machines & Measure. SSRN J. 2020, 44, 139–144. [Google Scholar]
- Dodaro, G.L. GAO/AIMD-98-89 IT Performance Measurement; United States General Accounting Office, 1998. Available online: https://www.gao.gov/special.pubs/ai98089.pdf (accessed on 29 June 2020).
- Ougaabal, K.; Zacharewicz, G.; Ducq, Y.; Tazi, S. Distinguishing Resource Type in Bpmn Workflows at Simulation Phase. In Proceedings of the Theory and Foundations of Modeling and Simulation (TMS 2019); Society for Modeling and Simulation International (SCS): Tucson, AZ, USA, 2019. [Google Scholar]
- Scowen, R.S. Extended BNF—A Generic Base Standard; Software Engineering Standards Symposium, 1998; Volume 3, pp. 2–6. Available online: https://www.cl.cam.ac.uk/~mgk25/iso-14977.pdf (accessed on 29 June 2020).
- Polancic, G. BPMN 2.0 Task Types Explained. Available online: https://fr.slideshare.net/JoevanSantos/bpmn-20tasktypesexplained (accessed on 29 June 2020).
- Paglia, E. Innovative Approaches for Business Process Modeling and Simulation. Ph.D. Thesis, University of Rome “Tor Vergata”, Rome, Italy, 2017. [Google Scholar]
- Russell, N.; van der Aalst, W.M.P.; ter Hofstede, A.H.M.; Edmond, D. Workflow Resource Patterns: Identification, Representation and Tool Support. In Active Flow and Combustion Control 2018; King, R., Ed.; Notes on Numerical Fluid Mechanics and Multidisciplinary Design; Springer International Publishing: Berlin/Heidelberg, Germany, 2005; Volume 141, pp. 216–232. ISBN 978-3-319-98176-5. [Google Scholar]
- Awad, A.; Grosskopf, A.; Meyer, A.; Weske, M. Enabling Resource Assignment Constraints in BPMN; Technical Report; Hasso Plattner Institute: Berlin, Germany, 2009. [Google Scholar]
- Vasilecas, O.; Laureckas, E.; Rima, A. Analysis of Using Resources in Business Process Modeling and Simulation. Appl. Comput. Syst. 2014, 16, 19–25. [Google Scholar] [CrossRef][Green Version]
- Domingos, D.; Respício, A.; Martinho, R. Using Resource Reliability in BPMN Processes. Procedia Comput. Sci. 2016, 100, 1280–1288. [Google Scholar] [CrossRef]
- Camara, M.S.; Ducq, Y.; Dupas, R. A methodology for the evaluation of interoperability improvements in inter-enterprises collaboration based on causal performance measurement models. Int. J. Comput. Integr. Manuf. 2014, 27, 103–119. [Google Scholar] [CrossRef]
- Saaty, R.W. The analytic hierarchy process—What it is and how it is used. Math. Model. 1987, 9, 161–176. [Google Scholar] [CrossRef]
- Bocciarelli, P.; D’Ambrogio, A.; Giglio, A.; Paglia, E. Modeling Resources to Simulate Business Process Reliability. ACM Trans. Model. Comput. Simul. 2020, 30, 1–25. [Google Scholar] [CrossRef]
- Smithers, T.; Posada, J.; Stork, A.; Pianciamore, M.; Ferreira, N.; Grimm, S.; Jimenez, I.; Di Marca, S.; Marcos, G.; Mauri, M.; et al. Information Management and Knowledge Sharing in WIDE; European Workshop on the Integration of Knowledge, Semantics and Digital Media Technology: London, UK, 2004. [Google Scholar]


| Configuration | Time | Reliability |
|---|---|---|
 | ||
 | ||
 |
| Profile of an Evaluator | Availability | Skills | Performance | Results | |||||||
|---|---|---|---|---|---|---|---|---|---|---|---|
| Workload | Business Skill | Computer Skill | Speed of Execution | Task Accuracy | |||||||
| Score | Weight | Score | Weight | Score | Weight | Score | Weight | Score | Weight | ||
| Experienced Evaluator | 1 | 2 | 2 | 2 | 2 | 1 | 2 | 4 | 2 | 2 | 1.82 |
| Inexperienced Evaluator | 1 | 2 | 0 | 2 | 1 | 1 | 0 | 4 | 2 | 2 | 0.64 |
| Tasks | Average Execution Time | Experienced Eval | Inexperienced Eval |
|---|---|---|---|
| Assess Store | 720 | 396 | 1125 |
| Fill Excel Template | 61 | 34 | 95 |
| Fill Evaluation Request | 31 | 17 | 48 |
| Field | Filling Time | Description | Improvement | Filling Time |
|---|---|---|---|---|
| Responsible of Legal opinion (Text Field) | 15 s | The name is filled manually, filling it automatically saves time | Filled automatically | 0 s |
| Evaluation Type (Text field) | 15 s | The evaluation type is filled manually, picking a choice instead would save time | Choice field | 6 s |
| Sales point type (Text field) | 20 s | The sales point type is filled manually, picking a choice instead would save time | Choice field | 6 s |
| Region (Choice field) | 7 s | |||
| City (Choice field) | 20 s | Filter the city field depending on the chosen region would save time | Choice field filtered by region | 10 s |
| Evaluation Analysis | 3520 min | For the evaluation, the supervisor needs to compare this request with previous requests using the same criteria, and also check legal points with the same criteria. To do so they need to search for them manually in the system, which could be time consuming, especially if it is a complex request. For improvement on hand information is displayed on demand depending on the chosen criteria, thus allowing the supervisor to focus on the analysis | On hand Information | 1800 min |
© 2020 by the authors. Licensee MDPI, Basel, Switzerland. This article is an open access article distributed under the terms and conditions of the Creative Commons Attribution (CC BY) license (http://creativecommons.org/licenses/by/4.0/).
Share and Cite
Ougaabal, K.; Zacharewicz, G.; Ducq, Y.; Tazi, S. Visual Workflow Process Modeling and Simulation Approach Based on Non-Functional Properties of Resources. Appl. Sci. 2020, 10, 4664. https://doi.org/10.3390/app10134664
Ougaabal K, Zacharewicz G, Ducq Y, Tazi S. Visual Workflow Process Modeling and Simulation Approach Based on Non-Functional Properties of Resources. Applied Sciences. 2020; 10(13):4664. https://doi.org/10.3390/app10134664
Chicago/Turabian StyleOugaabal, Kawtar, Gregory Zacharewicz, Yves Ducq, and Said Tazi. 2020. "Visual Workflow Process Modeling and Simulation Approach Based on Non-Functional Properties of Resources" Applied Sciences 10, no. 13: 4664. https://doi.org/10.3390/app10134664
APA StyleOugaabal, K., Zacharewicz, G., Ducq, Y., & Tazi, S. (2020). Visual Workflow Process Modeling and Simulation Approach Based on Non-Functional Properties of Resources. Applied Sciences, 10(13), 4664. https://doi.org/10.3390/app10134664