Energy Performance of a High-Rise Residential Building Using Fibre-Reinforced Structural Lightweight Aggregate Concrete


 ,
,  ,
,
Abstract
1. Introduction
2. Literature Review and Background Studies
2.1. Fibre-Reinforced LWAC as a Structural Insulation Building Envelope Material
2.2. Energy Saving Measures of the Building Envelope
2.3. Energy Simulation Programs in Buildings
- (1)
- 3D-building geometry input to define surface areas and orientations to evaluate thermal mass behaviour.
- (2)
- The ability to calculate surface, radiant and air temperatures, humidity, wind and buoyancy air movement, thermal storage, inter-zone conduction, convection and radiation.
- (3)
- Hourly space heating and cooling load and energy balance calculations conducted with hourly weather data.
2.4. Research Contributions
- (1)
- Determine the energy use intensity (EUI) and energy cost savings of mono and hybrid fibre-reinforced LECA-LWAC as an integral structural insulation material as compared to NWC as a building envelope for energy-certified high-rise residential buildings.
- (2)
- Investigate the robustness of the proposed fibre-reinforced LECA-LWAC on energy performance in adverse climatic zones and building orientation.
3. Research Method
3.1. Energy Simulation for LWAC-Reinforced Fibres in a High-Rise Residential Building
- (1)
- The National Building Specification (NBS) has surveyed and placed Revit as the top two based on usage and preference in the construction industry of the UK since 2012 [43].
- (2)
- GBS can analyse all energy efficiency measures with various orientations, types of wall and roof construction, window shade and glazing types, lighting efficiency, occupancy schedule, and different infiltration values simultaneously without having to modify the original geometric model.
- (3)
- (4)
- Revit can communicate seamlessly with GBS through gbXML without any loss of data [47].
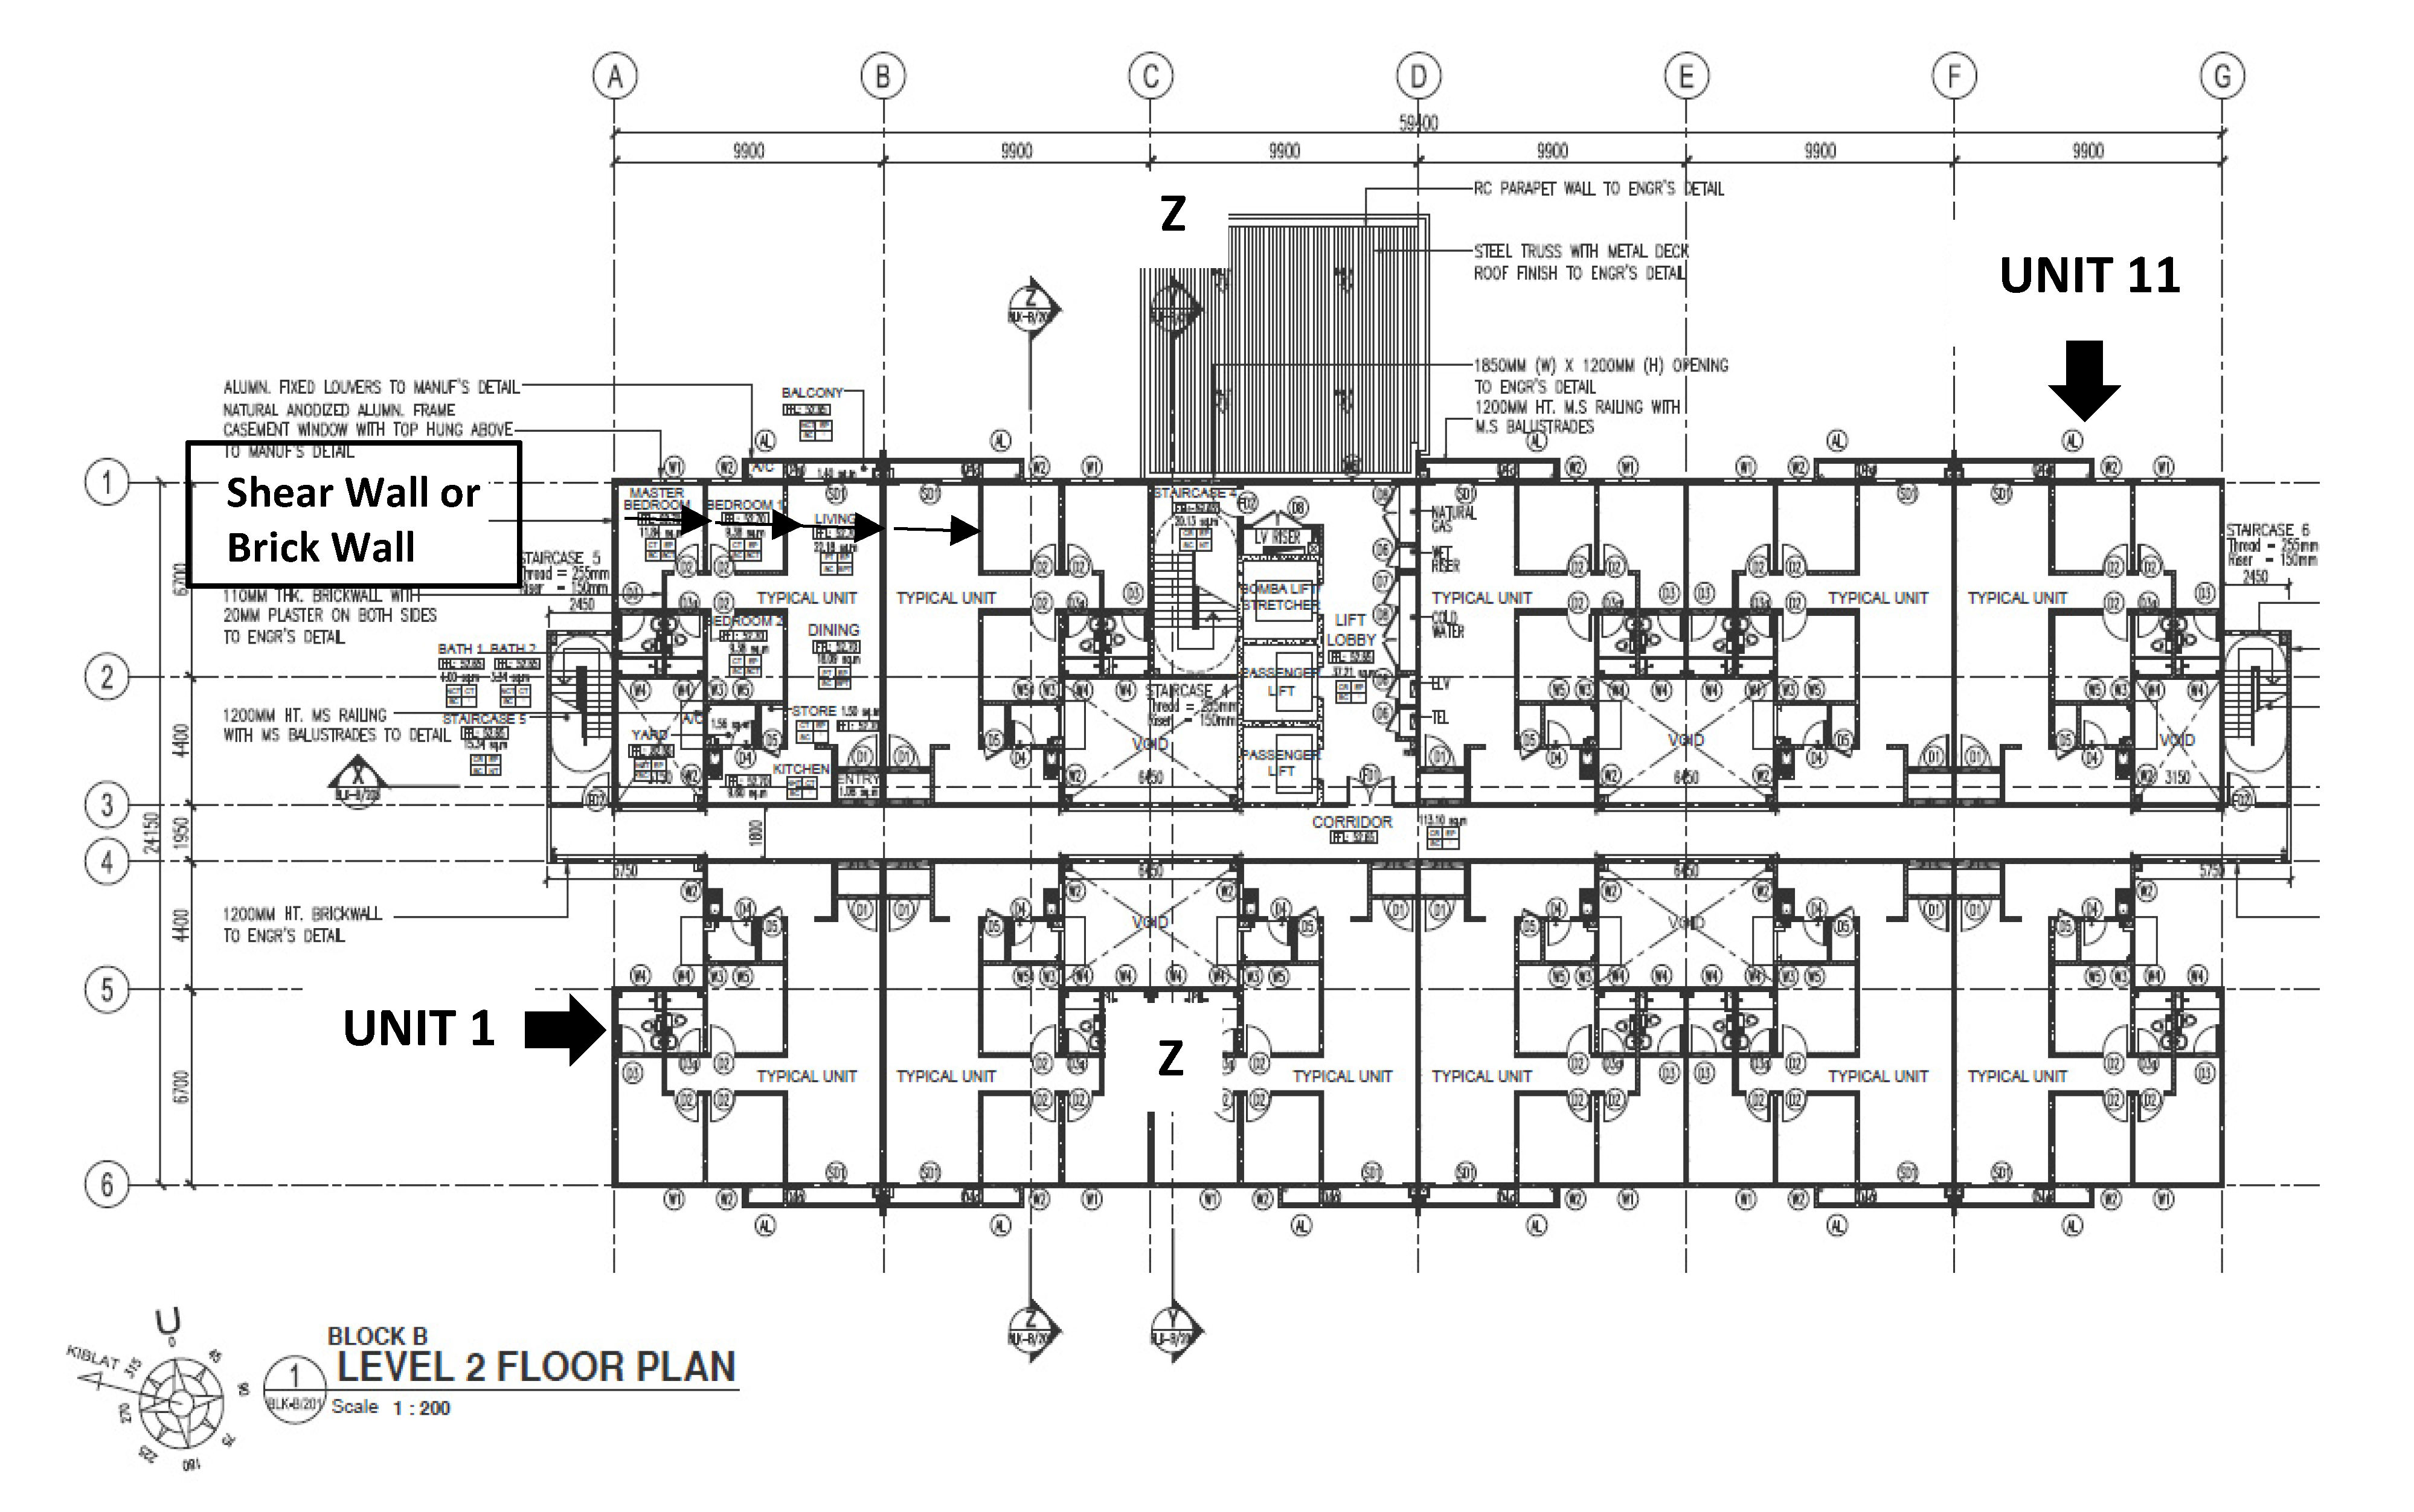
3.2. Energy Modelling in BIM@Autodesk Revit
- (1)
- Floor: 150-mm-thick LECA fibre-reinforced LWAC or NWC floor.
- (2)
- Wall: 150-mm-thick fibre-reinforced LECA-LWAC for shear wall compared with NWC, 100-mm-thick clay brick and sand-cement brick walls 12.5 mm cement mortar on both sides.
- (3)
- Doors: single panel (850 × 2000 mm) for rooms, single flush (762 × 2032 mm), double sliding (1700 × 2000 mm) for balcony and double flush (1700 × 2000 mm) for the storeroom.
- (4)
- Windows: Several types of wall windows were used in this building, including casement with trim (610 × 1220 mm and 410 ×1220 mm) and top hung (300 × 300 mm) for void space in the building.
- (5)
- Roof: Fibre-reinforced LECA-LWAC flat roof slab together with LWAC shear wall or 150-mm-thick NWC flat roof together with NWC shear wall or brick wall.
3.3. Construction Materials for Shear Wall, Floor and Roof in Autodesk@Revit
- (1)
- Thermo-physical properties of fibre-reinforced LECA-LWAC compared with the traditional NWC, sand-cement bricks and clay bricks building materials
- (2)
- Four cities with diverse climates, namely Putrajaya (Malaysia), Makkah (Saudi Arabia), Istanbul (Turkey) and Lillhardal (Sweden)
- (3)
- Building orientation—Base model (0°), 45° and 90°
- (4)
- No window shades and double glazing were used to evaluate the worst-case design scenario.
3.4. Physical and Thermal Properties of the Materials
3.5. Running the Autodesk@Green Building Studio
3.6. Constructive Characteristics of Building Envelope Material
3.7. Climate and Weather Conditions for the Case Study
- (1)
- Tropical (Tropical Rainforest) Climate (Af)—Putrajaya, Malaysia
- (2)
- Temperate (Hot Summer Mediterranean) Climate (Csa)—Istanbul, Turkey
- (3)
- Continental (Sub-Arctic) Climate (Dfc)—Lillhardal, Sweden
- (4)
- Dry (Hot Desert) Climate (BWh)—Makah Al Mukaramah, Saudi Arabia
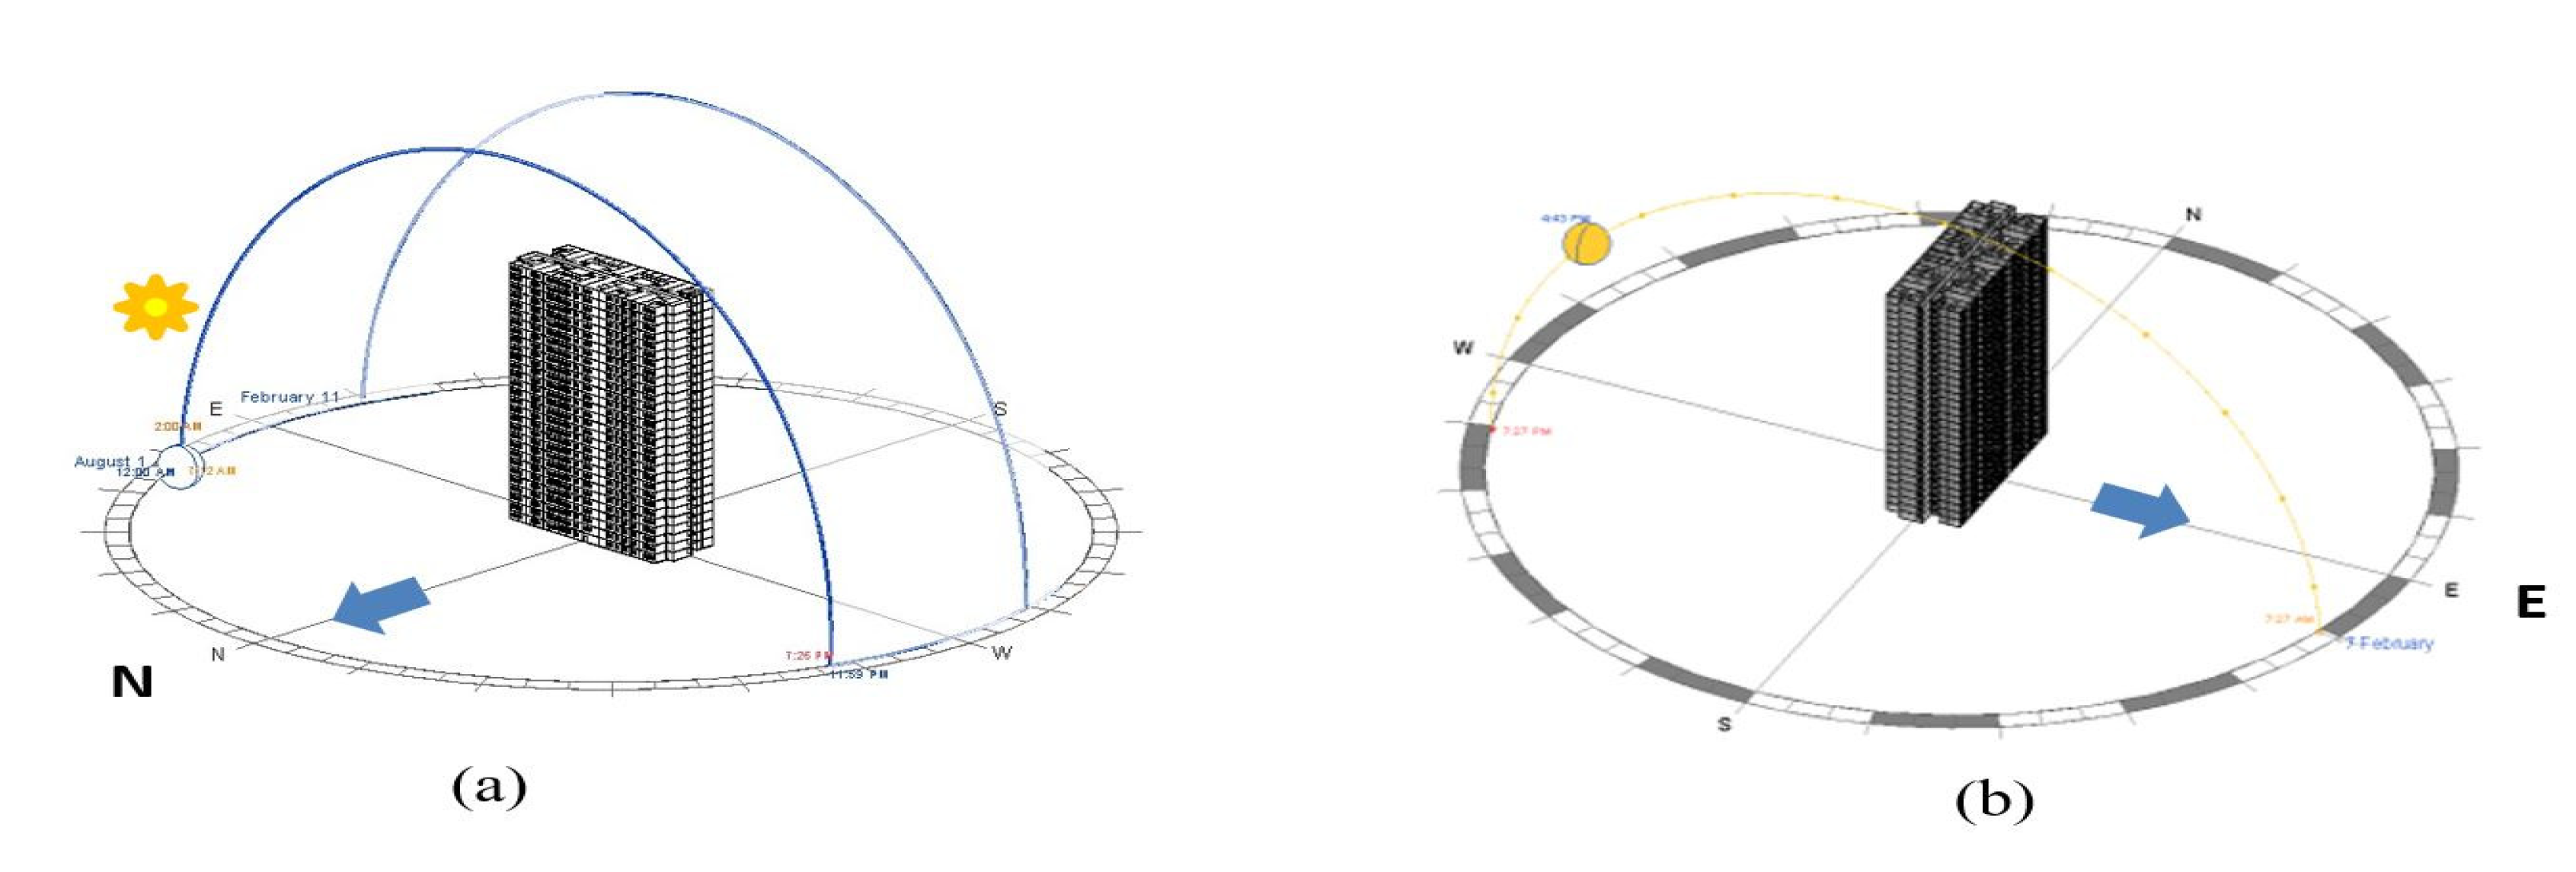
3.8. Effect of Building Orientations
4. Results and Discussion
4.1. Energy Use Intensity (EUI) Performance of Fibre-Reinforced LECA-LWAC
- (1)
- Warm and Hot (ASHRAE 1–3) = 140 kW∙h∙m−2
- (2)
- Mixed (ASHRAE 4) = 159 kW∙h∙m−2
- (3)
- Cool (ASHRAE 5) = 150 kW∙h∙m−2
- (4)
- Cold (ASHRAE 6–7) = 173 kW∙h∙m−2
4.2. Building Energy End Use Analysis
4.2.1. Putrajaya
4.2.2. Makkah
4.2.3. Istanbul
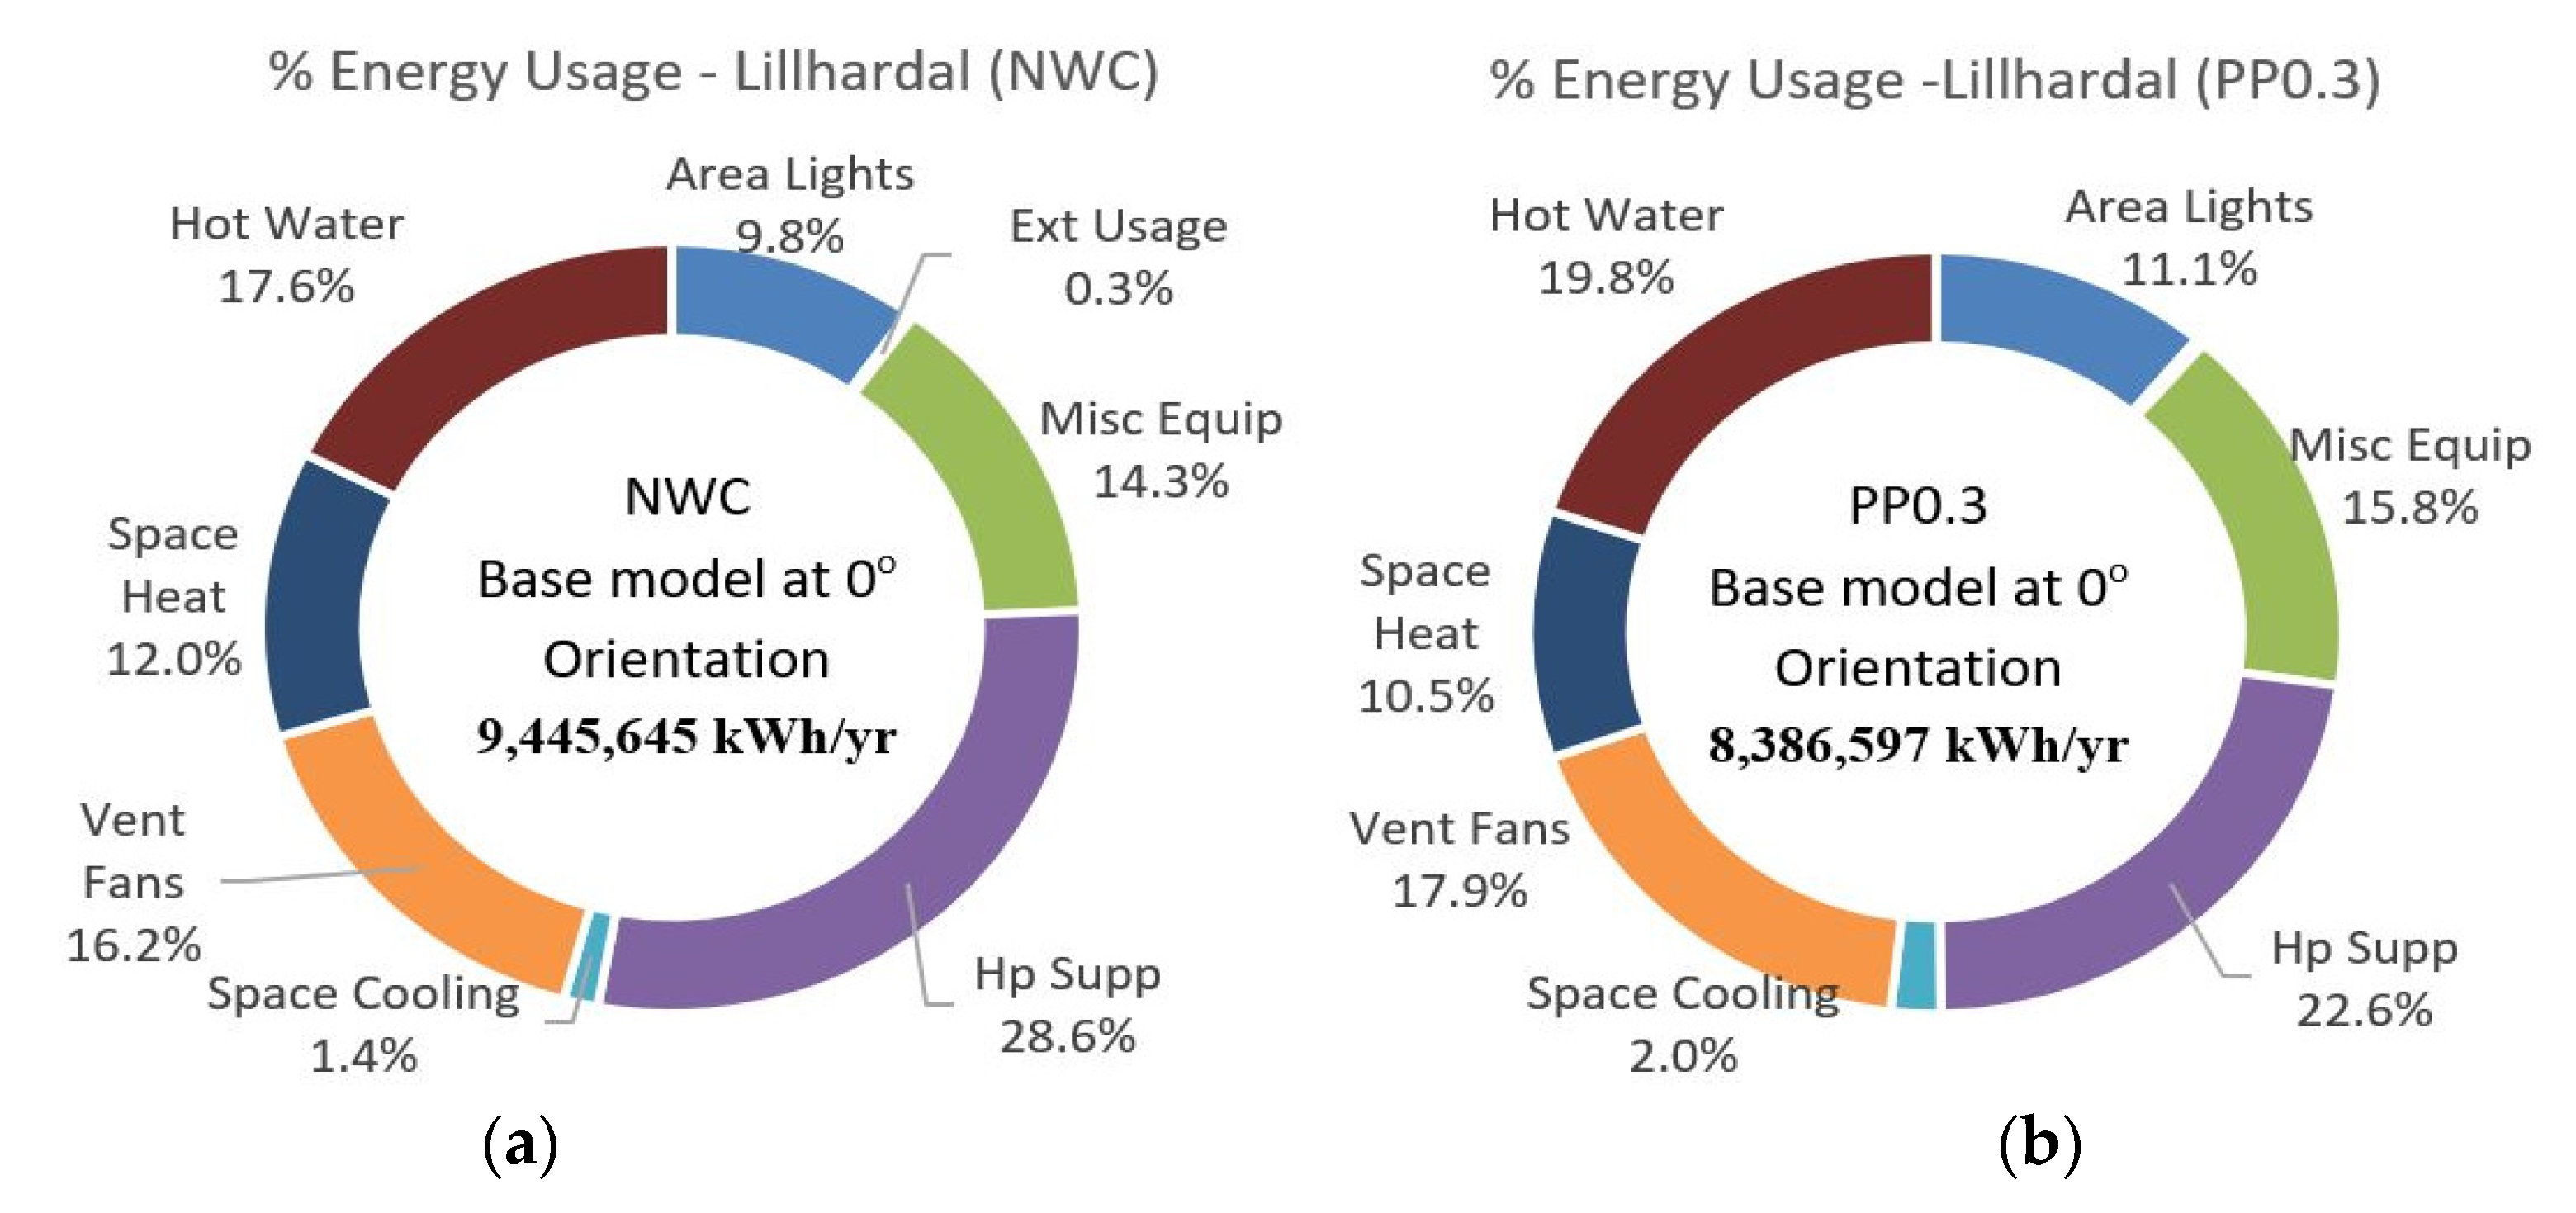
4.2.4. Lillhardal
4.3. Energy Saving of Fibre-Reinforced LECA-LWAC Compared with NWC
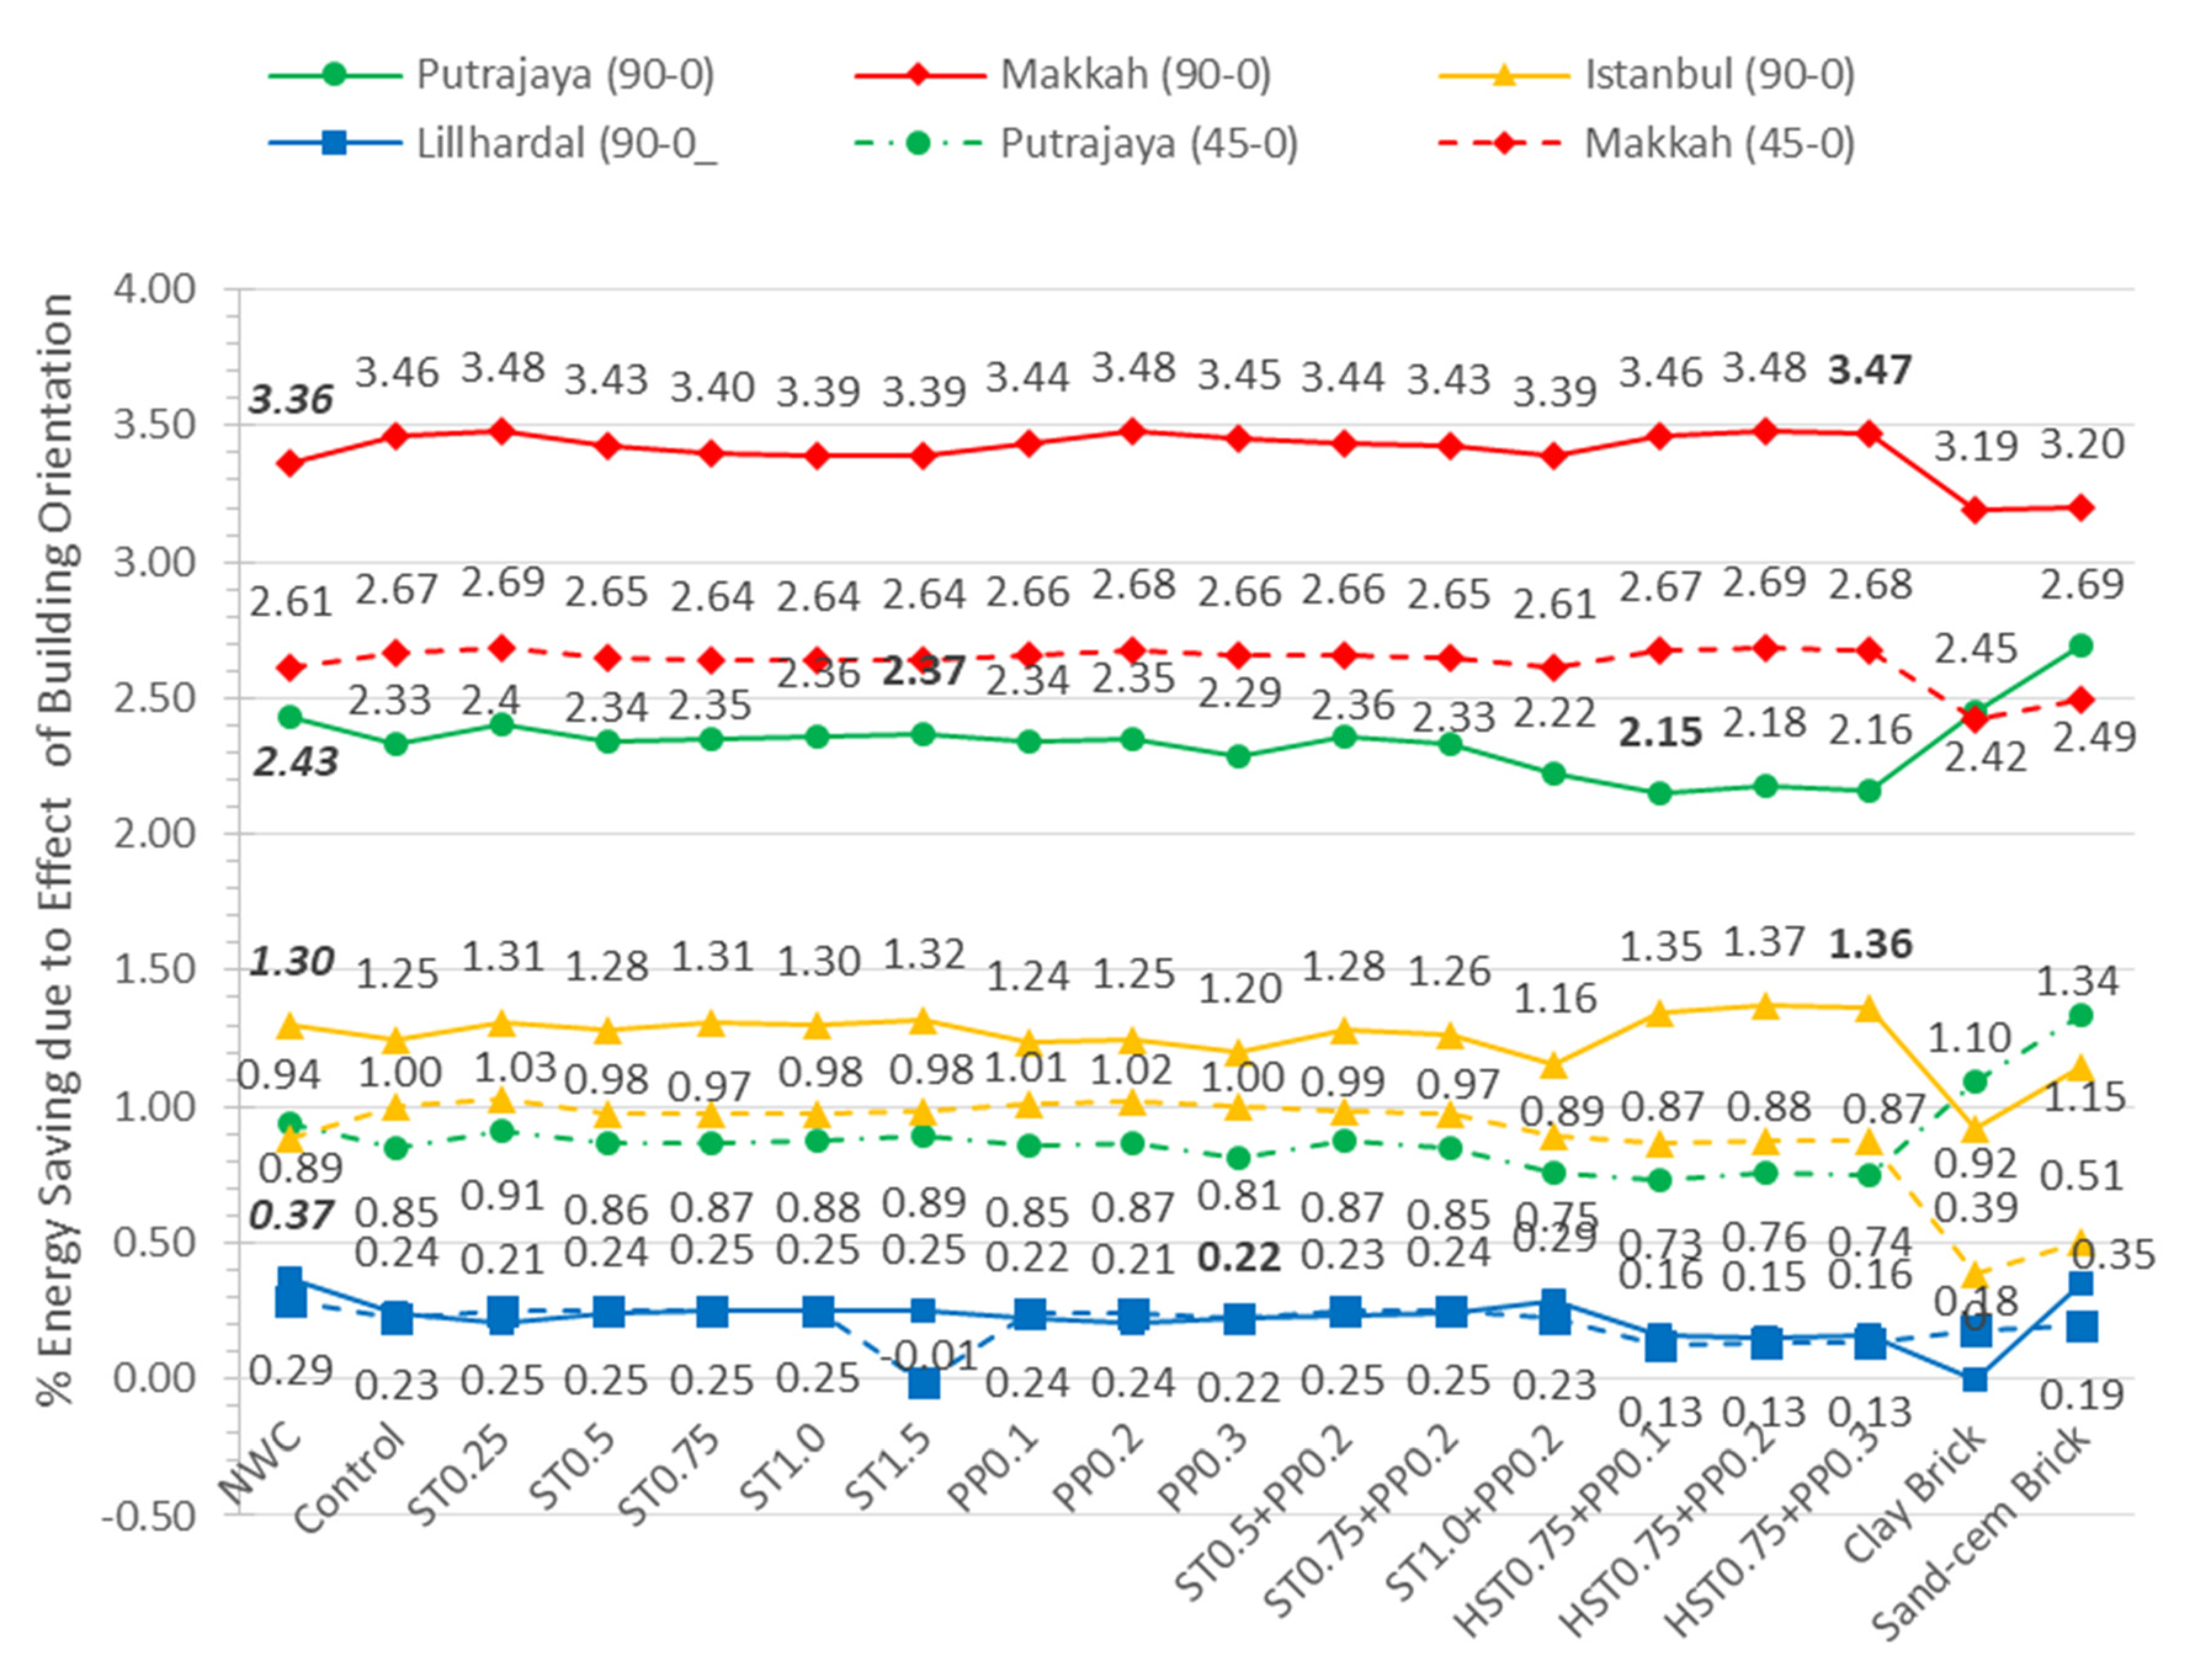
4.4. Effect of Building Orientation on Energy Saving
4.5. Economic Aspects of Energy Saving
5. Conclusions
- (1)
- HST0.75 + PP0.1 has the most efficient EUI performance and cost savings for Putrajaya at 3.19% and 4.04%, respectively, as compared with NWC.
- (2)
- HST0.75 + PP0.3 has the most efficient EUI performance and cost savings for Makkah at 5.86% and 6.46%, respectively, as compared with NWC.
- (3)
- HST0.75 + PP0.3 has the most efficient EUI performance and cost savings for Istanbul at 4.45% and 5.09%, respectively, as compared with NWC.
- (4)
- PP0.3 has the most efficient EUI performance and cost savings for Lillhardal at 12.79% and 12.29%, respectively, as compared with NWC.
- (5)
- The energy and cost savings of the fibre-reinforced envelope material is in the following order based from high to low: HST0.75 + PP hybrid > mono PP > ST + PP0.2 hybrid > mono ST > NWC > Brick for Putrajaya, Makkah and Istanbul, while Lillhardal is mono PP > HST0.75 + PP hybrid > ST + PP0.2 hybrid > mono ST > NWC > Brick.
- (6)
- The use of the integral monolithic structural-insulation fibre-reinforced LWAC in tropical (Putrajaya, Malaysia) and Mediterranean (Istanbul, Turkey) climates meets the certified-EUI requirements of less than 150 kW∙h∙m−2∙year−1 without additional insulation or double-glazing window/shade.
- (7)
- Extreme climatic conditions of sub-arctic (Lillhardal, Sweden) and semi-arid desert climates (Makkah, Saudi Arabia) require additional insulation material with double-glazing windows to meet the LEED-certified green building requirements.
- (8)
- All traditional construction materials, such as NWC, sand-cement brick and clay brick, fail to qualify for the certified-EUI requirements.
- (9)
- The energy-saving measure is driven largely by using fibre-reinforced LECA-LWAC as a building envelope material rather than building orientation.
Author Contributions
Funding
Acknowledgments
Conflicts of Interest
References
- International Energy Agency; Birol, F. World Energy Outlook; International Energy Agency: Paris, France, 2013. [Google Scholar]
- US Department of Energy. Building Energy Databook 2011; D&R International, Ltd.: Silverspring, MD, USA, 2012.
- US Department of Energy. Renewable Energy Data Book National Renewable 2017; National Renewable Energy Laboratory (NREL), Office of Energy Efficiency and Renewable Energy: Washington, DC, USA, 2019.
- Nejat, P.; Jomehzadeh, F.; Taheri, M.M.; Gohari, M.; Muhd, M.Z. A global review of energy consumption, CO2 emissions and policy in the residential sector (with an overview of the top ten CO2 emitting countries). Renew. Sustain. Energy Rev. 2015, 43, 843–862. [Google Scholar] [CrossRef]
- Mooney, G.; Dickie, J.; Scott, G.; Kelly, P. Poverty in Scotland 2014; Scottish Energy Stat. Inf.: London, UK, 2014.
- Perez-Lombard, L.; Ortiz, J.; Coronel, J.F.; Maestre, I.R. A review of HVAC systems requirements in building energy regulations. Energy Build. 2010, 43, 2–3. [Google Scholar] [CrossRef]
- Yang, L.; Yan, H.; Lam, J.C. Thermal comfort and building energy consumption implications-A review. Appl. Energy 2014, 115, 164–173. [Google Scholar] [CrossRef]
- MS 2680: 2014. Energy Efficiency and Use of Renewable Energy for Residential Buildings-Code of Practice; Malaysian Standard: Cyberjaya, Selangor, Malaysia, 2014.
- Mirrahimi, S.; Mohamed, M.F.; Haw, L.C.; Ibrahim, N.L.N.; Yusoff, W.F.M.; Aflaki, A. The effect of building envelope on the thermal comfort and energy saving for high-rise buildings in hot-humid climate. Renew. Sustain. Energy Rev. 2016, 53, 1508–1519. [Google Scholar] [CrossRef]
- Nazir, H.; Batool, M.; Osorio, F.J.B.; Isaza-Ruiz, M.; Xu, X.; Vignarooban, K.; Phelan, P.; Inamuddin; Kannan, A.M. Recent developments in phase change materials for energy storage applications: A review. Int. J. Heat Mass Transf. 2019, 129, 491–523. [Google Scholar] [CrossRef]
- Real, S.; Gomes, M.G.; Rodrigues, A.M.; Bogas, J.A. Contribution of structural lightweight aggregate concrete to the reduction of thermal bridging effect in buildings. Constr. Build. Mater. 2016, 121, 460–470. [Google Scholar] [CrossRef]
- Asadi, I.; Shafigh, P.; Hassan, Z.F.A.; Mahyuddin, N. Thermal conductivity of concrete–A review. J. Build. Eng. 2018, 20, 81–93. [Google Scholar] [CrossRef]
- Manioğlu, G.; Yılmaz, Z. Energy efficient design strategies in the hot dry area of Turkey. Build. Environ. 2008, 43, 1301–1309. [Google Scholar] [CrossRef]
- Ma, P.; Wang, L.S. Effective heat capacity of interior planar thermal mass (iPTM) subject to periodic heating and cooling. Energy Build. 2012, 47, 44–52. [Google Scholar] [CrossRef]
- Real, S.; Bogas, J.A.; Gomes, M.G.; Ferrer, B. Thermal conductivity of structural lightweight aggregate concrete. Mag. Concr. Res. 2016, 68, 798–808. [Google Scholar] [CrossRef]
- Nagy, B.; Nehme, S.G.; Szagri, D. Thermal properties and modeling of fibre-reinforced concretes. Energy Procedia 2015, 78, 2742–2747. [Google Scholar] [CrossRef]
- Gül, R.; Okuyucu, E.; Türkmen, I.; Aydın, A.C. Thermo-mechanical properties of fibre reinforced raw perlıte concrete. Mater. Lett. 2007, 61, 5145–5149. [Google Scholar] [CrossRef]
- Grabois, T.M.; Cordeiro, G.C.; Filho, R.D.T. Fresh and hardened-state properties of self-compacting lightweight concrete reinforced with steel fibres. Constr. Build. Mater. 2016, 104, 284–292. [Google Scholar] [CrossRef]
- Cheung, C.K.; Fuller, R.J.; Luther, M.B. Energy-efficient envelope design for high-rise apartments. Energy Build. 2005, 37, 37–48. [Google Scholar] [CrossRef]
- Sadineni, S.B.; Madala, S.; Boehm, R.F. Passive building energy savings: A review of building envelope components. Renew. Sustain. Energy Rev. 2011, 15, 3617–3631. [Google Scholar] [CrossRef]
- Sutcu, M. Influence of expanded vermiculite on physical properties and thermal conductivity of clay bricks. Ceram. Int. 2015, 41, 2819–2827. [Google Scholar] [CrossRef]
- Shah, A.A.; Ribakov, Y. Recent trends in steel fibreed high-strength concrete. Mater. Des. 2011, 32, 4122–4151. [Google Scholar] [CrossRef]
- Bano, F.; Sehgal, V. A Comparative Study: Energy Performance Analysis of Conventional Office Buildings at Lucknow. J. Des. Built Environ. 2020, 20, 24–34. [Google Scholar]
- Shafigh, P.; Asadi, I.; Mahyuddin, N.B. Concrete as a thermal mass material for building applications-A review. J. Build. Eng. 2018, 19, 14–25. [Google Scholar] [CrossRef]
- Wei, S.; Yiqiang, C.; Yunsheng, Z.; Jones, M.R. Characterization and simulation of microstructure and thermal properties of foamed concrete. Constr. Build. Mater. 2013, 47, 1278–1291. [Google Scholar] [CrossRef]
- Jin, X.; Zhang, X.; Cao, Y.; Wang, G. Thermal performance evaluation of the wall using heat flux time lag and decrement factor. Energy Build. 2012, 47, 369–374. [Google Scholar] [CrossRef]
- Yunsheng, X.; Chung, D.D.L. Effect of sand addition on the specific heat and thermal conductivity of cement. Cem. Concr. Res. 2000, 30, 59–61. [Google Scholar]
- Fathipour, R.; Hadidi, A. Analytical solution for the study of time lag and decrement factor for building walls in climate of Iran. Energy 2017, 134, 167–180. [Google Scholar] [CrossRef]
- Roberz, F.; Loonen, R.C.G.M.; Hoes, P.; Hensen, J.L.M. Ultra-lightweight concrete: Energy and comfort performance evaluation in relation to buildings with low and high thermal mass. Energy Build. 2017, 138, 432–442. [Google Scholar] [CrossRef]
- Ramponi, R.; Gaetaniand, I.; Angelotti, A. Influence of the urban environment on the effectiveness of natural night-ventilation of an office building. Energy Build. 2014, 78, 24–34. [Google Scholar] [CrossRef]
- Navarro, L.; Gracia, A.; Niall, D.; Castell, A.; Browne, M.; Mccormack, S.J.; Griffiths, P.; Cabeza, L.F. Thermal energy storage in building integrated thermal systems: A review. Part 2. Integration as passive system. Renew. Energy 2016, 85, 1334–1356. [Google Scholar] [CrossRef]
- Chiraratananon, S.; Hien, V.D. Thermal performance and cost effectiveness of massive walls under Thai climate. Energy Build. 2011, 43, 1655–1662. [Google Scholar] [CrossRef]
- Al-Sanea, S.A.; Zedan, M.F. Improving thermal performance of building walls by optimizing insulation layer distribution and thickness for same thermal mass. Appl. Energy 2011, 88, 3113–3124. [Google Scholar] [CrossRef]
- Hoes, P.; Trcka, M.; Hensen, J.L.M. Investigating the potential of a novel low-energy house concept with hybrid adaptable thermal storage. Energy Convers. Manag. 2011, 52, 2442–2447. [Google Scholar] [CrossRef]
- Crawley, D.B.; Hand, J.W.; Kummert, M.; Griffith, B.T. Contrasting the capabilities of building energy performance simulation programs. Build. Environ. 2008, 43, 661–673. [Google Scholar] [CrossRef]
- Shivsharan, A.S.; Vaidya, D.R.; Shinde, P.R.D. 3D Modeling and Energy Analysis of a Residential Building using BIM Tools. Int. Res. J. Eng. Technol. 2017, 4, 629–636. [Google Scholar]
- Andjelkovic, B.V.; Stojanovic, B.; Stojiljković, M. Thermal mass impact on energy performance of a low, medium and heavy mass building in Belgrade. Therm. Sci. 2012, 16, 447–459. [Google Scholar] [CrossRef]
- Bahar, Y.N.; Pere, C.; Landrieu, J.; Nicolle, C. A Thermal Simulation Tool for Building and Its Interoperability through the Building Information Modeling (BIM) Platform. Buildings 2013, 3, 380–398. [Google Scholar] [CrossRef]
- Reeves, T.; Olbina, S.; Issa, R.R.A. Guidelines for Using Building Information Modeling for Energy Analysis of Buildings. Buildings 2015, 5, 1361–1388. [Google Scholar] [CrossRef]
- Mostafavi, N.; Farzinmoghadam, M.; Hoque, S. Envelope retrofit analysis using eQUEST, IESVE Revit Plug-in and Green Building Studio: A university dormitory case study. Int. J. Sustain. Energy 2015, 34, 594–613. [Google Scholar] [CrossRef]
- ASTM C518-98. Standard Test Method for Steady-State Thermal Transmission Properties by Means of Heat Flow Meter Apparatus; ASTM: West Conshohocken, PA, USA, 1998. [Google Scholar]
- ASTM C1784-14. Standard Test Method for Using a Heat Flow Meter Apparatus for Measuring Thermal Storage Properties of Phase Change Materials and Products; ASTM: West Conshohocken, PA, USA, 2014. [Google Scholar]
- NBS National BIM Report 2017. Newcastle upon Tyne, England. Available online: https://www.thenbs.com/knowledge/nbs-national-bim-report-2017 (accessed on 15 January 2020).
- Lagüela, S.; Díaz-Vilariño, L.; Armesto, J.; Arias, P. Non-destructive approach for the generation and thermal characterization of an as-built BIM. Construct. Build. Mater. 2014, 51, 55–61. [Google Scholar] [CrossRef]
- Shirowzhan, S.; Sepasgozar, S.M.; Edwards, D.J.; Li, H.; Wang, C. BIM compatibility and its differentiation with interoperability challenges as an innovation factor. Autom. Constr. 2020, 112, 103086. [Google Scholar] [CrossRef]
- Ham, Y.; Golparvar-Fard, M. Mapping actual thermal properties to building elements in gbXML-based BIM for reliable building energy performance modeling. Autom. Constr. 2015, 49, 214–224. [Google Scholar] [CrossRef]
- Abanda, F.H.; Byers, L. An investigation of the impact of building orientation on energy consumption in a domestic building using emerging BIM (Building Information Modelling). Energy 2016, 97, 517–527. [Google Scholar] [CrossRef]
- ANSI/ASHRAE/IES Standard 90.1-2019. Energy Standard for Buildings Except Low-Rise Residential Buildings; American Society of Heating, Refrigerating and Air-Conditioning Engineers, Inc.: Atlanta, GA, USA, 2019. [Google Scholar]
- ANSI/ASHRAE/IES Standard 90.2-2019. Energy-Efficient Design of Low-Rise Residential Buildings; American Society of Heating, Refrigerating and Air-Conditioning Engineers, Inc.: Atlanta, GA, USA, 2019. [Google Scholar]
- Autodesk BPA Help. The Source of the GBS Diagram in Building Performance Analysis Help is Available under a Creative Commons Attribution-NonCommercial-Share Alike license. Copyright © Autodesk, Inc. Used with Permission. Available online: http://help.autodesk.com/view/BUILDING_PERFORMANCE_ANALYSIS/ENU/?guid=GUID-5A8177DA-2E16-44B5-A0D6-0BD20BB48081 (accessed on 20 December 2019).
- Peel, M.C.; Finlayson, B.L.; McMahon, T.A. World map of the Köppen-Geiger climate classification updated. Hydrol. Earth Syst. Sci. 2007, 11, 1633–1644. [Google Scholar] [CrossRef]
- Climate-Data (2019) website. Available online: https://en.climate-data.org (accessed on 15 November 2019).
- Mohareb, E.A.; Kennedy, C.A.; Harvey, L.D.D.; Pressnail, K.D. Decoupling of building energy use and Climate. Energy Build. 2011, 43, 2961–2963. [Google Scholar] [CrossRef]
- Suzaini, M.Z.; Amir, K. Energy Prediction versus Energy Performance of Green Buildings in Malaysia. Comparison of Predicted and Operational Measurement of GBI Certified Green Office in Kuala Lumpur. MATEC Web Conf. 2016, 66, 00071. [Google Scholar]
- Li, C.; Hong, T.; Yan, D. An Insight into Actual Energy Use and Its Drivers in High-Performance Buildings. Appl. Energy 2014, 131, 394–410. [Google Scholar] [CrossRef]
- Addressing Energy Sustainability Issues in the Buildings Sector in The Arab Region; Economic and Sosial Commission for Western Asia (ESCWA) E/ESCWA/SDPD/2,018/TP.5; United Nations Publication: Beirut, Lebanon, 2018.
- Ahmed, W.; Asif, M.; Alrashed, F. Application of Building Performance Simulation to Design Energy-Efficient Homes: Case Study from Saudi Arabia. Sustainability 2019, 11, 6048. [Google Scholar] [CrossRef]
- Mahlia, T.M.I.; Chan, P.L. Life cycle cost analysis of fuel cell-based cogeneration system for residential application in Malaysia. Renew. Sustain. Energy Rev. 2011, 15, 416–426. [Google Scholar] [CrossRef]
- Shabunko, V.; Lim, C.M.; Mathew, S. EnergyPlus models for the benchmarking of residential buildings in Brunei Darussalam. Energy Build. 2018, 169, 507–516. [Google Scholar] [CrossRef]
- TNB Domestic Tariff Pricing. Available online: https://www.tnb.com.my/residential/pricing-tariffs/ (accessed on 17 August 2019).
- GAS Malaysia Tariff Rates. Available online: https://www.gasmalaysia.com/index.php/our-services/at-your-service/bills-payments/tariff-rates (accessed on 17 August 2019).
- SEC. Saudi Electricity Company Tariff Rates. Available online: https://www.se.com.sa/en-us/Customers/Pages/TariffRates.aspx (accessed on 20 January 2020).
- Kingdom of Saudi Arabia Customs, Rules, Tariffs and Regulation Handbook; International Business Publications: Alexandria, VA, USA, 2016.
- Statista Online Data Year 2016. Available online: https://www.statista.com/statistics/643374/electricity-prices-for-households-in-turkey/ (accessed on 28 January 2020).
- Statista Online Data Year 2018. Available online: https://www.statista.com/statistics/640163/natural-gas-prices-for-households-in-turkey/ (accessed on 28 January 2020).
- Statista Online Data Year 2019. Available online: https://www.statista.com/statistics/418124/electricity-prices-for-households-in-sweden/ (accessed on 28 January 2020).
- Statista Online Data Year 2017. Available online: https://www.statista.com/statistics/418044/natural-gas-prices-for-households-in-sweden/ (accessed on 28 January 2020).


| Parameter | Value |
|---|---|
| Occupancy Schedule | Residential |
| People Sensible Heat Gain (W∙person−1) | 73.3 |
| People Latent Heat Gain (W∙person−1) | 58.6 |
| Lighting Load Density (W∙m−2) | 6.5 |
| Equipment Load Density (W∙m−2)) | 5.4 |
| Infiltration Flow (ACH) 1 | 0.4 |
| Outside Air (Ventilation Air) Flow per person (L∙s−1) | Null |
| Outside Air (Ventilation Air) Flow per area (m3∙h−1∙m−2) | 1.3 |
| Unoccupied Cooling Set Point (°C) | 29.4 |
| Materials Type | Thickness, t (mm) | Density, ρ kg∙m−3 | Thermal Conductivity, k W∙m−1∙K−1 | Specific Heat Cp J∙kg−1∙K−1 | Thermal Diffusivity, α mm2∙s−1 | U-Value W∙m−2∙K−1 |
|---|---|---|---|---|---|---|
| Mono ST Fibre Category | ||||||
| ST0 | 150 | 1831 | 1.144 | 893 | 0.706 | 3.321 |
| ST0.25 | 150 | 1847 | 1.194 | 865 | 0.738 | 3.383 |
| ST0.50 | 150 | 1865 | 1.307 | 932 | 0.750 | 3.511 |
| ST0.75 | 150 | 1909 | 1.337 | 919 | 0.786 | 3.544 |
| ST1.00 | 150 | 1934 | 1.375 | 914 | 0.800 | 3.583 |
| ST1.50 | 150 | 1951 | 1.407 | 908 | 0.830 | 3.615 |
| Mono PP Fibre Category | ||||||
| PP0.1 | 150 | 1776 | 1.111 | 906 | 0.698 | 3.279 |
| PP0.2 | 150 | 1759 | 1.090 | 896 | 0.698 | 3.251 |
| PP0.3 | 150 | 1688 | 0.989 | 930 | 0.659 | 3.110 |
| Hybrid ST+ PP0.2 Fibre Category | ||||||
| ST0.5 + PP0.2 | 150 | 1815 | 1.273 | 942 | 0.778 | 3.476 |
| ST0.75 + PP0.2 | 150 | 1854 | 1.280 | 943 | 0.744 | 3.484 |
| ST1.0 + PP0.2 | 150 | 1916 | 1.285 | 989 | 0.744 | 3.489 |
| Hybrid HST0.75+ PP Fibre Category | ||||||
| HST0.75 + PP0.1 | 150 | 1869 | 1.269 | 938 | 0.743 | 3.471 |
| HST0.75 + PP0.2 | 150 | 1857 | 1.251 | 916 | 0.755 | 3.451 |
| HST0.75 + PP0.3 | 150 | 1870 | 1.251 | 921 | 0.709 | 3.451 |
| Traditional Construction Materials | ||||||
| NWC | 150 | 2314 | 2.250 | 924 | 1.019 | 4.228 |
| Sand-Cement +CM | 125 | 1929 | 1.200 | 872 | 0.764 | 3.797 |
| Clay + CM | 125 | 1715 | 0.646 | 754 | 0.488 | 2.987 |
| Mortar (CM) | 12.5 | 2125 | 2.465 | 941 | 1.232 | - |
| Parameter | Value |
|---|---|
| Window type—Casement Window | 1/8-inch Pilkington Single Glazing |
| Panel Dimensions (H × W) | 1220 mm × 610 mm |
| Front Window-Wall Ratio | 18.8% |
| Corridor Window-Wall Ratio | 11.7% |
| Visual Light Transmittance | 0.9000 |
| Solar Heat Gain Coefficient | 0.7800 |
| U-Value (W∙m−2∙K−1) | 3.6886 |
| R-Value (m2∙K∙W−1) | 0.2711 |
| Simulation Option for Building Envelope Components—Construction Materials Building footprint =40,102.4 m2, Geometry = Rectangular, No of Floors = 29 Orientation of baseline model = Front elevation facing north (0° orientation) | |||||
| Envelope Material Option | Mono Fibre LECA-LWAC Configuration 1 | Hybrid Fibre LECA-LWAC Configuration 2 | NWC | Sand-cement brick wall | Clay brick wall |
| Wall Type | ST or PP LECA-LWAC | ST − PP LECA-LWAC | NWC | Sand-cement Brick | Clay Brick |
| Floor Type | ST or PP LECA-LWAC | ST + PP LECA-LWAC | NWC | NWC | NWC |
| Roof Type | ST or PP LECA-LWAC | ST + PP LECA-LWAC | NWC | NWC | NWC |
| Window Type | Aluminium frame glass window | Aluminium frame glass window | Aluminium frame glass window | Aluminium frame glass window | Aluminium frame glass window |
| Structural System | Shear Wall 3 | Shear Wall 3 | Shear Wall 3 | Rigid Frame 4 | Rigid Frame 4 |
| Location | Putrajaya (Tropical Rainforest at 28 °C) | Makkah (Hot Arid Desert at 30 °C) | ||||||||
|---|---|---|---|---|---|---|---|---|---|---|
| EUI at Building Orientation kW∙h∙m−2 | EUI at 0° Orientation—Base Model kW∙h∙m−2 | EUI at 45° Orientation kW∙h∙m−2 | EUI at 90° Orientation kW∙h∙m−2 | EUI at 0–90% Savings Due to Orientation | EUI at 90% Savings against NWC | EUI at 0° Orientation—Base Model kW∙h∙m−2 | EUI at 45° Orientation kW∙h∙m−2 | EUI at 90° Orientation kW∙h∙m−2 | 0–90% Savings Due to Orientation | EUI at 90% Savings against NWC |
| NWC | 148.1 | 149.5 | 151.7 | 2.43 | - | 163.7 | 167.9 | 169.1 | 3.36 | - |
| Control | 145.0 | 146.3 | 148.4 | 2.33 | 2.18 | 155.3 | 159.5 | 160.7 | 3.46 | 4.96 |
| ST0.25 | 145.5 | 146.8 | 149.0 | 2.40 | 1.77 | 156.1 | 160.3 | 161.5 | 3.48 | 4.47 |
| ST0.5 | 145.7 | 146.9 | 149.1 | 2.34 | 1.72 | 156.6 | 160.8 | 162.0 | 3.43 | 4.22 |
| ST0.75 | 145.8 | 147.0 | 149.2 | 2.35 | 1.63 | 158.9 | 163.1 | 164.3 | 3.40 | 2.81 |
| ST1.0 | 146.0 | 147.2 | 149.4 | 2.36 | 1.52 | 159.3 | 163.5 | 164.7 | 3.39 | 2.62 |
| ST1.5 | 146.1 | 147.4 | 149.6 | 2.37 | 1.39 | 159.6 | 163.8 | 165.0 | 3.39 | 2.45 |
| PP0.1 | 144.9 | 146.2 | 148.3 | 2.34 | 2.27 | 157.1 | 161.3 | 162.5 | 3.44 | 3.88 |
| PP0.2 | 144.9 | 146.1 | 148.3 | 2.35 | 2.27 | 155.0 | 159.2 | 160.4 | 3.48 | 5.15 |
| PP0.3 | 144.1 | 145.3 | 147.4 | 2.29 | 2.87 | 155.7 | 159.9 | 161.1 | 3.45 | 4.75 |
| ST0.5 + PP0.2 | 145.6 | 146.8 | 149.0 | 2.36 | 1.75 | 156.4 | 160.6 | 161.8 | 3.44 | 4.31 |
| ST0.75 + PP0.2 | 145.5 | 146.8 | 148.9 | 2.33 | 1.85 | 156.3 | 160.5 | 161.7 | 3.43 | 4.40 |
| ST1.0 + PP0.2 | 145.1 | 146.2 | 148.3 | 2.22 | 2.29 | 155.7 | 159.8 | 161.0 | 3.39 | 4.81 |
| HST0.75 + PP0.1 | 143.9 | 145.0 | 147.0 | 2.15 | 3.19 | 153.9 | 158.0 | 159.2 | 3.46 | 5.85 |
| HST0.75 + PP0.2 | 144.0 | 145.1 | 147.1 | 2.18 | 3.11 | 153.9 | 158.1 | 159.3 | 3.48 | 5.79 |
| HST0.75 + PP0.3 | 143.9 | 145.0 | 147.0 | 2.16 | 3.18 | 153.9 | 158.0 | 159.2 | 3.47 | 5.86 |
| Clay Brick | 148.6 | 150.2 | 152.2 | 2.45 | −0.34 | 176.9 | 181.1 | 182.5 | 3.19 | −7.96 |
| Sand-cement Brick | 151.6 | 153.6 | 155.7 | 2.69 | −2.60 | 182.3 | 186.8 | 188.1 | 3.20 | −11.24 |
| Location | Istanbul (Hot Summer Mediterranean at 15 °C) | Lillhärdal (Sub-Arctic Climate at 3.5 °C) | ||||||||
| EUI at Building Orientation kW∙h∙m−2 | EUI at 0° Orientation—Base Model kW∙h∙m−2 | EUI at 45° Orientation kW∙h∙m−2 | EUI at 90° Orientation kW∙h∙m−2 | EUI at 0–90% Savings Due to Orientation | EUI at 90% Savings against NWC | EUI at 0° Orientation—Base Model kW∙h∙m−2 | EUI at 45° Orientation kW∙h∙m−2 | EUI at 90° Orientation kW∙h∙m−2 | 0–90% Savings Due to Orientation | EUI at 90% Savings against NWC |
| NWC | 151.2 | 152.6 | 153.2 | 1.30 | - | 226.1 | 226.5 | 226.7 | 0.37 | - |
| Control | 146.2 | 147.6 | 148.0 | 1.25 | 3.52 | 205.2 | 205.7 | 205.7 | 0.24 | 10.21 |
| ST0.25 | 146.7 | 148.2 | 148.6 | 1.31 | 3.11 | 207.1 | 207.6 | 207.6 | 0.21 | 9.24 |
| ST0.5 | 147.2 | 148.7 | 149.1 | 1.28 | 2.78 | 209.7 | 210.2 | 210.2 | 0.24 | 7.86 |
| ST0.75 | 147.4 | 148.8 | 149.3 | 1.31 | 2.63 | 210.5 | 211.0 | 211.0 | 0.25 | 7.48 |
| ST1.0 | 147.6 | 149.0 | 149.5 | 1.30 | 2.48 | 211.4 | 211.9 | 211.9 | 0.25 | 7.01 |
| ST1.5 | 147.9 | 149.3 | 149.8 | 1.32 | 2.32 | 212.7 | 212.1 | 212.7 | 0.25 | 6.61 |
| PP0.1 | 146.0 | 147.5 | 147.8 | 1.24 | 3.68 | 204.5 | 205.0 | 205.0 | 0.22 | 10.62 |
| PP0.2 | 145.9 | 147.4 | 147.7 | 1.25 | 3.74 | 203.9 | 204.5 | 204.4 | 0.21 | 10.93 |
| PP0.3 | 145.0 | 146.4 | 146.7 | 1.20 | 4.43 | 200.6 | 201.0 | 201.0 | 0.22 | 12.79 |
| ST0.5 + PP0.2 | 147.0 | 148.5 | 148.9 | 1.28 | 2.89 | 209.0 | 209.5 | 209.5 | 0.23 | 8.25 |
| ST0.75 + PP0.2 | 147.0 | 148.5 | 148.9 | 1.26 | 2.94 | 209.1 | 209.6 | 209.6 | 0.24 | 8.20 |
| ST1.0 + PP0.2 | 146.7 | 148.0 | 148.4 | 1.16 | 3.24 | 208.7 | 209.1 | 209.2 | 0.29 | 8.39 |
| HST0.75 + PP0.1 | 144.8 | 146.1 | 146.8 | 1.35 | 4.41 | 203.8 | 204.0 | 204.1 | 0.16 | 11.10 |
| HST0.75 + PP0.2 | 144.8 | 146.1 | 146.8 | 1.37 | 4.40 | 203.5 | 203.8 | 203.8 | 0.15 | 11.27 |
| HST0.75 + PP0.3 | 144.7 | 146.0 | 146.7 | 1.36 | 4.45 | 203.4 | 203.6 | 203.7 | 0.16 | 11.32 |
| Clay Brick | 149.8 | 150.4 | 151.2 | 0.92 | 1.32 | 210.5 | 211.3 | 210.9 | 0.00 | 7.53 |
| Sand-cement Brick | 154.1 | 154.9 | 155.9 | 1.15 | −1.69 | 230.3 | 230.3 | 230.7 | 0.35 | −1.72 |
| Tariff Category | Unit | Current Rate |
|---|---|---|
| Tariff A—Domestic Tariff | ||
| For the first 200 kW∙h (1–200 kW∙h) per month | sen (US cent)∙kW−1∙h−1 | 21.8 sen (US 5.27 cent) |
| For the next 100 kW∙h (201–300 kW∙h) per month | sen (US cent) kW−1∙h−1 | 33.4 sen (US 8.07 cent) |
| For the next 300 kW∙h (301–600 kW∙h) per month | sen (US cent) kW−1∙h−1 | 51.6 sen (US 12.47 cent) |
| For the next 300 kW∙h (601–900 kW∙h) per month | sen (US cent)∙kW−1∙h−1 | 54.6 sen (US 13.19 cent) |
| For the next kW∙h (901 kW∙h onwards) per month | sen (US cent) kW−1∙h−1 | 57.1 sen (US 13.79 cent) |
| The minimum monthly charge is RM3.00 (USD0.725) |
| Location | Putrajaya (Tropical Rainforest at 28 °C) | Makkah (Hot Desert 30 °C) | ||||||
|---|---|---|---|---|---|---|---|---|
| Building Orientation | 0° Orientation Base Model | 45° Orientation | 90° Orientation | At 90° Orientation | 0° Orientation Base Model | 45° Orientation | 90° Orientation | At 90° Orientation |
| Energy Consumption Cost (USD)∙Unit−1 | Front Elevation Facing North Cost∙Unit−1 | Front Elevation Facing North-East Cost∙Unit−1 | Front Elevation Facing East Cost∙Unit−1 | % Saving against NWC | Front Elevation Facing North Cost∙Unit−1 | Front Elevation Facing North-East Cost∙Unit−1 | Front Elevation Facing East Cost∙Unit−1 | % Saving against NWC |
| NWC | 169.52 | 171.61 | 174.93 | - | 77.58 | 79.82 | 80.42 | - |
| ST0 | 164.96 | 166.82 | 170.06 | 2.79% | 73.22 | 75.39 | 76.03 | 5.46% |
| ST0.25 | 165.70 | 167.70 | 170.96 | 2.27% | 73.62 | 75.82 | 76.47 | 4.92% |
| ST0.5 | 165.93 | 167.83 | 171.07 | 2.21% | 73.87 | 76.04 | 76.68 | 4.65% |
| ST0.75 | 166.10 | 168.01 | 171.26 | 2.10% | 75.11 | 77.31 | 77.94 | 3.09% |
| ST1.0 | 166.34 | 168.27 | 171.52 | 1.95% | 75.27 | 77.47 | 78.10 | 2.89% |
| ST1.5 | 166.58 | 168.54 | 171.80 | 1.79% | 75.42 | 77.63 | 78.26 | 2.69% |
| PP0.1 | 164.76 | 166.63 | 169.86 | 2.90% | 74.15 | 76.34 | 76.98 | 4.28% |
| PP0.2 | 164.72 | 166.62 | 169.86 | 2.90% | 73.03 | 75.21 | 75.86 | 5.68% |
| PP0.3 | 163.59 | 165.36 | 168.56 | 3.64% | 73.40 | 75.56 | 76.21 | 5.24% |
| ST0.5 + PP0.2 | 165.84 | 167.76 | 171.01 | 2.24% | 73.79 | 75.97 | 76.61 | 4.74% |
| ST0.75 + PP0.2 | 165.68 | 167.53 | 170.77 | 2.38% | 73.72 | 75.89 | 76.53 | 4.85% |
| ST1.0 + PP0.2 | 164.96 | 166.61 | 169.82 | 2.92% | 73.40 | 75.53 | 76.16 | 5.30% |
| HST0.75 + PP0.1 | 163.22 | 164.80 | 167.87 | 4.04% | 72.46 | 74.61 | 75.24 | 6.44% |
| HST0.75 + PP0.2 | 163.32 | 164.98 | 168.05 | 3.93% | 72.49 | 74.66 | 75.29 | 6.38% |
| HST0.75 + PP0.3 | 163.22 | 164.83 | 167.90 | 4.02% | 72.44 | 74.60 | 75.23 | 6.46% |
| Clay Brick | 170.24 | 172.69 | 175.71 | −0.45% | 84.52 | 86.76 | 87.47 | −8.76% |
| Sand-cement | 174.87 | 177.92 | 174.93 | −3.48% | 87.33 | 89.71 | 80.42 | −12.38% |
| Location | Istanbul (Hot Summer Mediterranean at 15 °C) | Lillhärdal (Sub-Arctic Climate at 3.5 °C) | ||||||
| Building Orientation | 0° Orientation Base Model | 45° Orientation | 90° Orientation | At 90° Orientation | 0° Orientation Base Model | 45° Orientation | 90° Orientation | At 90° Orientation |
| Energy Consumption Cost (USD)∙Unit−1 | Front Elevation Facing North Cost∙Unit−1 | Front Elevation Facing North-East Cost∙Unit−1 | Front Elevation Facing East Cost∙Unit−1 | % Saving against NWC | Front Elevation Facing North Cost∙Unit−1 | Front Elevation Facing North-East Cost∙Unit−1 | Front Elevation Facing East Cost∙Unit−1 | % Saving against NWC |
| NWC | 195.46 | 197.54 | 198.50 | - | 513.68 | 515.28 | 515.73 | - |
| ST0 | 187.59 | 189.86 | 190.42 | 4.07% | 462.73 | 463.88 | 463.96 | 10.04% |
| ST0.25 | 188.37 | 190.70 | 191.34 | 3.61% | 467.43 | 468.70 | 468.48 | 9.16% |
| ST0.5 | 189.15 | 191.38 | 192.07 | 3.24% | 473.74 | 475.03 | 475.00 | 7.90% |
| ST0.75 | 189.43 | 191.65 | 192.41 | 3.07% | 475.54 | 476.84 | 476.83 | 7.54% |
| ST1.0 | 189.77 | 192.01 | 192.75 | 2.90% | 477.80 | 479.12 | 479.12 | 7.10% |
| ST1.5 | 190.10 | 192.35 | 193.12 | 2.71% | 479.75 | 479.69 | 481.06 | 6.72% |
| PP0.1 | 187.26 | 189.54 | 190.07 | 4.25% | 460.96 | 462.16 | 462.08 | 10.40% |
| PP0.2 | 187.11 | 189.41 | 189.94 | 4.31% | 459.61 | 460.81 | 460.67 | 10.68% |
| PP0.3 | 185.72 | 187.98 | 188.42 | 5.08% | 451.25 | 452.34 | 452.33 | 12.29% |
| ST0.5 + PP0.2 | 188.92 | 191.17 | 191.84 | 3.36% | 471.94 | 473.23 | 473.14 | 8.26% |
| ST0.75 + PP0.2 | 188.84 | 191.06 | 191.71 | 3.42% | 472.14 | 473.43 | 473.39 | 8.21% |
| ST1.0 + PP0.2 | 188.40 | 190.43 | 191.04 | 3.76% | 470.99 | 472.15 | 472.47 | 8.39% |
| HST0.75 + PP0.1 | 185.43 | 187.37 | 188.47 | 5.06% | 459.09 | 459.74 | 459.88 | 10.83% |
| HST0.75 + PP0.2 | 185.42 | 187.39 | 188.50 | 5.04% | 458.35 | 459.01 | 459.11 | 10.98% |
| HST0.75 + PP0.3 | 185.34 | 187.30 | 188.39 | 5.09% | 458.13 | 458.79 | 458.91 | 11.02% |
| Clay Brick | 193.29 | 194.19 | 195.42 | 1.55% | 476.59 | 477.52 | 476.59 | 7.59% |
| Sand-cement | 199.84 | 201.05 | 202.58 | −2.06% | 523.54 | 524.64 | 525.51 | −1.90% |
© 2020 by the authors. Licensee MDPI, Basel, Switzerland. This article is an open access article distributed under the terms and conditions of the Creative Commons Attribution (CC BY) license (http://creativecommons.org/licenses/by/4.0/).
Share and Cite
Che Muda, Z.; Shafigh, P.; Binti Mahyuddin, N.; Sepasgozar, S.M.E.; Beddu, S.; Zakaria, A. Energy Performance of a High-Rise Residential Building Using Fibre-Reinforced Structural Lightweight Aggregate Concrete. Appl. Sci. 2020, 10, 4489. https://doi.org/10.3390/app10134489
Che Muda Z, Shafigh P, Binti Mahyuddin N, Sepasgozar SME, Beddu S, Zakaria A. Energy Performance of a High-Rise Residential Building Using Fibre-Reinforced Structural Lightweight Aggregate Concrete. Applied Sciences. 2020; 10(13):4489. https://doi.org/10.3390/app10134489
Chicago/Turabian StyleChe Muda, Zakaria, Payam Shafigh, Norhayati Binti Mahyuddin, Samad M.E. Sepasgozar, Salmia Beddu, and As’ad Zakaria. 2020. "Energy Performance of a High-Rise Residential Building Using Fibre-Reinforced Structural Lightweight Aggregate Concrete" Applied Sciences 10, no. 13: 4489. https://doi.org/10.3390/app10134489
APA StyleChe Muda, Z., Shafigh, P., Binti Mahyuddin, N., Sepasgozar, S. M. E., Beddu, S., & Zakaria, A. (2020). Energy Performance of a High-Rise Residential Building Using Fibre-Reinforced Structural Lightweight Aggregate Concrete. Applied Sciences, 10(13), 4489. https://doi.org/10.3390/app10134489