Featured Application
The inter-annual variability of rainfall distribution in the Mediterranean region has an important impact on the vegetative cycle of dryland pastures and, consequently, on the availability of animal feed in extensive regime. The results of this study show the practical interest of spectrometry and of remote sensing as expeditious tools for monitoring pasture quality and support farm management decisions in terms of animal supplementation needs in the critical periods.
Abstract
Pasture quality monitoring is a key element in the decision making process of a farm manager. Laboratory reference methods for assessing quality parameters such as crude protein (CP) or fibers (neutral detergent fiber: NDF) require collection and analytical procedures involving technicians, time, and reagents, making them laborious and expensive. The objective of this work was to evaluate two technological and expeditious approaches for estimating and monitoring the evolution of the quality parameters in biodiverse Mediterranean pastures: (i) near infrared spectroscopy (NIRS) combined with multivariate data analysis and (ii) remote sensing (RS) based on Sentinel-2 imagery to calculate the normalized difference vegetation index (NDVI) and the normalized difference water index (NDWI). Between February 2018 and March 2019, 21 sampling processes were carried out in nine fields, totaling 398 pasture samples, of which 315 were used during the calibration phase and 83 were used during the validation phase of the NIRS approach. The average reference values of pasture moisture content (PMC), CP, and NDF, obtained in 24 tests carried out between January and May 2019 in eight fields, were used to evaluate the RS accuracy. The results of this study showed significant correlation between NIRS calibration models or spectral indices obtained by remote sensing (NDVIRS and NDWIRS) and reference methods for quantifying pasture quality parameters, both of which open up good prospects for technological-based service providers to develop applications that enable the dynamic management of animal grazing.
1. Introduction
Montado is a highly complex agro–forestry–pastoral ecosystem due to the particular climate and soil conditions and the synergies between animals, trees, and pastures. In addition, the Mediterranean climate presents two very distinct dry and wet seasons accentuated by an increasing inter-annual irregularity [1]. Consequently, dryland pasture quality and productivity fluctuate greatly over time as a result of the seasonal distribution of rainfall [2]. Therefore, it is important to highlight the fact that decisions (e.g., about soil amendment or fertilization, dynamic grazing, and livestock feed supplementation) have to be made in a context of great unpredictability [1]. Understanding seasonal changes in pasture nutritive value can enhance ruminant production systems and management [3].
The value of pasture is a combination of not only pasture production but also its nutritional quality [3]. Decisions on supplementation are based on assessments of pasture quantity and quality. The quantification of pasture quality can be done by using measurable parameters, such as crude protein (CP) content and neutral detergent fiber (NDF) content [4]. Animal growth and development are favored by a high CP content and a low NDF content, which are usually associated with early stages of pasture development. During the spring, pastures tend to lose quality. The inter-annual variability of rainfall distribution has an important impact on the dryland pasture vegetative cycle, to the point that supplementation needs, which are normal in the critical summer period, can be anticipated by one to two months (in late spring) in years of reduced spring precipitation [5]. CP levels below maintenance requirements (9.4% of dry matter in adult sheep [6]) require the use of feed supplements, hence the interest of regular monitoring of evolution of these pasture parameters. As a result, farm managers heavily rely on the monitoring of the pasture quality for making decisions related to animal management. The conventional method for assessing CP and NDF consists of collecting representative samples and carrying out laboratory analysis. However, this methodology is not practical because it requires demanding field work and access to a specialized laboratory (cutting, collection, and analytical procedures). This results in a lengthy and often expensive process that is not practical for a busy farm manager [7]. Consequently, there is a demand for fast procedures that can monitor pasture variables and provide farmers with timely information. Proximal sensing (PS) and remote sensing (RS) are relatively recent technologies that measure certain plant and other indices, with particular interest in the use of the normalized difference vegetation index (NDVI), and they have gained widespread acceptance in agriculture [1,8].
In recent years, near-infrared spectroscopy (NIRS) technology, based on the absorption of the electromagnetic spectrum (radiation at wavelengths between 780 and 2500 nm), has been used in the pharmaceutical, petrochemical, agricultural, and food processing industries, among others [9]. Particularly, it has had a wide range of applications in agriculture, such as real-time pasture management [3], the prediction of the chemical composition of feeds [10], the detection of plant protein content [11], and the prediction of grape and wine quality [12]. NIR spectroscopy requires little or no sample preparation [9], thereby offering a simple, rapid, and reliable way to substitute some routine laboratory procedures and providing a fingerprint of sample composition. Briefly, energy in the NIR range is directed at the sample, and the reflected energy is measured by the instrument. However, this non-destructive technique requires a calibration procedure using some reference methods. The combination of NIR spectroscopy and multivariate data analysis (chemometrics or computational chemistry) provides calibration models that correlate the spectral response of a sample with its compositional profile [12,13]. It is also common knowledge that a NIR spectra obtained from forage samples have absorption bands that are correlated with specific compounds. The spectra regions between 1650–1670 and 2260–2280 nm are correlated with C–H bonds in lignin and cellulose [14], and the 2100–2200 nm region absorption bands are correlated with protein functional groups [15].
Though the NIR spectroscopy technique has been widely used in Europe to measure feed quality and to predict the nutritional value of forage [16], few studies related to its application in dryland biodiverse pastures of the Mediterranean region can be found, thus highlighting the interest of this work.
On the other hand, in recent years, satellite data have been increasingly deployed for RS applications due to their ready access, low cost, and geographic scale [8]. Satellite images can provide synoptic information on vegetation characteristics of large areas [17]. RS, based on the correlation between vegetation indices obtained from satellite-images and some crop characteristics, is becoming an increasingly appealing technology [7]. The NDVI is related to high levels of chlorophyll, which is correlated with vegetative vigor and, consequently, with high CP levels [18]. These indices that are associated with more traditional indicators provide farmers with the information needed for formulating the most appropriate strategy for management and feeding of the livestock [19]. Over the past few years, there has been a notorious improvement in the optical resolution of satellite images, providing now a 10–30 m pixel resolution and a five-day repeat cycle [1]. Therefore, RS techniques may progressively develop into important tools for the monitoring and management of such complex ecosystems while allowing for, when necessary, the reconstruction of historical trends through the use of satellite image time series [7]. Nonetheless, the use of optical satellite imagery requires a clear, cloud-free sky that may not always be the case during the rainy season in temperate and rainy regions. In the Montado, as in other forestry ecosystems, there is an added limitation due to lack of visibility of the plants located under the tree canopies. This limitation of RS-based methods creates an opportunity for the use of PS to monitor the understory vegetation [5,20]. These two methods can be used in a complementary way, with PS providing a greater resolution and access to the understory even on cloudy days [5].
Figure 1, based on data published by Serrano et al. [1], shows the interest of NDVI measurement (by RS or PS) as an indicator of the seasonal evolution of pasture quality over the vegetative cycle and of the inter-annual variability that might result from the precipitation pattern. The three years under consideration in this study showed different patterns of rainfall distribution (Figure 1a): 2015/16 with regular rainfall distribution, 2016/17 with a relatively dry spring, and 2017/18 with a very rainy spring. Considering the NDVI reference value of 0.6 (Figure 1b), which was a sudden and significant decrease, the pasture CP consequently contents fell below the animal maintenance [1], it is evident that animal supplementary feed is required between the end of spring and the beginning of autumn, and it can last between four and six months. This inter-annual variability reinforces the interest in having expeditious tools to support farmers in the dynamic management of animal grazing.
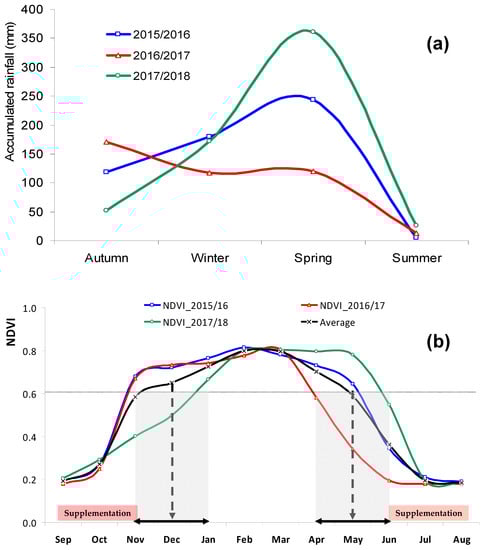
Figure 1.
Season accumulated rainfall in the meteorological station of Mitra (Évora, Portugal) (a) and evolution of the normalized difference vegetation index (NDVI) at the experimental field (b) between September and August over three years: 2015/16, 2016/17, and 2017/18.
The purpose of this study was to evaluate two technological and expeditious approaches (Figure 2) for estimating and monitoring the evolution of the quality parameters in Mediterranean pastures during the 2018 and 2019 growing seasons: (i) NIRS combined with multivariate data analysis and (ii) RS using images provided by Sentinel-2 satellite to calculate the NDVI and the normalized difference water index (NDWI).
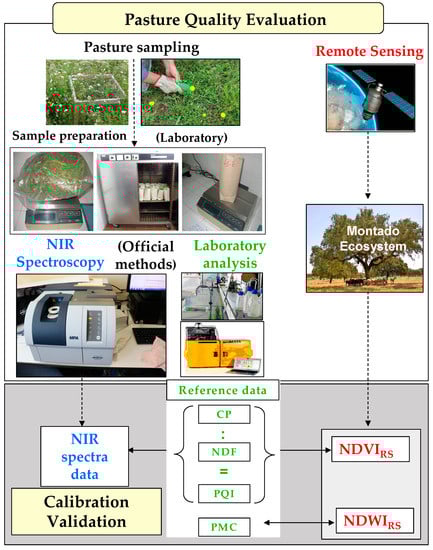
Figure 2.
Schematic representation of the experimental methodology used in this study.
2. Materials and Methods
This work frames the results of several projects conducted by this research team to monitor the pasture in the Montado ecosystem in nine experimental fields (Figure 3). The characteristics of the experimental fields used in this study are presented in Table 1. These are typical biodiverse dryland pastures that usually grow under a low density plantation of Holm oak or Cork oak, and they are mainly used for grazing by sheep or cattle in a rotational or permanent basis. The following data were used: (i) pasture moisture content (PMC), CP, and NDF in experimental field “MIT_1,” collected between February and December 2018; (ii) PMC, CP, and NDF in 8 experimental fields (“AZI,” “CUB,” “GRO,” “MIT_2,” “MUR,” “PAD,” “QF,” and “TAP”) collected in May 2018 (“MIT_2,” “QF,” and “TAP”) and between January and February 2019; (iii) PMC, CP, NDF, the NDVI, and the NDWI in 8 experimental fields (“AZI,” “CUB,” “GRO,” “MIT_2,” “MUR,” “PAD,” “QF,” and “TAP”) collected between January and May 2019.
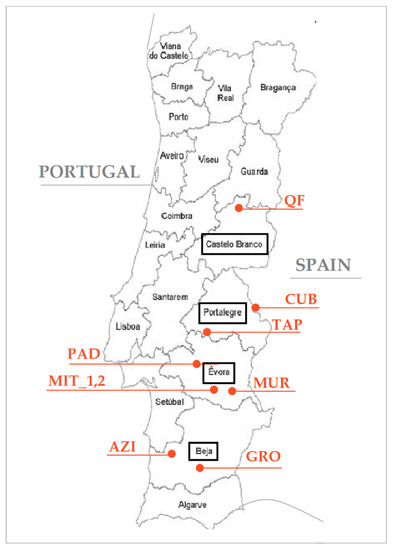
Figure 3.
Location of the experimental fields in Portugal.

Table 1.
Characteristics of the experimental fields used in this study.
2.1. Evaluation of Near Infrared Spectroscopy (NIRS) Approach
2.1.1. Pasture Sample Collection and Chemical Processing
Three hundred and ninety eight composite pasture samples were collected between February 2018 and February 2019 in nine different fields in four districts of Portugal (Beja, Évora, Portalegre, and Castelo Branco; see Figure 3). The sampling process consisted of defining, at each point, a 0.5 × 0.5 m area (through a metal quadrat), cutting the pasture at 5–10 mm above ground level, and then preserving each sample in a numbered plastic bag. Each composite sample resulted from three representative sub-samples. Once in the laboratory, the pasture sample was weighed to establish total biomass, dried in an oven 72 h at 65 °C, and weighed again to establish PMC (in %). Then, these samples were ground using a Perten instruments mill equipped with 1 mm sieve. CP and NDF were analyzed according to standard methods and expressed in percentage on a dry weight basis [21], constituting the CP and NDF reference values: (i) nitrogen content was analyzed with the Kjeldahl method, a colorimetric determination in a Bran + Luebbe autoanalyzer with a factor of conversion to CP of 6.25 (method no. G-188-97 Rev 2, Bran + Luebbe, Analyzer Division, Norderstedt, Germany); (ii) the NDF content was analyzed according to the Goering and Van Soest [22] method in a fibered digester (Foss Tecator AB, Sweden). The pasture quality index (PQI; Equation (1)) was then calculated based on the ratio of these two parameters:
2.1.2. Sample Spectra Acquisition and Processing
Spectroscopic measurements were made in all samples using an FT-NIR spectrometer (MPA, Opus Bruker, Germany). Dried and ground pasture samples were placed on integrating sphere, and spectra was collected in diffuse reflectance mode at room temperature of 20 °C in a small circular cup of 20 mm diameter. Reflectance data (R) were measured as log 1/R (absorbance data) at a 1 nm interval, and NIR spectra data were obtained. Five spectra were collected from each sample, and an average spectrum was used for further mathematical processing and chemometrics analysis. Spectra data were obtained in the entire near infrared region of 12,500–3600 cm−1 (800–2777 nm) after a total of 32 scans with a scanner velocity of 10 kHz and an average resolution of 16 cm−1, with a receiver gain function with the lowest gain setting defined as 1 [23]. Each spectrum constituted 1137 points, which means that the first 20 values of each spectrum were discarded because large parts of the spectral noise could be found below 3741 cm−1 (2673 nm). Background signal was corrected before each set of 20 samples.
2.1.3. Statistical Analysis
The Opus v. 7.5 software (Bruker Optik GmbH, Germany) was employed for spectral data collection, and FT-NIR spectra were exported to the Unscrambler software (version 10.5.1, Camo, ASA, Oslo, Norway) for chemometrics analysis, calibration, and external validation models. Prediction models were developed using partial least square regression (PLSR) algorithm, considering an independent validation sample set for the chemometrics analysis [24]. In order to obtain the best predictive model, for PLSR, samples were split in two sets: a training set (calibration) with 79% of the samples (315 samples of six fields collected between February and December 2018; day of the year (DOY) 39–135) and a test set, with the rest of the samples (83 samples of eight fields collected between January and February 2019; DOY 10–50) used as an external and independent validation set of the NIRS calibration models. In order to test the model robustness, two different years were considered for calibration and validation sets.
To find the most accurate model to quantify CP, NDF, and the PQI in pastures, the calibration process was performed on the raw spectra data and after the application of some mathematical algorithms to remove any irrelevant information. Some pre-processing techniques, like standard normal variate (SNV), normalization and normalization followed by SNV (normalization and SNV) were applied to raw spectra and the best prediction model was selected. Calibration and validation models were developed based on principal components analysis. The quantitative measure for the predictive accuracy from each model was evaluated using coefficient of determination (R2; an excellent indicator of the accuracy and robustness of a model), root mean square error (RMSE; Equation (2)) for the calibration and external validation data sets, and the residual predictive deviation (RPD; Equation (3)), which corresponds to the ratio between standard deviation (SD) of the results obtained by reference method and the corrected mean error of the prediction of the validation (SEP bias). The value of RPD is usually used as an indicator of the quality of a calibration model. Values of RPD higher than 2, 3, or 5 are recommended, respectively, for screening purposes, prediction, and quality control [25,26].
where n is the number of observations and Ei and Mi are the estimated and observed (measured) values, respectively.
2.2. Evaluation of Remote Sensing (RS) Approach
2.2.1. Pasture Sample Collection and Chemical Processing
Pasture sampling was carried out between January and May 2019 (DOY between 10 and 145) in eight experimental fields with area of approximately 25 ha (Figure 3). In each of these fields, nine composite samples were taken at three different times in geo-referenced areas without trees, corresponding to 10 × 10 m pixels of Sentinel-2 imagery for a total of 216 samples (3 dates × 8 fields × 9 samples). The sampling process and the subsequent chemical analysis took place as described above to obtained PMC, CP, NDF, and the PQI.
2.2.2. Sample Spectra Acquisition and Processing
Reflectance was measured by remote sensing (Sentinel-2). These data were downloaded from Copernicus data for the nine geo-referenced pixels in each experimental field. Two remote sensing indices were generated from different surface reflectance bands: the NDVIRS (B4: 665 nm and B8: 842 nm, with a 10 m spatial resolution; see Equation (4) [27]) and the NDWIRS (B8A: 865 nm and B11: 1610 nm, with a 20 m spatial resolution; see Equation (5) [28]). The “Sen2Cor 2.3” processor (implemented on Sentinel Application Platform from European Space Agency) was used for atmospheric correction.
These indices were extracted on the date without clouds closest to the corresponding pasture collection and were subject to a maximum deletion of 8 days between two dates (pasture sampling and Sentinel-2 data extraction).
2.2.3. Statistical Analysis
The statistical treatment of these results was performed using the ‘MSTAT-C’ software, version 6.0 (MSTAT-C, Michigan State University, MI, USA) with a significance level of 95% (p < 0.05) and consisted of an analysis of regression between average pasture parameters and indices based in satellite imagery: (i) CP, NDF, and the PQI versus the NDVIRS and (ii) PMC versus the NDWIRS.
3. Results
3.1. Evaluation of Near Infrared Spectroscopy (NIRS)
Table 2 shows PMC, CP, and NDF values of pasture samples at each location and each sampling date, determined with the reference method and used in the calibration and external validation models. The first requirement to obtain a good calibration model is to have a wide variation of the chemical composition of a set. The average values of these parameters (PMC between 62.5% and 89.1%; CP between 10.4% and 24.3%; and NDF between 29.4% and 60.2%) are characteristic for dryland pastures during the growing season (autumn, winter, and spring). The variation ranges of these parameters showed, on the other hand, that the samples used in this study are representative of the inherent variability of biodiverse pastures of different fields in different phases of the vegetative cycle.
Table 2.
Pasture moisture content (PMC), crude protein (CP), and fiber (NDF) reference values of calibration phase and external validation phase.
Table 3 shows statistics for calibration and external validation of prediction models developed using PLSR to correlate NIRS absorbance spectra with the invasive quality measurements (CP, NDF, and the PQI). Four regression models were developed using the listed mathematical procedure (raw spectra, normalization, SNV, and normalization and SNV). This table shows that the PLSR models selected for CP, NDF, and PQI quantification in pasture samples exhibited a small difference between RMSE from the calibration and RMSE from the external validation models.
Table 3.
Statistics for calibration and external validation models for CP, NDF, and the PQI using near-infrared spectroscopy (NIRS) spectra and partial least squares regression (PLSR)
Figure 4 shows the optimized spectra of NIRS, considering several pre-processing methods, for CP, NDF, and the PQI. These are typical absorbance pasture spectrums. Considering that the main goal of this study was to obtain predictive models to quantify CP, NDF, and indirectly, pasture quality (PQI), the pasture raw spectra region selected in this study was defined as that within the wavenumber region from 4000 to 9000 cm−1 (2500–1111 nm).
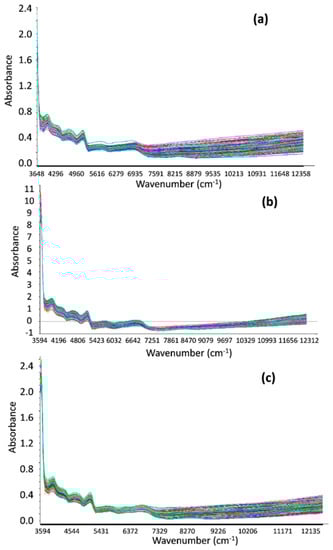
Figure 4.
Optimized NIR spectra in the wavenumber region 3594 to 12,358 cm−1 (2782 to 809 nm) for (a) CP, (b) NDF, and (c) the PQI.
Considering that an accurate model should have a high RPD, a high R2, a low RMSE, a low average difference between predicted and actual values (bias) [29], and a small difference between RMSE from calibration and external validation models [30], when evaluating all pre-processing methods used to evaluate CP, NDF, and the PQI in pasture samples, the best results were obtained using:
- (i)
- The “raw spectra” procedure for CP prediction model due to the highest RPD (4.0) and R2 (0.844) and the lowest RMSE (1.622) and bias (0.057) of the external validation model (Table 3).
- (ii)
- The “normalization and SNV” pre-processing for the NDF prediction model due to the highest RPD (2.4) and R2 (0.826) and lowest RMSE (4.200) of the external validation model (Table 3).
- (iii)
- The “raw spectra” procedure for the PQI prediction model due to the highest RPD (3.2) and R2 (0.808) and lowest RMSE (0.066) and bias (0.009) of the external validation model (Table 3).
Figure 5 shows measured vs. predicted values for CP, NDF, and the PQI, in calibration and validation phases. It is visible that the range of the calibration and validation sets was similar for all parameters, which contributed to a good representativeness of the whole group of samples. According to the coefficients of determination and the predicted vs. reference values, the CP model had the higher prediction capability and the NDF model had the lowest, which is in accordance with other studies [31]; nevertheless, these results showed that NIRS calibration models provided significantly identical data to reference methods to quantify CP, NDF, and the PQI.
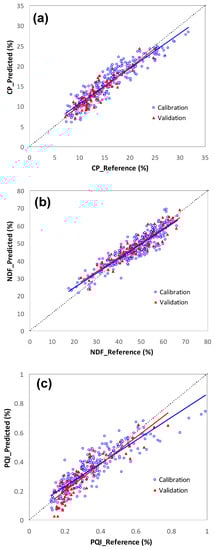
Figure 5.
Plot of reference values versus predicted values for calibration and validation phases: (a) CP, (b) NDF, and (c) the PQI.
3.2. Evaluation of Remote Sensing (RS)
Table 4 shows the average PMC, CP, NDF, and PQI reference values of pasture samples and the NDVIRS and the NDWIRS at each of the eight experimental fields and each of the three sampling dates. The pattern, in general, showed a decrease in PMC and CP and an increase in NDF as the vegetative cycle of the pasture advanced (increase of the DOY). The PQI, being a ratio between CP and NDF, tended to decrease with the evolution of the vegetative cycle. This similarity of temporal patterns of the parameters related to pasture quality (PMC, CP, and the PQI) and spectral indices obtained by remote sensing (the NDVIRS and the NDWIRS) was reflected in the significant correlation between (a) the PQI and the NDVIRS (R2 = 0.77; p < 0.01) and (b) between PMC and the NDWIRS (R2 = 0.72; p < 0.01) (Figure 6). This evolution showed, however, the site-specific variability function of precipitation regimes, which determines the soil moisture availability, the true driver of productivity in dryland pastures of the Mediterranean region [2].
Table 4.
Average PMC, CP, NDF, and PQI reference values and NDVI and NDWI values based on satellite imagery.
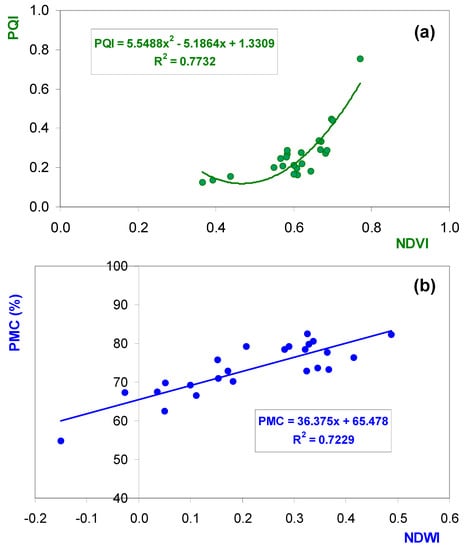
Figure 6.
Relationship between (a) the PQI and the remote sensing NDVI (NDVIRS); (b) PMC and the remote sensing NDWI (NDWIRS) over sampling times (between January and May 2019) and locations (8 experimental fields). Data are the average values of sampling pixels in each time and site location.
4. Discussion
4.1. Evaluation of Near Infrared Spectroscopy (NIRS)
Choosing a proper wavenumber range is an essential pre-processing step to find the most representative wavelengths and eliminate uninformative spectra regions. Actually, many authors have found that the diffuse reflection from the wavenumber region of 4000–9000 cm−1 (2500–1111 nm) carries information associated with organic material and structural fibers that is typical of a NIRS spectra [14,16]. Considering the selected wavenumber range used in NDF prediction model development (4003–5600 and 7050–7300 cm−1 or 2498–1786 and 1418–1370 nm), Givens and Deaville [15] also found two regions around 6066–5988 and 4424–4385 cm−1 (1649–1670 and 2260–2280 nm) that were the most important regions associated with the presence of lignin and cellulose. On the other hand, Bagchi et al. [11] found that the region around 6798–6535 cm−1 (1471–1530 nm) corresponded to the absorbance band of protein in molecules. Additionally in the CP calibration model, it was observed in this study that the spectra within 4003–7800 cm−1 (2498–1282 nm) were the most important regions that contributed to the performance of the models. These results indicated that aforementioned wavenumbers may play important roles in modeling protein content in pasture samples.
As mentioned in the Results section, in terms of pre-processing methods used to evaluate CP, NDF, and the PQI in pasture samples, the best results were obtained using, respectively, the “raw spectra,” the “normalization and SNV,” and the “raw spectra” procedures. Additionally Garcia and Cozzolino [31] found similar R2 values for CP quantification, denoting the high capacity of NIRS to predict this parameter in a wide range of forages and pastures. An RPD greater than 3 is an indicator of good quality of calibration model for prediction of CP [25,26]. On the other hand, successful calibrations have also been made for the prediction of NDF with similar predictive accuracy and using the same spectral region in other plant species (grasses, cereal, and straws) [15]. The lower calibration accuracy of NDF models, relatively to CP models, might reflect some variability in the reference method due to high starch content on the forage and pasture samples [31], as fiber is a more complex component of forages that protein [32]. An RPD greater than 2 is an indicator of a calibration model for the screening purposes of NDF [25,26] that suggests that more work needs to be done to build a more robust model. Regarding the PQI, as this parameter is a ratio between CP and NDF, an intermediate behavior would be expected. An calibration model with an RPD greater than 3 can be used as routine analysis in the prediction of the PQI [25,26,33].
The small difference observed in this study between the RMSE from the calibration and the RMSE from the external validation models selected for CP, NDF, and PQI quantification in pasture samples (Table 3) was similar to that obtained by Aleixandre-Tudo et al. [30], who indicated robust and accurate calibrations. Models are robust when prediction accuracy is relatively insensitive to unknown changes of external factors. Additionally, according to Fagan et al. [34], a model is considered good enough to monitor the quality of individual samples when the R2 is around 0.90 and the RDP is greater than 3. The R2 (0.80–0.90) and the RPD (2.4–4.0) obtained in this study indicated that there were very little differences between reference and predicted values of CP, NDF, and the PQI [11]. In general, R2 increased as more information was added to the database, which means that, although these results are encouraging, more accurate models will be built in the future that enable the chemical and nutritional analysis of feed stuffs in a non-destructive and inexpensive way.
4.2. Evaluation of Remote Sensing (RS)
As discussed in the Introduction, historical time series of an NDVIRS enable one to follow the evolution of vegetative vigor and, therefore, the quality of pasture throughout the year. The significant correlations obtained in this work between the PQI and the NDVIRS (R2 = 0.77; p < 0.01) confirmed previous studies. According to Gu et al. [35], the NDVI has been recognized as an excellent proxy for both the chlorophyll content and the intracellular spaces of plant leaves [36]: in general terms, higher NDVI values are indicative of greater vigor and photosynthetic activity, whereas lower NDVI values are associated with stress phenomena that result in decreased presence of chlorophyll and wilting or senescence of the leaves. The nonlinear behavior of this relationship seems to indicate the lower sensitivity of the NDVI to variations in the quality of pasture (PQI) in periods of more feeble vegetative vigor (NDVI values of approximately 0.4–0.6; Figure 6a), an aspect to be further explored in future works. Serrano et al. [1] observed significant correlations between the NDVI and pasture quality parameters, showing that this index can be used to develop a system of alarms that can inform a farm manager of the need for providing supplementary feed to the animals.
On the other hand, the significant correlation between the NDWIRS and PMC was in agreement with the observations of Sanchez-Ruiz et al. [37], who indicated that the spectral signature of vegetation in NIR and SWIR (short-wave infrared) bands can be related with the plant water status. The NDWIRS, known as a “water index” [28,35], has shown sensitivity to changes in leaf water content. By using the NDWIRS, the amount of leaf material can be known in order to estimate vegetation dryness [38].
These results show the practical interest of the satellite-derived indices (as the NDVIRS and the NDWIRS) in the site-specific management of the Montado ecosystem, namely to provide the farmer with the information needed to intensify this production system in a climate change scenario [1]. The RS-based models can more accurately assess ecosystem services when their indicators mainly depend on green vegetation, such as for erosion prevention and the provision of forage [17].
This RS approach has the great advantage of not requiring displacement to the field to collect information, unlike the NIRS approach. However, it is affected by the presence of clouds, which are very common in this region in the period of greatest vegetative development of the pasture (spring); an additional limitation is the inaccessibility under the trees, a characteristic element of this ecosystem that induces specific microclimates, influencing soil fertility and productivity, as well as the quality of pasture [39]. Thus, there seems to be a high potential for future research studies to evaluate the complementarity between NIRS approach (especially based on proximal and portable technology (PS)) and RS for monitoring and supporting pasture and grazing management in the Montado ecosystem.
5. Conclusions
The development and productivity of dryland pastures mainly depend on the distribution of precipitation throughout the year and on its combination with the air temperature. The important inter-annual variability of rainfall, characteristic of the Mediterranean region, places agricultural decision-makers in a scenario of great unpredictability regarding the availability of food for animals in an extensive regime. The results of this study showed significant correlation between NIRS calibration models or spectral indices obtained by remote sensing (the NDVIRS and the NDWIRS) and reference methods for quantifying pasture quality parameters. They demonstrated the practical interest of spectrometry and of remote sensing as expeditious and complementary tools for monitoring pasture quality and supporting farmer management decisions in terms of animal supplementation needs in the critical period between the end of spring and the beginning of autumn in southern Portugal. Though these are already very interesting results and with immediate practical applications, clearly reducing the time and means needed to process pasture samples and obtain quality parameters, we believe that it is still possible (i) to improve the robustness of the NIRS calibration models in estimating pasture quality attributes, possibly by resorting to a greater number of pasture samples; (ii) contribute to the practical implementation of NIRS technology with the use of portable spectrophotometers that enable direct field sampling (green sampling), thus eliminating the need for sample preparation; and (iii) the use of historical time series of the NDVI, the NDWI, or others indices obtained by satellite imagery relative to several years to create a database that allows small technology-based enterprises to provide alert services to the livestock farming management, constituting effective systems for the holistic evaluation and monitoring of Montado ecosystem.
Author Contributions
Conceptualization, J.S. and A.E.R.; methodology, J.S., E.C., and A.E.R.; software, J.S., J.M.d.S., L.P., and A.E.R.; validation, J.S., J.N.-B., and A.E.R.; formal analysis, J.S. and A.E.R.; investigation, J.S., S.S., J.M.d.S., and A.E.R.; resources, L.P. and R.C.-C.; data curation, J.S.; writing—original draft preparation, J.S.; writing—review and editing, S.S.; visualization, J.S., S.S. and A.E.R.; supervision, J.S. and A.E.R.; project administration, J.S.; funding acquisition, J.S. All authors have read and agreed to the published version of the manuscript.
Funding
This work is funded by National Funds through FCT—Foundation for Science and Technology under the Project UIDB/05183/2020 and by the projects PDR2020−101-030693, PDR2020−101-031244 (“Programa 1.0.1-Grupos Operacionais”) and ALT20-03-0145FEDER-000005 (ALENTEJO 2020).
Acknowledgments
The authors would like to express their sincere appreciation to Margarida Romão, of Laboratory of Nutrition and Metabolism of Mediterranean Institute for Agriculture, Environment and Development (MED), for their support in laboratory analysis of pasture samples to obtain the reference values of the pasture quality parameters.
Conflicts of Interest
The authors declare no conflict of interest.
References
- Serrano, J.; Shahidian, S.; Marques da Silva, J. Monitoring seasonal pasture quality degradation in the Mediterranean montado ecosystem: Proximal versus remote sensing. Water 2018, 10, 1422. [Google Scholar] [CrossRef]
- Efe Serrano, J. Pastures in Alentejo: Technical Basis for Characterization, Grazing and Improvement; Universidade de Évora—ICAM, Ed.; Gráfica Eborense: Évora, Portugal, 2006; pp. 165–178. [Google Scholar]
- Bell, M.J.; Mereu, L.; Davis, J. The use of mobile near-infrared spectroscopy for real-time pasture management. Front. Sustain. Food Syst. 2018, 2, 1–10. [Google Scholar] [CrossRef]
- Lugassi, R.; Chudnovsky, A.; Zaady, E.; Dvash, L.; Goldshleger, N. Spectral slope as an indicator of pasture quality. Remote Sens. 2015, 7, 256–274. [Google Scholar] [CrossRef]
- Serrano, J.; Shahidian, S.; Marques da Silva, J. Evaluation of normalized difference water index as a tool for monitoring pasture seasonal and inter-annual variability in a Mediterranean agro-silvo-pastoral system. Water 2019, 11, 62. [Google Scholar] [CrossRef]
- National Research Council. Nutrient Requirements of Sheep, 6th ed.; National Academy Press: Washington, DC, USA, 1985; Volume 5. [Google Scholar]
- Lumbierres, M.; Méndez, P.F.; Bustamante, J.; Soriguer, R.; Santamaria, L. Modeling biomass production in seasonal wetlands using Modis NDVI land surface phenology. Remote Sens. 2017, 9, 392. [Google Scholar] [CrossRef]
- Louhaichi, M.; Hassan, S.; Clifton, K.; Johnson, D.E. A reliable and non-destructive method for estimating forage shrub cover and biomass in arid environments using digital vegetation charting technique. Agrofor. Syst. 2018, 92, 1341–1352. [Google Scholar] [CrossRef]
- Teye, E.; Amuah, C.L.Y.; McGrath, T.; Elliott, C. Innovative and rapid analysis for rice authenticity using hand-held NIR spectrometry and chemometrics. Spectrochim. Acta A Mol. Biomol. Spectrosc. 2019, 217, 147–154. [Google Scholar] [CrossRef]
- Swart, E.; Brand, T.S.; Engelbrecht, J. The use of near infrared spectroscopy (NIRS) to predict the chemical composition of feed samples used in ostrich total mixed rations. S. Afr. J. Anim. Sci. 2012, 5, 42. [Google Scholar] [CrossRef]
- Bagchi, T.B.; Sharma, S.; Chattopadhyay, K. Development of NIRS models to predict protein and amylase content of brown rice and proximate compositions of rice bran. Food Chem. 2016, 191, 21–27. [Google Scholar] [CrossRef]
- Véstia, J.; Barroso, J.M.; Ferreira, H.; Gaspar, L.; Rato, A.E. Predicting calcium in grape must and base wine by FT-NIR spectroscopy. Food Chem. 2019, 276, 71–76. [Google Scholar] [CrossRef]
- Musingarabwi, D.M.; Nieuwoudt, H.H.; Young, P.R.; Eyeghe-Bickong, H.A.; Vivier, M.A. A rapid qualitative and quantitative evaluation of grape berries at various stages of development using Fourier-transform infrared spectroscopy and multivariate data analysis. Food Chem. 2016, 190, 253–262. [Google Scholar] [CrossRef]
- Corson, D.C.; Waghorn, G.C.; Ulyatt, M.J.; Lee, J. NIRS: Forage analysis and livestock feeding. Proc. N. Z. Grassl. Assoc. 1999, 61, 127–132. [Google Scholar]
- Givens, D.I.; Deaville, E.R. The current and future role of near infrared reflectance spectroscopy in animal nutrition: A review. Aust. J. Agric. Res. 1999, 50, 1131–1145. [Google Scholar] [CrossRef]
- Danieli, P.P.; Carlini, P.; Bernabucci, U.; Ronchi, B. Quality evaluation of regional forage resources by means of near infrared reflectance spectroscopy. Ital. J. Anim. Sci. 2004, 3, 363–376. [Google Scholar] [CrossRef]
- Rio-Mena, T.; Willemen, L.; Tesfamariama, G.T.; Beukes, O.; Nelson, A. Remote sensing for mapping ecosystem services to support evaluation of ecological restoration interventions in an arid landscape. Ecol. Indic. 2020, 113, 106182. [Google Scholar] [CrossRef]
- Reddy, A.R.; Chaitanya, K.V.; Vivekanandan, M. Drought-induced responses of photosynthesis and antioxidant metabolism in higher plants. J. Plant Physiol. 2004, 161, 1189–1202. [Google Scholar] [CrossRef]
- Serrano, J.; Shahidian, S.; Marques da Silva, J.; Sales-Baptista, E.; Ferraz de Oliveira, I.; Lopes de Castro, J. Tree influence on soil and pasture: Contribution of proximal sensing to pasture productivity and quality estimation in montado ecosystems. Int. J. Remote Sens. 2018, 39, 4801–4829. [Google Scholar] [CrossRef]
- Handcock, R.N.; Gobbett, D.L.; González, L.A.; Bishop-Hurley, G.J.; McGavin, S.L. A pilot project combining multispectral proximal sensors and digital cameras for monitoring tropical pastures. Biogeosciences 2016, 13, 4673–4695. [Google Scholar] [CrossRef]
- AOAC. Official Method of Analysis of AOAC International, 18th ed.; AOAC International: Arlington, AT, USA, 2005. [Google Scholar]
- Goering, H.K.; Van Soest, P.J. Forage Fibre Analysis (Apparatus Reagents, Procedures and Some Applications); Agriculture Handbook no. 379, USDA-ARS: Albany, NY, USA, 1970. [Google Scholar]
- Milinovic, J.; Garcia, R.; Rato, A.E.; Cabrita, M.J. Rapid assessment of monovarietal portuguese Extra Virgin Olive Oil’s (EVOO’s) fatty acids by Fourier-Transform Near-Infrared Spectroscopy (FT-NIRS). Eur. J. Lipid Sci. Technol. 2020, 121, 1800392. [Google Scholar] [CrossRef]
- Wold, S.; Sjostrom, M.; Eriksson, L. PLS-Regression: A basic tool of Chemometrics. Chemometr. Intell. Lab. Syst. 2001, 58, 109–130. [Google Scholar] [CrossRef]
- Murray, I. Forage Analysis by Near Infrared Spectroscopy. In Sward Measurement Handbook, 2nd ed.; Davies, A., Baker, R.D., Grant, S.A., Laidlaw, A.S., Eds.; The British Grassland Society: Reading, UK, 1993. [Google Scholar]
- Versari, A.; Laurie, V.F.; Ricci, A.; Laghi, L.; Parpinello, G.P. Progress in authentication, typification and traceability of grapes and wines by chemometric approaches. Food Res. Int. 2014, 60, 2–18. [Google Scholar] [CrossRef]
- Rouse, J.W.; Haas, R.H.; Schell, J.A.; Deering, D.W. Monitoring the Vernal Advancement and Retrogradation (Green Wave Effect) of Natural Vegetation; Progress Report RSC 1978-1; Remote-Sensing Center, Texas A&M Univ.: College Station, TX, USA, 1973. [Google Scholar]
- Gao, B.-C. NDWI -A normalized difference water index for remote sensing of vegetation liquid water from space. Remote Sens. Environ. 1996, 58, 257–266. [Google Scholar] [CrossRef]
- Donis-González, I.R.; Valero, C.; Momin, M.A.; Kaur, A.; Slaughter, D.C. Performance Evaluation of two commercially available portable spectrometers to non-invasively determine table grape and peach quality attributes. Agronomy 2020, 10, 148. [Google Scholar] [CrossRef]
- Aleixandre-Tudo, J.L.; Nieuwoudt, H.; Olivieri, A.; Aleixandre, J.L.; Toit, W. Phenolic profiling of grapes, fermenting samples and wines using UV-Visible spectroscopy with chemometrics. Food Control 2018, 85, 11–22. [Google Scholar] [CrossRef]
- Garcia, J.; Cozzolino, D. Use of near infrared reflectance (NIR) spectroscopy to predict chemical composition of forages in broad-based calibration models. Agric Tech. 2006, 66, 41–47. [Google Scholar] [CrossRef]
- Shenk, J.S.; Werterhaus, M.O. Analysis of Agriculture and Food Products by Near Infrared Espectroscopy; Infrasoft International: Port Matilda, PA, USA, 1993; pp. 116–187. [Google Scholar]
- Batten, G.D. Plant analysis using near infrared reflectance spectroscopy: The potential and the limitations. Aust. J. Exp. Agric. 1998, 38, 697–706. [Google Scholar] [CrossRef]
- Fagan, C.C.; Everard, C.D.; McDonnell, K. Prediction of moisture, calorific value, ash and carbon content of two dedicated bioenergy crops using near-infrared spectroscopy. Bioresour. Technol. 2011, 102, 5200–5206. [Google Scholar] [CrossRef] [PubMed]
- Gu, Y.; Hunt, E.; Wardlow, B.; Basara, J.B.; Brown, J.F.; Verdin, J.P. Evaluation of MODIS NDVI and NDWI for vegetation drought monitoring using Oklahoma Mesonet soil moisture data. Geophys. Res. Lett. 2008, 35, L22401. [Google Scholar] [CrossRef]
- Jackson, J.; Ash, A.J. Tree-grass relationships in open eucalypt woodlands of northeastern Australia: Influence of trees on pasture productivity, forage quality and species distribution. Agrofor. Syst. 1998, 40, 159–176. [Google Scholar] [CrossRef]
- Sánchez-Ruiz, S.; Piles, M.; Sánchez, N.; Martínez-Fernández, J.; Vall-llossera, M.; Camps, A. Combining SMOS with visible and near/shortwave/thermal infrared satellite data for high resolution soil moisture estimates. J. Hidrol. 2014, 516, 273–283. [Google Scholar] [CrossRef]
- Maki, M.; Ishiahra, M.; Tamura, M. Estimation of leaf water status to monitor the risk of forest fires by using remotely sensed data. Remote Sens. Environ. 2004, 90, 441–450. [Google Scholar] [CrossRef]
- Pullanagari, R.R.; Yule, I.J.; Tuohy, M.P.; Hedley, M.J.; Dynes, R.A.; King, W.M. Proximal sensing of the seasonal variability of pasture nutritive value using multispectral radiometry. Grass Forage Sci. 2013, 68, 110–119. [Google Scholar] [CrossRef]
© 2020 by the authors. Licensee MDPI, Basel, Switzerland. This article is an open access article distributed under the terms and conditions of the Creative Commons Attribution (CC BY) license (http://creativecommons.org/licenses/by/4.0/).