Article

Training of Deep Convolutional Neural Networks to Identify Critical Liver Alterations in Histopathology Image Samples

by
Alexandros Arjmand
1,*,
Constantinos T. Angelis
1,
Vasileios Christou
1,
Alexandros T. Tzallas
1,
Markos G. Tsipouras
2,
Evripidis Glavas
1,
Roberta Forlano
3,
Pinelopi Manousou
3 and
Nikolaos Giannakeas
1,*
1
Department of Informatics and Telecommunications, University of Ioannina, GR47100 Arta, Greece
2
Department of Electrical and Computer Engineering, University of Western Macedonia, GR50100 Kozani, Greece
3
Liver Unit/ Division of Integrative Systems Medicine and Digestive Disease, Department of Surgery and Cancer, Imperial College, London SW7 2AZ, UK
*
Authors to whom correspondence should be addressed.
Appl. Sci. 2020, 10(1), 42; https://doi.org/10.3390/app10010042
Submission received: 13 October 2019 / Revised: 5 December 2019 / Accepted: 12 December 2019 / Published: 19 December 2019

Abstract

:
Nonalcoholic fatty liver disease (NAFLD) is responsible for a wide range of pathological disorders. It is characterized by the prevalence of steatosis, which results in excessive accumulation of triglyceride in the liver tissue. At high rates, it can lead to a partial or total occlusion of the organ. In contrast, nonalcoholic steatohepatitis (NASH) is a progressive form of NAFLD, with the inclusion of hepatocellular injury and inflammation histological diseases. Since there is no approved pharmacotherapeutic solution for both conditions, physicians and engineers are constantly in search for fast and accurate diagnostic methods. The proposed work introduces a fully automated classification approach, taking into consideration the high discrimination capability of four histological tissue alterations. The proposed work utilizes a deep supervised learning method, with a convolutional neural network (CNN) architecture achieving a classification accuracy of 95%. The classification capability of the new CNN model is compared with a pre-trained AlexNet model, a visual geometry group (VGG)-16 deep architecture and a conventional multilayer perceptron (MLP) artificial neural network. The results show that the constructed model can achieve better classification accuracy than VGG-16 (94%) and MLP (90.3%), while AlexNet emerges as the most efficient classifier (97%).

1. Introduction

Nonalcoholic fatty liver disease (NAFLD) is estimated to be the most common chronic liver disease, with one-quarter of the adult population suffering from it [1]. At the same time, nonalcoholic steatohepatitis (NASH) refers to an aggressive form of NAFLD, which is usually the leading cause of end-stage liver disease or liver transplantation, as it can progress to cirrhosis and hepatocellular cancer (HCC). The diagnosed prevalence of NASH is estimated to reach 18 million subjects by 2027 worldwide, especially in the US, Japan and the EU. Clinical trials have not yet established an effective form of pharmacotherapy for these two conditions. As disease rates tend to increase, even if medication becomes available, it will be still difficult to identify the target population for this treatment. Consequently, the interest of hepatologists in recent years has been in the definitive diagnosis of NAFLD, with histology being the gold standard in modern clinical trials. In this case, the microscopy method on biopsy needle samples makes it possible for all anatomical liver tissue structures, including those of NAFLD and NASH to be examined. In the context of NAFLD, steatosis is predominantly macrovesicular with single and large lipid intracytoplasmic vacuoles pushing aside the hepatocellular nuclei [2]. Occasionally, microvesicular steatosis with multiple small vacuoles within the cytoplasm can be observed, as well as large areas of macrovesicular steatosis agglomeration. In contrast, ballooned hepatocytes present enlarged round cells surrounded by a clear and vacuolar cytoplasm.
Even though liver biopsy is considered the gold standard for evaluating NAFLD and NASH activity, it is an invasive patient procedure [3]. In recent decades, many studies have relied on semi-quantitative predictions for chronic and end-stage liver diseases, which lack diagnostic accuracy due to diagnostic obstacles such as “inter-observer” and “intra-observer” variability. Each case involved subjective microscopic interpretations that came from specialized hepatologists [4]. According to Figure 1, the visual counting of these tissue alterations suggests a difficult and time-consuming process. To overcome this obstacle, modern studies have focused on the development of automated examinations using digital image processing techniques, which can effectively diagnose NAFLD and NASH [5].
A significant number of research efforts focus on the quantification of liver steatosis. These approaches utilize a combination of image processing techniques (including regions of interest segmentation) with supervised machine learning techniques, using manually annotated features. Τhe risk of hepatic obstruction, which refers to the blockage of the bile ducts, sinusoids, portal veins, etc., has led researchers to develop fat detection systems [6,7,8,9], combined with trained classifiers for the separation of fat tissue from other histological structures [10,11]. Thanks to the effectiveness of these diagnostic systems, histopathology has focused on more complex identification problems, including hepatocellular ballooning and tissue inflammation. These are two chronic diseases for which no automated diagnostic solutions existed until recently [12]. The field of histopathology needed a new generation of algorithms with more independent approaches to the segmentation and classification problems.
In recent years, deep learning methods have introduced innovative and effective solutions to many image analysis tasks. As a result, deep neural networks have expanded to the field of medical imaging, with the purpose to automatically capture the anatomy and physiology of diseases and to quantify their prevalence. Deep learning architectures have been applied to the prognosis of hepatic steatosis, and the monitoring of complex chronic conditions, including regions of collagen fiber [13]. A detailed description regarding the contribution of the referred research works is provided in the results and discussion sections.
This work presents a methodology for the classification of multiple hepatic structures from biopsy images, based on convolutional neural networks (CNNs). Particularly in medical image analysis, CNN architectures can overcome the problems caused by the hand-crafted features used in traditional techniques, due to their fully automated feature extraction as seen in Figure 2. The purpose of the proposed deep network is to solve a 4-class classification problem, with (a) ballooned hepatocytes and (b) fat droplets forming the disease classes, while (c) sinusoids and (d) veins forming the healthy classes. In the future, the proposed method could be integrated into a complete prognostic tool for (a) differentiating the healthy from the diseased tissue structures and (b) measuring the severity of the two diseases in clinical trials.

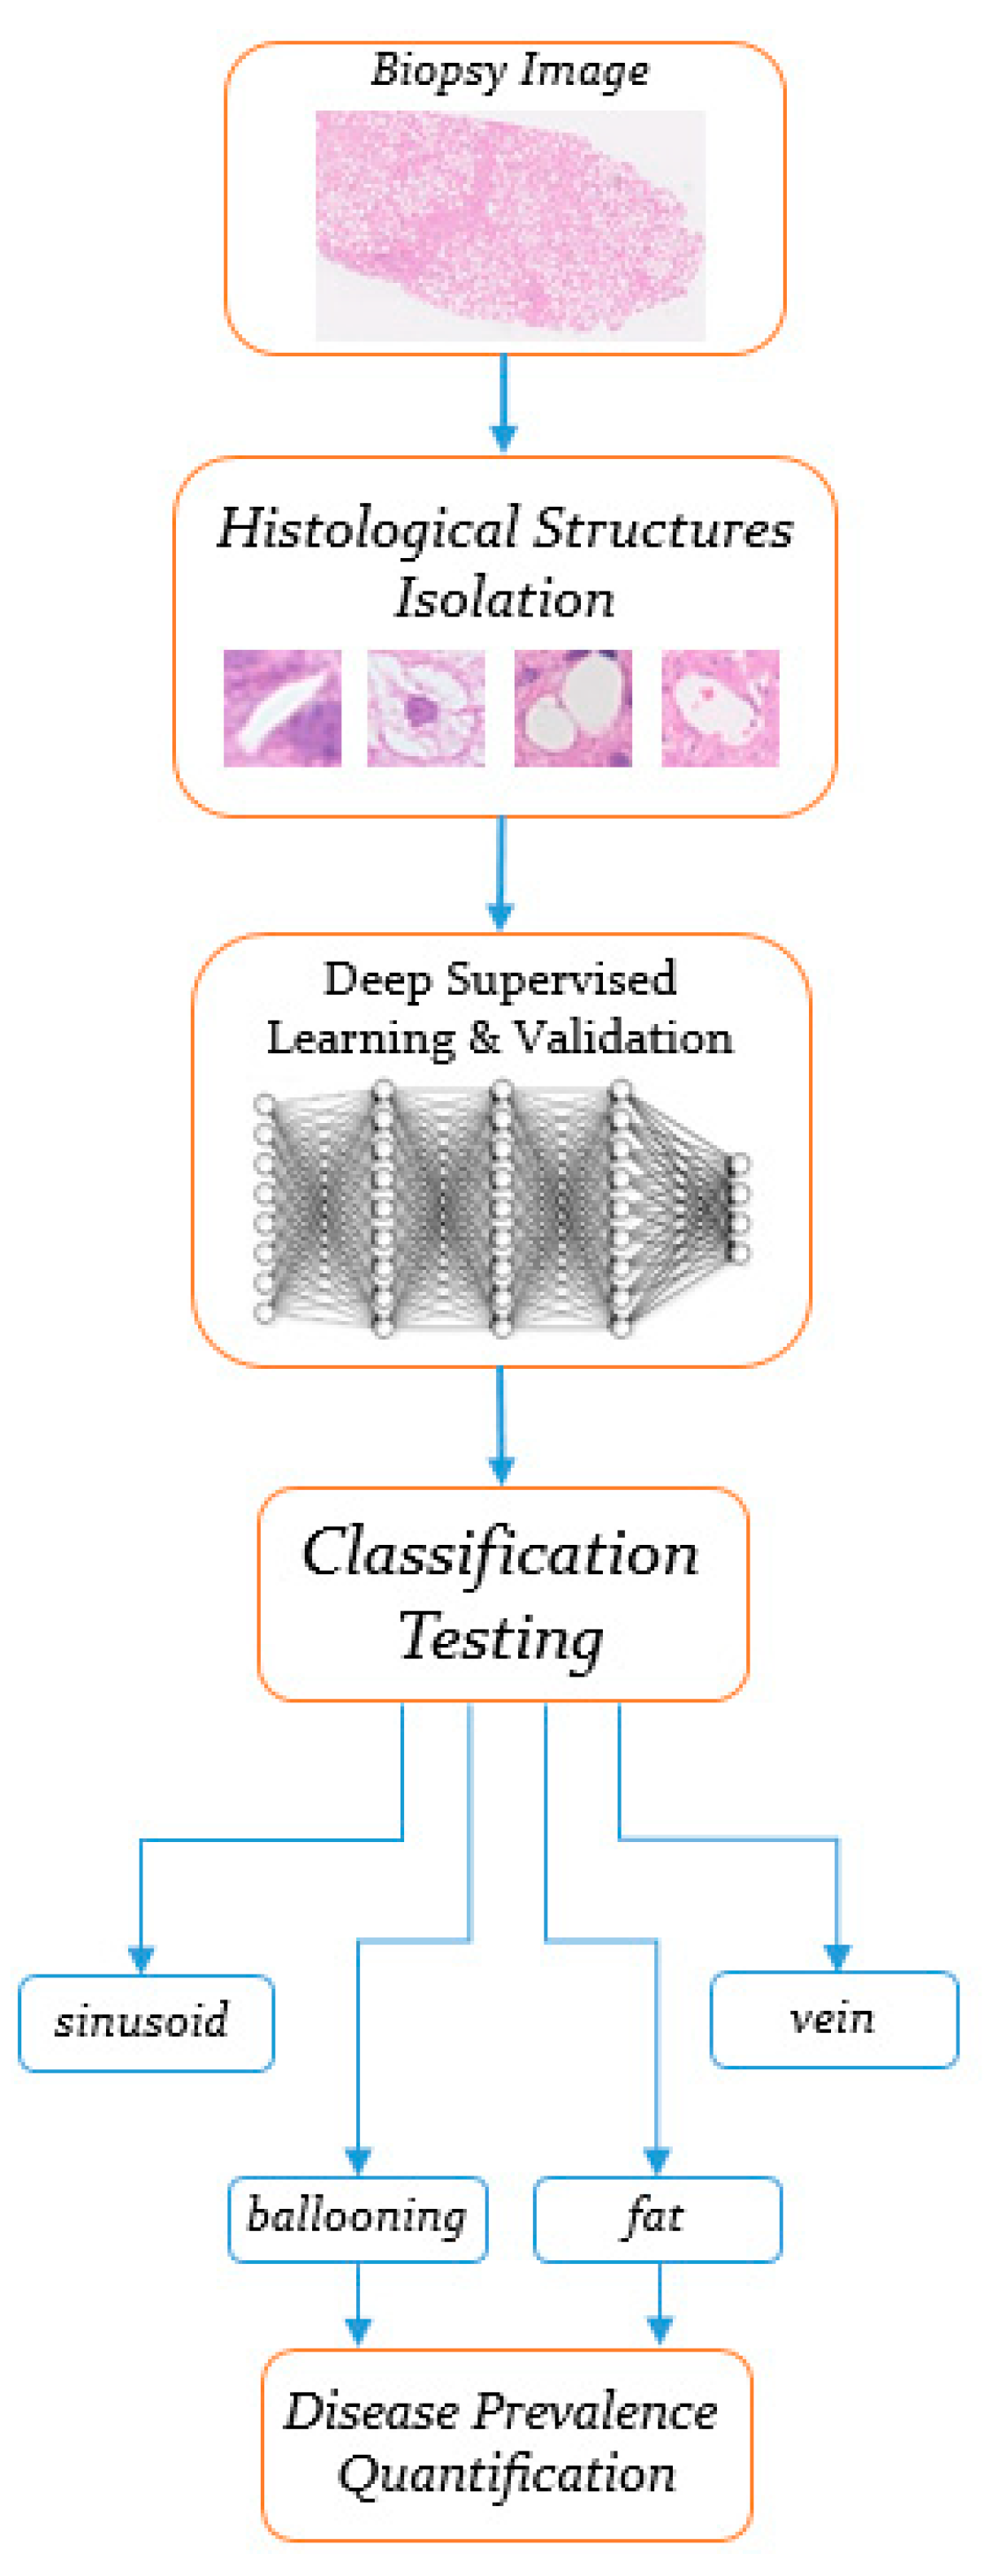
2. Materials and Methods

A two-step classification method is proposed, which can lead to the automatic characterization of the four histological objects:
Step 1.
Collection of a sufficient number of isolated training samples from digitized biopsies, pointing to the 4-class tissue alterations.
Step 2.
Training two convolutional neural networks carrying the same architecture, but employing different optimization algorithms, as well as estimating their classification performance in several testing images. Also, applying transfer learning updates to well-known pre-trained CNN models and comparing their quantitative performance with the one produced from the new CNN topology. Finally, comparing the same performance with that of a conventional neural network algorithm.

2.1. Histological Features Isolation

All biopsy slides involved in this study were collected at St. Mary Hospital (Imperial College Healthcare NHS Trust of London, UK) and came both from NAFLD and NASH patients. All subjects gave their informed consent for the inclusion of their samples in the current study, which was conducted following the rules of the Declaration of Helsinki (revised in 2013). In recent years, various histological dyes have been used for clinical examinations, including picro-Sirius red and Masson’s trichrome stains, particularly for the evaluation of liver fibrosis. However, for the following experiments, the gold standard Hematoxylin and Eosin (H&E) dye was selected to highlight the four tissue alterations. Generally, the dataset consists of 64 images digitized with a Hamamatsu microscope (Hamamatsu Photonics, Hamamatsu, Japan). Initially, these images exceeded 10,000 × 10,000 pixels, a size that could not be considered ideal for training deep learning algorithms. Downsampling the images at ×20 magnification proved to be an ideal solution, as it preserved all the anatomical details that form the four tissue structures.
Subsequently, a cropping tool was used to extract individual histological samples, in the form of image patches, from the whole tissue images. In total, 720 healthy and disease structures are provided to form a balanced image dataset (180 samples per class), which are stored in four categories implying the number of individual class objects. According to this assumption, an identification label is assigned for each microscopic structure, namely: (a) ballooning, (b) fat, (c) sinusoid and (d) vein. Furthermore, the dataset is partitioned into training/validation/testing subsets, where 620 structures were used for training, 60 for validation and 40 for testing.

2.2. Convolutional Neural Network Model Construction

In this stage, a CNN topology is defined to learn the most informative features from the extracted biopsy tissue structures. The convolution layer operations are accelerated with the use of an NVIDIA GTX1050Ti graphics processing unit (GPU). This refers to a popular computing distribution technique that can train deep neural networks in a short time. Figure 3 displays the techniques used in each layer of the proposed CNN architecture.
Initially, in the input layer, each image patch is resized to 64 × 64 × 3 pixel size (width, height, depth), with the bicubic interpolation method. Since this generates a large number of connections weights for modeling the image data, several dimensionality reduction techniques are used in the subsequent convolution layers:
  • In the first convolution layer, 64 convolution filters consisting of a 5-by-5 kernel size are defined to detect “low-level” features, such as edges, from the raw image data. In each convolution operation, zero-padding is utilized to assign 0 values around the inputs to maintain an output size equal to the input of each kernel filter [14]. Subsequently, batch normalization is applied to normalize the convolved values, as well as the Rectified Linear Unit (ReLU), being the nonlinear activation function, which is considered ideal for minimizing the vanishing gradient problem [15]. Even though ReLUs are widely used in most deep learning applications, their unboundedness on the positive side tends to cause overfitting. To circumvent this issue, max pooling filtering with a stride of 2 is set to decrease overfitting by reducing the spatial size (width and height) of the data representation [16].
  • The second convolution layer applies 32 filters with a 3-by-3 kernel size to search for “higher-level” features within each liver tissue object, including hepatocytes within a ballooning area, as well as multiple occurring pixels pointing at blood cells in hepatic veins. Batch normalization, ReLU function, and max pooling are included again, while dropout with a 0.5 probability is applied with the purpose to prevent overfitting [17].
  • In the third convolution layer, 16 filters with a 3-by-3 kernel size aim to emphasize on connected pixels that can differentiate the textural features among the four examined histological structures. Max pooling is no longer applied and the training process makes a transition to the fully connected layer.
  • The fully connected layer defines a dense layer with 4096 flattened neurons to gather the filtered anatomical features from the three convolution layers. These neurons are further connected to the final softmax layer. Dense and softmax layer connections act similar to a multilayer perceptron (MLP) artificial neural network, with the softmax function allocating probability distributions during the prediction of the four hepatic classes [18].

2.3. Applied Optimization Algorithms

A brief reference is made to various parameter values defined in two modern backpropagation algorithms for optimizing the training process. The first applied optimizer is adaptive moment estimation (Adam), which is known for its low memory requirements, as it takes into account first-order gradients only [19]. Since this optimization method is adaptive, it tends to calculate different learning rates from the first (mean) and second raw (uncentered variance) moment estimates of the gradients. Therefore, the updated weights are calculated as follows:
Δ θ = ε s ^ r ^ + δ θ     θ   +   Δ θ ,
where ε denotes the initial learning rate set equal to 0.001, s ^ the first-moment bias and r ^ the corresponding second. δ refers to a numerical stabilization constant with a 10−8 value, assigned (by default) to reduce the variance in weight updates [20]. In Adam, an important parameter is the decay rate of the squared gradient moving average for penalizing large weights, which is set to a 0.99 scalar value. All the above configurations aim at a more efficient convergence of the loss function towards the global minimum.
The second optimization solution comes from the application of the stochastic gradient descent with momentum (SGDM) algorithm. Specifically, the momentum value is set to accumulate an exponentially decaying average of past gradients, as it continues to move in their direction [20]. Here, the general update rule is given by:
m     β m   +   ε θ J ( θ ) θ     θ     m ,
where β is a hyperparameter set at 0.9 to prevent momentum m from overspeeding and θ the updated network weights [14]. The θ values are obtained by subtracting the gradient of the loss function J(θ) from the weights ∇θJ(θ), which are multiplied by a constant learning rate ε equal to 0.001.

3. Results

The proposed CNN model used two separate training processes utilizing a different optimizer each time. The Adam optimizer was used for the first process while the SGDM optimizer was used for the second process. This section focuses on (1) measuring the performance of the constructed deep architecture on the validation samples (n = 60) as well as (2) the classification capability on the test set (n = 40). At a later stage, the CNN network with the optimal optimization algorithm is compared with well-known pre-trained CNN architectures, utilizing transfer learning updates. Subsequently, the prediction capability of the same optimal model is compared to that of a conventional multilayer perceptron (MLP) neural network.

3.1. Training and Validation Results

Having defined the CNN topology, the focus is on the training process, which is set to run for 30 epochs. Εvery epoch comprises of a full cycle on the entire training set, consisting of 620 samples. Also, the option of shuffling the training data to the input layer is applied at the beginning of each epoch.
Figure 4 presents a comparison of the validation graphs, each of which is derived from the training procedure with one of the analyzed optimizers. According to the diagram, the training process is set to run for a maximum of 270 iterations, in which the accuracy of the validation data is calculated. It is recalled that the validation set is not used to update the network weights, but to assess whether a model suffers from either overfitting or underfitting. Finally, a validation patience value of 3 is set to stop the training process, in case the same validation value is produced at least three times, indicating that the CNNs have learned sufficiently from the image data.
At first, the CNNAdam validation graph (Figure 4) is monitored, which shows the convergence of the neural network’s training process during the 162nd training iteration. This was the result of the combination of overfitting with the production of three similar validation values equal to 91.7%. In contrast, the CNNSGDM graph shows that the SGDM optimizer performed better as it did not overfit the training data. This led to better results, as the deep classifier not only completed the learning process by running in all 30 epochs but also produced a higher validation value of 96.7%.

3.2. Testing Results

To test the reliability of the developed methodology, the two-trained models (CNNAdam and CNNSGDM) are called to identify 40 unknown liver structures (10 per class). In the current task, the softmax function is asked to assign an input image described by a vector x, to a class identified by a class label y ∈ {ballooning, fat, sinusoid, vein}. Thus, the function outputs a probability distribution value for the four classes within a [0,1] confidence interval. After the end of the testing process the purpose is (a) to measure the classification accuracy for every individual liver class and (b) retrieve further statistics from the classification report. These metrics include the mean accuracy, precision, recall (sensitivity) and F-score (Table 1).
Examples of the image patch test results are shown in Figure 5. Each of these images is accompanied by its estimated classification probability (%), indicating how confident the CNNs are of their predictions. According to the figure, in most cases, an accurate discrimination result marked by a green frame is presented for the four hepatic tissue objects. It is observed that both neural networks have a reduced efficiency in identifying some sinusoids (red frames = misclassifications), which are among the most complex histological features to classify. However, the success lies in the fact that all ballooned cells and fat droplets, which characterize two of the most widespread liver diseases, have been identified with high confidence levels. Based on the exported percentages in Table 1, it is clear that the classifiers are more stable in detecting ballooned hepatocytes, as these consist of multiple changes in the values of their adjacent pixels. They also successfully achieve a visual discrimination of circular structures not always referred to as steatotic fat cells, but as hepatic veins, because they tend to contain several red blood cells.
Proceeding to Table 1, additional information is provided for the two classifiers, with the mean precision and recall (sensitivity) values. First, the performance of CNNAdam shows a lower recall value (92.5%) compared to higher precision (93.6%). This indicates that CNNAdam failed in some true positive (TP) samples. Consequently, it produced more false negative (FN) diagnostics and less false positive (FP) ones, respectively. Examples of CNNAdam misclassifications are shown in Figure 5 below, in which two incorrect sinusoid characterizations are displayed. In contrast, CNNSGDM delivered balanced precision and recall rates (95%), by producing more true positives (TP). For verification purposes, the two measures are combined into a single F-score (F1-score) value, representing their harmonic mean. Thus, if one metric carries a lower value, the F-score converges closer to the small number than the large one, which gives the classification models a more appropriate score than a common arithmetic mean. CNNAdam then receives a 93% F-score, whereas CNNSGDM a higher 95% F-score due to its fully balanced performance.

3.3. Performance Comparison with Pre-Trained CNN Models

Ιn the next step, the performance of the optimal CNNSGDM classifier is compared with two of the most widely used CNN pre-trained models. These refer to the 8-layer AlexNet [21] and the deeper 16-layer VGG-16 [22] neural networks, two architectures that have yielded high classification results in recent years. In both pre-trained models, transfer learning updates have been applied to adapt them to the current classification problem of the four liver tissue alterations. Initially, to apply transfer learning to the AlexNet network, the biopsy image patches were resized to 227 × 227 × 3 pixels, a necessary step to fit as input samples. The output layers of the original AlexNet-CNN network were replaced accordingly to generate probabilities for the four histological structures. In the case of VGG-16, the samples were converted to 224 × 224 × 3 pixel size and the output layers were modified as before.
In both classifiers, the training process was set for a maximum of 10 epochs, while the SGDM algorithm was used to optimize the training process. The validation patience number was set again equal to 3, with the networks completing their training in less than 10 epochs. According to Table 2, a comparison of the accuracy, precision (positive predictive value—PPV), recall (sensitivity) and specificity (true negative rate—TNR) rates, generated by the AlexNet, VGG-16 and the previously built CNNSGDM architecture, is done. According to the percentages in Table 2, the constructed CNNSGDM architecture achieves better classification performances (accuracy: 95%, precision: 95%, recall: 95%, specificity: 98.3%) than VGG-16 (accuracy: 94%, precision: 94.1%, recall: 94%, specificity: 98%), while AlexNet emerges as the most optimal classifier (accuracy: 97%, precision: 97%, recall: 97%, specificity: 99%). All performance differences are presented in Figure 6.

3.4. Performance Comparison with a Conventional Neural Network

Τhe performance of a conventional artificial neural network algorithm is then investigated. In more detail, a Multilayer Perceptron (MLP) with 2 hidden layers consisting of 6 nodes each was called upon to perform training and testing on selected features (area, eccentricity, mean intensity, StD intensity, etc.) extracted from pre-processed images of the same biopsy data set. Once again, the output consisted of 4 nodes pointing to the 4-tissue structures prediction problem. According to the results of Table 2, the MLP produced lower classification rates than the CNNSGDM model (accuracy: 90.3%, precision: 90.3%, recall: 90.3%, specificity: 96.8%). Details of the produced measurements can be found again in Figure 6.

3.5. Visualization of Filtered Anatomical Features

This subsection focuses on investigating the feature activations of ballooned cells and fat droplets in all convolution layers for the CNNSGDM and AlexNet models (Figure 7). This visualization tool could help physicians determine the most critical anatomical patterns that characterize the two liver diseases examined in this study. A key characteristic of each convolution filter is that it converts each image patch into multiple feature maps that are more similar to the filter itself [14]. These feature maps are then rectified by the ReLU function, ensuring that they always carry positive activation values. In the ReLU function, since any positive value can be assigned to the activated pixels, a division of the gradient tensor by its l2-norm is proposed, making the magnitude of the output normalized to a closed [0,1] interval [23]. This ensures that the magnitude of all activations is always within the same range of each previously convolved image, making the final representations more visually intense. Therefore, bright white pixels represent strong positive activations, while pure black pixels represent strong negative ones, respectively.
As shown in Figure 7, it is found that in the two CNNs, the interest in the first ReLU1 activations lies at identified edges, which can synthesize the basic structure of the balloon cell and fat droplet. It is recalled that both the CNNSGDM and AlexNet models apply the max pooling operation to their convolution layers (CNNSGDM: layers 1, 2, AlexNet: layers 1, 2, 5). Unlike CNNSGDM, AlexNet applies a 3 × 3 max pooling in all cases, which causes more blur in the two liver samples as it aims to reduce overfitting of the convolved pixel data. Based on the ReLU2 activations, this technique is demonstrated to be efficient as it forces both neural networks to filter “higher-level” features that are less co-adapted and can lead to better generalization. Also in ReLU2, it turns out that CNNSGDM executes an earlier activation of pixels that indicate swollen hepatocytes, while AlexNet chooses to perform additional filtering on the detected edges. Moving onto ReLU3 activations, it is noted that non-informative pixel activations have been significantly reduced in both deep models, with AlexNet performing a more ideal filtering of the necessary curves that form the perimeter of the ballooned hepatocyte and the lipid droplet. The same model achieves also better performance within the ballooning area, as only the most important pixels of the two hepatocytes are activated.
It is known that the AlexNet architecture consists of two additional convolution layers [21] which, according to the above figure, can lead to the activation of individual small patterns that could improve the overall classification performance. However, it seems that the first three convolution layers of CNNSGDM are sufficient for the necessary histological features to be filtered. On the other hand, a key prerequisite for CNNSGDM is to determine more optimal parameters which could further reduce the overfitting effect on the training data.

4. Discussion

Non-alcoholic fatty liver disease (NAFLD) is a common cause of liver disorder worldwide. Many studies investigating the natural history of NAFLD have verified its progression from chronic non-alcoholic steatohepatitis (NASH) to end-stage cirrhosis and hepatocellular carcinoma (HCC) [24]. Because a multitude of complications impede their accurate identification and treatment, their prevalence has been evaluated with a variety of diagnostic methods. Quantitative assessment through digital histological imaging has been established as the gold standard in clinical trials, with liver biopsies being the mean for the detection and staging of NASH and NAFLD. However, it is an invasive patient procedure and for this reason, it can be applied in cases that do not allow subjective evaluations.
The current study is an extension of an earlier project [25], the results of which were presented at 42nd International Conference on Telecommunications and Signal Processing (TSP) held in Budapest in July 2019. It focuses on resolving the aforementioned diagnostic barrier by fully automating the supervised classification process using deep learning systems. In particular, a CNN architecture is defined for fast training and accurate classifications on four liver tissue structures from biopsy images. Objects of interest relate to two liver disease structures including, (a) ballooned hepatocytes and (b) fat droplets, as well as two non-disease related objects including, (c) sinusoids and (d) veins. Then, the performance of this new deep topology is compared with that produced by well-known pre-trained CNN models, as well as with a conventional MLP-ANN.
The forthcoming subsections aim to comment on techniques previously applied to a 4-class recognition problem, eventually producing a 95% classification accuracy. The following steps include an overview of research efforts on histopathological liver specimens. The main goal is the obtained results to be qualitative compared with those coming from different diagnostic applications and different liver tissue examinations in recent years. Then, a brief description of the possibilities of extending the present methodology is given, continuing on the motif of fully automated object recognition and how they can offer effective solutions to medical diagnostic centers.

4.1. Discussion of Research Findings

4.1.1. Training and Validation Results

Figure 4 illustrates a dashboard showing the validation values, during the training phase, in the corresponding subset of validation images (n = 60). In the first validation step, CNNAdam performs better than CNNSGDM (CNNAdam: 85%, CNNSGDM: 78%), but in future validations, its performance is inferior to that of CNNSGDM, as it tended to overfit the training data. These results are in line with other published conclusions [26,27], claiming that adaptive-based algorithms can boost the CNN computations, by using a vector of changing learning rates, one for each parameter, which is adapted as the training algorithm progresses. This is in contrast to stochastic gradient descent (SGD) optimizers, which use a constant learning rate during the training process [27]. These publications emphasize that even with a small number of mini-batches (64 image patches in the current study), Adam finds no solutions whose performance matches state-of-the-art. It has been constantly shown to be related to non-generalized results and especially in this case to non-convergence. In conclusion, it is usually noted that in systems with large computational resources, the use of SGD-type optimization techniques remains the ideal solution.

4.1.2. Testing Performance

The boxplot has become an ideal technique for presenting a 5-number summary (minimum and maximum range values, upper and lower quartiles, and median value), offering a quick analysis of the models’ classification performance [28]. Both CNNAdam and CNNSGDM neural networks show a comparatively longer inter-quartile range (IQR) in the sinusoid class, yielding ultimately higher larger error values, resulting from Q3 + 1.5 * IQR, than the rest hepatic tissue structures. Based on Figure 8, two false positive sinusoid classifications in CNNAdam as liver veins have yielded a greater error variability for the corresponding vein class. The same is true for the CNNSGDM model diagram, where one incorrect classification of a balloon cell as sinusoid (false positive) and another, including a sinusoid misclassified as a ballooning area (false negative), have increased the inter-quartile error range for both class labels. All these performances, along with the error rates, ultimately produce a classification accuracy of up to 95%. It is noted that they show an improvement compared to the results of previous classification approaches [29] and is expected that they will further reduce the overall fat and ballooning prevalence ratio error compared to human visual interpretations [30]. It is also important, that current outcomes suggest a steady improvement in automated detection techniques and emphasize their diagnostic capabilities with respect to semi-quantitative methods.

4.1.3. Methodology Performance Compared to Other Classification Models

According to Table 2 and the accompanying Figure 6 diagram, CNNSGDM performs better than VGG-16, demonstrating that it can significantly contribute to fully automated disease assessments. On the other hand, the AlexNet model achieves better performance. However, the proposed deep CNN classifier is focused on short training processes from scratch as well as on minimizing the number of layers (4 layers in total compared to 8 layers of AlexNet and 16 layers of VGG-16). On the contrary, the poor, compared to the CNN architectures, performance of conventional MLP-ANN is one of the main reasons that have led the research community to make the transition to deep learning algorithms.
Table 3 summarizes all the deep neural networks used in the liver biopsy dataset classification process along with their training times. It is emphasized that these training times cannot be directly compared since transfer learning updates have been applied to AlexNet [21] and VGG-16 [22] networks, which have been trained from scratch with the ImageNet dataset. Specifically, AlexNet was trained for 6 days on two NVIDIA Geforce GTX 580 GPUs and VGG-16 on four NVIDIA Titan Black GPUs for 2–3 weeks. Although these architectures are two of the most preferred options for extracting image features, they consist of a huge number of trainable parameters (AlexNet: 60 million, VGG-16: 138 million), leading to a very demanding processing procedure for the average hardware systems. It is shown that the AlexNet transfer learning process lasted 45 seconds, while for the much deeper VGG-16 model, it took 5 min and 13, which is longer than the CNNSGDM training from scratch process, which was completed in 2 min thanks to its 16,825,876 trainable parameters. All these conclusions justify the effort of novel research works to develop new deep models that could achieve new and shorter training performances on specific classification problems, without the employment of high-budget hardware equipment.

4.2. Visualization of Learned Features

A characteristic of a convolution filter is that it decomposes each histological sample into multiple feature maps [23]. Figure 7 includes a commonly used technique for visualizing these maps into independent 2D images.
In most computer vision problems there is a constant change in the background scene, with trained models being called upon to achieve a more rational separation of common objects of interest. Unlike the present identification problem, where there is a recurring background consisting of pixels that usually carry an H&E histological stain, along with objects of non-interest, such as healthy tissue and hepatocytes. As a positive observation in Figure 7, background pixel activations are significantly minimized in the ReLU functions in both CNNSGDM and AlexNet models, with tissue structures being successfully recognized. Thanks to the classifiers’ deep architecture, a distinction is made between critical features, such as the change in adjacent pixels intensities that point to different edge types (e.g. straight or curved lines), but also to more detailed structures including ballooned hepatocytes. However, carrying even a small proportion of background pixel activations remains a cause of overfitting, and future applications aim to limit this issue with solutions proposed in the last section.

4.3. Qualitative Performance Comparison with Prior Methodologies

The number of digitally scanned microscopic specimens (64), along with the extracted image patches (720), form a sufficient image dataset for the implemented deep CNN architecture. A step that allows a qualitative comparison of the present work with recent innovative efforts aimed at locating diverse anatomical structures and chronic conditions, exclusively on liver biopsy images.
Unfortunately, a direct quantitative comparison with other relative works, presented in the literature, is not feasible. The current study employs a unique liver biopsy dataset, while the cited papers do not in all cases analyze the same histological areas of interest. Also, the cited methods do not rely on similar evaluation metrics when measuring their classification capability. Therefore, Table 4 intends to make a qualitative comparison of the referred methodologies, derived from a combination of digital image processing techniques with conventional machine learning algorithms and fully automated deep learning architectures. The table below initially shows that image preprocessing to H&E stained samples remains an essential step for image segmentation purposes. Also, unsupervised machine learning algorithms, such as K-means, refer to popular clustering techniques for separating biopsy samples from their background as well as tissue structures of interest. Subsequently, these methods lead well-known classifiers such as k-nearest neighbors (k-NN), decision tree (DT) and support vector machines (SVM) to high object recognition performances.
Nativ et al. [6] presented an image analysis method that could distinguish the main differences between small-droplet macrovesicular steatosis (sd-Mas) and large-droplet macrovesicular steatosis (ld-MaS). The methodology was based on an automated active contour modeling (ACM) technique for lipid droplet segmentation, the unsupervised K-means algorithm for clustering the two objects of interest and a decision tree classifier to improve the separation between the two categories. After the classification stage, specificity and sensitivity values were 93.7% and 99.3%, respectively. The linear regression coefficient of determination was equal to 0.97, as the correlation method with semi-quantitative pathologists’ assessments.
Sumitpaibul et al. [7] proposed an image processing-based method for estimating the fat ratio in liver biopsy images. This study adopted classic image processing techniques to extract the areas of candidate fat blobs, including grayscale and binary image conversion, background segmentation and average noise filtering. Next, the k-NN classifier was called to identify fat blobs that could lead to an accurate calculation of the fat prevalence ratio.
Hall et al. [8] investigated the relationships between liver fat, aminotransferases, and hepatic architecture in steatotic liver sample examinations. Binary segmentation of the red, green and blue (RGB) channels resulted in the distinction of fat vacuoles and the measurement of the fat proportionate area (mFPA). The results showed that there were significant increases in alanine aminotransferase (ALT), and aspartate aminotransferase (AST) when the fat content increased. Other data also indicated both 5% and 20% of mFPA as a cut-off for raised ALT. Moreover, significant growth in hepatic architecture (HA) and lobule radius (LR) were observed when fat accumulation increased (mFPA = 10%).
Roy et al. [9] proposed a segmentation method for extracting histological regions of interest from high-resolution biopsy images. This was followed by the application of image enhancement and morphological operation techniques to enhance and smooth the boundaries of steatosis components, as well as to remove small undesired objects. Furthermore, a sophisticated technique for assigning curvature points to differentiate overlapped fat droplets was presented. Finally, a supervised classification step was used and resulted in discrimination rates for both isolated and overlapped steatosis, where in most cases they were equal to 100%.
Following Vanderbeck et al. [10], they focused on a multiple liver class recognition problem. The method relied on both image preprocessing and supervised classification techniques. The SVM algorithm performed 89% classification accuracy and identified macrosteatosis, bile ducts, portal veins and sinusoids with precision and recall values ≥ 82%. The same team in a subsequent study [12] focused on the automatic detection and quantification of lobular inflammation and hepatocellular ballooning. As before, image preprocessing and supervised classification resulted in 70% and 49% precision and recall values for lobular inflammation and 91% and 54% for hepatocellular ballooning. In addition, the classifier had a 95% area under the curve (AUC) for lobular inflammation and 98% for hepatocellular ballooning. The Spearman’s correlation coefficient was applied to compare the method’s performance with that of expert pathologists and was 45.2% for lobular inflammation and 46% for hepatocyte ballooning.
Segovia-Miranda et al. [11] applied a three-dimensional imaging technique, to generate spatially-resolved geometrical and functional models for the diagnosis of liver tissue specimens at different NAFLD stages. The methodological approach identified a set of morphological changes associated with NAFLD progression. These morphological changes included the size of lipid droplets distribution, nuclear texture homogeneity, and feature values which were used as tissue biomarkers to distinguish the different stages of NAFLD progression. Correlations between various diagnosed findings and NAFLD progression in individual patients were analyzed. The results indicated that gamma-glutamyl transpeptidase (GGT) had the strongest Pearson correlation coefficient (GGT = 0.680). The same coefficient was 0.473 for alkaline phosphatase (ALP), 0.505 for total bile acid (BA) and 0.518 for the corresponding primary BA.
More recently, there has been an increase in the selection of deep convolutional neural networks for the classification and monitoring of microscopic structures. Vicas et al. [13] aimed at fully-automating the liver fibrosis detection process. The same group also focused on the objective quantification of steatosis, with classical computer vision techniques (image processing, conventional machine learning) and CNNs being the two diagnostic approaches. In the case of deep neural networks, the U-net proved to be the optimal approach for performing pixel-wise region segmentations. The validation of the automated quantitative analysis was performed using the R2 correlation coefficient based on a physician’s qualitative scores. Specifically, the R2 was 0.748 for the classical computer vision approach and 0.893 for the CNN, respectively.
The above qualitative comparison shows in total that the full capabilities and strengths of the digital image processing field remain to be explored. Nonetheless, it becomes clear that deep learning algorithms can achieve high classification rates, by fully automating the image analysis process without the extensive need for image enhancement and object segmentation techniques. In the next subsection, new techniques, which have been implemented by many experts in the field of deep learning, are discussed and could lead to an improvement of the current methodology.

4.4. Future Thoughts and Ideas

As a future work, many improvements could be included such as (a) digitizing new biopsy samples and increasing the dataset in more than 1000 liver structures, (b) enhancing the neural network discrimination experience by applying transfer learning updates and (c) parameterizing the CNN architecture to adapt to the imminent amount of data. The first step can be done in parallel with data augmentation techniques, which refer to classic 2D image transformations, including random rotations, random shearing-zooming, horizontal and vertical flips, etc. Applying more optimizers, including RMSprop and Adadelta, could also prove to be a good alternative to the proposed backpropagation algorithms.
Thereafter, autoencoder neural networks could make a significant contribution to the data preprocessing stage, further limiting the overfitting effect in the training set. Autoencoders (ex. stacked, variational) refer to a sophisticated technique for learning efficient representations of input data, without any supervision [14]. Typically, the autoencoders’ output is a reconstruction of the input data in its most efficient form [16]. The current unsupervised model will be employed to reduce the dataset’s dimensionality, by preserving the most informative elements that compose a liver disease structure and eliminating the background pixels activations as much as possible.
Future projects will include an accurate method that could involve real-time histological classifications through a digital microscope. All current study implementations, as well as future improvements, will also be included for disease quantification purposes. During the scan of biopsy specimens, the learned feature weights will lead detection windows (as bounding boxes with active contour lines) to structures identified with the four liver classes (Figure 9). Typical examples of such detectors are (a) region-based convolutional neural networks (R-CNNs) [31,32], (b) you only look once (YOLO) [33,34] and (c) single shot detector (SSD) [35]. An interesting choice is also the U-Net architecture [36], which includes a variant of CNNs, for pixel-wise segmentation.
Following the extraction of the histological sample area (e.g. with K-means) and the discrimination of structures of interest, the exclusion of anatomic features not related to pathological findings will be executed, performing an objective assessment of the liver diseases. As a result, clinicians will have at their disposal a quick and accurate diagnostic tool for support, which will compute the percentages of ballooning degeneration and fat accumulation ratio. The quantification of the two conditions will be carried out using the following formula:
P LD = 1 n t i = 1 n ( b i | |   f i ) × 100 ,
where bi and fi are the total count of pixels that form multiple classified balloon cells or fat droplets, respectively, eventually divided by the total area of tissue pixels nt.

5. Conclusions

The current work focuses on building a deep convolutional neural network architecture, aiming at short training time combined with the precise classification of four liver biopsy tissue alterations. The new CNN model was trained on two different occasions with the SGDM and Adam optimization algorithms, with SGDM producing the optimal classification accuracy (95%). The performance of the new CNNSGDM topology was then compared with that of the pre-trained AlexNet and VGG-16 models, in which transfer learning updates were applied, as well as with a conventional MLP artificial neural network. The results showed that the constructed CNNSGDM model can achieve better classification accuracy than VGG-16, while AlexNet emerged as the most optimal classifier. Also, the constructed model was superior to the conventional MLP-ANN, indicating the need to apply deep learning architectures to modern computer vision methodologies. In conclusion, CNN architectures are based on fully automated image analysis steps, without the extensive need for manual annotations. This is a decisive step in the objective distinction of hepatocyte ballooning and fat droplets, two tissue structures responsible for the increasing prevalence of NAFLD and NASH in recent years.

Author Contributions

A.T.T., N.G. and C.T.A. conceived of the idea and methodology, A.A. developed the CNN architecture and extracted the results for the current dataset, M.G.T. and V.C. employs transfer learning and classical ANNs to produce comparative results in the same dataset, R.F. and P.M. provided the annotated set of biopsies and support the pathological point of view of the methodology and the results, A.A. and all other authors prepared the manuscript, E.G. and A.T.T. organized the research team, and N.G. supervised the project. All authors have read and agreed to the published version of the manuscript.

Funding

This work is partly funded by the project entitled xBalloon, co-financed by the European Union and Greek national funds through the Operational Program for Research and Innovation Smart Specialization Strategy (RIS3) of Ipeiros (Project Code: 5033187).

Conflicts of Interest

The authors declare no conflict of interest.

References

  1. Sumida, Y.; Yoneda, M. Current and future pharmacological therapies for NAFLD/NASH. J. Gastroenterol. 2018, 53, 362–376. [Google Scholar] [CrossRef] [Green Version]
  2. Germani, G.; Laryea, M.; Rubbia-Brandt, L.; Egawa, H.; Burra, P.; OʼGrady, J.; Watt, K.D. Management of Recurrent and De Novo NAFLD/NASH After Liver Transplantation. Transplantation 2019, 103, 57–67. [Google Scholar] [CrossRef] [PubMed]
  3. Fujimori, N.; Umemura, T.; Kimura, T.; Tanaka, N.; Sugiura, A.; Yamazaki, T.; Joshita, S.; Komatsu, M.; Usami, Y.; Sano, K.; et al. Serum autotaxin levels are correlated with hepatic fibrosis and ballooning in patients with non-alcoholic fatty liver disease. World J. Gastroenterol. 2018, 24, 1239–1249. [Google Scholar] [CrossRef] [PubMed]
  4. Chalasani, N.; Younossi, Z.; Lavine, J.E.; Charlton, M.; Cusi, K.; Rinella, M.; Harrison, S.A.; Brunt, E.M.; Sanyal, A.J. The diagnosis and management of nonalcoholic fatty liver disease: Practice guidance from the American association for the study of liver diseases. Hepatology 2018, 67, 328–357. [Google Scholar] [CrossRef]
  5. Goceri, E.; Shah, Z.K.; Layman, R.; Jiang, X.; Gurcan, M.N. Quantification of liver fat: A comprehensive review. Comput. Biol. Med. 2016, 71, 174–189. [Google Scholar] [CrossRef]
  6. Nativ, N.I.; Chen, A.I.; Yarmush, G.; Henry, S.D.; Lefkowitch, J.H.; Klein, K.M.; Maguire, T.J.; Schloss, R.; Guarrera, J.V.; Berthiaume, F.; et al. Automated image analysis method for detecting and quantifying macrovesicular steatosis in hematoxylin and eosin-stained histology images of human livers. Liver Transplant. 2014, 20, 228–236. [Google Scholar] [CrossRef] [PubMed]
  7. Sumitpaibul, P.; Damrongphithakkul, A.; Watchareeruetai, U. Fat detection algorithm for liver biopsy images. In Proceedings of the International Electrical Engineering Congress (iEECON), Chonburi, Thailand, 19–21 March 2014; Institute of Electrical and Electronics Engineers (IEEE): Piscataway, NJ, USA, 2014. [Google Scholar] [CrossRef]
  8. Hall, A.; Covelli, C.; Manuguerra, R.; Luong, T.V.; Buzzetti, E.; Tsochatzis, E.; Pinzani, M.; Dhillon, A.P. Transaminase abnormalities and adaptations of the liver lobule manifest at specific cut-offs of steatosis. Sci. Rep. 2017, 7. [Google Scholar] [CrossRef]
  9. Roy, M.; Wang, F.; Teodoro, G.; Vos, M.B.; Farris, A.B.; Kong, J. Segmentation of overlapped steatosis in whole-slide liver histopathology microscopy images. In Proceedings of the 40th Annual International Conference of the IEEE Engineering in Medicine and Biology Society (EMBC), Honolulu, HI, USA, 18–31 July 2018; Institute of Electrical and Electronics Engineers (IEEE): Piscataway, NJ, USA, 2018; pp. 810–813. [Google Scholar] [CrossRef] [Green Version]
  10. Vanderbeck, S.; Bockhorst, J.; Komorowski, R.; Kleiner, D.E.; Gawrieh, S. Automatic classification of white regions in liver biopsies by supervised machine learning. Hum. Pathol. 2014, 45, 785–792. [Google Scholar] [CrossRef]
  11. Segovia-Miranda, F.; Morales-Navarrete, H.; Kucken, M.; Moser, V.; Seifert, S.; Repnik, U.; Rost, F.; Hendriks, A.; Hinz, S.; Rocken, C.; et al. 3D spatially-resolved geometrical and functional models of human liver tissue reveal new aspects of NAFLD progression. bioRxiv 2019. [Google Scholar] [CrossRef] [Green Version]
  12. Vanderbeck, S.; Bockhorst, J.; Kleiner, D.; Komorowski, R.; Chalasani, N.; Gawrieh, S. Automatic quantification of lobular inflammation and hepatocyte ballooning in nonalcoholic fatty liver disease liver biopsies. Hum. Pathol. 2015, 46, 767–775. [Google Scholar] [CrossRef] [Green Version]
  13. Vicas, C.; Rusu, I.; Al Hajjar, N.; Lupsor-Platon, M. Deep convolutional neural nets for objective steatosis detection from liver samples. In Proceedings of the 13th IEEE International Conference on Intelligent Computer Communication and Processing (ICCP), Cluj-Napoca, Romania, 7–9 September 2017; Institute of Electrical and Electronics Engineers (IEEE): Piscataway, NJ, USA, 2017; pp. 385–390. [Google Scholar] [CrossRef]
  14. Geron, A. Hands-On Machine Learning with Scikit-Learn and Tensorflow: Concepts, Tools, and Techniques to Build Intelligent Systems; Tache, N., Ed.; O’Reilly Media: Sebastopol, CA, USA, 2017. [Google Scholar]
  15. Zhou, S.K.; Greenspan, H.; Shen, D. Deep Learning for Medical Image Analysis; Pitts, T., Ed.; Academic Press: Cambridge, MA, USA; Elsevier: Amsterdam, The Netherlands, 2017. [Google Scholar]
  16. Patterson, J.; Gibson, A. Deep Learning: A Practitioner’s Approach; Loukides, M., McGovern, T., Eds.; O’Reilly Media: Sebastopol, CA, USA, 2017. [Google Scholar]
  17. Hinton, G.E.; Srivastava, N.; Krizhevsky, A.; Sutskever, I.; Salakhutdinov, R.R. Improving neural networks by preventing co-adaptation of feature detectors. arXiv 2012, arXiv:1207.0580. [Google Scholar]
  18. Hernandez, M.V.; Gonzalez-Castro, V. Medical image understanding and analysis (MIUA). In Proceedings of the Communications in Computer and Information Science, 21st Annual Conference, Edinburgh, UK, 11–13 July 2017; Springer: Berlin/Heidelberg, Germany, 2017. [Google Scholar]
  19. Kingma, D.; Ba, J. Adam: A method for stochastic optimization. In Proceedings of the 3rd International Conference on Learning Representations, San Diego, CA, USA, 7–9 May 2015. [Google Scholar]
  20. Goodfellow, I.; Bengio, Y.; Courville, A. Deep Learning; Dietterich, T., Bishop, C., Heckerman, D., Jordan, M., Kearns, M., Eds.; The MIT Press: Cambridge, MA, USA, 2016. [Google Scholar]
  21. Krizhevsky, A.; Sutskever, I.; Hinton, G.E. ImageNet classification with deep convolutional neural networks. Adv. Neural Inf. Process. Syst. 2012, 25, 1097–1105. [Google Scholar] [CrossRef]
  22. Simonyan, K.; Zisserman, A. Very Deep Convolutional Networks for Large-Scale Image Recognition. In Proceedings of the 3rd International Conference on Learning Representations (ICLR), San Diego, CA, USA, 7–9 May 2015. [Google Scholar]
  23. Chollet, F. Deep Learning with Python; Arritola, T., Gaines, J., Dragosavljevic, A., Taylor, T., Eds.; Manning Publications Co.: Shelter Island, NY, USA, 2018. [Google Scholar]
  24. Vernon, G.; Baranova, A.; Younossi, Z.M. Systematic review: The epidemiology and natural history of non-alcoholic fatty liver disease and non-alcoholic steatohepatitis in adults. Aliment. Pharmacol. Ther. 2011, 34, 274–285. [Google Scholar] [CrossRef] [PubMed]
  25. Arjmand, A.; Angelis, C.T.; Tzallas, A.T.; Tsipouras, M.G.; Glavas, E.; Forlano, R.; Manousou, P.; Giannakeas, N. Deep learning in liver biopsies using convolutional neural networks. In Proceedings of the 42nd International Conference on Telecommunications and Signal Processing (TSP), Budapest, Hungary, 1–3 July 2019; Institute of Electrical and Electronics Engineers (IEEE): Piscataway, NJ, USA, 2019. [Google Scholar] [CrossRef]
  26. Wilson, A.C.; Roelofs, R.; Stern, M.; Srebro, N.; Recht, B. The marginal value of adaptive gradient methods in machine learning. arXiv 2017, arXiv:1705.08292. [Google Scholar]
  27. Keskar, N.S.; Socher, R. Improving generalization performance by switching from Adam to SGD. arXiv 2017, arXiv:1712.07628. [Google Scholar]
  28. Potter, C. Methods for presenting statistical information: The box plot. Gi-Ed. Lect. Notes Inform. 2006, 4, 97–106. [Google Scholar]
  29. Arjmand, A.; Tzallas, A.T.; Tsipouras, M.G.; Forlano, R.; Manousou, P.; Katertsidis, N.; Giannakeas, N. Fat droplet identification in liver biopsies using supervised learning techniques. In Proceedings of the 11th Pervasive Technologies Related to Assistive Environments Conference, Corfu, Greece, 26–29 June 2018. [Google Scholar]
  30. Arjmand, A.; Giannakeas, N. Fat quantitation in liver biopsies using a pretrained classification based system. Eng. Technol. Appl. Sci. Res. 2018, 8, 3550–3555. [Google Scholar]
  31. Girshick, R.; Donahue, J.; Darrell, T.; Malik, J. Rich feature hierarchies for accurate object detection and semantic segmentation. In Proceedings of the 27th IEEE Conference on Computer Vision and Pattern Recognition (CVPR), Colombus, OH, USA, 24–27 June 2014; Institute of Electrical and Electronics Engineers (IEEE): Piscataway, NJ, USA, 2014. [Google Scholar] [CrossRef] [Green Version]
  32. Ren, S.; He, K.; Girshick, R.; Sun, J. Faster R-CNN: Towards Real-Time Object Detection with Region Proposal Networks. IEEE Trans. Pattern Anal. Mach. Intell. 2015, 39, 1137–1149. [Google Scholar] [CrossRef] [Green Version]
  33. Redmon, J.; Divvala, S.; Girshick, R.; Farhadi, A. You Only Look Once: Unified, Real-Time Object Detection. In Proceedings of the IEEE Conference on Computer Vision and Pattern Recognition (CVPR), Las Vegas, NV, USA, 27–30 June 2016; Institute of Electrical and Electronics Engineers (IEEE): Piscataway, NJ, USA, 2016. [Google Scholar] [CrossRef] [Green Version]
  34. Redmon, J.; Farhadi, A. YOLOv3: An Incremental Improvement. arXiv 2018, arXiv:1804.02767. [Google Scholar]
  35. Liu, W.; Anguelov, D.; Erhan, D.; Szegedy, C.; Reed, S.; Fu, C.Y.; Berg, A.C. SSD: Single Shot MultiBox Detector. arXiv 2016, arXiv:1512.02325v5. [Google Scholar]
  36. Ronneberger, O.; Fischer, P.; Brox, T. U-Net: Convolutional networks for biomedical image segmentation. arXiv 2015, arXiv:1505.04597. [Google Scholar]
Figure 1. Representation of tissue alterations indicating NAFLD disease using a manual counting process. Ballooned hepatocytes are marked with a green contour line, while the areas of fat accumulation with a red one. This process is time-consuming and highly subjective among physicians, demonstrating the need for a fully automated recognition tool.
Applsci 10 00042 g001
Figure 2. Flowchart of the suggested classification method. Initially, the histological structures of interest are isolated, and the proposed CNN is trained. The last stage refers to a future object detection project that could lead to the quantification of ballooning and fat prevalence ratio.
Applsci 10 00042 g002
Figure 3. The proposed CNN architecture. It consists of an input layer of 64 × 64 × 3 image size, 3 convolution layers and a fully connected layer comprising of a dense layer of 4096 units. Finally, a softmax activation function generates the classification probabilities for each of the four hepatic classes (ballooning, fat, sinusoid, vein).
Applsci 10 00042 g003
Figure 4. Validation line graphs for the trained CNN models, with the SGDM optimizer producing a more optimal validation accuracy (96.5%) than Adam (91.7%). The accompanying lines below show that both graphs are produced in conjunction with the calculated loss.
Applsci 10 00042 g004
Figure 5. Display of various liver structure predictions. The figure includes random image patch classifications accompanied by their estimated probability distribution value (%). All of the misclassifications (marked in red) include sinusoids that refer to complex histological structures that should be excluded as disease findings in future object detection methodologies.
Applsci 10 00042 g005
Figure 6. Bar plots of accuracy, precision (PPV), recall (sensitivity) and specificity (TNR) characteristic values for various classification models including CNNSGDM, AlexNet, VGG-16 and a conventional Multilayer Perceptron Artificial Neural Network (MLP-ANN).
Applsci 10 00042 g006
Figure 7. Visualization of ReLU activations on CNNSGDM and AlexNet models. The CNNSGDM architecture consists of 3 convolution layers, while AlexNet of 5, respectively. The visualization focuses on the same ballooning and fat structures to determine the behavior of the two employed models during the filtering of image samples. In all cases, the brightest pixels denote the strongest activations indicating the most informative anatomical features.
Applsci 10 00042 g007
Figure 8. Verification of the classification results. In this figure, the boxplots depict the prediction error probabilities for each hepatic class, produced by the CNNAdam and CNNSGDM deep models. According to the two diagrams, classes with higher accuracy have a mean (the second quartile located at the boundary between the two colors) close to zero and less variance, while outliers are marked with black circles, pointing to greater than normal error values that affect the overall data observation.
Applsci 10 00042 g008
Figure 9. A blueprint of the object detection method.
Applsci 10 00042 g009
Table 1. Classification report from the initial conducted experiments.
Deep ModelClassification Results (%)
Liver Class AccuracyMean Performance Metrics 1
BallooningFatSinusoidVeinAccuracyPrecisionRecallF-Score
CNNAdam1001007010092.593.692.593
CNNSGDM901009010095959595
1 Mean classification values for CNNAdam and CNNSGDM models.
Table 2. Comparison of CNNSGDM performance with (a) pre-trained CNN models and (b) a conventional MLP neural network classifier.
Deep ModelClassification Results (%)
AccuracyPrecision
(PPV)
Recall
(Sensitivity)
Specificity
(TNR)
CNNSGDM95959598.3
AlexNet97979799
VGG-169494.19498
Conventional ModelAccuracyPrecision
(PPV)
Recall
(Sensitivity)
Specificity
(TNR)
MLP-ANN90.390.390.396.8
Table 3. Indirect comparison of training times for the three deep models in the current liver biopsy dataset. The term indirect is emphasized since only the CNNSGDM model is trained from scratch with the liver biopsy dataset. Transfer learning is used to train the other two models (AlexNet and VGG-16).
Deep ModelTrainable ParametersTraining “from Scratch” (Minutes)Transfer Learning (Minutes)
CNNSGDM16,825,8762-
AlexNet60,000,000-0.45
VGG-16138,000,000-5.13
Table 4. Qualitative comparison with recent years image analysis methods from the literature.
Author/YearDatasetImage Analysis MethodHistological StructuresClassification Results (%)
Nativ et al., 2014 [6]54
histological images
Image preprocessing.
K-means clustering.
Decision Tree (DT) classification
Fat droplets
(ld-MaS, sd-MaS)
Sensitivity: 99.3.
Specificity: 93.7
R2: 97
Sumitpaibul et al., 2014 [7]16
histological images (×400)
Image preprocessing.
k-NN classification
Fat dropletsAccuracy: 97.52.
TPR: 77.59.
FPR: 1.19
Hall et al., 2017 [8]21
histological images (×20)
Digital image analysis (DIA)Fat droplets5%, 20% mFPA
ALT (p < 0.001).
10% mFPA LR
(p < 0.001)
Roy et al., 2018 [9]11
histological images
(30,000 × 20,000)
Image preprocessing.
PCA analysis.
Supervised classification
Isolated steatosis.
Overlapped steatosis
Accuracy ≤ 100
Vanderbeck et al., 2014 [10]59
histological images (×20)
Image preprocessing. K-means clustering. SVM classificationBile ducts. Central veins. Macrosteatosis. Portal arteries. Portal veins. SinusoidsAccuracy: 89.3.
Precision ≥ 82.
Recall ≥ 82
Segovia-Miranda et al., 2019 [11]High-resolution multi-photon microscopy images3D Tissue morphology.
Cholestatic biomarkers
Bile canaliculi.
Cell borders.
Lipid droplets.
Nuclei.
Sinusoids
ALP (p = 0.473).
Total BAs
(p = 0.505).
Primary BA
(p = 0.518).
GGT (p = 0.680)
Vanderbeck et al., 2015 [12]59
histological images (×20)
Image preprocessing.
Supervised classification
Ballooned hepatocytes.
Lobular inflammation
AUC ≤ 98.
ROC ≤ 98.3.
Precision ≤ 91.
Recall ≤ 54
Vicas et al., 2017 [13]107
histological images
Image preprocessing.
Gradient Boosted Tree (GBT),
SVM, LR, RF, CNN classification.
U-Net Segmentation
Fat droplets.
Tissue fibrosis
R2 ≤ 89.3 2
Proposed methodology64
histological images (×20)
MLP-ANN, CNN classificationsBallooned hepatocytes.
Fat droplets. Veins.
Sinusoids
Accuracy ≤ 95 3.
Precision ≤ 95 3.
Recall ≤ 95 3.
F-score ≤ 95 3.
Specificity ≤ 98.3 3
1 Confidence intervals (with 95% confidence). 2 Correlation coefficient with human expert quantification. 3 Performance from the constructed CNN model employing the Adam and SGDM optimizers.

