Abstract
Companies face multi-criteria problems every day, such as prioritizing projects, investments, and suppliers. In this respect, the literature offers countless methods, some of which provide partial and flawed solutions. Therefore, identifying and replacing a flawed method with a more efficient one is fundamental. However, this replacement is not straightforward because each method has a different evaluation structure. More specifically, in this study, the Mapping method uses scoring evaluations, whereas the Analytic Hierarchy Process (AHP) uses pairwise comparisons. In other words, scoring evaluations are incompatible with pairwise comparison evaluations. This incompatibility prevents one method from being replaced by another without loss of information. This is a significant gap because the re-evaluation process is expensive, time-consuming, and may even be impossible if the experts are no longer available. This study presents a novel approach to automatically substitute prioritization methods without loss of information. The approach was applied to a real-world case involving forty-four Brazilian companies. The specific case shows the prioritization of four projects evaluated by scores, combined with three new projects evaluated by pairwise comparisons. The application of the approach offers specific and general contributions. For example, substituting prioritization methods without loss of information, such as the Mapping method with AHP. Flexibility in choosing the evaluation method that offers greater psychological comfort to the experts. Obtaining transitive pairwise comparison matrices independently of the number of new projects evaluated.
1. Introduction
Companies face challenges every day in project prioritization, supplier selection, renewable energy portfolio management, investment decisions, and sustainability reporting. While entirely distinct in nature, these decision-making problems share a common characteristic: they all involve the analysis of multiple criteria, which are the attributes associated with each alternative.
Many companies solve these problems based on intuition and expert experience. Other companies solve these problems based on inefficient or flawed methods. Many companies solve these problems based on intuition and expert experience. Other companies solve these problems based on inefficient or flawed methods.
This study aligns with the second type of company. In particular, the study examines the shortcomings of the Mapping method (further detailed in Section 2) in prioritizing Research, Development, and Innovation (RD&I) projects. Then, the study explores the difficulties companies face in replacing the Mapping method with a more accurate and reliable prioritization method.
In this regard, identifying the method that offers the best solution for prioritizing R&D projects is fundamental. However, the specialized literature indicates that no method is immune to failure and that some methods fail more often than others (). The absence of a perfect method raises doubts about which method to choose, while the frequency of use can signal a safe choice. Based on this logic, ’s () Analytic Hierarchy Process (AHP) becomes the natural choice to replace the Mapping method.
However, prioritization methods differ in ways that prevent automatic substitution. For example, projects are evaluated by pairwise comparison in the AHP and by scores in the Mapping method. Thus, any change in method involves loss of evaluations. In other words, the incompatibility between evaluations by scores and by pairwise comparison makes the automatic substitution of one method for another impossible.
This is an important gap for three reasons. First, it requires that projects evaluated by scores be re-evaluated by pairwise comparison. Second, specialists who evaluated the projects by scores may no longer be available. Third, re-evaluating projects costs companies time and money.
The general objective of this study is to develop an approach for automatically replacing prioritization methods without loss of information. To this end, the following specific objectives were outlined. First, to implement evaluation format conversion functions that enable the merging of heterogeneous information (). Second, to implement techniques that ensure the transitivity of pairwise comparison matrices (). Third, to apply the approach to a real-world case in which R&D projects are evaluated in different formats and prioritized.
The originality of the proposed approach lies in the processing of assessments in different preference formats and its application across multiple prioritization methods. This novelty enables comparing, selecting, and replacing prioritization methods in any situation without requiring reassessments. Processing evaluations in different formats is a valuable contribution to companies for several reasons. First, it saves time and money on project re-evaluation. Second, it allows for the flexible replacement of prioritization methods without loss of information. Third, it enables specialists to choose the format that offers them the greatest psychological comfort, reducing evaluation errors. From a theoretical standpoint, the study builds on the literature on multi-criteria decision-making, offering a flexible approach that allows reconciling specific aspects of the decision problem with the technical aspects of the prioritization method.
In addition to this introduction, this study is structured as follows. Section 2 presents the motivations for the study within the scope of the Two-Wheel model. Section 3 presents the literature on multi-attribute decision making, with a focus on project prioritization, the AHP, and preference formats and conversions. Section 4 presents the approach for replacing prioritization methods. The results of applying an approach that prioritizes RD&I projects, assessed in different formats, are presented in Section 5. Section 6 discusses the study’s results, and Section 7 presents the conclusions, limitations, and proposals for future work.
2. The Model of Two Wheels
The concrete motivation for the present work is related to the following four facts. At first, two Brazilian Innovation Agencies of the Ministry of Science and Technology (Funding Authority for Studies and Projects—FINEP and National Council for Scientific and Technological Development—CNPq) supported the development of the Two-Wheel model for innovation management presented in (). This model has improved the innovation management process for forty-four Brazilian companies (; ). However, researchers have identified that the Model-of-Two-Wheel is inefficient at clearly and convincingly prioritizing RD&I projects (). Naturally, the solution to this problem is to replace the Two-Wheel model with one that prioritizes RD&I projects.
The Two-Wheel model is designed to structure innovation management in companies through two Plan-Do-Check-Act (PDCA) cycles that organize innovation activities into four Committees or Teams: Strategic, Manager, Projects, and Culture (). Figure 1 shows a comprehensive understanding of how the Model-of-Two-Wheels works.
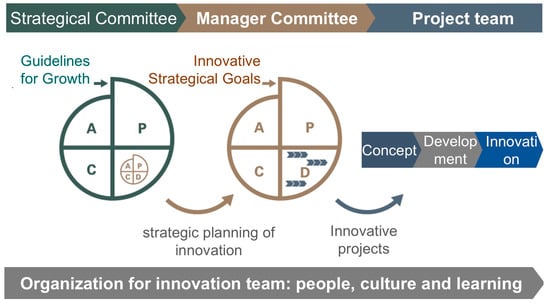
Figure 1.
General scheme of operating the Two-Wheel model ().
The prioritization of projects within the Two-Wheel model can be summarized as follows. Initially, the Strategic Committee establishes the criteria for assessing projects. Secondly, the Manager Committee collects innovative project ideas, assesses them against the Strategic Committee’s criteria, and prioritizes them using a mapping method known as the Bubble Chart ().
Bubble Chart is an easy-to-implement method widely used in companies (e.g., ; ). The Bubble Chart of the Two-Wheel model has two criteria categories: Market Opportunity and Execution Capacity (). The Market Opportunity Category is represented on the x-axis of the Bubble Chart. The Market Opportunity category score is the arithmetic mean of the specialists’ assessments for the criteria: market potential, alignment to strategy, and ease of development. The Execution Capacity Category represents, on the y-axis, the arithmetic mean of the specialists’ assessments for the criteria: idea maturity, Technical knowledge, and project duration time. Finally, the bubble’s size reflects the estimated cost of the RD&I projects. The bubble size, combined with the x and y axes, enables the creation of a three-dimensional map known as a Bubble Chart. For example, Figure 2 plots two hypothetical portfolios of RD&I projects produced using the Bubble Chart.
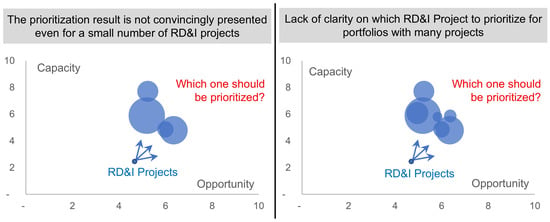
Figure 2.
Bubble Chart of two hypothetical portfolios of RD&I projects.
The RD&I projects’ map, visualized in the Bubble Chart shown in Figure 2, does not indicate the projects’ priority order. This lack of clarity about which RD&I projects to prioritize underscores the need to replace the Two-Wheel model’s prioritization method ().
3. Multi-Attribute Decision Making
Classifying, selecting, and prioritizing projects (; ; ), supply chains (; ), vaccination groups for COVID-19 (; ), stocks (), or sustainability policies (; ) are problems of multiattribute decision making. Considering this, it is necessary to highlight two fundamental points.
First, the problem of prioritizing alternatives is not new, and since the 1960s, it has been considered from both conceptual and practical perspectives (). Many researchers have addressed the subject, producing a vast body of literature on models, methods, specialists, and criteria (; ).
Second, the literature on prioritization methods is extensive, encompassing diverse approaches and applications (). () present a review of these approaches, including a measure of benefits, mathematical programming, game theory, simulation, heuristics, multicriteria, and cognitive emulation. The researchers note that the literature on prioritization methods is in continuous evolution. This evolution is associated with the necessary adaptations to accommodate new concepts, for instance, the disruptive character of projects (). The researchers also note that the combination methods have also contributed to solving prioritization problems (). For example, there are problems with conflicting quantitative and qualitative criteria ().
Within this context of the evolution of multi-attribute decision-making methods lies the problem of prioritizing RD&I projects.
3.1. Prioritization of RD&I Projects
The specific literature on applying multi-attribute methods for project prioritization is also quite extensive. The study by () offers a detailed comparison of these methods, while the studies by () and () present different approaches to prioritizing RD&I projects. In this context, identifying the method that offers the best solution to the RD&I prioritization problem is essential. So, which method does the literature recommend?
There are no perfect multi-attribute decision-making methods as they all fail to analyze specific problems, although some fail more dramatically than others (). Finding a perfect decision-making method is an illusory task, but it is possible to indicate more appropriate methods for specific situations (). For the specific situation of prioritizing RD&I projects, including the Two-Wheel model, it is necessary to compare the clarity and reliability of the results generated by each method. For this reason, the approach that allows prioritizing RD&I projects assessed in different formats becomes essential.
In the present case, it is necessary to compare the Mapping method with at least one other prioritization method. For exemple, ELECTRE (), Weighted Product Model (), AHP (), TOPSIS (), PROMETHEE (), Weighted Sum Model (), and analysis of ⟨X, R⟩ Models (), etc. In this regard, another question arises: Which prioritization method should we choose to replace the Mapping method?
The AHP is the most popular of these methods, according to a search in the Scopus database on 10 September 2025, using the terms “Method Name” AND Prioritization AND Projects in the summary title and keywords. The number of publications listed by method was: TOPSIS = 97; ELECTRE = 7; Weighted Sum Model = 9; Weighted Product Model = 1; AHP = 330; PROMETHEE = 19.
3.2. Analytic Hierarchy Process
The AHP allows for the decomposition, organization, and analysis of numerous multi-attribute decision-making problems (). The simplicity and ease of deployment have made the AHP a widely used method for prioritizing and selecting portfolio projects (; ; ). The central goal of the AHP is to classify alternatives by decomposing the decision-making problem into a hierarchy comprising alternatives, criteria, and sub-criteria ().
Given the AHP’s characteristics, it is recommended to replace the Bubble Chart with the AHP to enable clearer, more convincing prioritization of RD&I projects. However, o processamento do AHP usa avaliações por comparações pareadas enquanto o Bubble Chart usa avaliações por scores. This difference prevents projects initially evaluated by scoring from being incorporated into the AHP prioritization. What can be done to take advantage of scoring-based evaluations and avoid calling in experts to repeat the evaluation of projects?
The natural strategy for this problem involves processing heterogeneous information, in which evaluations in different formats are homogenized into a single format (). Therefore, it is necessary to convert the scored evaluations from the Mapping method into pairwise comparisons in the AHP method.
3.3. Preference Formats and Conversions
The availability of different preference formats enables specialists to select the most suitable formats from various perspectives (). In the Two-Wheel model, specialists express their preferences using the {1, 3, 7, 9} scale. The absence of a value of 5 allows for distinguishing incremental RD&I projects from disruptive ones (). From ’s () work, it is possible to identify that the specialists express their Mapping method preferences through the format. In short, the of a set of alternatives , can be represented by a utility function (). Therefore, in the case of the Mapping method, the UV of a set of RD&I Projects , can be represented by a utility function from the normalization of the scale {1, 3, 7, 9}.
In the AHP, each entry of reflects the specialists’ preference about a pair of alternatives and can be interpreted as “ is times more dominant than ” () or “ is times as good as ” (). The “reciprocal” matrix means that once a value , . Thus, to form it is necessary to have pair comparisons (). Figure 3 shows an example of assessments in and formats and illustrates the incompatibility between these assessment formats.
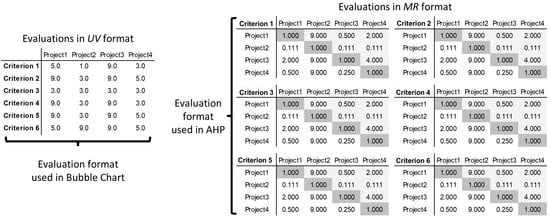
Figure 3.
Example of assessments in and formats.
A set of functions enables the conversion of different preference formats (; ). In particular, () present a function that allows one to obtain assessments carried out in the from as follows:
where is the intensity of preference of over , .
Although (1) is helpful in many situations. In particular, this function fails in two specific cases. When the minimum value of is equal to zero, and when the value of or exceeds the maximum value of ’s () scale. Therefore, this research proposes adapting the function proposed by () to allow its universal application. The adaptation of this function is incorporated into the approach presented below.
4. Approach for Replacing Prioritization Methods
The proposed approach for replacing the prioritization method for RD&I projects is summarized in Figure 4. In essence, this approach enables transitioning from one prioritization method to another by leveraging information from the first method. This is a valuable methodological contribution because it eliminates the need to call upon experts to evaluate projects they have already evaluated.
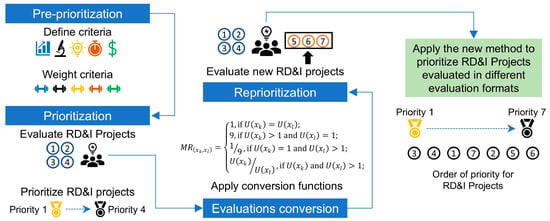
Figure 4.
Approach for replacing prioritization methods.
This approach can be replicated to replace any prioritization method. For this, it is sufficient to use a format conversion function compatible with the methods presented in the works of () and ().
Considerations for Practical Implementation
The proposed methodological approach is designed not only for theoretical soundness but also for practical applicability. To address the realistic deployment and execution of the framework, its technical structure and software requirements are outlined herein. This ensures that organizations, particularly those transitioning from the Two-Wheel model, can effectively implement the solution.
The algorithm for replacing the Mapping method with the AHP can be implemented straightforwardly using a combination of widely available software tools. The model’s structure is modular and based on well-established mathematical operations, making it highly amenable to digital implementation. The core technical components that require codification are the adapted transformation function (Equation (2)) for converting UV assessments to the MR format and the consistency algorithm (based on Equation (4)) for ensuring the reliability of the final pairwise comparison matrices.
The implementation of the proposed framework, summarized in Figure 5, can be achieved through several pathways, depending on the organization’s resources and technological maturity.
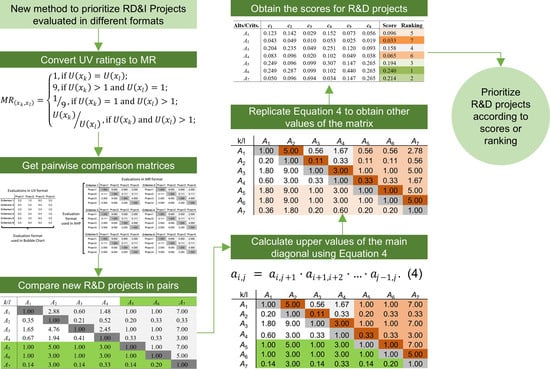
Figure 5.
Summary of the proposed framework.
The first pathway considers a scenario of rapid prototyping and widespread accessibility. This path is aimed at small and medium-sized enterprises (SMEs) or for initial proof-of-concept, the entire process can be effectively implemented using ubiquitous spreadsheet software such as “Microsoft Excel” or “Google Sheets”. The matrix operations, normalization procedures, and the transformation function can be codified using built-in formulas. This pathway offers a low-cost, accessible solution with a shallow learning curve for companies already familiar with such environments.
The second pathway considers a robust, scalable Implementation. It is suitable for continuous use, integration with existing management systems, or handling large project portfolios. A dedicated script developed in a high-level programming language is recommended. Using a language like “Python” is ideal due to its extensive scientific libraries. Key libraries such as ‘NumPy’ can be leveraged for efficient matrix computations, and ‘pandas’ for robust data management. A robust implementation would involve creating distinct software modules for: (1) data input (ingesting historical UV assessments and new MR assessments), (2) UV-to-MR conversion, (3) MR matrix construction and consistency enforcement, and (4) AHP priority calculation and synthesis. This approach offers superior precision, automation, and scalability.
Integration with commercial software is a third path to follow. In this case, the algorithm could also be developed as a custom module or plugin within specialized Project Portfolio Management (PPM) software (e.g., Jira, Monday.com) or dedicated decision support systems (e.g., Expert Choice). This pathway leverages existing user interfaces and corporate databases, facilitating smoother adoption within established digital workflows.
Beyond the software itself, a successful implementation requires minimal structural and data considerations. A simple database or structured data schema is needed to store essential information: Project IDs and attributes (e.g., name, cost); Criteria and their respective weights; and all Specialist Assessments, which must link a project, a specialist, a criterion, the assessment value, and its original format (UV or MR). Furthermore, a user-friendly interface—which could range from a well-designed spreadsheet tab to a simple web form—is crucial for allowing specialists to input new project assessments and for decision-makers to view the final AHP-based priority ranking.
The model’s technical structure is not only implementable but can also be deployed using a range of software solutions. This flexibility allows companies to choose an implementation pathway that matches their technical capability, from spreadsheets to custom enterprise applications, making the transition for companies using the Two-Wheel model both realistic and feasible.
5. Results on Replacing the Mapping Method with the Analytic Hierarchy Process
This section presents an example of replacing the mapping method for one of the forty-four companies that implemented the Two-Wheels model (). First, in the pre-prioritization step, the criteria and their respective weights were defined by the Strategic Committee, following the innovation management structure proposed by (). Note that executing this step is separate from the prioritization method.
5.1. Prioritization of Projects Using the Mapping Method
Four RD&I projects were prioritized through the Mapping method based on format assessments carried out by the Manager Committee. The results of this prioritization are illustrated in Figure 6.
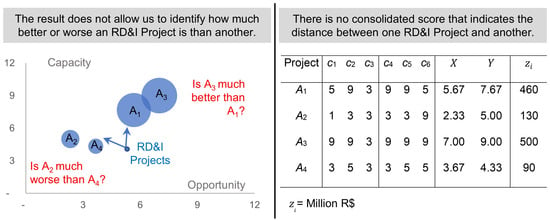
Figure 6.
Prioritization of the four RD&I projects carried out as proposed by the Two-Wheel model.
Figure 6 shows that prioritizing the four RD&I projects by the Mapping method is not very informative. This evidence supports ’s () argument concerning the necessity of replacing the Mapping method with a more effective one.
5.2. Assessments Conversion
The assessments of the 4 RD&I projects carried out in the UV format were converted to the format. This conversion was performed by applying the adaptation of (1), which normalizes the assessments by the lower [1] and upper [9] limits of ’s () scale. By adapting the transform function (1), it is possible to convert the evaluations from format to format as follows:
where = 8 is the difference between the lower [1] and upper [9] limits of the assessment scale used in the AHP ().
After applying (2) to convert , it is possible to obtain the matrices (see Figure 7) necessary to operationalize the AHP.
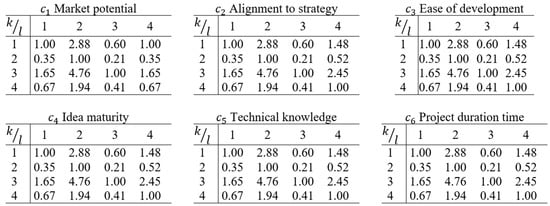
Figure 7.
Evaluations converted from format to format for criteria to .
5.3. Reprioritization
From this point on, the AHP can be applied to prioritize the portfolio of four RD&I projects identified in the previous method. Then, it is possible to prioritize a portfolio formed by retrieved and future RD&I projects. The reprioritization was based on a portfolio of seven RD&I projects. In this portfolio, four RD&I projects were evaluated in format and converted to format, and three RD&I projects were assessed directly in the format. Figure 8 shows the assessments recovered on white cells and new assessments on grey cells for the criterion .
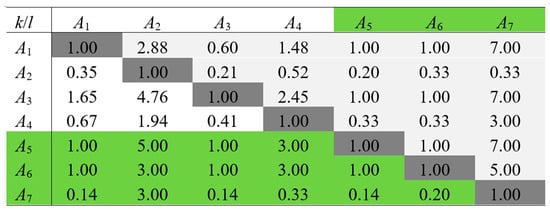
Figure 8.
matrix of criterion containing the seven RD&I projects.
Pairwise comparisons between the three new RD&I projects and the four recovered RD&I projects can lead to significant inconsistencies in the matrix as the number of comparisons increases (). The consistency ratio of the matrices presupposes the observation in the following condition:
Then, Equation (3) was rewritten to allow the first diagonal element to exceed the main diagonal, thereby avoiding the construction of inconsistent matrices. This process is based on the work of () as follows:
Figure 9 illustrates the application of the approach. It shows the consistency ratios of the AHP matrices from the upper diagonal to the main diagonal of the matrix.
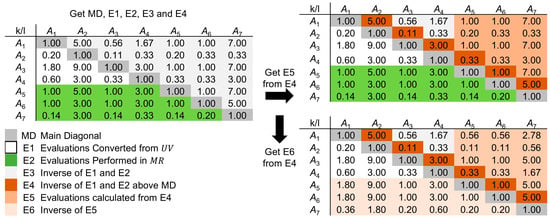
Figure 9.
Process of building consistent matrices.
The approach illustrated in Figure 9 is executed as follows. First, specialists assess three new projects directly in the format. Second, the new assessments’ inverse values are recalculated based on the assessments above the main diagonal of the matrix. For example, the multiplicative relationship between and is calculated by multiplying the multiplicative relationship between and by the multiplicative relationship between and . Third, the new assessments are replaced by the inverse of the assessments calculated in the previous step.
The Consistency Ratio () of the assessments for the criteria and alternatives is reduced to zero after applying (4). This process allows assessments with above the 0.10 acceptance threshold to be leveraged, eliminating the need for reassessments. In the present case, the need to reassess the criterion , which presented = 0.38, was eliminated.
Based on the assessments, the seven projects in the portfolio were prioritized using the AHP. Figure 10 shows this prioritization.

Figure 10.
Portfolio of seven RD&I projects prioritized through AHP.
Figure 10 shows the AHP’s ability to clearly and convincingly prioritize projects. First, the classification leaves no doubt about which project should be prioritized, even when the portfolio is large. Second, the scores allow one to estimate how better a project is than another. For example, A3, which scored 0.158, is 1.65 times better than A1, which scored 0.096, and A2, which scored 0.033, is 1.97 times worse than A4, which scored 0.065.
6. Discussion of Results
The prioritization of projects, supply chains, stocks, vaccination groups for COVID-19, or sustainability policies is a multi-attribute decision-making problem. Many decisions related to this prioritization are made informally, relying solely on the decision maker’s intuition. The multicriteria decision-making literature offers methods that provide more adequate solutions to multiattribute problems. While there is no foolproof prioritization method, some methods have more limitations than others. In the example presented in this paper, the Mapping method’s prioritization method does not offer an aggregating measure for all criteria. The mapping method is limited to visualizing two aggregations of criteria in a graph. It does not allow projects to be prioritized, even in small portfolios.
This study provides evidence of how the Mapping method fails to prioritize RD&I projects, how this failure impacts companies that have implemented the “Two Wheels” innovation management model, and justifies replacing the prioritization method. In this context, the study shows that replacing one prioritization method with another without loss of information is impossible.
The study results show that it is possible to replace the Mapping method with a better prioritization method for RD&I projects without reassessment. The approach that enables this method substitution incorporates two novel features. First, an adapted function allows the universal conversion of assessments in the format to the format. Second, an approach ensures the matrices’ consistency with converted assessments from the format and assessments in the format.
The study results provide evidence that some methods fail to prioritize RD&I projects, hindering the identification of projects to prioritize. Forty-four Brazilian companies that implemented the “Two Wheels” innovation management model were impacted by these failures.
The study also reveals that replacing one prioritization method with another is not straightforward. This replacement implies a loss of information. More specifically, the mapping method uses scoring evaluations, but it cannot always be applied automatically to other methods. The AHP, for example, uses pairwise comparison evaluations.
In this regard, the proposed approach allows overcoming the barrier to replacing prioritization methods by applying evaluation format transformation functions. In addition, the proposed approach includes a technique that ensures the transitivity of pairwise comparison matrices. From a practical standpoint, the proposed approach allows the forty-four companies that implemented the Two-Wheel model to prioritize their projects using a more precise and reliable method. This is a valuable contribution to these and other companies for various reasons. It saves time and money on specialist reassessments. It ensures greater clarity in identifying priority projects. It offers greater accuracy in evaluating and classifying projects. Consequently, it ensures that the best projects receive funding.
It is worth noting that these contributions go beyond the forty-four companies that have already implemented the Two-Wheel model. Companies interested in replacing other prioritization methods without reassessing RD&I projects can benefit from this approach. In addition to this specific contribution, the approach presented in this research also offers the potential to replace other prioritization methods. This possibility is advantageous because the literature has shown that prioritization methods continually evolve ().
7. Conclusions
This study presents an approach that avoids information loss when replacing one prioritization method with another. Complementarily, the proposed approach includes a technique that ensures the transitivity of evaluation matrices through paired comparison. This technique benefits companies as the number of projects in the portfolio grows continuously.
It is also important to highlight the innovative nature of the approach, which allows evaluations to be used in multiple formats—for example, scores, rankings, paired comparisons, or preference relationships. This flexibility makes the approach accessible for replacing prioritization methods, generating savings in time and money during project reassessment.
The flexibility of the approach presented in this paper is not limited to prioritizing projects; it can be extended to multi-attribute decision-making problems, such as selecting supply chain stocks. Furthermore, the proposed approach allows the simultaneous application of different prioritization methods. This feature allows comparing prioritization solutions generated by different methods and verifying their reliability. Furthermore, this feature allows comparing the prioritization of different methods, identifying potential shortcomings, and determining the most suitable methods for each situation.
Expanding this approach’s contributions involves overcoming its existing limitations. First, the study does not explore the conversion of scores to ranking or ranking to pairwise comparisons. Second, the superiority of the AHP in project prioritization was verified using the Mapping method. These limitations should be considered in future studies that explore the application of other conversion functions for evaluation formats and other multi-attribute decision-making methods. Furthermore, future work also includes constructing transformation functions that adequately reduce all preference formats to fuzzy preference relations, thereby facilitating a wide range of multiattribute decision-making methods in a fuzzy environment. Their application can provide greater transparency in decision-making and identify the “weak points” of the analyzed projects.
Author Contributions
Conceptualization, J.B.M., R.D.M., M.F.S.V.D., I.S.S., P.Y.E. and M.P.L.; Methodology, J.B.M., R.D.M., M.F.S.V.D., I.S.S., P.Y.E. and M.P.L.; Software, M.P.L.; Validation, J.B.M., R.D.M., M.F.S.V.D., I.S.S., P.Y.E. and M.P.L.; Formal analysis, J.B.M., M.F.S.V.D., I.S.S., P.Y.E. and M.P.L.; Investigation, M.F.S.V.D., I.S.S. and M.P.L.; Resources, M.P.L.; Data curation, M.P.L.; Writing—original draft, R.D.M., M.F.S.V.D., I.S.S., P.Y.E. and M.P.L.; Writing—review & editing, M.P.L.; Project administration, J.B.M. and M.F.S.V.D. All authors have read and agreed to the published version of the manuscript.
Funding
This study was funded by FAPEMIG [APQ-00691-23, APQ-00528-24, APD-00860-25, PPE-00087-24] and CAPES. Author Marcos D’Angelo also acknowledges the personal research fellowship from CNPq [308265/2022-0]. Productivity grants 311922/2021-0 (Ekel, P.Y.).
Institutional Review Board Statement
Not applicable.
Informed Consent Statement
Not applicable.
Data Availability Statement
Data will be available on request.
Conflicts of Interest
The authors declare no conflict of interest.
References
- Alfina, K. N., Ratnayake, R. C., Wibisono, D., Basri, M. H., & Mulyono, N. B. (2025). prioritizing performance indicators for the circular economy transition in healthcare supply chains. Circular Economy and Sustainability, 5(1), 231–276. [Google Scholar]
- Andreou, A., Mavromoustakis, C. X., Markakis, E. K., & Song, H. (2023). On the integration of user preferences by using a hybrid methodology for multi-criteria decision making. IEEE Access, 11, 139157–139170. [Google Scholar] [CrossRef]
- Bagno, R. B. (2025). MDR21: Inovação e Transformação Digital para Pequenas e Médias Empresas (Versão completa). Paco e Littera. [Google Scholar]
- Bagno, R. B., & Faria, A. F. (2017). O Modelo das Duas Rodas. Editora UFV. (In Portuguese) [Google Scholar]
- Benayoun, R., Roy, B., & Sussman, N. (1966). Manual de reference du programme electre. Note de synthese et Formation, 25, 79. [Google Scholar]
- Bin, A., Azevedo, A., Duarte, L., Salles-Filho, S., & Massaguer, P. (2015). R&d and innovation project selection: Can optimisation methods be adequate? Procedia Computer Science, 55, 613–621. [Google Scholar]
- Brans, J. P., & Vincke, P. (1985). Note—A preference ranking organisation method: (The PROMETHEE method for multiple criteria decision-making). Management science, 31(6), 647–656. [Google Scholar] [CrossRef]
- Bukhsh, F. A., Bukhsh, Z. A., & Daneva, M. (2020). A systematic literature review on requirement prioritization techniques and their empirical assessment. Computer Standards & Interfaces, 69, 103389. [Google Scholar] [CrossRef]
- Chaparro, X. A. F., Vasconcelos Gomes, L. A., & de Souza Nascimento, P. T. (2019). The evolution of project portfolio selection methods: From incremental to radical innovation. Revista de Gestão, 26(3), 212–236. [Google Scholar] [CrossRef]
- Chiclana, F., Herrera, F., & Herrera-Viedma, E. (2001). Integrating multiplicative preference relations in a multipurpose decision-making model based on fuzzy preference relations. Fuzzy Sets and Systems, 122(2), 277–291. [Google Scholar] [CrossRef]
- Chiclana, F., Herrera-Viedma, E., Alonso, S., & Herrera, F. (2009). Cardinal consistency of reciprocal preference relations: A characterisation of multiplicative transitivity. IEEE Transactions on Fuzzy Systems, 17(1), 14–23. [Google Scholar] [CrossRef]
- Cooper, R. G., Edgett, S. J., & Kleinschmidt, E. J. (1997). Portfolio management in new product development: Lessons from the leaders—I. Research-Technology Management, 40(5), 16–28. [Google Scholar] [CrossRef]
- Ekel, P., Pedrycz, W., & Pereira, J., Jr. (2020). Multicriteria decision-making under conditions of uncertainty: A fuzzy set perspective. John Wiley & Sons. [Google Scholar]
- Ekel, P. I., Libório, M. P., & Pedrycz, W. (2025). Book review: Multicriteria decision-making under conditions of uncertainty: A fuzzy set perspective. John Wiley & Sons. ISBN: 978-1-119-53,492-1. International Journal of Computational Intelligence Systems, 18(1), 1–5. [Google Scholar]
- Fishburn, P. C. (1990). Utility theory and decision theory. In J. Eatwell, M. Milgate, & P. Newman (Eds.), Utility and probability. The New Palgrave. Palgrave Macmillan. [Google Scholar] [CrossRef]
- Forestier, O., & Kim, R. E. (2020). Cherry-picking the sustainable development goals: Goal prioritization by national governments and implications for global governance. Sustainable Development, 28(5), 1269–1278. [Google Scholar] [CrossRef]
- Heidenberger, K., & Stummer, C. (1999). Research and development project selection and resource allocation: A review of quantitative modelling approaches. International Journal of Management Reviews, 1(2), 197–224. [Google Scholar] [CrossRef]
- Herrera, F., Herrera-Viedma, E., & Chiclana, F. (2001). Multiperson decision-making based on multiplicative preference relations. European Journal of Operational Research, 129(2), 372–385. [Google Scholar] [CrossRef]
- Hummel, J. M., Oliveira, M. D., Bana e Costa, C. A., & IJzerman, M. J. (2017). Supporting the project portfolio selection decision of research and development investments by means of multicriteria resource allocation modelling. In Multi-criteria decision analysis to support healthcare decisions (pp. 89–103). Springer. [Google Scholar]
- Hwang, C. L., & Yoon, K. (1981). Multiple attribute decision making: Methods and applications. Springer. [Google Scholar] [CrossRef]
- Ishizaka, A., & Lusti, M. (2004). An expert module to improve the consistency of AHP matrices. International Transactions in Operational Research, 11(1), 97–105. [Google Scholar] [CrossRef]
- Kaiser, R., Futami, A. H., Valentina, L. V. O. D., & Oliveira, M. A. D. (2019). Development of a managerial tool for prioritization and selection of portfolio projects using the Analytic Hierarchy Process methodology in software companies. Gestão & Produção, 26(4), e4267. [Google Scholar] [CrossRef]
- Kandakoglu, M., Walther, G., & Ben Amor, S. (2024). The use of multi-criteria decision-making methods in project portfolio selection: A literature review and future research directions. Annals of Operations Research, 332(1), 807–830. [Google Scholar] [CrossRef]
- Kock, A., Heising, W., & Gemünden, H. G. (2014). How ideation portfolio management influences front-end success. Journal of Product Innovation Management, 32(4), 539–555. [Google Scholar] [CrossRef]
- Laosirihongthong, T., Samaranayake, P., Nagalingam, S. V., & Adebanjo, D. (2020). Prioritization of sustainable supply chain practices with triple bottom line and organisational theories: Industry and academic perspectives. Production Planning & Control, 31(14), 1207–1221. [Google Scholar]
- Linton, J. D., Walsh, S. T., & Morabito, J. (2002). Analysis, ranking and selection of R&D projects in a portfolio. R&D Management, 32(2), 139–148. [Google Scholar] [CrossRef]
- Miller, D. W., & Starr, M. K. (1969). Executive decisions and operations research. Prentice-Hall, Inc. [Google Scholar]
- Nachtnebel, H. P., & Singh, R. P. (2015). Prioritizing hydropower development using Analytical Hierarchy Process (AHP)-A case study of Nepal. International Journal of the Analytic Hierarchy Process, 7(2), 313–336. [Google Scholar]
- Persad, G., Peek, M. E., & Emanuel, E. J. (2020). Fairly prioritizing groups for access to COVID-19 vaccines. JAMA, 324(16), 1601–1602. [Google Scholar] [CrossRef]
- Ramalho, F. D., Ekel, P. Y., Pedrycz, W., Júnior, J. G. P., & Soares, G. L. (2019). Multicriteria decision making under conditions of uncertainty in application to multiobjective allocation of resources. Information Fusion, 49, 249–261. [Google Scholar] [CrossRef]
- Rezaei, J. (2015). Best-worst multi-criteria decision-making method. Omega, 53, 49–57. [Google Scholar] [CrossRef]
- Saaty, T. L. (1980). The analytic hierarchy process: Planning, priority setting, resource allocation (decision making series). McGraw-Hill. [Google Scholar]
- Samanlioglu, F., & Ayağ, Z. (2020). An intelligent approach for the assessment of innovation projects. Journal of Intelligent & Fuzzy Systems, 38(1), 905–915. [Google Scholar]
- Santos, R., Leal, W. M., & Pinho, M. R. (2020). Stock assessment prioritization in the Azores: Procedures, current challenges and recommendations. Arquipelago. Life and Marine Sciences, 37, 45–64. [Google Scholar]
- Sapkota, P., Pokharel, M., & Pandey, M. P. (2016). Identifying the most suitable sustainable energy system for Nepal using Analytic Hierarchy Process. International Journal of the Analytic Hierarchy Process, 8(2), 353–371. [Google Scholar] [CrossRef]
- Senić, A., Ivanović, M., Dobrodolac, M., & Stojadinović, Z. (2025). Prioritization of preventive measures: A multi-criteria approach to risk mitigation in road infrastructure projects. Mathematics, 13(2), 278. [Google Scholar] [CrossRef]
- Silva, I. S., Bernardes, P., Ramalho, F. D., Ekel, P. I., Silva Martins, C. A. P., & Libório, M. P. (2019). Continuous results-driven innovation management program. Revista de Gestão, 26(4), 389–408. [Google Scholar] [CrossRef]
- Silva, I. S., Libório, M. P., Bernardes, P., & Ramalho, F. (2018). O modelo das duas rodas: Uma referência para o sistema de gestão da inovação em pequenas e médias empresas. Revista Brasileira de Inovação, 17(2), 445–452. [Google Scholar] [CrossRef]
- Silva, P. A., & Gomes, L. F. A. M. (2018). Multicriteria assessment of innovation projects in services in the Brazilian insurance market: A case study. In Financial decision aid using multiple criteria (pp. 175–196). Springer. [Google Scholar] [CrossRef]
- Tasneem, N., Zulzalil, H. B., & Hassan, S. A. (2025). Enhancing agile software development: A systematic literature review of requirement prioritization and reprioritization techniques. IEEE Access, 13, 32993–33034. [Google Scholar] [CrossRef]
- Triantaphyllou, E. (2000). Multicriteria decision-making methods: A comparative study. Applied optimization. Springer US. [Google Scholar]
- Vermeiren, E., Scheerens, C., Stouten, V., Crombez, J., De Maeseneer, J., & van Loenhout, J. A. (2025). Is equitable priority vaccination of vulnerable people feasible in a real-world context? The case of Belgium. European Journal of Public Health, 35, 774–780. [Google Scholar] [CrossRef] [PubMed]
- Xiao, D. (2025). Evaluating and prioritizing strategies to reduce carbon emissions in the circular economy for environmental sustainability. Journal of Environmental Management, 373, 123446. [Google Scholar] [CrossRef] [PubMed]
- Yoon, B., Jeong, Y., Lee, K., & Lee, S. (2020). A systematic approach to prioritizing R&D projects based on customer-perceived value using opinion mining. Technovation, 98, 102164. [Google Scholar]
Disclaimer/Publisher’s Note: The statements, opinions and data contained in all publications are solely those of the individual author(s) and contributor(s) and not of MDPI and/or the editor(s). MDPI and/or the editor(s) disclaim responsibility for any injury to people or property resulting from any ideas, methods, instructions or products referred to in the content. |
© 2025 by the authors. Licensee MDPI, Basel, Switzerland. This article is an open access article distributed under the terms and conditions of the Creative Commons Attribution (CC BY) license (https://creativecommons.org/licenses/by/4.0/).