Article

Screening Health Risks of Trace Metals in Indoor Dust and Settleable Particles in an Industrial Coastal Basin in Chile

by
Fiorella González V.
1,
Felipe Lobos O.
1,
Catia Calisto S.
1,
Ana Valdés D.
2,
Manuel A. Leiva-Guzmán
1,* and
Richard Toro A.
1,*
1
Departamento de Química, Facultad de Ciencias, Universidad de Chile, Santiago 8380494, Chile
2
Centro de Tecnologías Nucleares en Ecosistemas Vulnerables, División de Investigación y Aplicaciones Nucleares, Comisión Chilena de Energía Nuclear, Santiago 8340701, Chile
*
Authors to whom correspondence should be addressed.
Environments 2026, 13(3), 146; https://doi.org/10.3390/environments13030146
Submission received: 14 February 2026 / Revised: 2 March 2026 / Accepted: 4 March 2026 / Published: 7 March 2026
(This article belongs to the Special Issue Environmental Pollution Exposure and Its Human Health Risks)

Abstract

Industrial coastal basins that host heavy industry can concentrate metal-bearing dust in school environments. We performed a screening multi-matrix assessment across six schools in Quintero–Puchuncaví (central Chile). We measured As, Cd, Cr, Cu, Ni, Pb, and Mn in surface soils (winter 2023; E1–E4 only), indoor settled dust, and settleable particulate matter (SPM) collected in winter (July 2023) and summer (November 2023). Concentrations were determined by ICP-OES/ICP-MS and interpreted with enrichment factors and the geoaccumulation index. A U.S. EPA screening framework was used to estimate non-carcinogenic hazard (HQ) and incremental lifetime cancer risk (ILCR) for ingestion, inhalation, and dermal contact, as well as cumulative indices for non-carcinogenic (HI) and carcinogenic risk (Risk). SPM carried the strongest anthropogenic signal (EF up to 9900 for Cd, 408 for Cu, and 143 for Pb) and the highest summer loads (Cu > 5000 mg kg−1; Ni > 1000 mg kg−1). Cu dominated non-carcinogenic hazard (HQ up to 137), whereas ILCR was driven by Ni, As, and Cr, exceeding 10−4 and reaching 10−3 at inland/valley schools in summer. Indoor dust showed intermediate burdens, indicating indoor accumulation of outdoor-derived metals, while the winter soil survey provides a baseline indication of outdoor metal reservoirs at the sampled schools. Despite the limited sample size, the results provide screening-level evidence to inform emission control and dust mitigation in school microenvironments.

1. Introduction

Industrial development has supported economic growth; however, it has also intensified environmental degradation and associated health inequities [1,2]. Industrial sources emit trace metals (TMs) and particulate matter (PM) that can persist in the atmosphere and accumulate in outdoor soils and indoor reservoirs as settled dust [1,3,4]. Metals span a wide particle-size range; fine fractions contribute to inhalation exposure, whereas coarse and settleable fractions deposit to surfaces and are readily transferred indoors [3,4,5]. Children are particularly susceptible because exposure factors (higher intake per unit body mass and frequent hand-to-mouth activity) coincide with developing respiratory and neurological systems [4,6].
Across urban and industrial settings, studies report the enrichment of toxic metals in street dust, school dust, and deposited particulate matter, often accompanied by screening-level non-carcinogenic and carcinogenic risks [7,8,9,10,11,12,13]. These findings support evaluating both outdoor deposition and indoor accumulation, because settled dust is easily contacted and inadvertently ingested during routine school activities [4,7,8,9,10]. In parallel, international guidance identifies particulate pollution as a major environmental risk factor and has tightened guideline values for PM2.5 and PM10, with explicit attention to vulnerable groups [14,15]. Public health agencies also stress that no safe level of lead exposure has been identified for children and that legacy reservoirs, such as soil and dust, can sustain exposure even when emissions change [16]. Accordingly, characterizing contaminant sources in and around schools located near industrial facilities is a priority for exposure reduction [14,15,16].
The concept of an environmental “sacrifice zone” has been used to describe socio-environmental inequalities arising from disproportionate industrial development and associated pollution burdens [17,18]. Affected populations are often low-income groups residing in areas heavily impacted by chemical pollution, including residential zones adjacent to contaminated industries or military bases [19]. This framing emphasizes that exposure is shaped not only by emissions, but also by land-use decisions and unequal regulatory protection [20,21]. Sacrifice zones have been documented worldwide, with pronounced growth reported in peripheral countries in Africa, Asia, and Latin America [22].
Against this background, Quintero–Puchuncaví, on the central coast of Chile, hosts a dense industrial corridor that includes thermoelectric generation, oil refining, petrochemical operations, and port activities, and previously included copper smelting [23,24,25,26]. Atmospheric deposition and soil surveys in the district report elevated concentrations of Cu, As, Pb, and other elements, consistent with sustained industrial influence and local topographic confinement [23,24,25,26,27]. In schools, indoor settled dust and settleable particulate matter (SPM) provide integrative media linking outdoor deposition, infiltration, and resuspension, and they are directly relevant to ingestion, inhalation, and dermal exposure pathways [3,26,28]. Recent school-based evidence further supports the public health and environmental justice relevance of this setting [28].
Despite a growing literature on soils, atmospheric deposition, and air quality in the district, evidence remains fragmented across media and seasons [23,24,25,26,28]. Few assessments combine soils, indoor dust, and deposited particulate matter within the same schools, limiting inference on soil-to-dust transfer and indoor accumulation [23,24,25,26]. Moreover, multi-pathway risk assessments that jointly consider ingestion, inhalation, and dermal contact remain scarce for schoolchildren in this setting [26,28].
To address these gaps, we performed a coordinated screening assessment across six schools integrating outdoor deposited settleable particulate matter (SPM) and indoor settled dust collected in two contrasting seasons, together with a winter survey of the fine surface-soil fraction at four schools (E1–E4). The novelty of this work lies in applying the same enrichment indices (EF and Igeo) and a consistent U.S. EPA screening health risk assessment framework across these matrices within the same school microenvironments [29,30,31,32]. In doing so, the study provides an integrated exposure-oriented evaluation that differs from previous investigations in the district, which have typically focused on single environmental compartments or have not harmonized exposure-pathway screening across media.

2. Materials and Methods

2.1. Study Area Description

The towns of Quintero and Puchuncaví are located on the central coast of Chile (32°45′ S, 71°28′ W), about 160 km northwest of Santiago and 50 km north of Valparaíso. The area lies within the coastal plain, bounded by the Pacific Ocean and the coastal mountain range. Its geography and topography—low-elevation terraces and valleys that funnel winds inland—restrict pollutant dispersion and favor the accumulation of emissions. Climatically, it is characterized by a Mediterranean coastal regime with mild winters, cool summers, and low annual rainfall (~350–400 mm) [33], with prevailing southwesterly winds and frequent thermal inversions that trap pollutants near the surface. These features, combined with limited precipitation, enhance the deposition and resuspension of PM and TMs.
Economically, the district has undergone a marked shift toward heavy industry since the 1960s, with major installations in energy production, refining, and mining-related processing. Traditional livelihoods, such as agriculture, livestock, and artisanal fishing, persist, but they coexist with an industrial landscape that has reshaped land use and local exposure pathways.
Monitoring and case reports describe recurrent exceedances of air-quality standards and episodic acute intoxication events in the district [34]. Surveys of soils and sediments report the enrichment of As, Pb, Cu, and Cd, in some cases exceeding health-based guideline values [23,24,28]. Ecological impacts have also been reported, including changes in seaweed, mollusk, and fish populations [35].
This long-term exposure to high concentrations of air pollutants has characterized Quintero–Puchuncaví as a sacrifice zone. Although recent developments led to the closure of the copper smelter of the Chilean National Copper Corporation (CODELCO) División Ventanas in June of 2023 [22], historically, there has been a prioritization of industrial activity and energy production over public health protection [2,36,37].
Quintero–Puchuncaví, therefore, represents an environmental justice case in which concentrated industrial emissions intersect with residential proximity and uneven regulatory safeguards.

2.2. Sampling Desing and Procedures

Sampling was conducted at six educational establishments (E1–E6; see Figure 1) in the Quintero–Puchuncaví district. República de Francia School (E1) is located in Quintero, while La Chocota (E2), La Greda (E3), Escuela Básica El Rungue (E4), Pucalán (E5) and Los Maquis (E6) are located in the Puchuncaví sector. The results for each site were identified according to the numerical designation assigned to each school.
Two campaigns were designed to capture seasonal contrasts: winter (July 2023) and summer (November 2023). To indicate the corresponding season, results are labeled using the letters W and S for winter and summer, respectively. Since soil samples were obtained only during the winter campaign (July 2023) at four schools (E1–E4) and were not repeated in summer due to logistical and access constraints, no seasonal distinction is applied to soil results. Each sample was collected during dry weather to minimize washout effects and to represent conditions typical of the region’s Mediterranean coastal climate.
Three environmental matrices were evaluated: surface soils, indoor settled dust, and outdoor settleable particulate matter (SPM), representing major exposure media for schoolchildren. Soil samples (coded “S”) were collected during the winter campaign from four schools (E1–E4). Between three and five discrete surface samples were taken per school from school perimeter/play areas and high-traffic zones (0–5 mm depth), stored in resealable polyethylene bags, and transported under cooled conditions. In the laboratory, soils were air-dried (<25 °C) and sieved to <63 μm nylon mesh to isolate the fine fraction most relevant to incidental ingestion and resuspension. Given the restricted spatial and seasonal coverage, soil results are interpreted as a baseline snapshot for the sampled schools rather than as representative of all schools and seasons in the district.
One composite indoor settled-dust sample (labeled “D”) was collected per school per campaign using a plastic spatula from elevated indoor surfaces (e.g., furniture) and stored in sealable plastic containers. SPM samples (labeled “P”) were collected using a passive sampler constructed according to the specifications of the University of North Carolina (UNC) passive aerosol samplers [38] fitted with nucleopore filters, Whatman 111111. One sampler was deployed per school in open areas, avoiding wind obstructions whenever possible. Unlike soil and dust, which were collected in a single day, passive SPM samplers remained in place for about one month.
Following this sample and seasonal identification methodology, results are reported using alphanumeric codes that combine the matrix type, sampling season, and site number. For example, winter indoor dust results from La Chocota School are identified as DW2, whereas a soil sample result from Los Maquis School is identified as S6. A summary of the sampling process can be found in Supplementary Table S1.
Quality-assurance and quality-control procedures were implemented throughout sampling and handling. Equipment was acid-washed (10% HNO3) and rinsed with ultrapure water; personnel wore powder-free nitrile gloves and avoided metallic tools. Samples were labeled with alphanumeric codes, georeferenced (±5 m GPS), and accompanied by chain-of-custody records. Meteorological data (temperature, wind speed/direction, precipitation) from the Chilean Meteorological Directorate were used to contextualize conditions during SPM exposure [33].

2.3. Sample Preparation and Chemical Analysis

All samples were processed in the Environmental Chemistry Laboratory of the University of Chile under strict chain-of-custody conditions. Soils and dust were air-dried at room temperature and sieved to <63 μm. SPM filters were handled in a laminar-flow hood, sectioned as needed, and prepared directly for digestion.
Microwave-assisted acid digestion was used to extract metals from all matrices in PTFE vessels with 10 mL of high-purity nitric acid. For soils and indoor dust, digestion followed a standard program consistent with Method 3051A [39], using 6–9 mg per sample. For polycarbonate filters (SPM), a staged program with an initial low-power step was applied to avoid rapid exothermic reactions and to achieve complete mineralization, following Dos Santos Souza et al. [40]. After digestion, solutions were filtered through 0.45 μm PTFE membranes and diluted with ultrapure water up to 50 mL for ICP-MS analysis. Reagent blanks were processed with each batch to verify cleanliness, and all materials were thoroughly cleaned following standard procedure: 10 standard rinses with distilled water, followed by 10 rinses with ultrapure water. Subsequently, the materials were soaked in a 10% (v/v) HNO3 solution for 48 h [39,40]. The digestion programs are summarized in Table 1.
Quality assurance for the soil samples was possible thanks to the support of the Chilean Commission of Nuclear Energy (abbreviated CCHEN in Spanish). Although, due to security reasons, results were not provided, CCHEN assured that the acid-digestion process was successful.

2.4. Environmental Impact Assessment

To screen for anthropogenic influence and to compare contamination intensity across matrices, we calculated enrichment factors (EF) and the geoaccumulation index (Igeo). These indices relate measured concentrations to background levels and provide a standardized basis for interpreting enrichment and contamination in soils, indoor dust, and deposited particulate matter.
The enrichment factor (EF) was calculated as the ratio of the concentration of each element to a reference element in the sample, normalized by the same ratio in background soils. Manganese (Mn) was selected as the reference element because of its geochemical stability, low mobility, and minimal anthropogenic enrichment in the region [41]. EF values were interpreted using standard classes ranging from minimal enrichment (EF < 2) to extremely high enrichment (EF > 40) [41].
The geoaccumulation index (Igeo), originally proposed by Müller [42], was used to quantify contamination relative to background by computing the base-2 logarithm of the ratio between the measured concentration (Cm) and 1.5 times the background concentration (Bm). The factor 1.5 accounts for natural variability in background levels. Igeo was classified into seven categories, from uncontaminated (Igeo ≤ 0) to extremely contaminated (Igeo ≥ 5) [43,44]. Background concentrations were obtained from a baseline dataset for the Quintero–Puchuncaví district derived using a median absolute deviation (MAD) approach [45]; these values can be found in Supplementary Table S2. For EF normalization, the measured Mn reference concentration in soils (Cref, Mn) was 834 ± 223 mg/kg, consistent with local natural conditions.
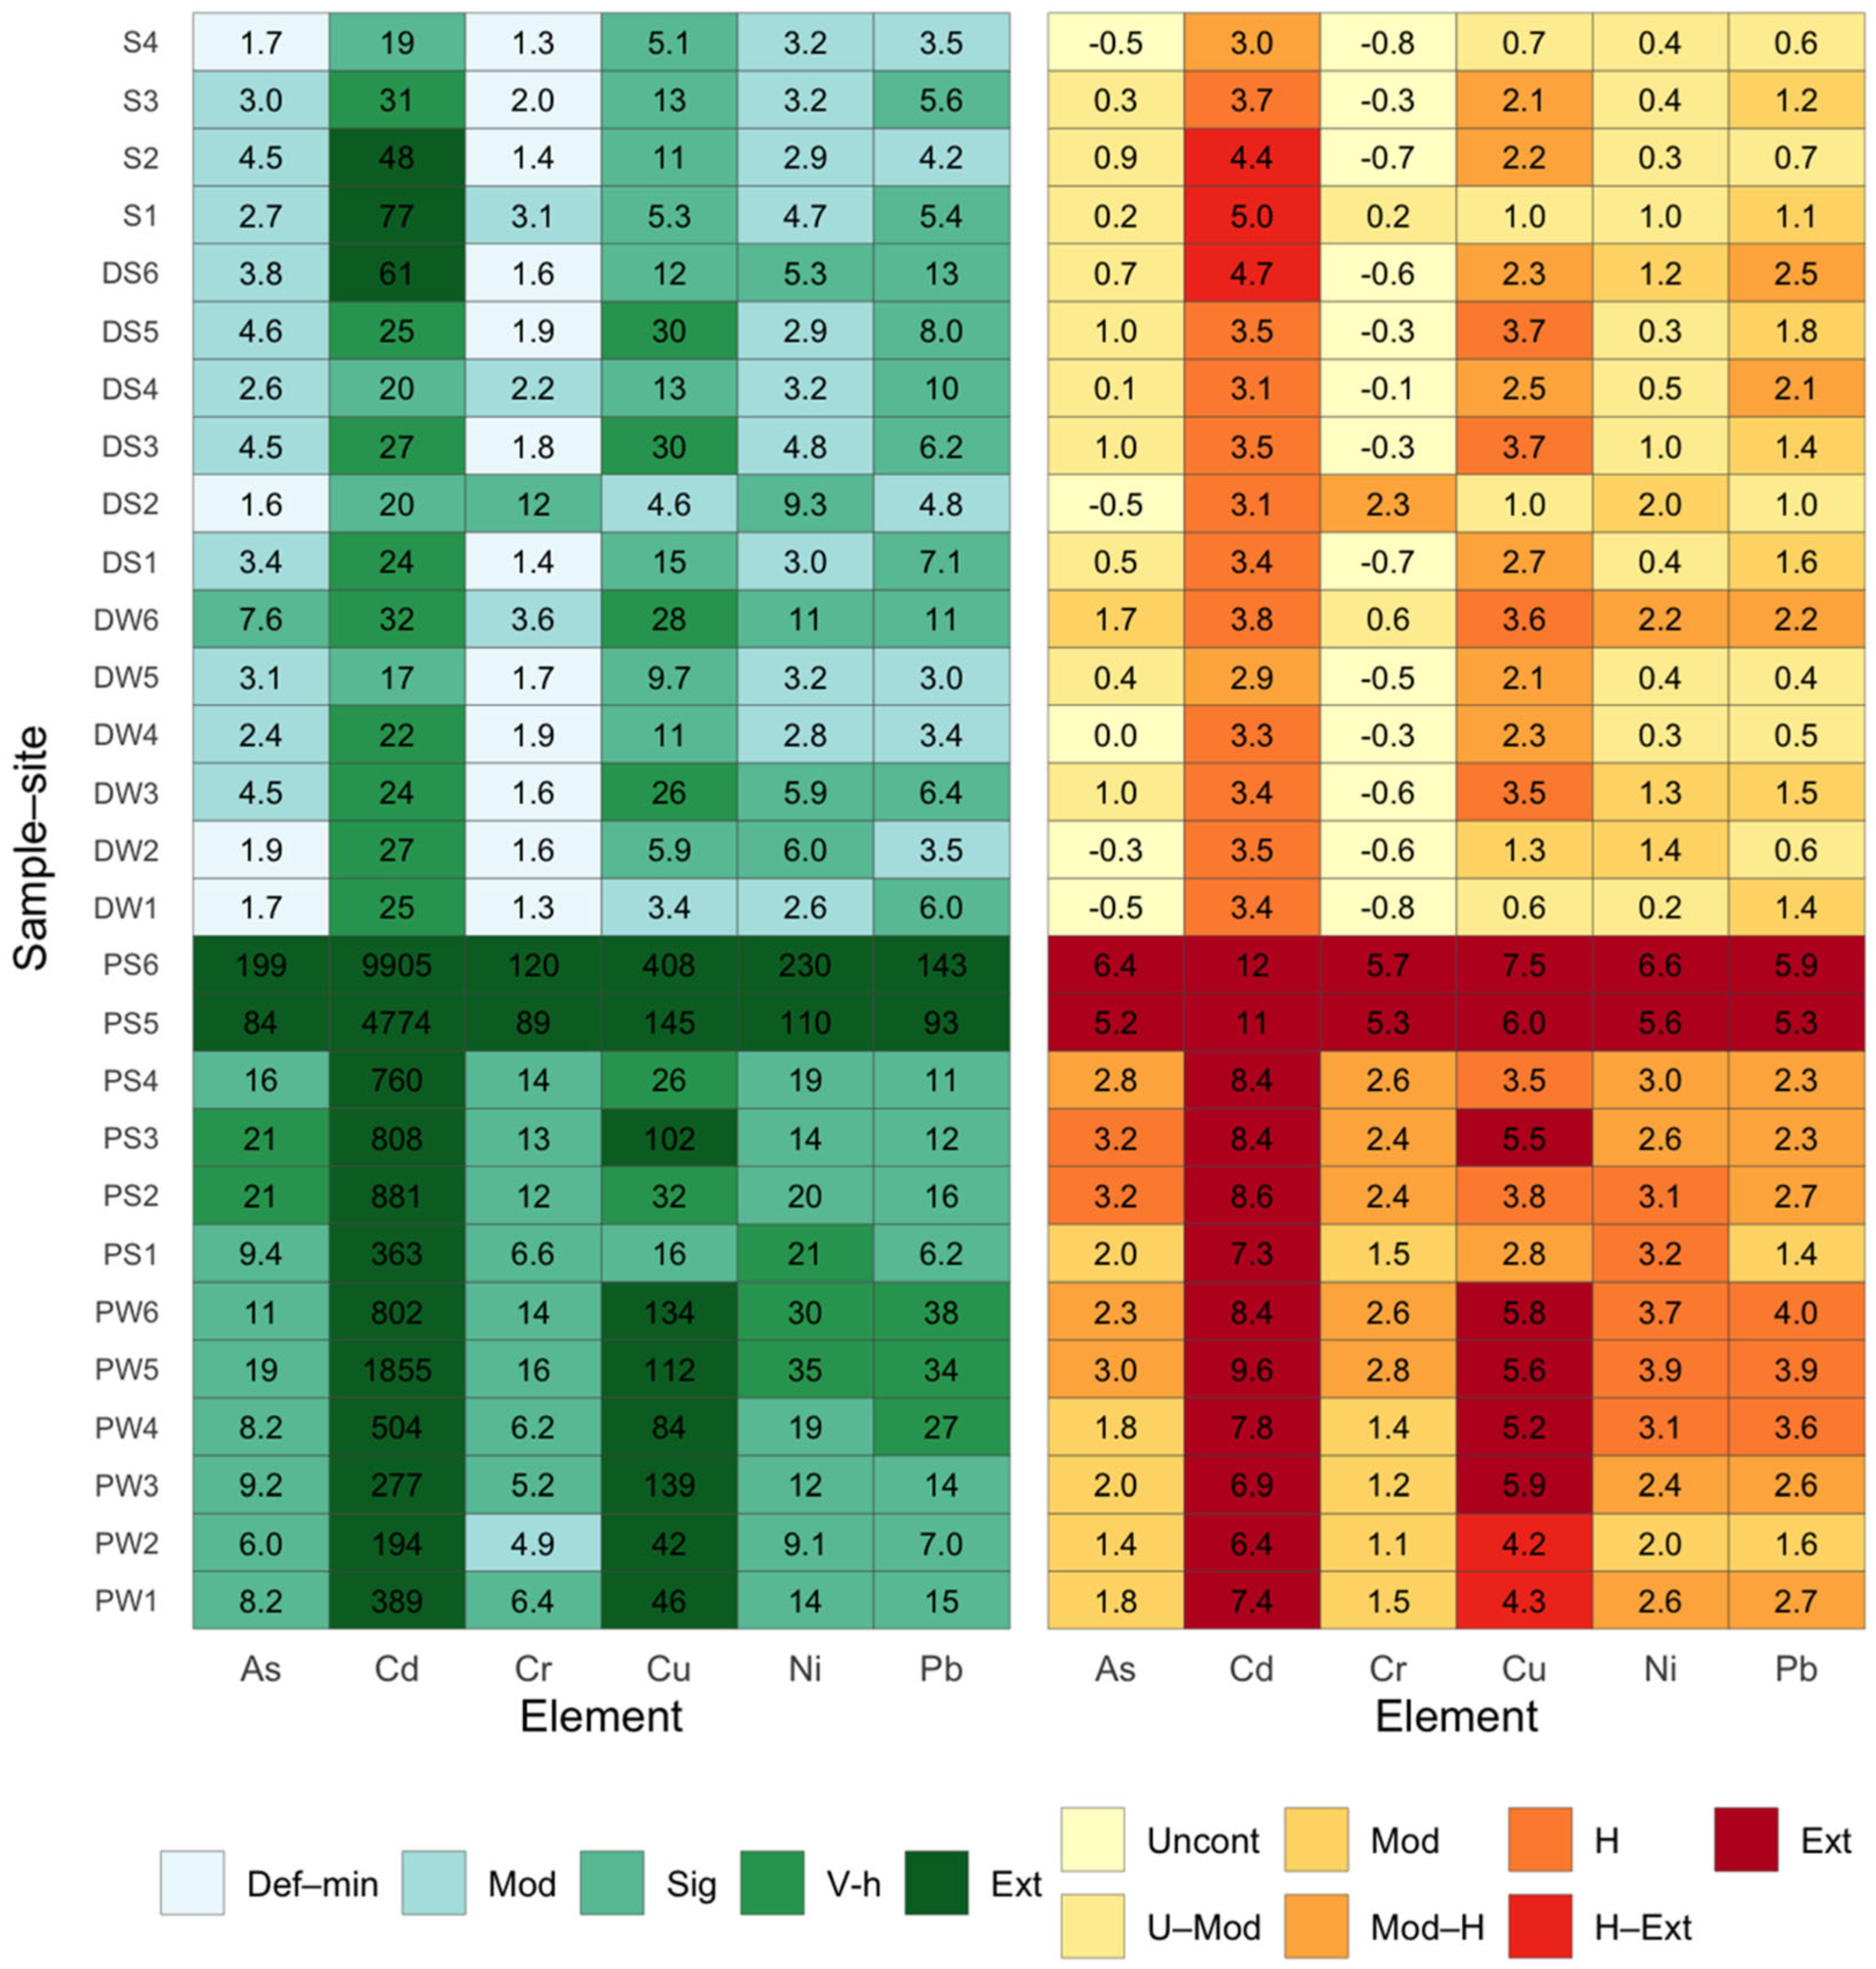
Numeric labels within cells indicate measured EF or Igeo values, formatted with one decimal place if <10 and rounded integers if ≥10.

2.5. Health Risk Assessment (HRA)

The health risk assessment was conducted in accordance with EPA guidelines and used default exposure factors. Key scenario parameters are summarized in Table 2. Further details on the assumptions and parameters used are available in Supplementary Text S1 and Table S3. Two main assumptions were applied: exposures were chronic within each receptor age group, and concentrations measured in each matrix were treated as dust-borne concentrations for the purpose of applying standard soil/dust exposure equations. SPM and the <63 μm soil fraction were treated as dust proxies to enable a consistent screening comparison across SPM, indoor settled dust, and soils. Deposited SPM represents material available for contact and potential resuspension rather than a direct measurement of airborne concentrations; soils represent an upper-bound screening scenario for outdoor contact. Because total concentrations and default exposure factors were used and bioaccessibility/speciation were not measured, HQ and ILCR values should be interpreted as conservative screening indicators rather than predictive exposure estimates.
All samples were treated like solid samples; because of this, the estimated ingestion (I) per exposition route for all samples were calculated using Equations (1)–(3). For the assessment of health risk, Hazard Quotient (HQ) and Hazard Index (HI) were used to evaluate non-carcinogenic effects. For the assessment of carcinogenic effects, the Incremental Lifetime Cancer Risk (ILCR) and Risk Index (Risk) were used. The equations used correspond to 4, 5, 6 and 7, respectively:
I I n g e s t i o n = C m · I n g R · E F · E D B W · A T · C F
  I I n h a l a t i o n = C m · I n h R · E F · E D B W · P E F · A T      
I D e r m i c = C m · S A · S F · A B S · E F · E D B W · A T · C F      
H Q = I R f D
H I = H Q I n g e s t i o n + H Q I n h a l a t i o n + H Q D e r m i c
I L C R = I · S F      
R i s k = I L C R I n g e s t i o n + I L C R I n h a l a t i o n + I L C R D e r m i c      
where Cm is the concentration of the element in each sample (mg/kg) and n represents the age groups used for HRA. Following the recommendations made by the EPA to identify potentially unrealistic exposure scenarios or overestimated risks [29,30,31], values of HQ or ILCR that substantially deviated from their respective reference values were excluded from the analysis of HI and Risk, respectively. To assess the overall risk for the sampled area, the indices HI and Risk are summed. To facilitate overall interpretation, HQ and HI two times higher than the threshold (value of 1) were presented with decimals. Standard values used for the assessment are provided in Table 2 and Table 3.

2.6. Statistical and Computational Tools

All statistical analyses were performed in R (v4.3.4). Descriptive statistics (mean, standard deviation, relative standard deviation, and 95% confidence intervals) were computed for each matrix and campaign. SPM and indoor dust consisted of one composite observation per school per campaign (n = 6 per season; n = 12 when pooling winter and summer). Soil concentrations were available only for winter at four schools (E1–E4). Because concentration distributions were non-normal and heteroscedastic, non-parametric tests were used for exploratory comparisons across matrices and seasons. Seasonal datasets for SPM and indoor dust were pooled (n = 12 each) for exploratory matrix comparisons. Because soil sampling did not cover all six schools and was conducted only in winter, statistical comparisons involving soils apply only to the sampled schools and winter conditions; they are used to support descriptive interpretation rather than district-wide inference.
Post hoc pairwise comparisons were conducted using Dunn’s test with Bonferroni adjustment to control family-wise error. For these analyses, soil samples were treated as representative of the overall study area, acknowledging spatial constraints in soil sampling and the shared origin of the matrices.
Certainty bands were used to evaluate the level of certainty for the SPM and indoor dust results. Detailed descriptions of the methodology used to determine the ranges of the bands and the associated certainty criteria can be found in Supplementary Text S2 and Tables S4–S7.

3. Results and Discussion

3.1. Elemental Concentrations and Spatiotemporal Variability

Table 4 reports mean (±SD) concentrations of As, Cd, Cr, Cu, Ni, and Pb across soils, indoor dust, and SPM. TM concentrations were generally highest in SPM samples, which exhibited the highest per-sample maxima and average values across both sampling campaigns, followed by dust and soil. However, in schools E1 and E2, soil samples showed higher concentrations than indoor dust, deviating from the general trend.
Seasonal and spatial variability in elemental concentrations for all types of samples was reflected in all the indices obtained.
In SPM samples, concentrations of As, Cd, Cr, Cu, Ni, and Pb were higher during the warm season, with the strongest increases at schools E5 and E6 (Table 4; Supplementary Table S8). Schools E5 and E6 showed increased levels of all metals in summer. In ID, As, Cr, Cu, and Pb concentrations were generally higher in summer, while Cd and Ni exhibited no consistent seasonal pattern across the sites. Unlike SPM, dust samples did not show a uniform increase in all metals during summer at any location.
As a general case, spatial variability was pronounced, particularly in SPM, as reflected by high standard deviations and relative standard deviations. The Supplementary Materials (Supplementary Table S8) provide site-level values and show that schools E5 and E6 had the highest SPM concentrations. The seasonal divergence is consistent with summer conditions favoring resuspension and dry deposition, while winter conditions favor wet removal and different atmospheric processing of metal-bearing particles. Indoor dust integrates longer time scales and indoor processes that can attenuate seasonal signals. Because EF is a relative index normalized to a reference element and background, it may vary non-monotonically with distance when crustal contributions differ across sites; inland/valley settings within the basin can act as depositional zones under local topography and prevailing winds. No distance- or wind-based regression was introduced because it is outside the scope of the available dataset.
The seasonal divergence suggests that summer increases are linked to enhanced resuspension and dry deposition of contaminated material, whereas wintertime conditions may reflect differences in emission patterns and atmospheric processing for Pb- and Cu-bearing particles [1]. Pairwise comparisons (Supplementary Table S10) are consistent with these patterns. There were no statistically significant differences between indoor dust and SPM samples, in contrast, significant differences were observed between indoor dust and soil samples for almost all TMs (exception being Cr, for which no statistically significant difference was found). These results suggest that the primary source of TMs in ID is airborne PM. Consequently, the deposition of SPM appears to be the most significant contributing process.
The dynamics between indoor dust and SPM, and the weaker seasonality exhibited by indoor dust, are consistent with longer integration times indoors. This is associated with mechanisms that promote particle deposition onto indoor surfaces, such as advection and turbulent diffusion, which are typically strong enough to rapidly transport particles from the atmosphere to surfaces [3].
By contrast, soils and indoor dust were often more similar, suggesting that soil-to-dust transfer occurs indirectly through resuspended particulate matter rather than direct contact, and suggests it is comparatively stable and likely acts as long-term reservoirs that feed SPM and dust through wind-driven resuspension. Overall, SPM emerges as the most dynamic and contaminated medium, while indoor dust represents the interface most directly connected to children’s exposure in schools.

3.2. Enrichment Factor and Geoaccumulation Index

Figure 2 summarizes EF and Igeo values for SPM, indoor dust, and soils across the district. Cadmium (Cd) exhibited the strongest enrichment, with EF values reaching 9905 and Igeo indicating heavily to extremely contaminated conditions at several sites. These results imply Cd concentrations more than two orders of magnitude above background and are consistent with reports from other industrially impacted environments [7,8].
Copper (Cu) also showed persistent enrichment, with EF values ranging from 16 to 408 in SPM and Igeo reaching class 4. This pattern is consistent with long-term contributions from copper smelting and related metallurgical activities in the district, where Cu is a major emitted element [24,25,26]. Resuspension under dry and windy conditions likely redistributes Cu-rich particles, facilitating transfer into indoor environments.
Lead (Pb) showed marked enrichment, with EF as high as 143 and Igeo up to 5.9 in summer SPM (PS6), consistent with strong anthropogenic influence. This signal aligns with contributions from copper smelting and associated industrial processes reported for the district [24,25,26]. Because Pb is strongly retained in soils and dust, legacy deposits can sustain exposure through erosion and resuspension even as primary emissions change [4,53].
Arsenic (As) exhibited moderate to high enrichment (EF = 6–21 in SPM), with Igeo values up to class 3, indicating moderate to strong contamination. Although less extreme than Cd or Cu, these levels are relevant given the established carcinogenicity of As via inhalation and ingestion [54]. Chromium (Cr) showed lower average enrichment but reached EF values up to 120 at localized hotspots, indicating spatially heterogeneous contributions.
The comparatively lower enrichment of Cr and Ni in soils relative to SPM likely reflects a combination of background contributions and source-dependent partitioning across particle sizes. In the Quintero–Puchuncaví coastal environment, soil acidification and salinization linked to industrial activity can influence TMs mobility and redistribution. Seasonal amplification was evident in SPM, with EF and Igeo for Cd, Cu, and Ni peaking in summer, when drier conditions and stronger winds enhance resuspension and transport [25,33]. These effects were most pronounced in coastal valleys, where topographic constraints limit ventilation and favor contaminant accumulation [25,26].
By comparison, soils generally exhibited lower enrichment (EF < 10 for most metals), although Cd still reached very high values at specific sites. Even with lower EF, soils function as longer-term reservoirs and can contribute to airborne contamination via resuspension. Indoor dust, in turn, integrates outdoor inputs and concentrates them in enclosed environments, which is especially relevant in schools, where children spend prolonged periods.

3.3. Health Risk Assessment

Table 5 and Table 6 summarize screening non-carcinogenic hazards and carcinogenic risks for each matrix and season. For SPM, copper dominated non-carcinogenic hazard, with Cu HQ ranging from 5.0 at PS1 to 137 at PS6, well above the HQ = 1 benchmark. This magnitude reflects both elevated Cu concentrations and the screening RfD applied (Table 3). Because toxicity values for Cu differ across compilations and bioaccessibility was not assessed, Cu-driven HQ values are sensitive to the selected screening parameters and should be interpreted as conservative screening prioritization indicators rather than quantitative predictors of adverse effects. Even when Cu is excluded from HI and ΣHI to avoid masking other metals, SPM retained elevated cumulative hazard. In summer, HI peaked at 39 (PS6) and 21 (PS5), compared with a winter maximum of 4 (PW4). Soils yielded HI values < 1 across sites (maximum = 0.84 ± 0.68 at S3). Indoor dust showed intermediate hazard, consistent with its role as a conduit between outdoor deposition and indoor exposure.
Because Cu dominates the hazard profile, Table 2 reports HI and ΣHI, excluding Cu for SPM and indoor dust, while Cu HQ values are shown separately. When Cu is included (HItotal = HI + HQCu), the total hazard ranges from 15–50 for winter SPM (PW1–PW6) and 7–176 for summer SPM (PS1–PS6), and from 2–10 for winter dust (DW1–DW6) and 4–10 for summer dust (DS1–DS6).
A consistent hierarchy of element contributions emerged across matrices. In SPM, Cu exceeded non-carcinogenic thresholds by more than two orders of magnitude at the most impacted sites. Lead and arsenic also contributed substantially, reaching HQ values of 12 and 7, respectively, at valley schools (PS5–PS6). Cadmium (Cd) was included in both non-carcinogenic and carcinogenic screening metrics (Table 5 and Table 6). Although its modeled carcinogenic contribution is smaller than Ni, As, and Cr under the adopted toxicity values, its high enrichment in SPM supports its relevance in screening interpretation. Soil HQ values were generally <0.1, indicating comparatively low direct-contact hazard. Indoor dust acted as an intermediate medium, with HI values at, or near, unity in several schools, reflecting accumulation and resuspension within classrooms.
Carcinogenic risk estimates show a different pattern. SPM was the dominant carcinogenic medium, with Ni, As, and Cr exceeding 1 × 10⁻⁴ in summer at valley schools (PS5–PS6). Maximum ILCR values reached 8.9 × 10⁻⁴ (Ni), 4.9 × 10⁻⁴ (As), and 2.9 × 10⁻⁴ (Cr), which correspond to “probable cancer risk” scenarios under U.S. EPA screening guidance. Soils were one to two orders of magnitude lower (typically 10−6–10−5). Indoor dust contributed measurably, with ΣRisk slightly exceeding 1 × 10⁻⁴ in summer. The carcinogenic ranking (Ni > As > Cr > Pb > Cd) reflects toxicity rather than absolute concentration, whereas Cu drives non-carcinogenic hazard but contributes little to carcinogenic risk. At the least impacted schools (E1–E2), ILCR remained <10−6 across matrices, indicating negligible carcinogenic risk.
Seasonal and spatial gradients provide additional context. For SPM, ΣHI increased from 21 in winter to 73 in summer, and ΣRisk increased from 7.5 × 10⁻⁴ to 3.1 × 10⁻³. This summer amplification is consistent with drier conditions and stronger winds that enhance soil resuspension and particulate transport. Spatially, valley schools (PS5–PS6) showed up to tenfold higher ΣHI and ΣRisk than coastal schools, consistent with pollutant accumulation under topographic confinement.

3.4. International Context and Comparisons

Evidence from Chilean studies around the Ventanas industrial complex is consistent with the enrichment patterns observed here [23,24,25,26,28]. Independent surveys of topsoil, vegetation, and atmospheric deposition in the district document spatial gradients of Cu, Pb, and Cd associated with proximity to industrial sources and prevailing transport pathways [23,24,25,26], which explains the impact of Cu in SPM and dust after the closure of CODELCO Cu smelting. These studies also characterize contaminated surface soils as persistent metal reservoirs in fine fractions, which supports the plausibility of soil-driven resuspension contributing to settled dust and deposited particulate matter [23,45]. Recent school-focused work in the same district reported elevated metals in educational microenvironments and quantified screening risks, reinforcing the relevance of schools as an exposure setting [28]. Within the broader framing of environmental sacrifice zones, these convergent findings indicate that schools and surrounding residential areas can experience chronic exposure pressures, even when regulations target point-source emissions [20,21].
Comparable dust- and soil-based assessments in industrial and mining-impacted settings show that near-surface dust can act as an integrative sink for metal emissions and resuspended contaminated soils, frequently motivating screening health risk evaluations [7,8,9,10]. Street dust in Luanda, Angola shows that tropical urban environments can accumulate elevated TMs and generate non-carcinogenic and carcinogenic risk estimates under standardized exposure assumptions [7]. Similarly, smelter-influenced urban dust in northeast China exhibited high metal loads and associated health risks, supporting the applicability of dust-based screening across smelter-affected regions [8]. In Kabwe, Zambia, widespread soil contamination by Cu, Pb, Cd, and Zn persists and supplies material for dust generation and human exposure [9]. Biomonitoring in the Katanga mining belt reports high human exposure to cobalt and other metals, indicating that environmental contamination results in measurable internal doses near mining and smelting operations [10].
School-based dust studies in large cities further support the use of indoor and outdoor dust as exposure-relevant matrices for children who spend substantial time in classrooms. In Riyadh, Saudi Arabia, heavy metals in elementary-school dust were assessed using pollution indices and screening risk metrics, establishing an international benchmark for school-based evaluations [46]. Urban traffic-dust studies likewise indicate that resuspended road dust transports metal mixtures, contributing to non-carcinogenic and carcinogenic screening metrics in densely populated settings [51]. Because settled dust integrates infiltration, deposition, and resuspension, its metal burdens have been associated with PM10 concentrations and personal inhalation exposure, although translation to airborne doses remains uncertain [55]. The intermediate contamination of indoor dust relative to SPM and soils is consistent with an outdoor-to-indoor pathway governed by particle deposition and resuspension [3,55].
From a public health perspective, WHO identifies particulate air pollution as a leading environmental risk factor and has tightened guideline levels for PM2.5 and PM10 to better protect vulnerable groups [14,15]. For lead, the CDC emphasizes that no safe blood lead level has been identified in children and has lowered the blood lead reference value, highlighting the need to minimize Pb-bearing dust exposure in schools [16]. Within the U.S. EPA risk-assessment framework, hazard indices and cancer risks support screening and prioritization of further evaluation, with regional screening levels providing consistent interpretive benchmarks [29,30,49]. Under this screening framework, summer exceedances at inland valley schools indicate that school microenvironments in industrial coastal basins require targeted follow-up monitoring and exposure-reduction measures focused on deposited and resuspended dust [29,30].
These results provide screening evidence that metal-rich deposited particles and indoor settled dust can constitute relevant exposure media in schools located within topographically constrained industrial coastal basins, with the highest risks observed at inland valley schools during summer.

3.5. Study Limitations, Strengths, and Recommendations

A key strength of this work is its multi-matrix design, which jointly evaluates surface soils, indoor settled dust, and settleable particulate matter, thereby supporting an integrated interpretation of contaminant reservoirs, indoor accumulation, and deposition-linked exposure pathways. Because EF and Igeo depend on background selection, we anchored both indices to a locally derived geochemical baseline estimated using a robust median absolute deviation approach [44,45]. Integrating geochemical indexing with a transparent, screening-level HRA framework provides a practical basis for prioritization while maintaining comparability with prior dust-based risk assessments [7,29,30].
This screening study has several limitations that should be considered when interpreting the results. The number of schools is limited (n = 6) and SPM and indoor dust are represented by one composite observation per school per season, which does not capture within-school heterogeneity. Soil sampling was restricted to the winter campaign and to four schools (E1–E4). Schools E5 and E6 were not included in soil sampling; therefore, soil-related gradients across all six schools cannot be evaluated within this dataset. Screening risk estimates are derived from total metal concentrations and default exposure factors; no bioaccessibility or speciation data were available, which introduces uncertainty for form-dependent metals, such as As and Cr, and can lead to conservative dose estimates [5,29,30,31,32]. Deposited SPM does not directly measure airborne concentrations; translating deposited material to inhalation exposure introduces additional uncertainty [54,55].
From a risk-management perspective, screening exceedances provide a defensible basis with which to prioritize targeted monitoring and mitigation at schools using established benchmark frameworks, including U.S. EPA regional screening levels and associated risk-assessment guidance [29,30,49]. Follow-up campaigns would benefit from paired settled-dust, deposition, and airborne PM measurements, including size-resolved sampling, to reduce uncertainty in inhalation exposure estimates [55]. Where feasible, source-apportionment approaches and Pb isotope signatures can help to distinguish industrial contributions from traffic-related inputs to deposited particles [53]. At the school level, exposure reduction is likely to be most effective when the control of outdoor dust ingress is coupled with cleaning protocols that minimize indoor resuspension, consistent with established indoor particle dynamics [3]. At the regulatory level, explicitly incorporating school microenvironments into air-quality management, surveillance, and risk communication aligns with WHO guidance emphasizing the protection of vulnerable populations from particulate pollution [14,15]. Because no safe level of lead exposure has been identified for children, reducing Pb-bearing dust in educational settings remains a clear public health priority [16].

4. Conclusions

This work presents a screening multi-matrix assessment of trace metals in school environments within an industrial coastal basin in central Chile. The environmental impact index provides evidence of the severe impact in the area. Settleable particulate matter (SPM) exhibited the highest concentrations and enrichment, with EF and Igeo indicating strong anthropogenic influence at several sites. Seasonal contrasts were evident, with higher summer burdens of As, Cd, Cr, and Ni in SPM and, to a lesser extent, indoor dust. Although soils were generally less enriched, they represent longer-term reservoirs that can sustain resuspension, while indoor dust functions as an intermediate medium that transfers outdoor contamination into classrooms.
The health risk assessment provided valuable insight into the risk for exposure to the matrices studied throughout the zone. Under the U.S. EPA screening framework, Cu dominated non-carcinogenic hazard (HQ up to 137), whereas ILCR was driven mainly by Ni, As, and Cr, exceeding 10−4 and reaching 10−3 at inland schools in summer. Indoor dust produced intermediate hazard and risk, reinforcing the need to account for indoor accumulation when evaluating children’s exposure.
Furthermore, this study highlights the importance of the results obtained from the Los Maquis and Pucalán sectors, which showed the highest TE concentrations across all sample types, and the overall highest EF, Igeo, HQ, HI, ILCR and Risk Indexes. These results showcase the importance of assessing the impact area of a sacrifice zone or an industry objectively, minimizing or eliminating any potential bias. Notably, these two sectors are not traditionally considered part of the affected area; this may be attributed to their lower population compared to the sectors of Quintero and Puchuncaví. Nevertheless, the findings indicate that some of the most potentially vulnerable populations may reside in areas that are often overlooked. Geographic factors should be considered when delineating the area for a health risk assessment, as the consistently elevated TMs concentrations obtained in all samples in Los Maquis and Pucalán, may be attributed to their specific geographic characteristics and serve as early indicators of potential exposure risk.
Finally, the multi-matrix evidence indicates that deposited particles and indoor dust can constitute relevant exposure media in school environments within industrial coastal basins, supporting confirmatory monitoring and risk-management evaluation in the most affected settings.

Supplementary Materials

The following supporting information can be downloaded at: https://www.mdpi.com/article/10.3390/environments13030146/s1, Table S1: Sample coding scheme and campaign coverage used throughout Table 2 and Table 3 and the associated figures in the main manuscript; Table S2: Background concentrations used for EF and Igeo computations [45]; Table S3: Exposure parameters by receptor group. Values must match those used to compute Table 2 and Table 3 in the main manuscript; Table S4: Example of certainty band criterion applied to the hazard index (HI); Table S5: Certainty bands defined for the HI and Risk indices; Table S6: Certainty bands defined for the Enrichment Factor (EF); Table S7: Certainty bands defined for the Geoaccumulation Index (Igeo); Table S8: Concentrations per sample (mg kg−1) of TMs. The lLetters W and S indicate if the sample was taken during wWinter or sSummer. Letters D, P and S indicate if it is an iIndoor dDust, sSettleable pParticulate mMatter or sSoil sample. Soil samples represent the average per school; Table S9: Confidence levels for SPM and indoor dust samples based on seasonal averages for all indices per sampling site. Letters “P” and “D” denote sSettleable pParticulate mMatter and iIndoor dDust samples, respectively; Table S10: Pairwise cComparison, complete results. Letters “P”, “D” and “S” represent SPM, indoor dust and soil, respectively; Text S1: Assumptions and parameter adjustments for age-based exposure modelling [31,32,56,57,58,59]; Text S2: Methodology for the estimation of confidence levels.

Author Contributions

F.G.V.: Conceptualization, Data curation, Formal analysis, Investigation, Validation, Methodology, Writing—original draft, Writing—review and editing. F.L.O.: Data curation, Formal analysis, Methodology. C.C.S.: Data curation, Methodology. A.V.D.: Methodology, Investigation, writing—review and editing. M.A.L.-G.: Conceptualization, Methodology, Investigation, Validation, Funding acquisition, Supervision, Visualization, Writing—original draft. R.T.A.: Conceptualization, Methodology, Investigation, Validation, Funding acquisition, Supervision, Visualization, Writing—review and editing. All authors have read and agreed to the published version of the manuscript.

Funding

This research was partially supported by the Chilean National Fund for Scientific and Technological Development (FONDECYT), under ANID FONDECYT Regular Grants No. 1220948 and 1241485.

Data Availability Statement

The data supporting the conclusions of this article are available within the article and in the Supplementary Materials. Additional information may be requested from the corresponding authors for academic, non-commercial research purposes.

Acknowledgments

The authors thank the laboratory team for their valuable contributions during the development of the study and for the refinement of the methodological framework through extensive and constructive discussions. During the preparation of this manuscript, the authors used ChatGPT (OpenAI GPT-5.2 Pro) for English grammar revision and language editing. The authors have reviewed and edited the output and take full responsibility for the content of this publication.

Conflicts of Interest

The authors declare no conflicts of interest.

References

  1. Chen, L.C.; Lippmann, M. Effects of Metals within Ambient Air Particulate Matter (PM) on Human Health. Inhal. Toxicol. 2009, 21, 1–31. [Google Scholar] [CrossRef]
  2. Weichenthal, S.; Pollitt, K.G.; Villeneuve, P.J. PM2.5, oxidant defence and cardiorespiratory health: A review. Environ. Health 2013, 12, 40. [Google Scholar] [CrossRef] [PubMed]
  3. Nazaroff, W.W. Indoor particle dynamics. Indoor Air 2004, 14, 175–183. [Google Scholar] [CrossRef] [PubMed]
  4. Mielke, H.W.; Reagan, P.L. Soil is an important pathway of human lead exposure. Environ. Health Perspect. 1998, 106, 217–229. [Google Scholar]
  5. Doyi, I.N.; Strezov, V.; Isley, C.F.; Yazdanparast, T.; Taylor, M.P. The relevance of particle size distribution and bioaccessibility on human health risk assessment for trace elements measured in indoor dust. Sci. Total. Environ. 2020, 733, 137931. [Google Scholar] [CrossRef]
  6. Zheng, K.; Zeng, Z.; Huang, J.; Tian, Q.; Cao, B.; Huo, X. Kindergarten indoor dust metal(loid) exposure associates with elevated risk of anemia in children. Sci. Total. Environ. 2022, 851, 158227. [Google Scholar] [CrossRef]
  7. Ferreira-Baptista, L.; De Miguel, E. Geochemistry and risk assessment of street dust in Luanda, Angola: A tropical urban environment. Atmospheric Environ. 2005, 39, 4501–4512. [Google Scholar] [CrossRef]
  8. Qing, X.; Yutong, Z.; Shenggao, L. Assessment of heavy metal pollution and human health risk in urban soils of steel industrial city (Anshan), Liaoning, Northeast China. Ecotoxicol. Environ. Saf. 2015, 120, 377–385. [Google Scholar] [CrossRef] [PubMed]
  9. Tembo, B.D.; Sichilongo, K.; Cernak, J. Distribution of copper, lead, cadmium and zinc concentrations in soils around Kabwe town in Zambia. Chemosphere 2006, 63, 497–501. [Google Scholar] [CrossRef]
  10. Banza, C.L.N.; Nawrot, T.S.; Haufroid, V.; Decrée, S.; De Putter, T.; Smolders, E.; Kabyla, B.I.; Luboya, O.N.; Ilunga, A.N.; Mutombo, A.M.; et al. High human exposure to cobalt and other metals in Katanga, a mining area of the Democratic Republic of Congo. Environ. Res. 2009, 109, 745–752. [Google Scholar] [CrossRef]
  11. Kunt, F.; Türkyılmaz, E.S. Detection of Heavy Metals in Educational Institutions’ Indoor Dust and Their Risks to Health. Atmosphere 2023, 14, 780. [Google Scholar] [CrossRef]
  12. Unsal, M.H.; Ignatavičius, G.; Valiulis, A.; Prokopciuk, N.; Valskienė, R.; Valskys, V. Assessment of Heavy Metal Contamination in Dust in Vilnius Schools: Source Identification, Pollution Levels, and Potential Health Risks for Children. Toxics 2024, 12, 224. [Google Scholar] [CrossRef]
  13. Bootdee, S.; Sillapapiromsuk, S.; Kawichai, S. Trace Elements in Indoor Dust Exposure from Child Development Centers and Health Risk Assessment in Haze and Industrial Areas, Thailand. Toxics 2025, 13, 547. [Google Scholar] [CrossRef]
  14. WHO. Guidelines Approved by the Guidelines Review Committee. In WHO Global Air Quality Guidelines: Particulate Matter (PM2.5 and PM10), Ozone, Nitrogen Dioxide, Sulfur Dioxide and Carbon Monoxide; World Health Organization: Geneva, Switzerland, 2021. [Google Scholar]
  15. WHO. Ambient (Outdoor) Air Pollution; World Health Organization: Geneva, Switzerland, 2024. [Google Scholar]
  16. CDC. CDC Updates Blood Lead Reference Value; Centers for Disease Control and Prevention: Atlanta, GA, USA, 2024. [Google Scholar]
  17. Lerner, S.; Zones, S. The Front Lines of Toxic Chemical Exposure in the United States; The MIT Press: Cambridge, MA, USA, 2010. [Google Scholar]
  18. Bullard, R.D. Book Review. Sacrifice Zones: The Front Lines of Toxic Chemical Exposure in the United States, Environmental Health Perspectives; ACS Publications: Washington, DC, USA, 2011; Volume 116. [Google Scholar]
  19. Cabezas, D. Zonas de Sacrificio: Qué Son, Dónde Están y por Qué Suponen un Desastre Ecológico, Los40. 2023. Available online: https://los40.com/los40/2023/04/05/actualidad/1680692441_585867.html (accessed on 7 January 2026).
  20. Gayo, E.M.; Muñoz, A.A.; Maldonado, A.; Lavergne, C.; Francois, J.P.; Rodríguez, D.; Klock-Barría, K.; Sheppard, P.R.; Aguilera-Betti, I.; Alonso-Hernández, C.; et al. A Cross-Cutting Approach for Relating Anthropocene. Environ. Injustice Sacrif. Zones Earth’s Future 2022, 10, e2021EF002217. [Google Scholar] [CrossRef]
  21. Valenzuela-Fuentes, K.; Alarcón-Barrueto, E.; Torres-Salinas, R. From Resistance to Creation: Socio-Environmental Activism in Chile’s “Sacrifice Zones”. Sustainability 2021, 13, 3481. [Google Scholar] [CrossRef]
  22. Palma, N. Entre el Progreso y la Crisis Medioambiental: Fundición Ventanas Inició Cierre de Operaciones tras 58 años de Actividad; Radio Universidad de Chile: Santiago, Chile, 2023; Available online: https://radio.uchile.cl/2023/05/31/entre-el-progreso-y-la-crisis-medioambiental-fundicion-ventanas-inicio-cierre-de-operaciones-tras-58-anos-de-actividad/ (accessed on 7 January 2026).
  23. González, I.; Neaman, A.; Rubio, P.; Cortés, A. Spatial distribution of copper and pH in soils affected by intensive industrial activities in Puchuncaví and Quintero, central Chile. J. Soil Sci. Plant Nutr. 2014, 14, 943–953. [Google Scholar] [CrossRef]
  24. Parra, S.; Bravo, M.A.; Quiroz, W.; Moreno, T.; Karanasiou, A.; Font, O.; Vidal, V.; Cereceda, F. Distribution of trace elements in particle size fractions for contaminated soils by a copper smelting from different zones of the Puchuncaví Valley (Chile). Chemosphere 2014, 111, 513–521. [Google Scholar] [CrossRef]
  25. Rueda-Holgado, F.; Calvo-Blázquez, L.; Cereceda-Balic, F.; Pinilla-Gil, E. Temporal and spatial variation of trace elements in atmospheric deposition around the industrial area of Puchuncaví-Ventanas (Chile) and its influence on exceedances of lead and cadmium critical loads in soils. Chemosphere 2016, 144, 1788–1796. [Google Scholar] [CrossRef]
  26. Tapia-Gatica, J.; González-Miranda, I.; Salgado, E.; Bravo, M.A.; Tessini, C.; Dovletyarova, E.A.; Paltseva, A.A.; Neaman, A. Advanced determination of the spatial gradient of human health risk and ecological risk from exposure to As, Cu, Pb, and Zn in soils near the Ventanas Industrial Complex (Puchuncaví, Chile). Environ. Pollut. 2020, 258, 113488. [Google Scholar] [CrossRef] [PubMed]
  27. Tume, P.; Barrueto, K.; Olguin, M.; Torres, J.; Cifuentes, J.; Ferraro, F.X.; Roca, N.; Bech, J.; Cornejo, O. The influence of the industrial area on the pollution outside its borders: A case study from Quintero and Puchuncavi districts, Chile. Environ. Geochem. Health 2019, 42, 2557–2572. [Google Scholar] [CrossRef] [PubMed]
  28. Parra, S.; de la Fuente-Mella, H.; González-Rojas, A.; Bravo, M.A. Exposure to Environmental Pollution in Schools of Puchuncaví, Chile: Characterization of Heavy Metals, Health Risk Assessment, and Effects on Children’s Academic Performance. Sustainability 2024, 16, 2518. [Google Scholar] [CrossRef]
  29. U.S. EPA. Risk Assessment Guidance for Superfund: Volume 1—Human Health Evaluation Manual. Part E, Supplemental Guidance for Dermal Risk Assessment; U.S. EPA: Washington, DC, USA, 2004.
  30. U.S. EPA. Risk Assessment Guidance for Superfund: Volume 1—Human Health Evaluation Manual. Part F, Supplemental Guidance for Inhalation Risk Assessment; U.S. EPA: Washington, DC, USA, 2009.
  31. U.S. EPA. Exposure Factors Handbook 2011 Edition (Final Report); U.S. EPA: Washington, DC, USA, 2011.
  32. U.S. EPA. Update for Chapter 5 of the Exposure Factors Handbook: Soil and Dust Ingestion; U.S. EPA: Washington, DC, USA, 2017.
  33. DGAC Chile; DMC. (Dirección Meteorológica de Chile—Servicios Climáticos), Agua Caída, Valores Diarios, Mensuales y Totales para un año; DGAC Chile: Santiago, Chile, 2024. [Google Scholar]
  34. Toro, A.R.; Claramunt, A.T.; González, V.F.; Ávila, G.S.; Manuel, A.L.-G. Long-term assessment and acute air pollution events in a mega-industrial area in Central Chile. Urban Clim. 2024, 55, 101880. [Google Scholar]
  35. Oyarzo-Miranda, C.; Latorre, N.; Meynard, A.; Rivas, J.; Bulboa, C.; Contreras-Porcia, L. Coastal pollution from the industrial park Quintero bay of central Chile: Effects on abundance, morphology, and development of the kelp Lessonia spicata (Phaeophyceae). PLoS ONE 2020, 15, e0240581. [Google Scholar] [CrossRef]
  36. Anderson, J.O.; Thundiyil, J.G.; Stolbach, A. Clearing the Air: A Review of the Effects of Particulate Matter Air Pollution on Human Health. J. Med. Toxicol. 2011, 8, 166–175. [Google Scholar] [CrossRef]
  37. Garcia, A.; Santa-Helena, E.; De Falco, A.; Ribeiro, J.d.P.; Gioda, A.; Gioda, C.R. Toxicological Effects of Fine Particulate Matter (PM2.5): Health Risks and Associated Systemic Injuries—Systematic Review. Water Air Soil Pollut. 2023, 234, 346. [Google Scholar] [CrossRef] [PubMed]
  38. Lobos, F. Tasas de Deposición de Metales Pesados Asociados al Material Particulado Sedimentable en el Entorno del Complejo Industrial Las Ventanas. Bachelor’s Thesis, University of Chile, Santiago, Chile, 2024. [Google Scholar]
  39. U.S. EPA. Method 3051A (SW-846): Microwave Assisted Acid Digestion of Sediments, Sludges, and Oils; U.S. EPA: Washington, DC, USA, 2007.
  40. Souza, E.J.d.S.; Mora, C.Z.; Zuluaga, B.H.A.; Amaral, C.D.B.D.; Grassi, M.T. Multi-elemental analysis of particulate matter PM2.5 and PM10 by ICP OES. Talanta 2021, 221, 121457. [Google Scholar] [CrossRef]
  41. Sutherland, R.A. Bed sediment-associated trace metals in an urban stream, Oahu, Hawaii. Environ. Geol. 2000, 39, 611–627. [Google Scholar] [CrossRef]
  42. Muller, G. Index of Geoaccumulation in Sediments of the Rhine River. GeoJournal 1969, 2, 108–118. [Google Scholar]
  43. Loska, K.; Wiechuła, D.; Korus, I. Metal contamination of farming soils affected by industry. Environ. Int. 2004, 30, 159–165. [Google Scholar] [CrossRef] [PubMed]
  44. Barbieri, M. The Importance of Enrichment Factor (EF) and Geoaccumulation Index (Igeo) to Evaluate the Soil Contamination. J. Geol. Geophys. 2016, 5, 1–4. [Google Scholar] [CrossRef]
  45. Zapata, A.V.Z. Análisis Geoquímico y Geoestadístico de la Concentración Elemental en los Suelos de las Comunas de Quintero y Puchuncaví. Bachelor’s Thesis, University of Chile, Santiago, Chile, 2020. [Google Scholar]
  46. Alotaibi, M.O.; Albedair, L.A.; Alotaibi, N.M.; Elobeid, M.M.; Al-Swadi, H.A.; Alasmary, Z.; Ahmad, M. Pollution Indexing and Health Risk Assessment of Heavy-Metals-Laden Indoor and Outdoor Dust in Elementary School Environments in Riyadh, Saudi Arabia. Atmosphere 2022, 13, 464. [Google Scholar] [CrossRef]
  47. Instituto Nacional de Estadísticas (INE) de Chile. Proyecciones y Estimaciones de Población. Esperanza de vida al Nacer (en años), Según Sexo, por Quinquenios Comprendidos Entre los Años 1950 y 2025; Instituto Nacional de Estadísticas (INE) de Chile: Santiago, Chile, 2004.
  48. Parviainen, A.; Vázquez-Arias, A.; Arrebola, J.P.; Martín-Peinado, F.J. Human health risks associated with urban soils in mining areas. Environ. Res. 2022, 206, 112514. [Google Scholar] [CrossRef]
  49. U.S. EPA. Regional Screening Levels (RSLs)—Generic Tables; United States Environmental Protection Agency: Washington, DC, USA, 2015.
  50. R.A.I.S. (RAIS). Chemical Toxicity Values; Oak Ridge National Laboratory: Oak Ridge, TN, USA, 2024. [Google Scholar]
  51. Mahmoud, N.; Al-Shahwani, D.; Al-Thani, H.; Isaifan, R.J. Risk Assessment of the Impact of Heavy Metals in Urban Traffic Dust on Human Health. Atmosphere 2023, 14, 1049. [Google Scholar] [CrossRef]
  52. Alsafran, M.; Usman, K.; Al Jabri, H.; Rizwan, M. Ecological and Health Risks Assessment of Potentially Toxic Metals and Metalloids Contaminants: A Case Study of Agricultural Soils in Qatar. Toxics 2021, 9, 35. [Google Scholar] [CrossRef] [PubMed]
  53. Bollhöfer, A.; Rosman, K. Isotopic source signatures for atmospheric lead: The Southern Hemisphere. Geochim. et Cosmochim. Acta 2000, 64, 3251–3262. [Google Scholar] [CrossRef]
  54. IARC Working Group on the Evaluation of Carcinogenic Risks to Humans. Arsenic, metals, fibres, and dusts. IARC Monogr Eval Carcinog Risks Hum. 2012, 100, 11–465. [Google Scholar]
  55. Rasmussen, P.E.; Levesque, C.; Chénier, M.; Gardner, H.D. Contribution of metals in resuspended dust to indoor and personal inhalation exposures: Relationships between PM10 and settled dust. Build. Environ. 2018, 143, 513–522. [Google Scholar] [CrossRef]
  56. Asante-Duah, K. Public Health Risk Assessment for Human Exposure to Chemicals; Springer: Dordrecht, The Netherlands, 2017. [Google Scholar]
  57. MINSAL. Patrones de Crecimiento. Para la Evaluación Nutricional de Niños, Niñas y Adolescentes, Desde el Nacimiento Hasta los 19 Años de Edad; MINISTERIO DE SALUD de Chile: Región Metropolitana, Chile, 2018. [Google Scholar]
  58. Pacheco Valderrama, C.A.; Merellano-Navarro, E. Efectos del entrenamiento funcional sobre la composición corporal infantil en niños de 10 a 13 años de edad. Rev. Chil. Rehabil. Act. Física 2023, 3, 1–19. [Google Scholar] [CrossRef]
  59. Vargas V, R.; Bahamonde P, C.; Cancino L, J.; Correa E, P.; Michelow B, S.; Gatica M, P.; Gómez C, R.; Martínez S, C.; Vargas V, D.; Luna S, D.; et al. Parámetros de crecimiento y adiposidad corporal de adolescentes chilenos a través de la referencia CDC-2000 y CDC-2012: Estudio ACECH. Rev. Chil. Nutr. 2014, 41, 54–60. [Google Scholar] [CrossRef]
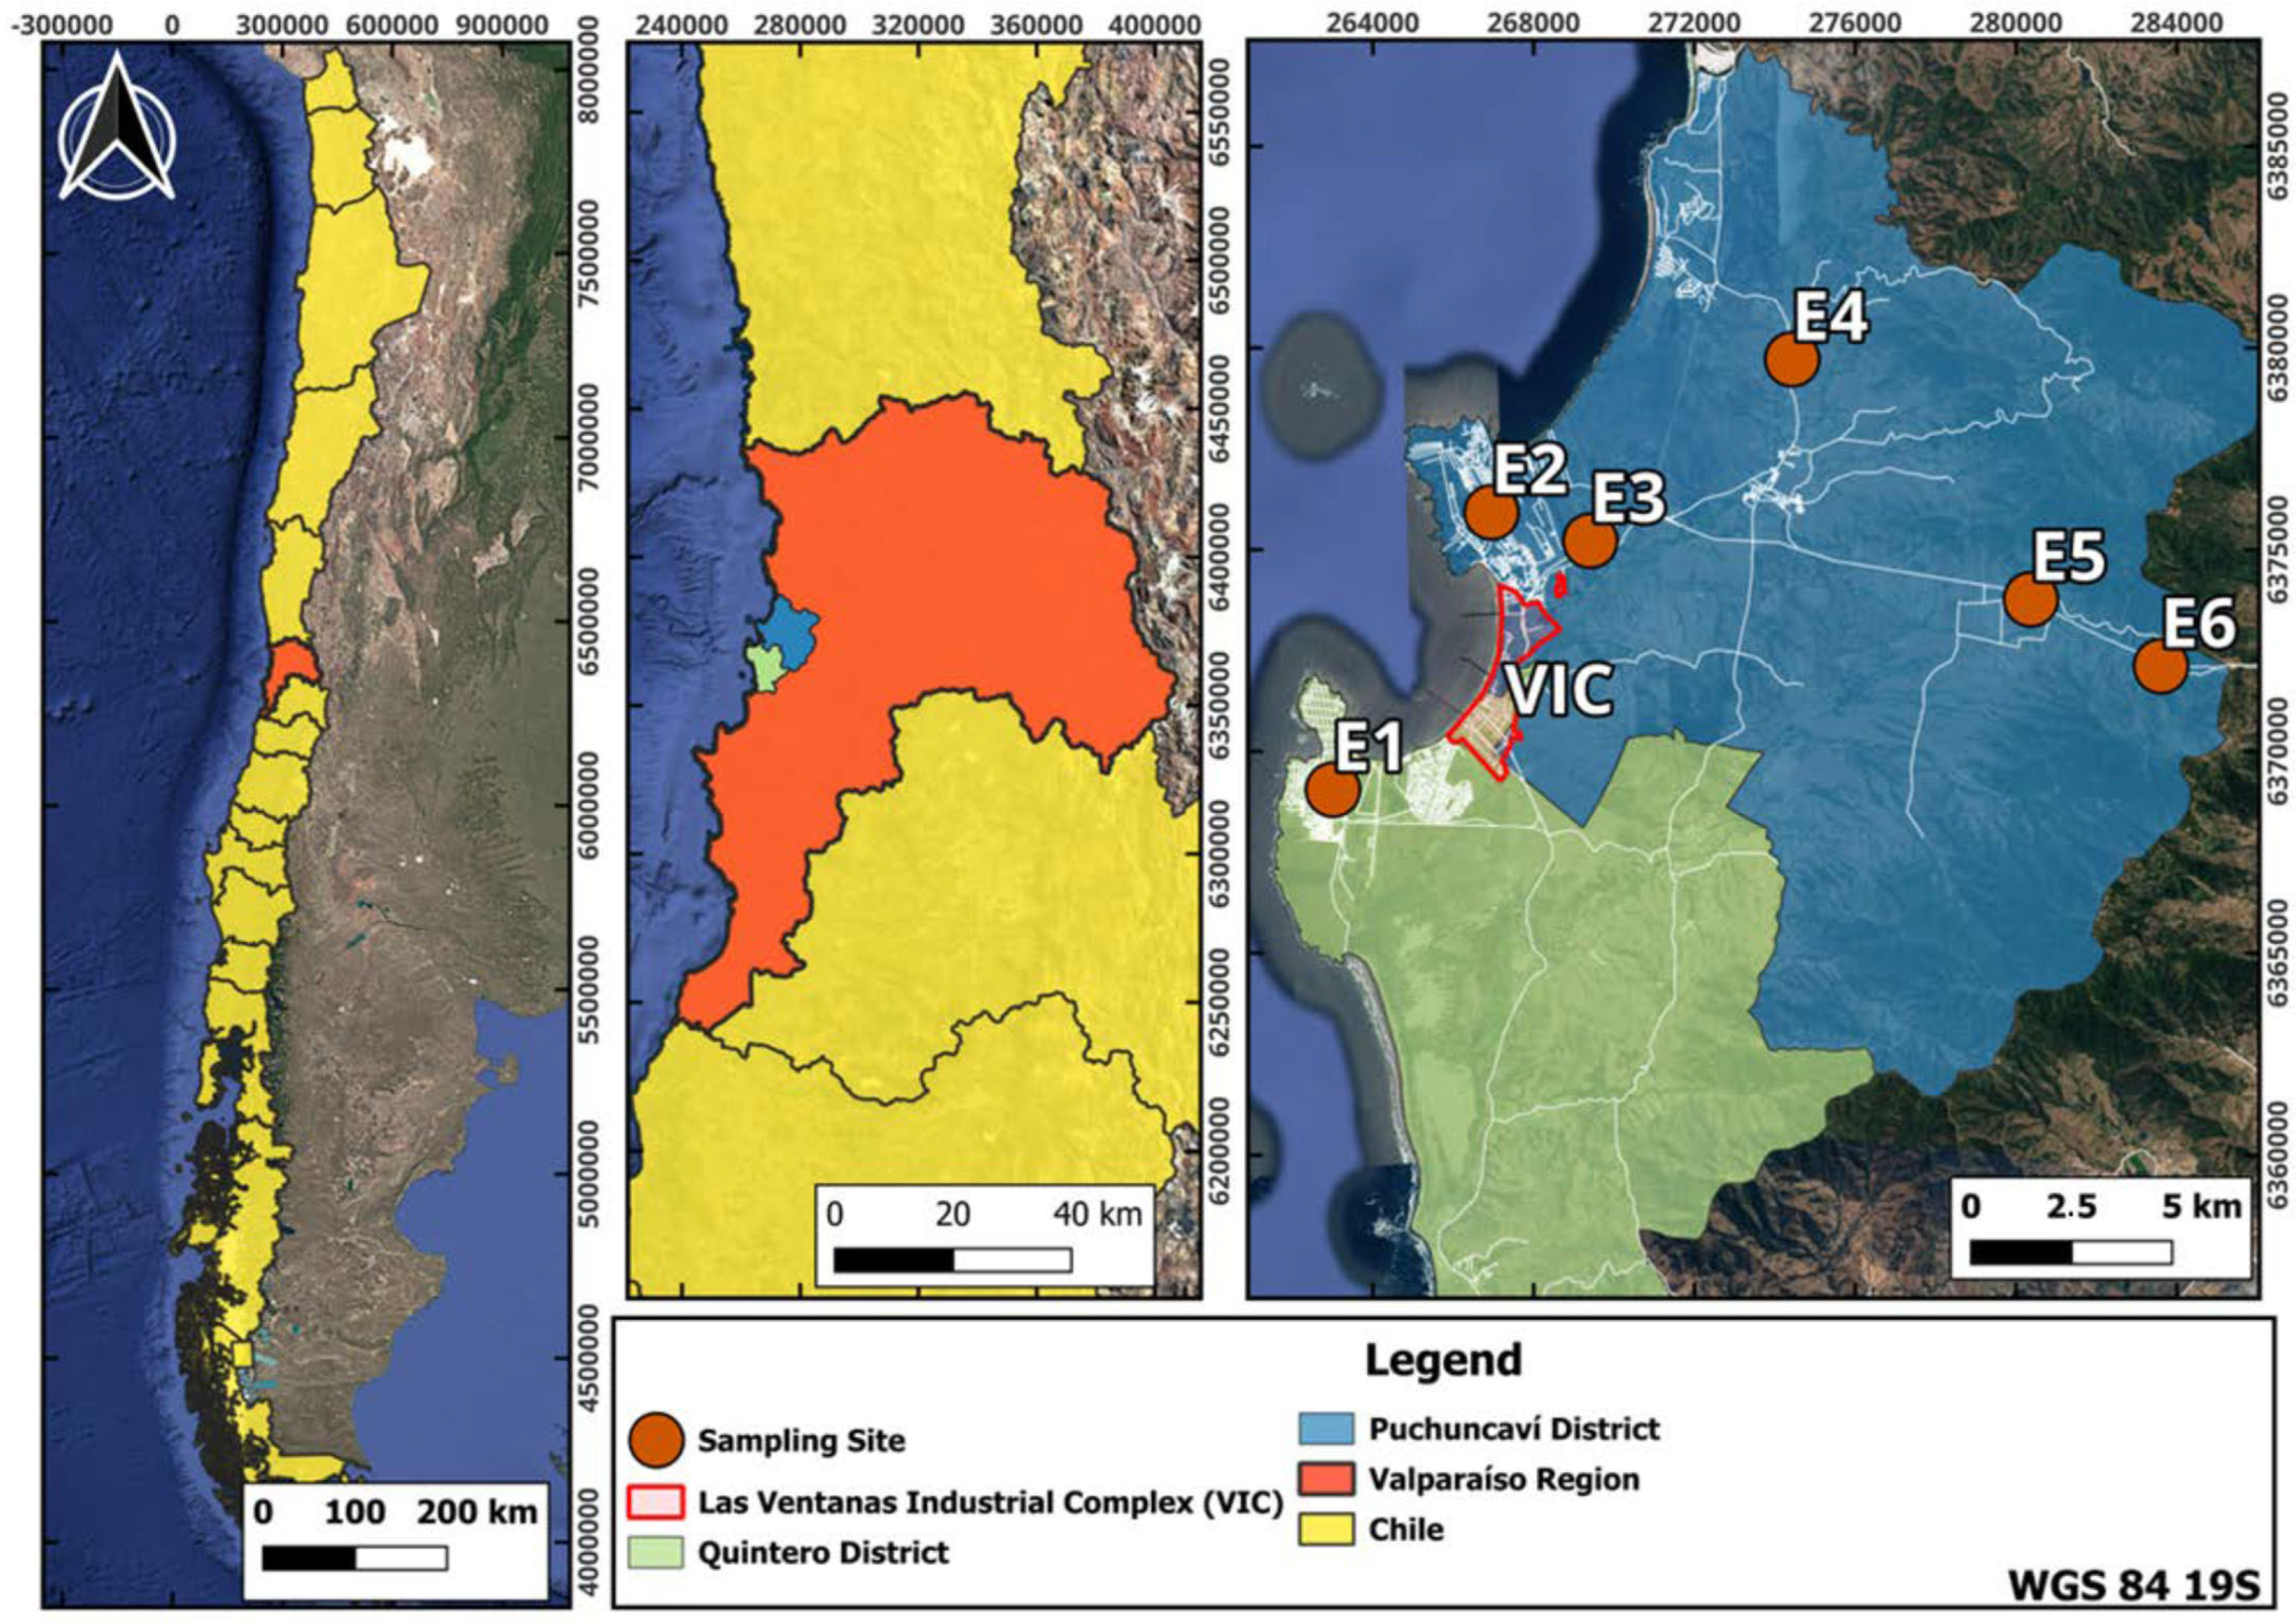
Figure 1. Location of the study area in central Chile. The map shows the Valparaíso Region’s position within Chile (left), the Quintero and Puchuncaví districts’ locations (center), and the Las Ventanas Industrial Complex (VIC) polygon, the school sampling sites (E1–E6), and the urban areas highlighted in white (right).
Environments 13 00146 g001
Figure 2. Heatmap visualization of Enrichment Factor (EF, left) and Geoaccumulation Index (Igeo, right) values for six TMs (As, Cd, Cr, Cu, Ni, Pb) across different sample sites in the Quintero–Puchuncaví district. Sampling included surface soils (S1–S4), indoor dust (DS1–DS6; DW1–DW6), and settleable particulate matter (PS1–PS6; PW1–PW6). Values are color-coded according to contamination categories: EF (Def–min = deficiency to minimal enrichment, Mod = moderate, Sig = significant, V–h = very high, Ext = extremely high) and Igeo (Uncont = uncontaminated, U–Mod = uncontaminated to moderately contaminated, Mod = moderately contaminated, H = heavily contaminated, Mod–H = moderately to heavily contaminated, H–Ext = heavily to extremely contaminated, Ext = extremely contaminated). Numeric labels within cells indicate measured EF or Igeo values, formatted with one decimal place if <10 and rounded integers if ≥10.
Environments 13 00146 g002
Table 1. Summary of acid digestion program for microwaved assisted acid digestion used for soil, indoor dust, and PM samples.
Sample MatrixSolution (mL)StepsPower (W)Ramp Temperature (°C)Ramp Time (min)Max. Pressure (Bar)Temperature (°C)Time (min)
Soil/Indoor Dust 10 HNO3
Suprapur
1960175 ± 55.5 ± 0.25S/I175 ± 54.5
Particulate Matter10 HNO3 Suprapur15001208S/I120 ± 510
28001805180 ± 58
Table 2. Values used for the risk assessment calculations (compiled by the authors from the sources cited) [28,29,31,32,46,47,48,49].
VariableMeaningChildren ChildrenAdolescents/Adults
(<6 Ages)(6–12 Ages)(12–80 Ages)
Cm (mg/kg)Concentration per sampleConcentration per sample
IngR (mg/day)Ingestion Rate1006060
InhR (m3/day)Inhalation Rate13.816.624.6
SA (cm2)Exposed Skin Surface280057005700
SF (mg/cm2)Soil–Skin Adherence Factor0.20.20.07
ABS (%) [As]Dermal Absorption Factor0.03
ABS (%) [Other]Dermal Absorption Factor0.001
EF (day/year)Exposure FrequencySoil: 10; Dust: 50; SPM: 60Soil: 10; Dust: 57; SPM: 67Soil: 14; Dust: 89; SPM: 102
ED (year)Exposure Duration53.530.5
CF (kg/mg)Conversion factor1 × 0−6
PEF (m3/kg)Particulate Emission Factor 1.36 × 10⁹
BW (kg)Body Weight10.845.6106.5
ATnc (days)Average time (AT) for non-carcinogenic effects to manifestED × 365
ATca (days)Average time (AT) for carcinogenic effects to manifest80 years × 365
Table 3. Reference dose (RfD) values (mg/(kg·day)−1) and slope factors (SF) for each TM (compiled by the authors from the sources cited) [46,50,51,52].
TERfDingRfCRfDdermSFIngSFInhSFDer
As3.0 × 0−41.5 × 10−51.2 × 10−41.51.513.7
Cd5.0 × 10−41.0 × 10−51.0 × 10−5-6.3-
Cr3.0 × 10−31.0 × 10−46.0 × 10−50.54.22
Cu3.0 × 10−4-1.2 × 10⁻²---
Ni2.0 × 10−29.0 × 10−55.4 × 10−31.70.94.25
Pb4.3 × 10−41.5 × 10−45.3 × 10−48.5 × 10−34.2 × 10−2-
Table 4. Average concentrations of TMs (mg kg−1, mean ± SD) in settleable particulate matter (SPM), indoor dust, and soils collected from schools in Quintero–Puchuncaví during winter (W) and summer (S) campaigns.
Sample TypeAsCdCrCuNiPb
SPM—Winter (PW)90.8 ± 37.680.9 ± 74.3296.5 ± 157.44337.6 ± 1997.5317.7 ± 159.4377.7 ± 195.5
SPM—Summer (PS)469.4 ± 615.5340.6 ± 457.21338 ± 1579.55328.3 ± 6902.91025.1 ± 1316706.8 ± 923.5
Indoor dust—Winter (DW)31.5 ± 20.13.2 ± 0.667.3 ± 29.2689.5 ± 51184.6 ± 5094.5 ± 51.5
Indoor dust—Summer (DS)30.4 ± 10.43.8 ± 2.0116.5 ± 136.6860.5 ± 521.377.3 ± 39.7141.1 ± 52.6
Soil (Sites E1–E4) (S)26.3 ± 10.05.7 ± 3.070.4 ± 43.0443.6 ± 387.457.7 ± 19.082.9 ± 32.6
Table 5. Hazard Quotients (HQ) and Hazard Index (HI) for settleable particulate matter (SPM), indoor dust (ID) and surface soils. Because Cu yielded very high HQ values in SPM and ID and would dominate screening totals, HI and ΣHI are reported excluding Cu to facilitate interpretation of the remaining metals. Total HI including Cu can be obtained as HItotal = HI + HQCu. Seasonal averages were used to estimate the confidence levels for each site; these are available in Supplementary Table S9.
Sample-SiteAsCdCrCuNiPbHazard Index *Overall, for Study Zone *
Hazard Quotient (HQ)HIΣHI
PW10.700.260.19150.031.232.4221
PW20.520.130.15140.020.571.39
PW30.790.190.16470.021.162.32
PW40.710.340.19280.032.244
PW51.641.260.48380.0636
PW60.980.550.44450.0535
PS10.810.250.1950.040.511.8073
PS21.810.600.36110.031.274
PS31.820.550.37340.020.964
PS41.370.520.4090.030.933
PS5732.60490.19821
PS617731370.401239
DW10.140.020.041.524.5 × 0−30.450.665
DW20.160.020.052.140.010.270.51
DW30.390.020.0590.010.571.04
DW40.170.010.0534.1 × 10−30.230.47
DW50.230.010.0434.6 × 10−30.210.49
DW60.550.020.0980.020.751.42
DS10.270.020.044.815.1 × 10−30.610.936
DS20.160.010.302.790.010.420.90
DS30.360.020.0590.010.591.03
DS40.190.010.0544.7 × 10−30.700.95
DS50.330.010.0594.3 × 10−30.540.94
DS60.280.030.0430.010.911.27
S10.04 ± 0.010.01 ± 9.7 × 10−40.02 ± 0.010.29 ± 0.151.3 × 10−3 ± 3.7 × 10−40.07 ± 0.040.43 ± 0.162.33 ± 0.73
S20.06 ± 0.020.01 ± 5.8 × 10−40.01 ± 6.6∙10−40.58 ± 0.108.2 × 10−4 ± 1.3 × 10−40.05 ± 0.030.71 ± 0.11
S30.04 ± 0.013.4 × 10−3 ± 7.9 × 10−40.01 ± 4.0∙10−30.71 ± 0.688.9 × 10−4 ± 2.9 × 10−40.07 ± 0.020.84 ± 0.68
S40.02 ± 3.7 × 10−32.1 × 10−3 ± 8.0 × 10−40.01 ± 1.2∙10−30.28 ± 0.199.0 × 10−4 ± 3.1 × 10−40.05 ± 0.010.35 ± 0.19
* HI and ΣHI were calculated excluding Cu for SPM and indoor settled dust; Cu HQ values are reported separately.
Table 6. Incremental Lifetime Cancer Risk (ILCR) and Risk Index for settleable particulate matter (SPM), indoor dust (ID), and surface soils (S) in schools of the Quintero–Puchuncaví district. Risks are interpreted against USEPA thresholds (10−6–10−4), where values above 10−4 indicate “probable cancer risk” scenarios. Seasonal averages were used to estimate the confidence levels for each site; these are available in Supplementary Table S9.
Sample-SiteAsCdCrNiPbRisk IndexOverall, for Study Zone
Incremental Lifetime Cancer Risk (ILCR)RiskΣRisk
PW12.0 × 10−52.3 × 10−91.6 × 10−55.6 × 10−53.0 × 10−79.2 × 10−57.5 × 10−4
PW21.5 × 10−51.1 × 10−91.2 × 10−53.5 × 10−51.4 × 10−76.2 × 10⁻⁵
PW32.3 × 10−51.6 × 10−91.3 × 10−54.7 × 10−52.8 × 10−78.2 × 10⁻⁵
PW42.0 × 10−53.0 × 10−91.5 × 10−57.5 × 10−55.5 × 10−71.1 × 10⁻⁴
PW54.7 × 10−51.1 × 10−83.9 × 10−51.4 × 10−46.8 × 10−72.2 × 10⁻⁴
PW62.8 × 10−54.7 × 10−93.5 × 10−51.2 × 10−47.7 × 10−71.8 × 10⁻⁴
PS12.3 × 10−52.2 × 10−91.6 × 10−58.1 × 10−51.2 × 10−71.2 × 10−43.1 × 10−3
PS25.2 × 10−55.2 × 10−93.0 × 10−57.6 × 10−53.1 × 10−71.6 × 10⁻⁴
PS35.2 × 10−54.8 × 10−93.1 × 10−55.4 × 10−52.4 × 10−71.4 × 10⁻⁴
PS43.9 × 10−54.5 × 10−93.3 × 10−57.2 × 10−52.3 × 10−71.4 × 10⁻⁴
PS52.0 × 10−42.8 × 10−82.2 × 10−44.3 × 10−41.9 × 10−68.5 × 10⁻⁴
PS64.9 × 10−45.8 × 10−82.9 × 10−48.9 × 10−42.9 × 10−61.7 × 10⁻³
DW13.5 × 10−64.3 × 10−102.8 × 10−68.7 × 10−61.0 × 10−71.5 × 10−51.7 × 10⁻⁴
DW23.9 × 10−64.6 × 10−103.2 × 10−62.0 × 10−55.9 × 10−82.7 × 10−5
DW39.4 × 10−64.2 × 10−103.3 × 10−61.9 × 10−51.1 × 10−73.2 × 10−5
DW44.9 × 10−63.8 × 10−104.0 × 10−69.4 × 10−65.7 × 10−81.8 × 10−5
DW56.6 × 10−63.0 × 10−103.4 × 10−61.0 × 10−55.2 × 10−82.1 × 10−5
DW61.6 × 10−55.4 × 10−107.5 × 10−63.5 × 10−51.9 × 10−75.9 × 10−5
DS13.7 × 10−54.1 × 10−103.7 × 10−61.2 × 10−51.2 × 10−75.2 × 10−53.9 × 10⁻⁴
DS21.7 × 10−53.4 × 10−103.1 × 10−53.6 × 10−58.1 × 10−88.5 × 10−5
DS35.0 × 10−54.7 × 10−105.0 × 10−61.9 × 10−51.1 × 10−77.3 × 10−5
DS42.8 × 10−53.4 × 10−105.8 × 10−61.3 × 10−51.7 × 10−74.7 × 10−5
DS55.0 × 10−54.4 × 10−105.1 × 10−61.1 × 10−51.4 × 10−76.7 × 10−5
DS64.2 × 10−51.1 × 10−94.2 × 10−62.1 × 10−52.3 × 10−76.7 × 10⁻⁵
S11.1 × 10−6 ± 1.9 × 10−72.2 × 10−10 ± 2.5 × 10−111.1 × 10⁻⁶ ± 7.3 × 10−72.7 × 10−6 ± 7.6 × 10−71.6 × 10−8 ± 8.2 × 10−94.9 × 10−6 ± 1.1 × 10−61.6 × 10−5 ± 1.6 × 10⁻⁶
S21.6 × 10−6 ± 5.3 × 10−71.4 × 10−10 ± 1.7 × 10−117.6 × 10⁻⁷ ± 4.1 × 10−71.7 × 10−6 ± 1.9 × 10−71.2 × 10−8 ± 4.4 × 10−94.1 × 10−6 ± 7.0 × 10⁻⁷
S31.2 × 10−6 ± 3.3 × 10−79.0 × 10−11 ± 1.7 × 10−117.2 × 10⁻⁷ ± 3.0 × 10−71.9 × 10−6 ± 5.9 × 10−71.7 × 10−8 ± 4.6 × 10−93.8 × 10−6 ± 7.3 × 10⁻⁷
S46.7 × 10−7 ± 1.0 × 10−75.5 × 10−11 ± 2.1 × 10−114.8 × 10⁻⁷ ± 8.7 × 10−81.9 × 10−6 ± 6.4 × 10−71.0 × 10−8 ± 2.7 × 10−93.0 × 10−6 ± 6.5 × 10⁻⁷
Disclaimer/Publisher’s Note: The statements, opinions and data contained in all publications are solely those of the individual author(s) and contributor(s) and not of MDPI and/or the editor(s). MDPI and/or the editor(s) disclaim responsibility for any injury to people or property resulting from any ideas, methods, instructions or products referred to in the content.