Article

Backward and Historical PFOA Exposure Estimation in an Adult Population Highly Exposed in the Veneto Region

by
Patrizia Bartolotta
1,
Alan Ducatman
2,
Enrico Ioverno
1,
Armando Olivieri
1 and
Mario Saugo
1,*
1
College of Physicians of the Province of Vicenza, Contrà Paolo Lioy, 13, 36100 Vicenza, Italy
2
School of Public Health, West Virginia University, Morgantown, WV 26506, USA
*
Author to whom correspondence should be addressed.
Environments 2025, 12(9), 291; https://doi.org/10.3390/environments12090291
Submission received: 12 July 2025 / Revised: 18 August 2025 / Accepted: 20 August 2025 / Published: 22 August 2025
(This article belongs to the Special Issue Environmental Pollution Exposure and Its Human Health Risks)

Abstract

This research letter reviews the recorded serum values obtained following the detection of perfluorooctanoic acid (PFOA) water contamination in Veneto, which are underestimations of the true extent of the internal contamination experienced by the exposed populations. The most likely peak serum concentrations were in a range with a median of 136.0 and an intequartile( IQR )of 64.8–258.3 ng/mL for young males and a median of 74.5 and an IQR of 22.6–167.4 ng/mL for young females, compared to the median serum PFOA contamination that was finally detected (64.1 for males and 30.2 ng/mL for females, respectively) when blood samples were drawn. This was 27 months after the implementation of the single granular activated carbon drinking water filtration and 30 months after the disclosure of the heavy drinking water contamination.

1. Introduction

The estimation of past exposure and the reconstruction of historical exposure are fundamental for evaluating adverse neoplastic and non-neoplastic health events in populations heavily exposed to per- and polyfluoroalkyl substances (PFAS) pollution [1,2]. Past exposure estimation can refer to external exposure (e.g., toxic substance concentration in drinking water) or internal exposure (e.g., toxic substance concentration in human serum). An example of external perfluorooctane sulfonic acid (PFOS) and perfluorohexane sulfonic acid (PFHxS) exposure historical estimation is provided by the case study of Ronneby (Sweden). The Ronneby population was exposed to drinking water contaminated with firefighting foams used at a nearby airport; the population was divided into three groups (“never high exposure,” “early high exposure” and “late high exposure”), based on the source of drinking water at their residency between 1985 and 2013 [3].
An example of external and internal exposure historical estimation is the C8 Health Project. This presented a detailed modeled description of the environmental fate of PFOA pollution in surface water, in both saturated and unsaturated aquifers and in the atmosphere of six water districts with variable degrees of pollution through the extensive use of validated environmental models [4]. Moreover, serum measurements and overall modeled external human exposure were recalibrated through a validated pharmacokinetic model, leading to a modeled estimate of internal exposure (PFOA serum, ng/mL) over time [5]. The key parameter in pharmacokinetic models is clearance, i.e., the serum volume that can be physiologically purified from given toxic substances per unit of time [5]. Publicly available PFAS serum calculators rely on similarly modeled estimates with steady-state assumptions [6,7].
The hotspot in the Veneto Region of Italy represents the largest documented episode of human industrial point-source exposure to PFOA worldwide [8]. Individuals in this area were exposed to a PFAS mixture, including PFOS and PFHxS and perfluorobutane sulfonic acid (PFBS); data are consistent with PFOA being the PFAS present at highest concentrations throughout the region [2]. The need to study this exposure population analytically has long been highlighted—both locally and internationally—in order to contribute to a more complete ascertainment of adverse health effects and a more detailed definition of the dose–response relationship for kidney and testicular cancer and also for other non-neoplastic diseases.
The available data for estimating historical human exposure to PFOA in the Veneto Region hotspot population include the following:
  • An estimate of the time of arrival of PFOA contamination at the central drinking water distribution facility (Madonna di Lonigo), which serves the most affected area. This was estimated at 17 years based on the average groundwater flow velocity and a retardation factor of 1.9. The estimated year of arrival at the waterworks is 1986 [9].
  • The date when single activated carbon filtration was installed at the same water distribution plant (September 2013) [10].
  • An estimate of the PFOA daily intake rate (ng/kg-day) from public drinking water and non-local food after the installation of carbon filtration (September 2013 to December 2017). This was carried out by the Istituto Superiore di Sanità, based on contamination measurements from 1591 drinking water samples collected in the affected area and food intake estimates from northeastern Italy (thus excluding locally sourced foods) [10,11].
  • PFOA serum level measurements collected during the Regional Health Surveillance Plan among 18,345 exposed males and females 14 to 39 years of age; enrollment was launched on 1 January 2017, and about four-fifths of the samples were collected before August 2018, with an estimated participation rate of 63.5%. The screening was then completed in May 2023 [12].
  • An estimate of PFOA half-life in the 2871 males (2.83 years, 95% CI: 2.78–2.89) and 2989 females (2.04 years, 95% CI: 2.00–2.08) residing in the impacted area and participating in the Regional Health Surveillance Plan [13].
The objective of this research letter is to estimate historical internal exposure to PFOA in the Veneto hotspot for epidemiologic purposes and for an initial comparison with exposure thresholds of public health relevance.

2. Methodology

Beginning in January 2017, PFOA serum measurements were conducted for 18-to-39-year-old adult males and females participating in the Regional Health Surveillance Plan. To approximate the empirical distribution of these measurements, a log-normal distribution was assumed, i.e.,
L o g C ~ N μ , σ 2
where C denotes the serum concentration of PFOA.
Under this assumption, the parameters (μ and σ) of the underlying log-normal distribution were estimated using summary statistics, including the 5th percentile (p5), the median and the 95th percentile (p95), as provided by the Regional Health Surveillance Plan [6]. For the calculation the following equation was applied:
Serum concentration at p-th percentile = exp(μ + zpσ)
where zp is the z-score (standard normal deviate) corresponding to the p-th percentile. Subsequently, a Monte Carlo approach was applied to derive estimates of the 25th (p25) and 75th (p75) percentiles of serum concentrations of PFOA. The calculation of p25 and p75 was considered crucial to ensure the robustness of the study. Values below p25 were excluded from the analysis, as they may have reflected short-term exposure, potentially due to recent changes in residence, adolescent age or reduced intake of contaminated tap water (e.g., exclusive use of bottled water). Additionally, the timing of blood sampling may have contributed to these lower values. Conversely, values above the 75th percentile were also excluded due to their potential association with additional exposure sources, such as drinking private well water or consuming significant amounts of locally contaminated food. A biomonitoring study conducted by the Istituto Superiore di Sanità (ISS) reported that families of local farmers and livestock breeders exhibited substantially higher PFOA serum levels compared to the other residents of the Veneto hotspot area [14].
To model the time course of PFOA serum levels, a one-compartment pharmacokinetic model for adults was used [6]. In this study, we considered a modified version of this model, consolidating exposure into a single parameter representing the daily intake rate from drinking water (expressed in ng/kg-day), instead of the two separate parameters used in the original formulation: the concentration of PFOA in drinking water (µg/L) and the estimated daily water intake (L/kg-day). This modification enabled modeling the daily intake rate from different sources, particularly from drinking water and food [15]. The serum concentration at time t (Ct) was then estimated using the following equation:
C t = C s s + C 0 C s s e k t
where
  • Css is the serum concentration of PFOA at steady state (ng/mL), resulting from PFOA daily intake rate via drinking water and food;
  • C0 is the initial or baseline serum concentration of PFOA (ng/mL);
  • k is the elimination rate constant (year−1), calculated as k = ln(2)/t1/2, where t1/2 is the elimination half-life (in years)
For the backward calculation, C0 represents the measured serum concentration of PFOA at the time of enrollment in the Veneto Regional Health Surveillance Program, which began in 2017. This time point corresponds to approximately 27 months after the major reduction in exposure due to the installation of activated carbon filtration systems (September 2013) and 30 months after the public disclosure of severe PFOA contamination in drinking water (July 2013). Time, t, measured in years, thus assumes negative values. To estimate the steady-state concentration (Css), the following equation was used:
C s s = I R C l + C B
where
  • IR is the daily intake rate (ng/kg-day) of PFOA via drinking water and food consumption;
  • Cl is the clearance rate of PFOA (L/kg-day), calculated as Cl = k × Vd, where Vd is the volume of distribution per body weight (0.17 L/kg for PFOA) and k is the elimination half-life;
  • CB is the background serum concentration of PFOA resulting from other sources of exposure (e.g., dust ingestion, inhalation and direct contact). CB was estimated by multiplying the serum concentration observed in residents of the Veneto Region never exposed to contaminated water or local food by the percent contribution (Pc) from these alternative sources in the general population [8,15].
Based on a study conducted by ISS, which included extensive analyses of drinking water ( 1591 samples), and data concerning contamination of non-local food collected by the European Food Safety Agency, local estimates of overall PFOA daily intake rate via drinking water and food consumption are available for the Veneto hotspot [10]. Among the scenarios considered by ISS, Scenario 3 was chosen, referring to the period following the implementation of the single activated carbon filtration (September 2013–December 2017); thus, it depicts residents who drank public water exclusively in that period, without consuming any local food. Other ISS scenarios assume consumption of water from private wells with or without local food and were not considered to ensure a conservative estimate of the daily intake rate. Other ISS scenarios assume consumption of water from private wells and local food and were not considered to ensure a conservative estimate. A Medium Bound (MB) approach was applied to estimate values below the analytical limit of detection (LoD) or quantification (LoQ) [10,16]. The intake values thus identified, originally expressed as a ratio relative to the 2018 European Food Safety Agency Tolerable Weekly Intake, were converted into the corresponding absolute value (2.31 ng/kg-day). According to the one-compartment pharmacokinetic model described above, this intake corresponds to an average serum PFOA concentration of 24.6 ng/mL in males and 10.4 ng/mL in females.
To calculate historical estimates of serum PFOA levels from 1986 to 2013, a starting serum PFOA concentration of 3.9 ng/L was considered, according to the available Italian historical data; exposure was considered constant over time, leading to a steady-state serum concentration equivalent to the back-calculation value for 2017 [17].
The estimate of serum PFOA levels at the start of single activated carbon filtration was performed through Monte Carlo simulations, separately by sex and using software R 4.3.3. A description of the main sources of uncertainty is also presented.

3. Results

Among young adults participating in the Regional Health Surveillance Plan from 1 January 2017 onward, the medians and 5th and 95th percentiles of serum PFOA concentrations were as follows: males: 64.1, 9.0 and 240.3 ng/mL; females: 30.2, 3.8 and 125.2 ng/mL). The log-normal distribution derived to approximate these empirical values is summarized in Table 1 and Figure 1.
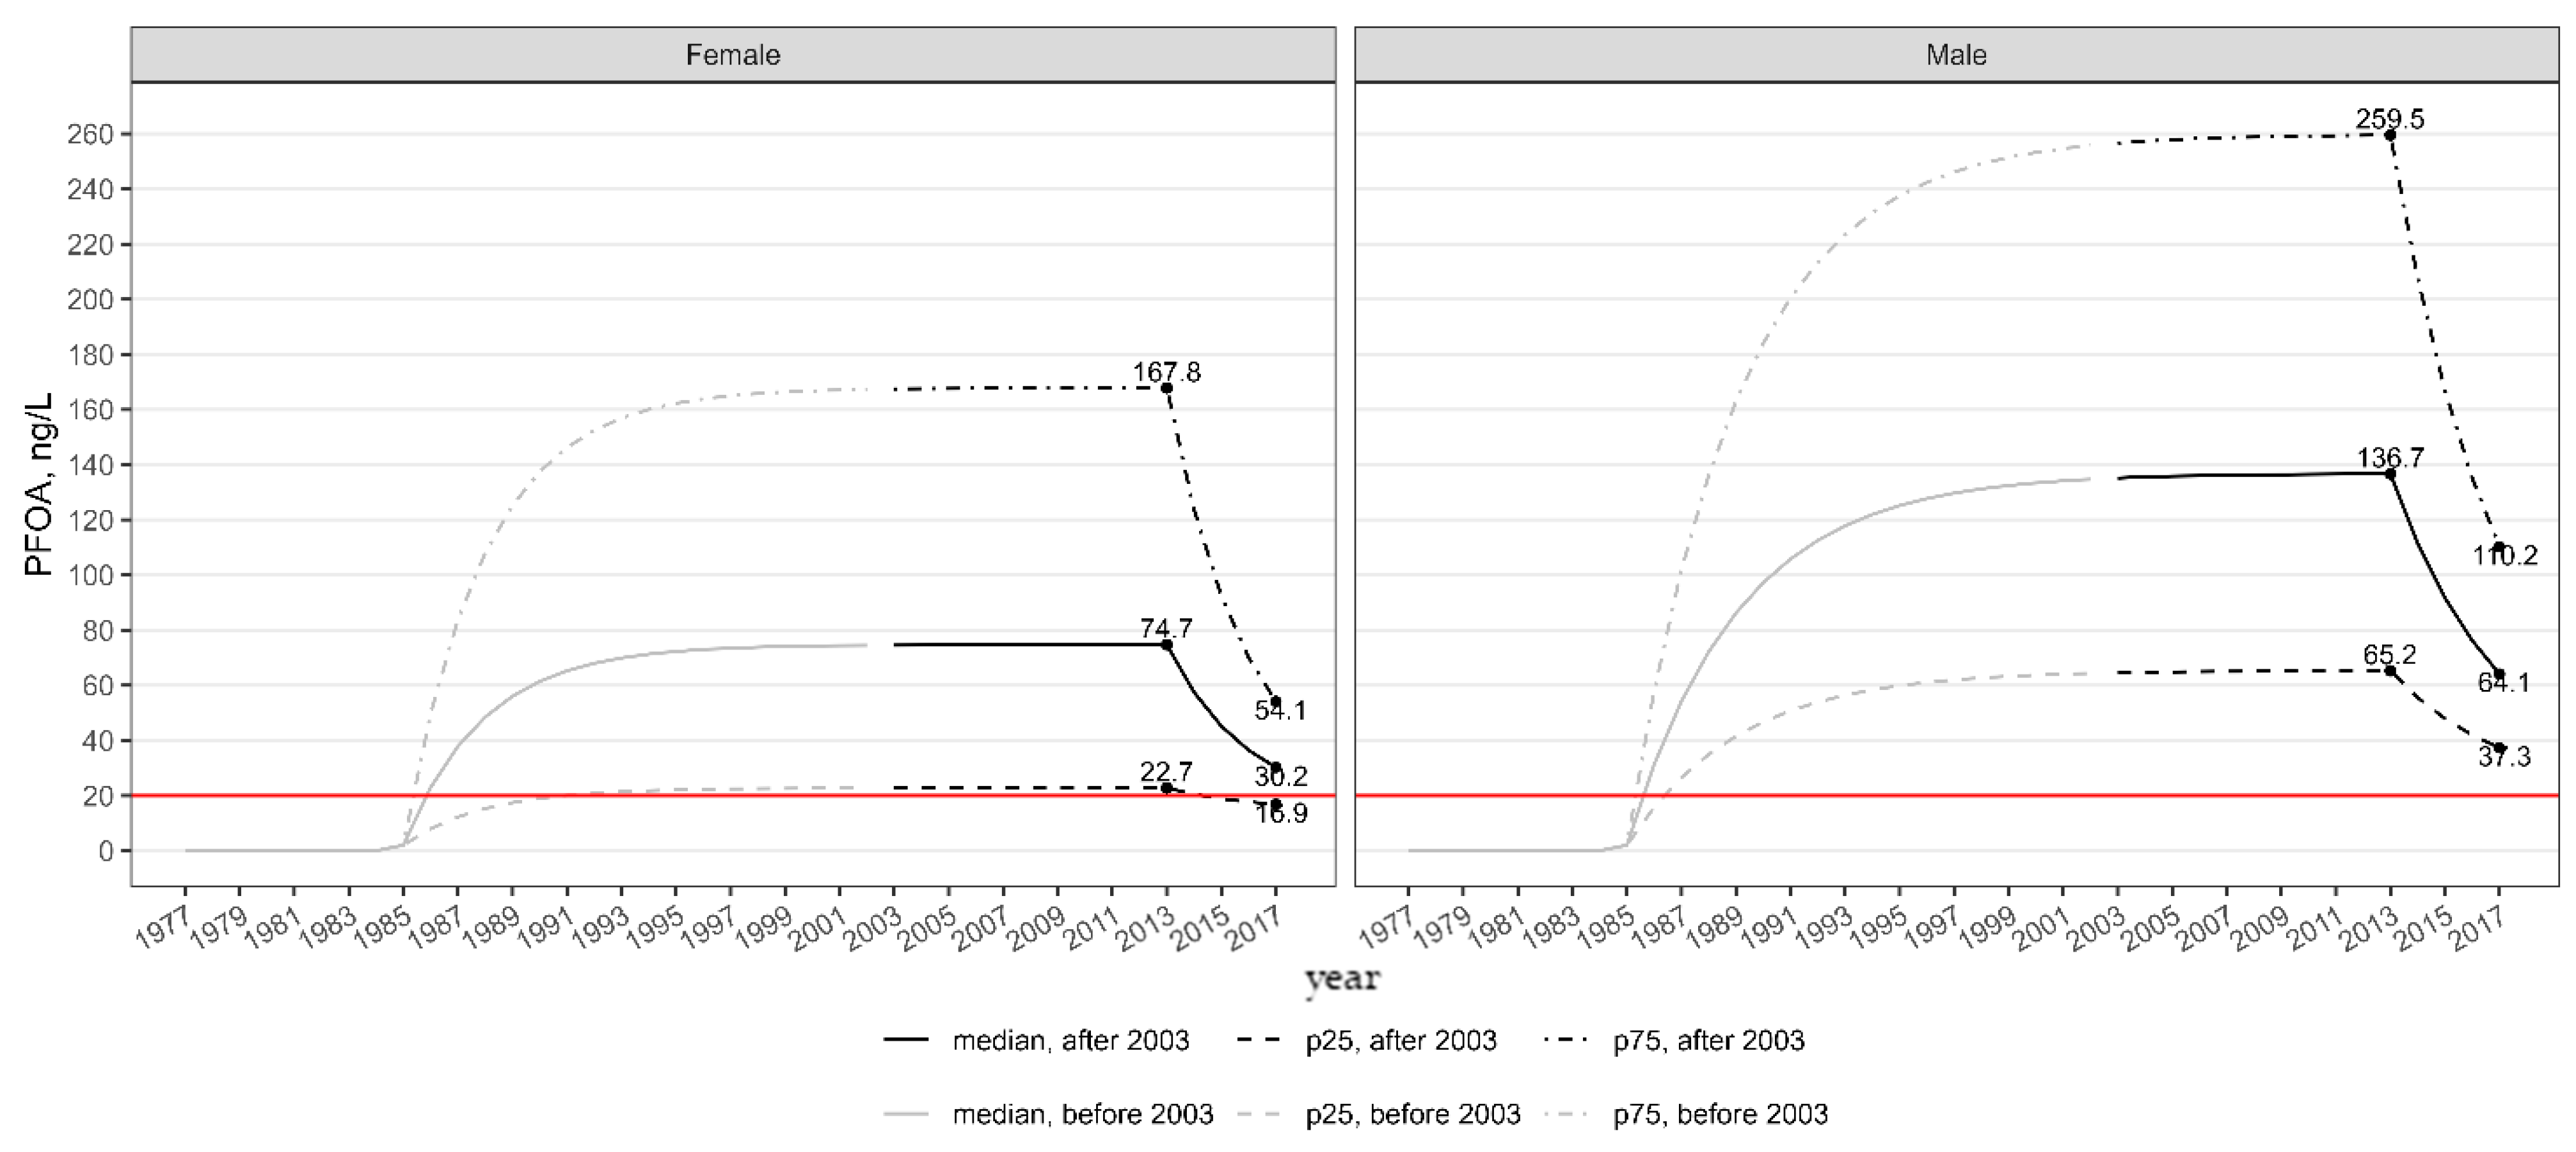
Calculated serum PFOA concentrations are shown in Figure 2. The grey lines represent estimates before 2003—a period marked by greater uncertainty due to limited data on external exposure levels over the years (see Table 2 and Figure S2), while the black lines correspond to estimates after 2003. In females, the estimated median, 75th percentile and 25th percentile concentrations peaked at 74.7, 167.8 and 22.7 ng/L, respectively. In males, the corresponding values were 136.7, 259.5 and 65.2 ng/L. The red horizontal line in Figure 2 indicates the 20 ng/L threshold for medical screening for the sum of seven PFAS chemicals, including PFOA, as recommended by the US National Academies of Sciences, Engineering, and Medicine [1].
As a sensitivity analysis, we repeated the calculations using the median, the 5th and 95th percentile estimates from the ln-Normal Approximation reported in Table 1 (see Figure S3).
The uncertainties underlying historical serum PFOA concentration estimates are summarized in Table 2. The greatest uncertainty stems from the unknown absolute quantities of PFOA reaching drinking wells over time (also see Section 4). Figure S1 illustrates that during 1984–2002, the amount of pollutant immitted into the aquifer and contaminating the drinking water wells could have been only one-third of that in the subsequent period. However, there are poor data on wastewater treatment measures implemented by the company during that time, while a hydraulic barrier to limit PFAS contamination of the groundwater was activated later [18,19].

4. Discussion

At the time the contamination of drinking water became known, exposure to PFOA among the population residing in the Veneto hotspot was very high, both in adult males (median: 135.2 ng/mL, p25: 54.6, p75: 281.4 ng/mL) and in adult females (median: 74.2 ng/mL, p25: 16.9, p75: 192.7 ng/mL). Our work models the higher estimated serum concentrations before serum was finally collected.
These estimates are of the same order of magnitude as those found in the most contaminated Water Districts of the C8 Study, where blood samples were taken promptly, almost concurrently with the start of activated carbon filtration interventions [20]. Timing of blood draw has long been highlighted as a key factor influencing the interpretation of exposure biomarkers in severely polluted communities and among those who are occupationally exposed [21]. Our modeled observation of sex differences is generally consistent with but possibly more pronounced than previous high-exposure and representative-exposure populations [20,22]. These differences are also present in nationally representative populations and generally attributed to PFAS excretion in menstrual fluid, transplacental transfer from mothers to developing humans and secretion in breast milk, thus decreasing the maternal serum concentrations while exposing newborns [23]. The baseline median serum PFOA disparity between young males and females reported in the Veneto Regional Health Surveillance Plan is greater than that observed in another similarly highly exposed population (20–39-year-old males and females enrolled in the C8 study). The absolute difference is 33.7 vs. 11.3 ng/mL, and the corresponding ratio is 2.1 vs. 1.7 for the Veneto Region and Mid-Ohio Valley residents of the United States, respectively [20]. A plausible explanation for this disparity is the longer time elapsed between the intervention to reduce human exposure and the collection of blood samples in Veneto.
Our study has limitations. Estimates for earlier calendar years carry a major uncertainty, especially for the period before 2003, where production data are available, but there is a lack of data on the remediation systems adopted by the company (see Figure S1) [18]. Of note, in the early years of production, there was no wastewater treatment plant, and discharges were released directly into the waters of the nearby Poscola stream. A recent study also assumed that the pollutant load reaching the wells remained constant through the years [16]. The absolute PFOA daily intake rate estimate calculated by ISS for the period 2014–2017 (2.31 ng/kg-day) for individuals who did not drink water from private wells and did not consume locally grown food appears to be realistic [10]. According to the same ISS report, 45.4% of this intake came from drinking water, corresponding to the consumption of water contaminated with 63.3 ng/L of PFOA, assuming an adult water intake of 16.6 mL/kg of body weight. This aligns with measurements of PFOA in drinking water from the same period (see Figure S2).
This study describes a multi-decade high-PFOA-exposure population. Due to the time elapsed between the disclosure of severe drinking water pollution as well as the time elapsed between the initiation of water filtration and the time of the blood draw, a backward estimation of the initial PFOA serum levels was modeled. Historical estimates carry complex assumptions and can mitigate but not fully correct the uncertainty inherent in the absence of earlier investigations in this important, high-exposure population. The backward and historic estimates are based on the two central quartiles of the distribution of serum PFOA concentrations measured during the Health Surveillance Program conducted by the Veneto Region. These estimates may underestimate mean values but should be representative of a significant portion of the population residing in the area affected by the contamination. However, substantial deviations will occur at the individual level, particularly according to the residential history and the source of drinking water used both before and after the disclosure of this severe episode of PFOA contamination of the water supply and local foods [15].
Our Monte Carlo simulations accounted for variability in serum PFOA concentrations; other important sources of biological variability—such as individual differences in clearance rates—were not incorporated. This modeling simplification may have led to underestimation of the variability in serum levels, particularly at the lower and upper percentiles of the distribution. Recently summarizing the available scientific evidence, IARC considers that the half-life of PFOA in humans is approximately 3.14 years (considering both men and women), which is broadly consistent with local results [2,13].
Despite limitations, our study still provides useful exposure estimates that may support research on health effects, including both cancer and non-cancer outcomes [1,2].

Supplementary Materials

The following supporting information can be downloaded at: https://www.mdpi.com/article/10.3390/environments12090291/s1, Figure S1: Annual production of PFOA by MITENI: year of production and estimated year of arrival in groundwater. Figure S2. Average and median PFAS concentrations in drinking water supplied by the water distribution network, by trimester—Veneto Region, Italy, July 2013 to November 2016 [24]. Figure S3. Historical estimates of serum PFOA concentrations in females and males derived from backward calculation, taking into consideration baseline median, 5-th and 95-th percentiles.

Author Contributions

All Authors contributed to conceptualization, methodology, original draft preparation, review and editing, and supervision. Data curation, M.S. Formal analysis, P.B. All authors have read and agreed to the published version of the manuscript.

Funding

This research received no external funding.

Institutional Review Board Statement

This study consists of the secondary analysis of publicly available aggregated data (8, 10, 13). For this reason, Institutional Review Board approval was not required.

Informed Consent Statement

Patient consent was waived due to the fact that no personal data was used; the study relies only on publicly available aggregated data.

Data Availability Statement

The original contributions presented in this study are included in the article/supplementary material. Further inquiries can be directed to the corresponding author(s).

Conflicts of Interest

Alan Ducatman has been an expert witness for the concerns of attorneys general of several US states in matters concerning PFAS pollution. In addition, he has been an expert witness for attorneys seeking class certification for the purpose of medical monitoring benefits in several PFAS-contaminated communities. Other Authors declare no conflict of interest.

References

  1. National Academies of Sciences, Engineering, and Medicine. Guidance on PFAS Exposure, Testing, and Clinical Follow-Up; The National Academies Press: Washington, DC, USA, 2022. [Google Scholar] [CrossRef]
  2. IARC. Perfluorooctanoic acid (PFOA) and perfluorooctanesulfonic acid (PFOS). In IARC Monographs on the Identification of Carcinogenic Hazards to Humans; ARC: Lyon, France, 2025; Volume 135, 754p. [Google Scholar]
  3. Li, H.; Hammarstrand, S.; Midberg, B.; Xu, Y.; Li, Y.; Olsson, D.S.; Fletcher, T.; Jakobsson, K.; Andersson, E.M. Cancer incidence in a Swedish cohort with high exposure to perfluoroalkyl substances in drinking water. Environ. Res. 2022, 204 Pt C, 112217. [Google Scholar] [CrossRef] [PubMed]
  4. Shin, H.M.; Vieira, V.M.; Ryan, P.B.; Detwiler, R.; Sanders, B.; Steenland, K.; Bartell, S.M. Environmental fate and transport modeling for perfluorooctanoic acid emitted from the Washington Works Facility in West Virginia. Environ. Sci. Technol. 2011, 45, 1435–1442. [Google Scholar] [CrossRef] [PubMed]
  5. Shin, H.M.; Vieira, V.M.; Ryan, P.B.; Steenland, K.; Bartell, S.M. Retrospective exposure estimation and predicted versus observed serum perfluorooctanoic acid concentrations for participants in the C8 Health Project. Environ. Health Perspect. 2011, 119, 1760–1765, Erratum in Environ. Health Perspect. 2013, 121, A113. [Google Scholar] [CrossRef] [PubMed] [PubMed Central]
  6. Lu, S.; Bartell, S.M. Serum PFAS Calculator for Adults, Version 1.2. 2020. Available online: www.ics.uci.edu/~sbartell/pfascalc.html (accessed on 1 July 2025).
  7. ATSDR PFAS Blood Level Estimation Tool. 2024. Available online: https://www.atsdr.cdc.gov/pfas/blood-testing/estimation-tool.html (accessed on 1 July 2025).
  8. Pitter, G.; Da Re, F.; Canova, C.; Barbieri, G.; Zare Jeddi, M.; Daprà, F.; Manea, F.; Zolin, R.; Bettega, A.M.; Stopazzolo, G.; et al. Serum Levels of Perfluoroalkyl Substances (PFAS) in Adolescents and Young Adults Exposed to Contaminated Drinking Water in the Veneto Region, Italy: A Cross-Sectional Study Based on a Health Surveillance Program. Environ. Health Perspect. 2020, 128, 27007. [Google Scholar] [CrossRef] [PubMed] [PubMed Central]
  9. ARPAV–Dipartimento Regionale Per La Sicurezza Del Territorio. Stima Dei Tempi Di Propagazione Dell’inquinamento Da Sostanze Perfluoroalchiliche (PFAS) Nelle Acque Sotterranee In Provincia Di Vicenza, Padova, Verona. 2025. Available online: https://www.arpa.veneto.it/arpav/chi-e-arpav/file-e-allegati/pfas/nt_0516_stima_tempi_propagazione_pfas_nella_acque_sotterranee_v04.pdf/@@display-file/file (accessed on 23 June 2025).
  10. Istituto Superiore Di Sanità, Dipartimento Di Sicurezza Alimentare, Nutrizione E Sanità Pubblica Veterinaria. Contaminazione Da Sostanze Perfluoroalchiliche In Veneto. Valutazione Dell’esposizione Alimentare E Caratterizzazione Del Rischio. Relazione Finale. 2019. Available online: https://www.sivempveneto.it/wp-content/uploads/2019/07/Relazione-PFAS_ISS-2019_finale.pdf (accessed on 23 June 2025).
  11. ARPAV Contaminazione Da PFAS: Azioni ARPAV Regione Veneto. Periodi Di Riferimento: Dal 14 Giugno 2013 Al 31 Dicembre 2017. 2018. Available online: https://www.arpa.veneto.it/arpav/pagine-generiche/allegati-pagine-generiche/pfas-relazioni-attivita-arpav/aggiornamento-relazione-pfas--gennaio-2018.pdf/@@display-file/file (accessed on 23 June 2025).
  12. Regione del Veneto. Piano Di Sorveglianza Sanitaria Sulla Popolazione Esposta A PFAS. Rapporto N. 17–Maggio 2023. Available online: https://www.regione.veneto.it/documents/10793/12935055/Bollettino+PFAS+n.+17+-+maggio+2023.pdf/95cd8c4c-8790-4725-b5b0-f3cd089b51cc (accessed on 1 July 2025).
  13. Batzella, E.; Rosato, I.; Pitter, G.; Da Re, F.; Russo, F.; Canova, C.; Fletcher, T. Determinants of PFOA Serum Half-Life After End of Exposure: A Longitudinal Study on Highly Exposed Subjects in the Veneto Region. Environ. Health Perspect. 2024, 132, 27002, Erratum in Environ. Health Perspect. 2025, 133, 49001. [Google Scholar] [CrossRef] [PubMed] [PubMed Central]
  14. Ingelido, A.M.; Abballe, A.; Gemma, S.; Dellatte, E.; Iacovella, N.; De Angelis, G.; Marra, V.; Russo, F.; Vazzoler, M.; Testai, E.; et al. Serum concentrations of perfluorinated alkyl substances in farmers living in areas affected by water contamination in the Veneto Region (Northern Italy). Environ. Int. 2020, 136, 105435. [Google Scholar] [CrossRef] [PubMed]
  15. Olivieri, A.; Shin, H.M.; Saugo, M. Impact of local food consumption on exposure to perfluorooctanoic acid and perfluorooctane sulfonate in a contaminated community in North-Eastern Italy. Epidemiol. Prev. 2024, 48, 326–332. (In English) [Google Scholar] [CrossRef] [PubMed]
  16. Vaccari, L.; Ranzi, A.; Canova, C.; Ghermandi, G.; Giannini, S.; Pitter, G.; Russo, F.; Stefanelli, J.; Teggi, S.; Vantini, A.; et al. Reliability of toxicokinetic modelling for PFAS exposure assessment in contaminated water in northern Italy. Heliyon 2024, 31, e35288. [Google Scholar] [CrossRef] [PubMed] [PubMed Central]
  17. Ingelido, A.M.; Marra, V.; Abballe, A.; Valentini, S.; Iacovella, N.; Barbieri, P.; Porpora, M.G.; di Domenico, A.; De Felip, E. Perfluorooctanesulfonate and perfluorooctanoic acid exposures of the Italian general population. Chemosphere 2010, 80, 1125–1130. [Google Scholar] [CrossRef] [PubMed]
  18. Girardi, P.; Merler, E. A mortality study on male subjects exposed to polyfluoroalkyl acids with high internal dose of perfluorooctanoic acid. Environ. Res. 2019, 179 Pt A, 108743. [Google Scholar] [CrossRef] [PubMed]
  19. TAR-Veneto-Sez.-IV-6-Maggio-2024-N.-896. Rivista Giuridica Online. Available online: https://rgaonline.it/wp-content/uploads/2024/08/TAR-Veneto-Sez.-IV-6-maggio-2024-n.-896.pdf (accessed on 1 July 2025).
  20. Frisbee, S.J.; Brooks, A.P., Jr.; Maher, A.; Flensborg, P.; Arnold, S.; Fletcher, T.; Steenland, K.; Shankar, A.; Knox, S.S.; Pollard, C.; et al. The C8 health project: Design, methods, and participants. Environ. Health Perspect. 2009, 117, 1873–1882. [Google Scholar] [CrossRef] [PubMed] [PubMed Central]
  21. Flesch-Janys, D.; Becher, H.; Gurn, P.; Jung, D.; Konietzko, J.; Manz, A.; Päpke, O. Elimination of polychlorinated dibenzo-p-dioxins and dibenzofurans in occupationally exposed persons. J. Toxicol. Environ. Health 1996, 47, 363–378. [Google Scholar] [CrossRef] [PubMed]
  22. Steenland, K.; Jin, C.; MacNeil, J.; Lally, C.; Ducatman, A.; Vieira, V.; Fletcher, T. Predictors of PFOA levels in a community surrounding a chemical plant. Environ. Health Perspect. 2009, 117, 1083–1088. [Google Scholar] [CrossRef] [PubMed] [PubMed Central]
  23. Jain, R.B.; Ducatman, A. Serum concentrations of selected perfluoroalkyl substances for US females compared to males as they age. Sci. Total Environ. 2022, 10, 156891. [Google Scholar] [CrossRef] [PubMed]
  24. WHO Europe. Keeping Our Water Clean: The Case of Water Contamination in the Veneto Region, Italy; WHO: Geneva, Switzerland, 2017; ISBN 9789289052467. [Google Scholar]
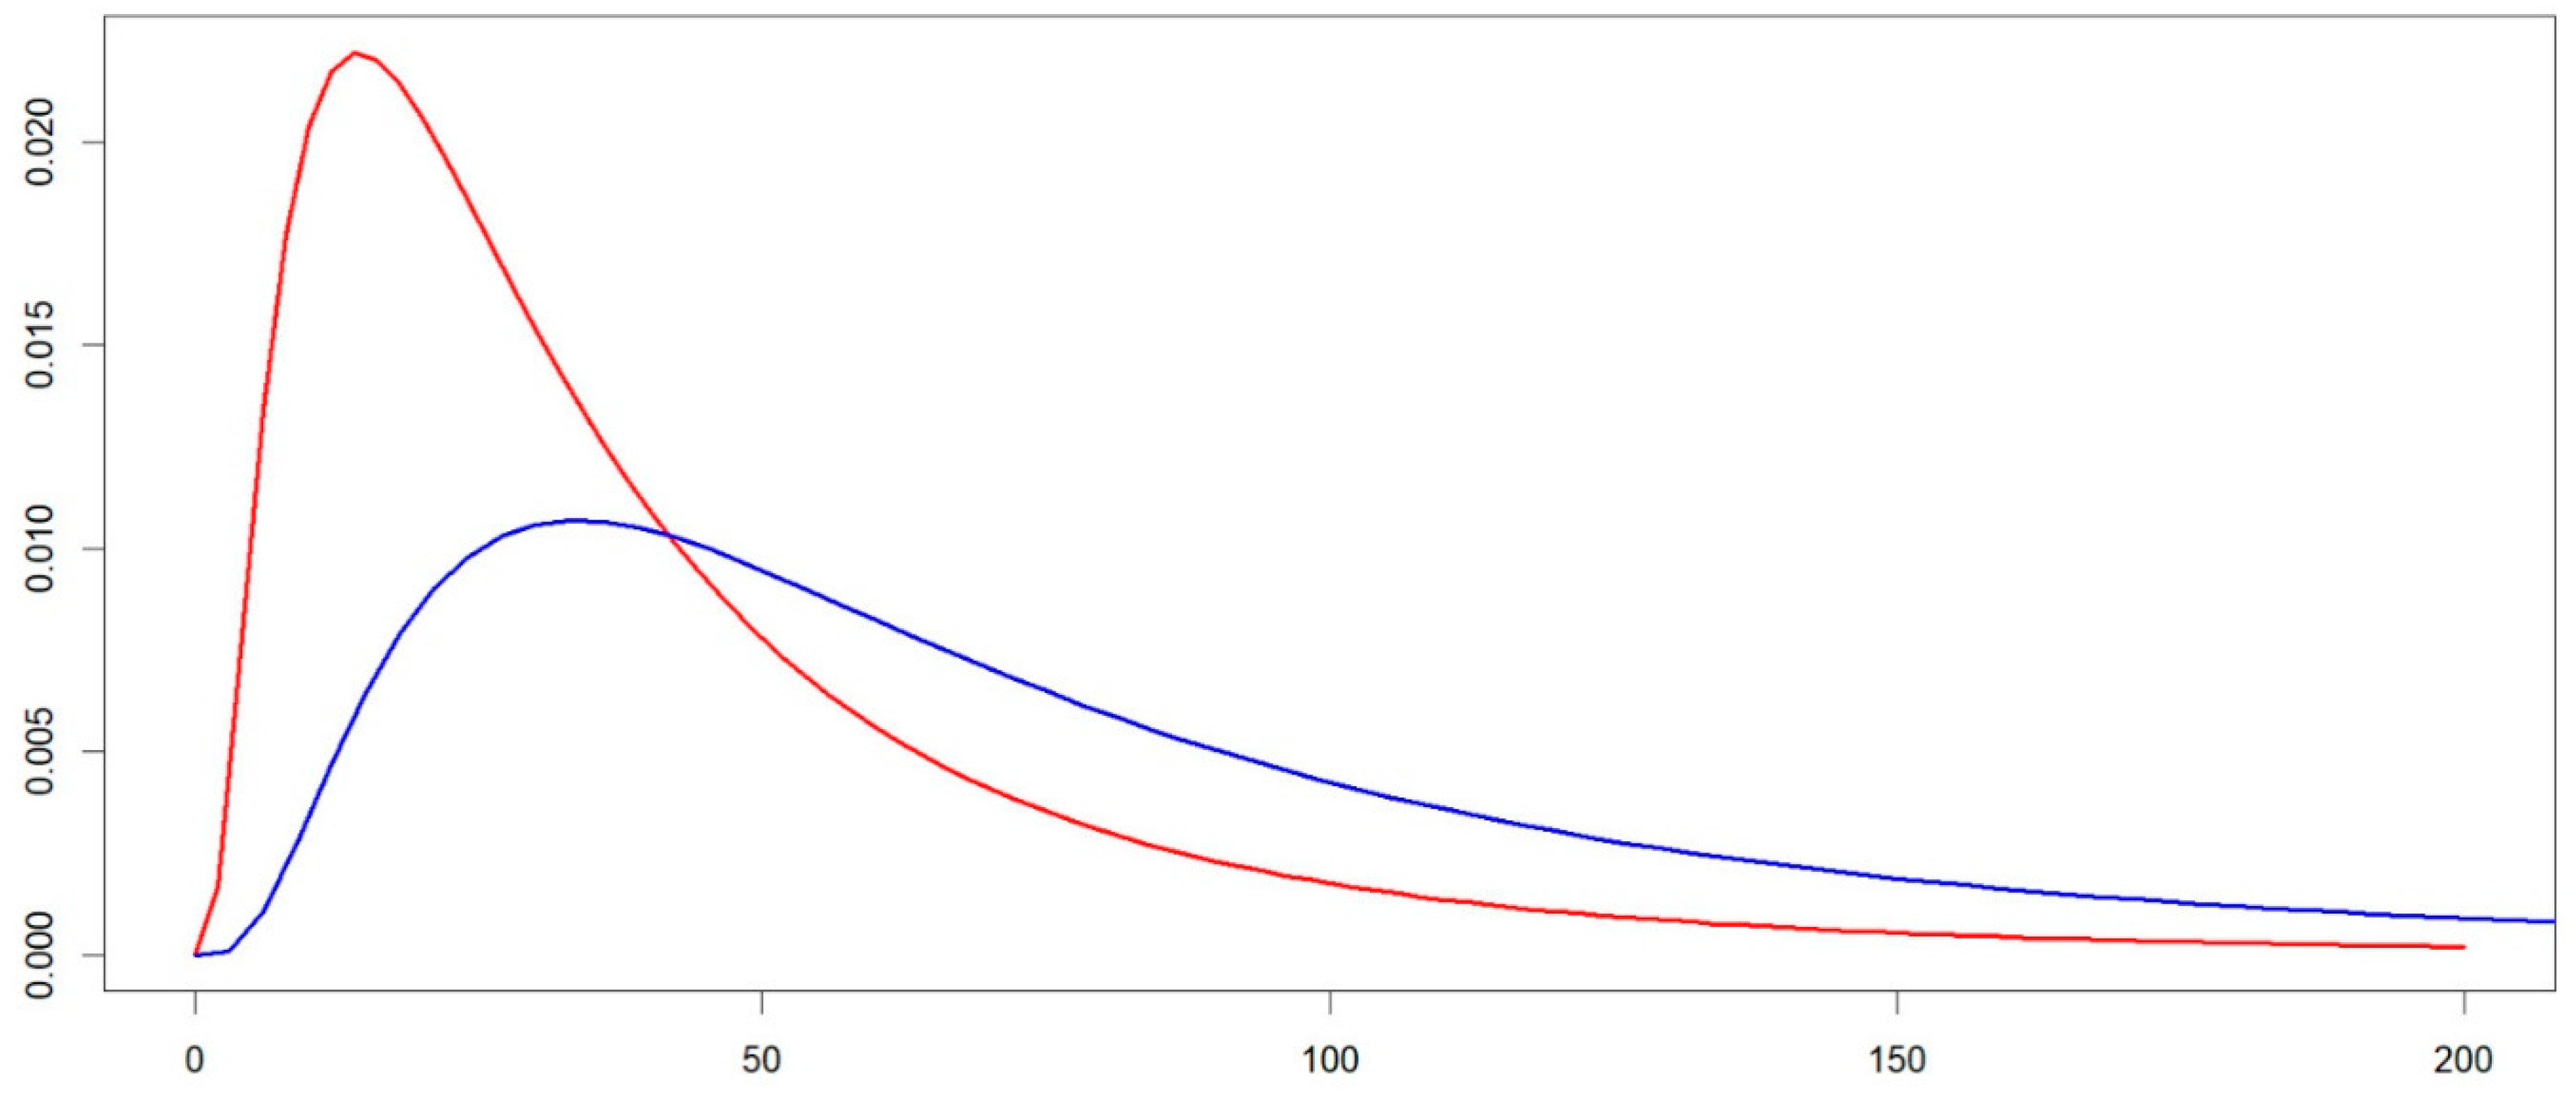
Figure 1. Estimated serum PFOA concentrations in males at the start of the Regional Health Surveillance Plan (log-normal modeling). PFOA, ng/mL. Red line: females; blue line: males.
Environments 12 00291 g001
Figure 2. Historical estimates of serum PFOA concentrations in females and males derived from backward calculation. Red lines = threshold for medical screening according to NASEM 2022; grey lines = estimates before 2003; black lines = estimates after 2003.
Environments 12 00291 g002
Table 1. Measures and estimates for serum PFOA concentrations in males and females at the start of the Regional Health Surveillance Plan in the Veneto hotspot (log-normal modeling).
Measures from the Regional Health Surveillance PlanEstimates from ln-Normal Approximation
MFMF
p59.03.817.17.3
p25--37.316.9
p5064.130.264.130.2
p75--110.254.1
p95240.3125.2240.4125.3
Table 2. Uncertainty analysis (also see Section 4).
CriterionExpected
Impact
Notes
PFOA half-life duration±An overall modest impact is expected based on the point estimates, as the local half-life estimate is very precise. However, the half-life derived in a population includes inter-individual variability
Choice of pharmacokinetic model±Steady-state serum concentrations are higher in multi-compartment models [14].
PFOA daily intake rate±Scenarios involving the use of private wells or local food consumption were excluded.
The average daily intake rate was used, which is higher than the median in right-skewed distributions, thus leading to a higher Css estimate.
Separate estimates for males and females are not available, and estimates for red subareas are very close.
Measures of PFOA serum levels in the Regional Health Surveillance Plan±Possible selection bias in participation.
Exclusion of the first and fourth quartiles reduced the dispersion observed in test results.
Timing of PFOA contamination arrival in drinking water wells±A delay factor of 1.9 (proposed by ARPAV) was applied. Had the arrival time been shorter, the resulting duration of human exposure would be increased.
Absolute PFOA amounts reaching the drinking water wells+Insufficient data available for environmental modelling. PFOA production increased until the early 2000s, then ceased in 2017.
If less pollutant reached the wells within a given time interval, the intake rate would be proportionally lower.
+ possible overestimation; ± possible under or overestimation.
Disclaimer/Publisher’s Note: The statements, opinions and data contained in all publications are solely those of the individual author(s) and contributor(s) and not of MDPI and/or the editor(s). MDPI and/or the editor(s) disclaim responsibility for any injury to people or property resulting from any ideas, methods, instructions or products referred to in the content.