Article

Classification of Agricultural Soils in Manica and Sussundenga (Mozambique)

by
Mário J. S. L. Pereira
1,2,
João M. M. Leitão
3 and
Joaquim Esteves da Silva
2,*
1
Departamento de Ciências Naturais e Matemática, Faculdade de Ciências e Tecnologias, Universidade Licungo, P.O. BOX 2025, Beira 2100, Mozambique
2
Chemistry Research Unit (CIQUP), Institute of Molecular Sciences (IMS), Department of Geosciences, Environment and Territorial Planning, Faculty of Sciences, University of Porto, Rua do Campo Alegre s/n, 4169-007 Porto, Portugal
3
Chemistry Research Unit (CIQUP), Institute of Molecular Sciences (IMS), Pólo das Ciências da Saúde Azinhaga de Santa Comba, Pharmacy Faculty, University of Coimbra, 3000-548 Coimbra, Portugal
*
Author to whom correspondence should be addressed.
Environments 2025, 12(8), 265; https://doi.org/10.3390/environments12080265 (registering DOI)
Submission received: 20 June 2025 / Revised: 23 July 2025 / Accepted: 29 July 2025 / Published: 31 July 2025

Abstract

Mozambique soils are known for having an unbalanced agronomic and environmental composition that results in poor agricultural production yields. However, agriculture is the main economic activity of Mozambique, and soils must be characterised for their elemental deficiencies and/or excesses. This paper sampled nine farms from the Manica and Sussundenga districts (Manica province) in three campaigns in 2021/2022, 2022/2023, and 2023/2024 (before and after the rainy seasons). They were subjected to a physical–chemical analysis to assess their quality from the fertility and environmental contamination point of view. Attending to the physical–chemical properties analysed, and for all the soils and sampling campaigns, a low concentration below the limit of detection for B of <0.2 mg/Kg for the majority of soils and a low concentration of Al < 0.025 mg/Kg for all the soils were obtained. Also, higher concentrations for the majority of soils for the Ca between 270 and 1634 mg/Kg, for the Mg between 41 and 601 mg/Kg, for the K between 17 and 406 mg/Kg, for the Mn between 13.6 and 522 mg/Kg, for the Fe between 66.3 and 243 mg/Kg, and for the P between <20 and 132 mg/Kg were estimated. In terms of texture and for the sand, a high percentage between 6.1 and 79% was found. In terms of metal concentrations and for all the soils of the Sussundenga district and sampling campaigns, a concentration above the reference value concentration for the Cr (76–1400 mg/Kg) and a concentration below the reference value concentration for the Pb (5–19 mg/Kg), Ba (13–120 mg/Kg) and for the Zn (10–61 mg/Kg) were evaluated. A multivariate data analysis methodology was used based on cluster and discriminant analysis. The analysis of twenty-three physical–chemical variables of the soils suggested four clusters of soils characterised by deficiencies and excess elements that must be corrected to improve the yield and quality of agricultural production. Moreover, the multivariate analysis of the metal composition of soil samples from the second and third campaigns, before and after the rainy season, suggested five clusters with a pristine composition and different metal pollutant compositions and concentrations. The information obtained in this study allows for the scientific comprehension of agricultural soil quality, which is crucial for designing agronomic and environmental corrective measures to improve food quality and quantity in the Manica and Sussundenga districts and ensure environmental, social, and economic sustainability.

1. Introduction

Soil quality assessment can be a critical socio-economic indicator of the wealth of farmers. Indeed, agricultural yields depend on soil fertility and, under low-input agriculture in developing countries, where crops are produced for household consumption and income, low soil quality results in poor farmers [1,2]. Understanding the relation between soil fertility and poverty is particularly important in countries where most of the population depends on agriculture, like Mozambique, where the currently used 9 million hectares of arable land are mainly managed by family farming [3,4]. However, in sub-Saharan Africa, the lack of economic and technical resources and a strategic programme to characterise and improve the soil health/fertility of the countries, which are known to be of poor quality, is an obstacle to the sustainable management of soil and consequently to the wealth of nations. Indeed, agricultural soils become poorer if no corrective measures are progressively taken. Moreover, soil degradation poses risks to the environment, economy, and society [5]. African soils are depleted of nutrients, with the corresponding even sharper decline in fertility, leading to very low crop yields [6]. Although the existing information about the soils in Mozambique is scarce, there is a consensus on the poverty of these soils [7,8,9,10,11].
The first step in sustainable soil quality management is its diagnosis and monitoring. According to the European proposal of the Soil Monitoring Law, soil health is a multidimensional parameter defined as “the physical, chemical and biological condition of the soil determining its capacity to function as a vital living system and to provide ecosystem services” [5]. Consequently, obtaining information about soil quality and fertility is mandatory to define a sustainable soil health management strategy. Other factors besides the intrinsic soil characteristics are critical for crop production management: infrastructure and related high transport costs, inadequate institutional support, and political instability [6].
Soil fertilisation is a mandatory routine to maintain or restore soil quality. However, in sub-Saharan African countries, the high cost of fertilisers is an obstacle to this [12]. Also, the depletion of other soil substances that influence crop yields, such as micronutrients and organic matter, is a reality which contributes to very low agricultural productivity and farmers’ poverty. Indeed, low fertiliser use is one of the factors contributing to the slow growth of agricultural productivity in Africa. Data from 2009 suggested that Africa accounts for less than 1% of global fertiliser consumption [13,14]. The only way to successfully resolve this problem is through subsidies. The experience of subsidising corn production in Malawi allowed production to triple, going from a deficit in 2005 to a surplus in 2007, which allowed food prices to fall and for corn to be exported to neighbouring countries [14].
The problem of poor soil health gives rise to another issue, in addition to low productivity, the existence of poor nutritional quality in the food produced [2,15,16,17]. The food produced in soils with a zinc deficit may be responsible for child stunting [15]. Also, negative correlations were observed between the available soil concentrations of copper and manganese with child morbidity and child wasting [2]. There is enough consensus about the direct link between the soil and people’s health [2,15,16,17].
Besides the agronomical soil quality, which will be responsible for the crop yields and nutritional quality, agricultural soils must follow environmental quality standards to protect human health from toxic substances. Heavy metals are of particular concern because they can have a natural (geological) origin or an anthropogenic contribution from mining activities [11,18,19,20,21]. Also, this type of pollutant tends to accumulate in the environment [22,23,24,25,26].
This paper will present and discuss the results of the hierarchical cluster and discriminant analysis of soils from nine farms in the Manica and Sussundenga districts (Manica province, Mozambique). The agronomical chemical characteristics and heavy metals will be evaluated. The twenty five agronomical chemical characteristics evaluated are extractable K, Mg, Ca; micronutrients Fe, Mn, Zn, Cu, and B; exchangeable Na, K, Ca, Mg, Al, and cation exchange capacity (CEC); fertility properties such as pH (KCl), pH (H2O), extractable P, soil organic carbon, organic matter; nitrogen Kjeldahl, nitrogen inorganic, conductivity, and texture as sand, clay, and silt percentage. The heavy metal set evaluated comprised Ba, Cr, Co, Cu, Pb, Ni, V, and Zn. The Zn and Cu were measured twice to assess them as available micronutrients for agronomical purposes and to evaluate them as the total amount of heavy metals for environmental assessment. The ecological quality of the soils will be discussed based on the cluster and discriminant analysis. The agronomical and ecological evaluation of the soils under investigation will be conducted.
This paper will classify soils from nine farms in the Manica and Sussundenga districts of the Manica province in Mozambique (Figure 1) based on agronomical and environmental parameters. A preliminary analysis of the soils from this province has already been conducted [11] and, in this work, more farms and more sampling campaigns were included to obtain a more representative classification of the soils from the neighbouring districts of Manica and Sussundenga. The agronomical and environmental assessment of the area under investigation will be performed. The results obtained in this study will allow the definition of a rational strategic plan to reverse the degradation trend of agricultural soils, improving the health of soils and populations, and reversing the trend of impoverishment.

2. Materials and Methods
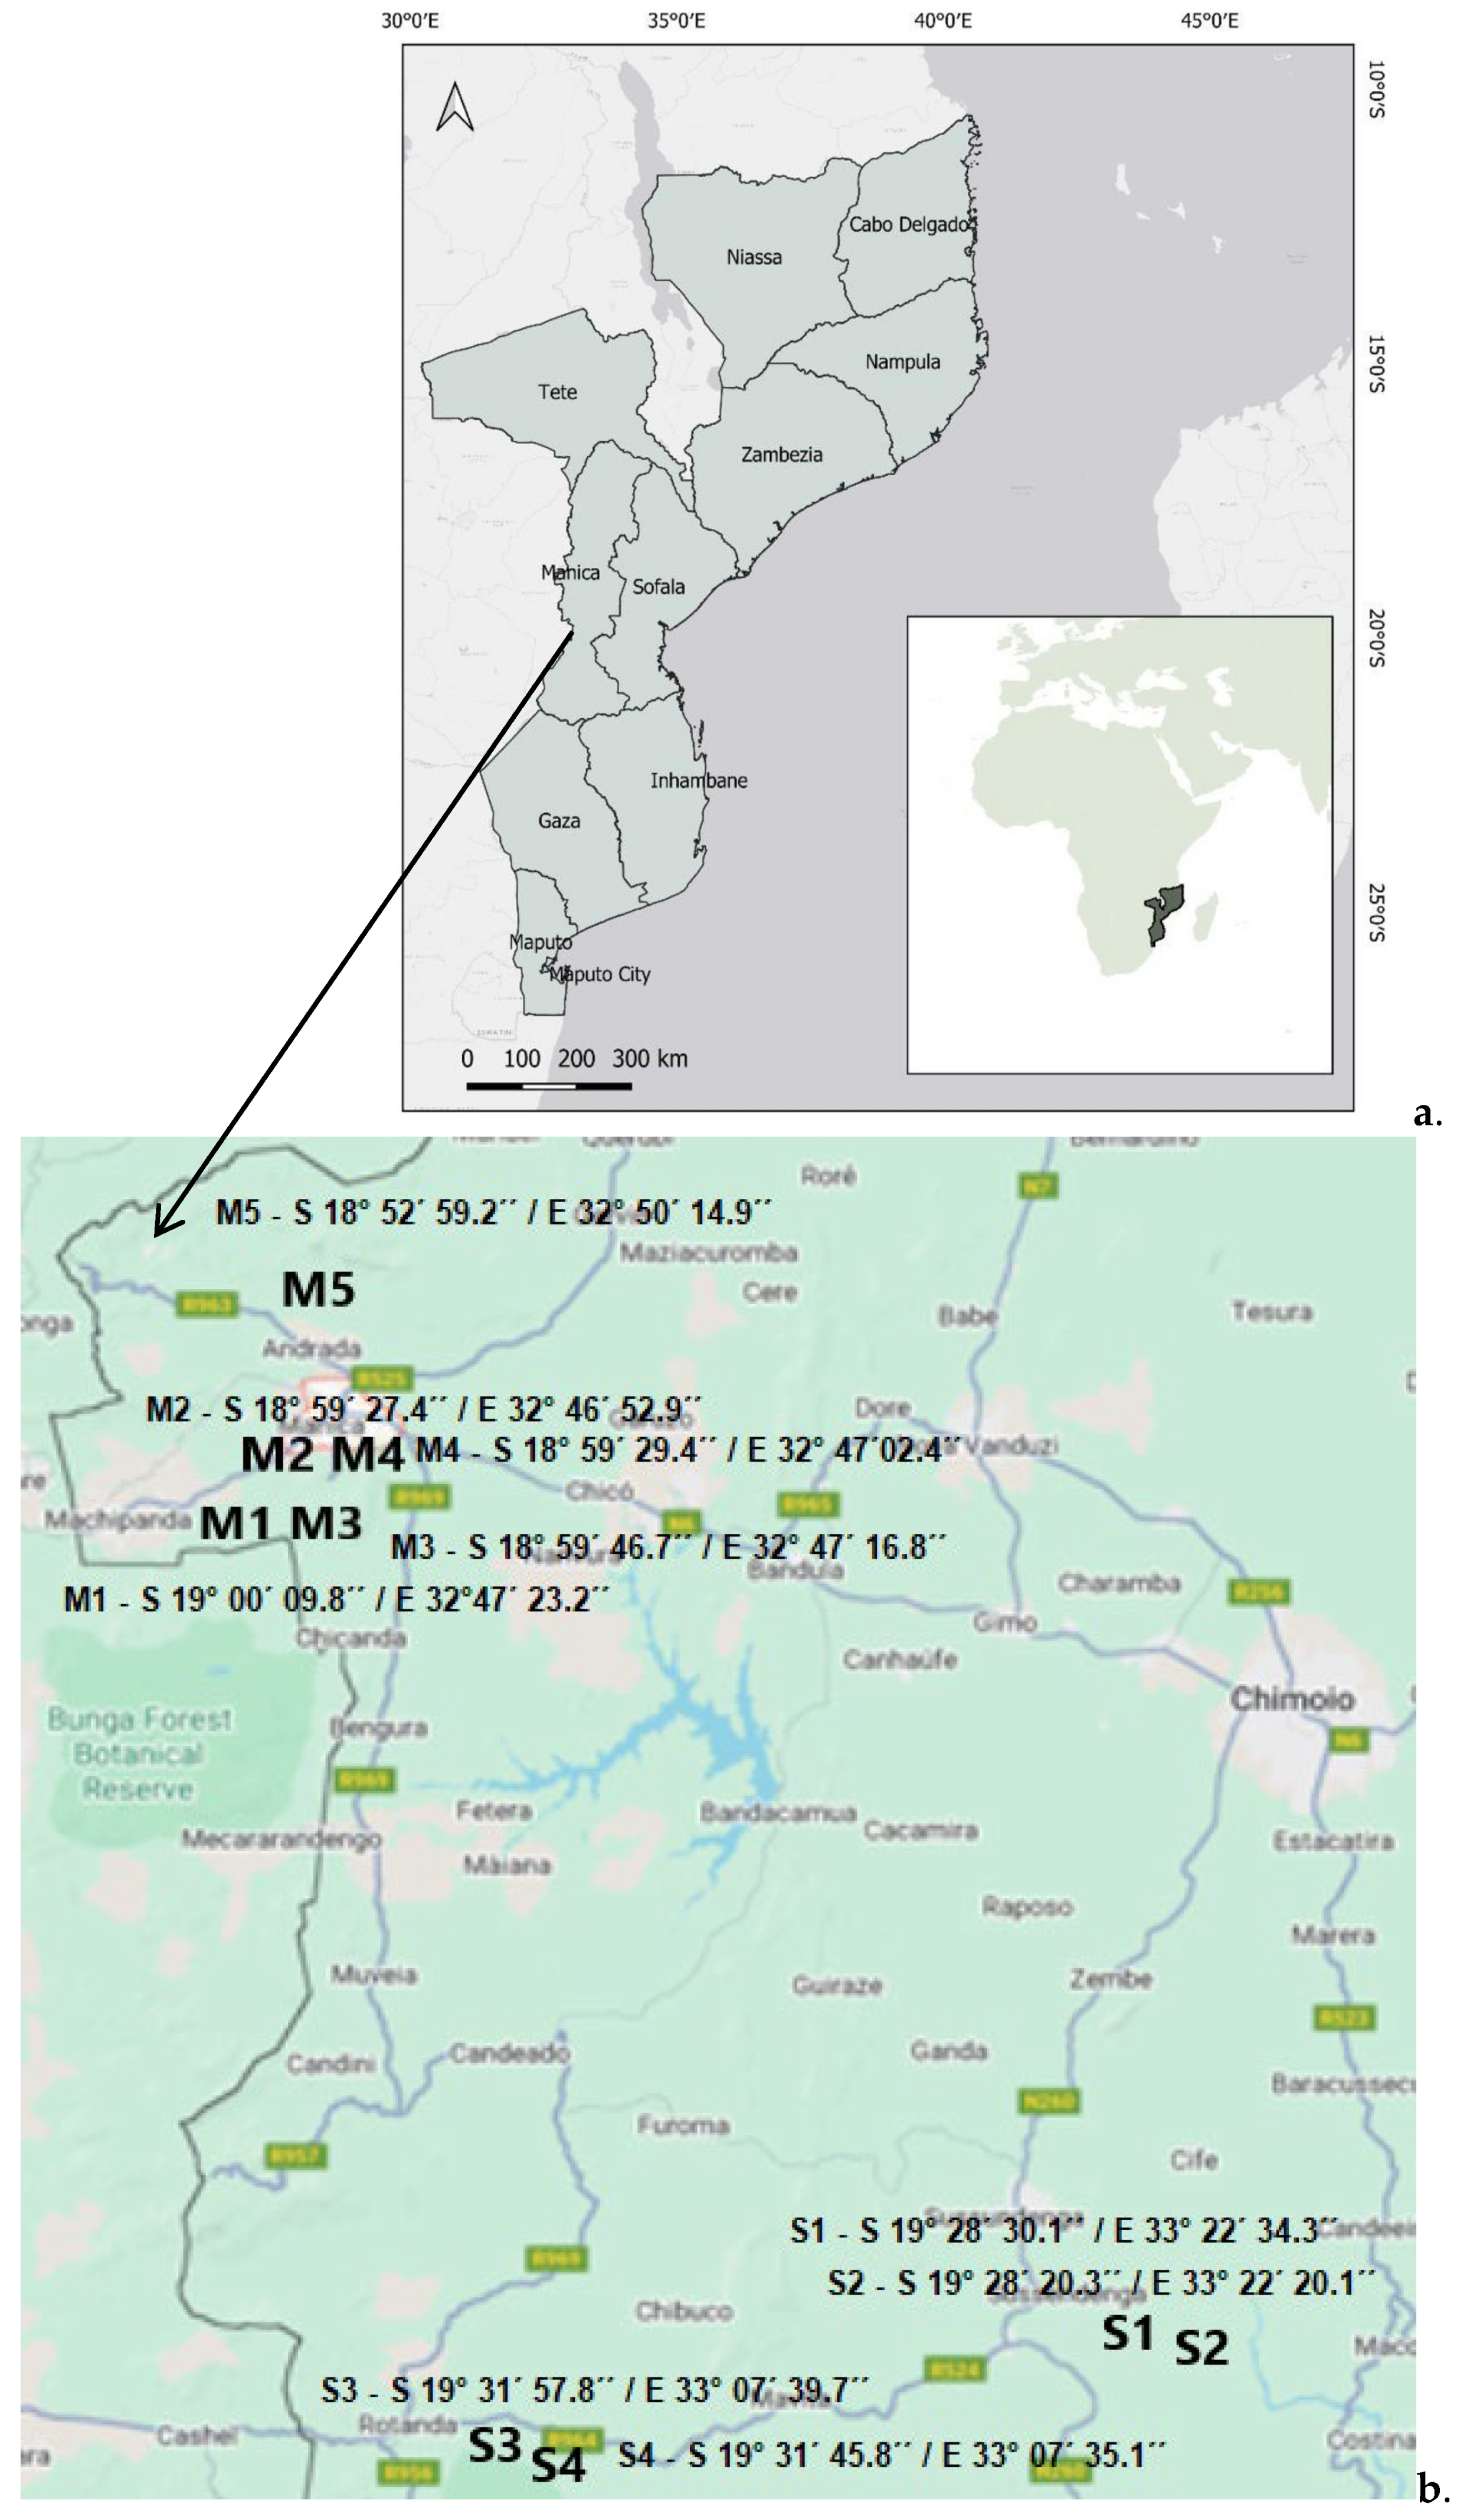
2.1. Study Area

The study area focuses on two districts in the Manica province (centre of Mozambique, adjacent to the frontier with Zimbabwe), namely the Manica and Sussundenga districts (Figure 1). The five Manica district soils (Fields M1 to M5) and the four Sussundenga district soils (Fields S1 to S4), chosen for this study, are characterised by their different areas and agricultural production. The areas of the nine farms and their agrarian productions are as follows: M1—7 ha, corn, green beans, banana, lettuce, cucumber, strawberries, and okra; M2—2 ha, corn, tomatoes, and beans; M3—1 ha, corn, beans, and tomatoes; M4—1 ha, corn, beans, and tomatoes; M5—20 ha, bananas and lychee; S1—1.5 ha, corn and sesame; S2—1 ha, corn and beans; S3—1 ha, corn and beans; and S4—1 ha, corn and soy. Some farms under investigation have already been preliminarily characterised [11].

2.2. Soil Sampling

Samples of five soils (M1, M2; S1, S2, S3) were collected in three campaigns (2021/2022, Y1; 2022/2023, Y2; 2023/2024, Y3). Each of these samples were obtained before and after the rainy season in the following periods (Table S1): the 2021/2022 campaign—September and October 2021 (before the rainy season) and April 2022 (after the rainy season; the 2022/2023 campaign—September 2022 (before the rainy season) and April 2023 (after the rainy season); and the 2023/2024 campaign—September 2023 (before the rainy season) and April 2024 (after the rainy season). Still, in the present study, and during the last campaign of 2023/2024, three more soils from the farms of the Manica (M3–M5) and one soil from a farm of the Sussundenga (S4) districts were sampled before and after the rainy season and added to the already-five study samples. The collected samples are mixed and analysed before and after the rainy season to evaluate the chemical–physical properties. For the metal concentration evaluation, for all the evaluated soils and the third campaign, the analysis was performed separately for the collected samples before (Y3a) and after (Y3b) the rainy season. The samples were collected as previously described [11]. Table S1 presents the date of the samplings and the coordinates of all the sub-samples.

2.3. Preparation and Analysis of the Soils
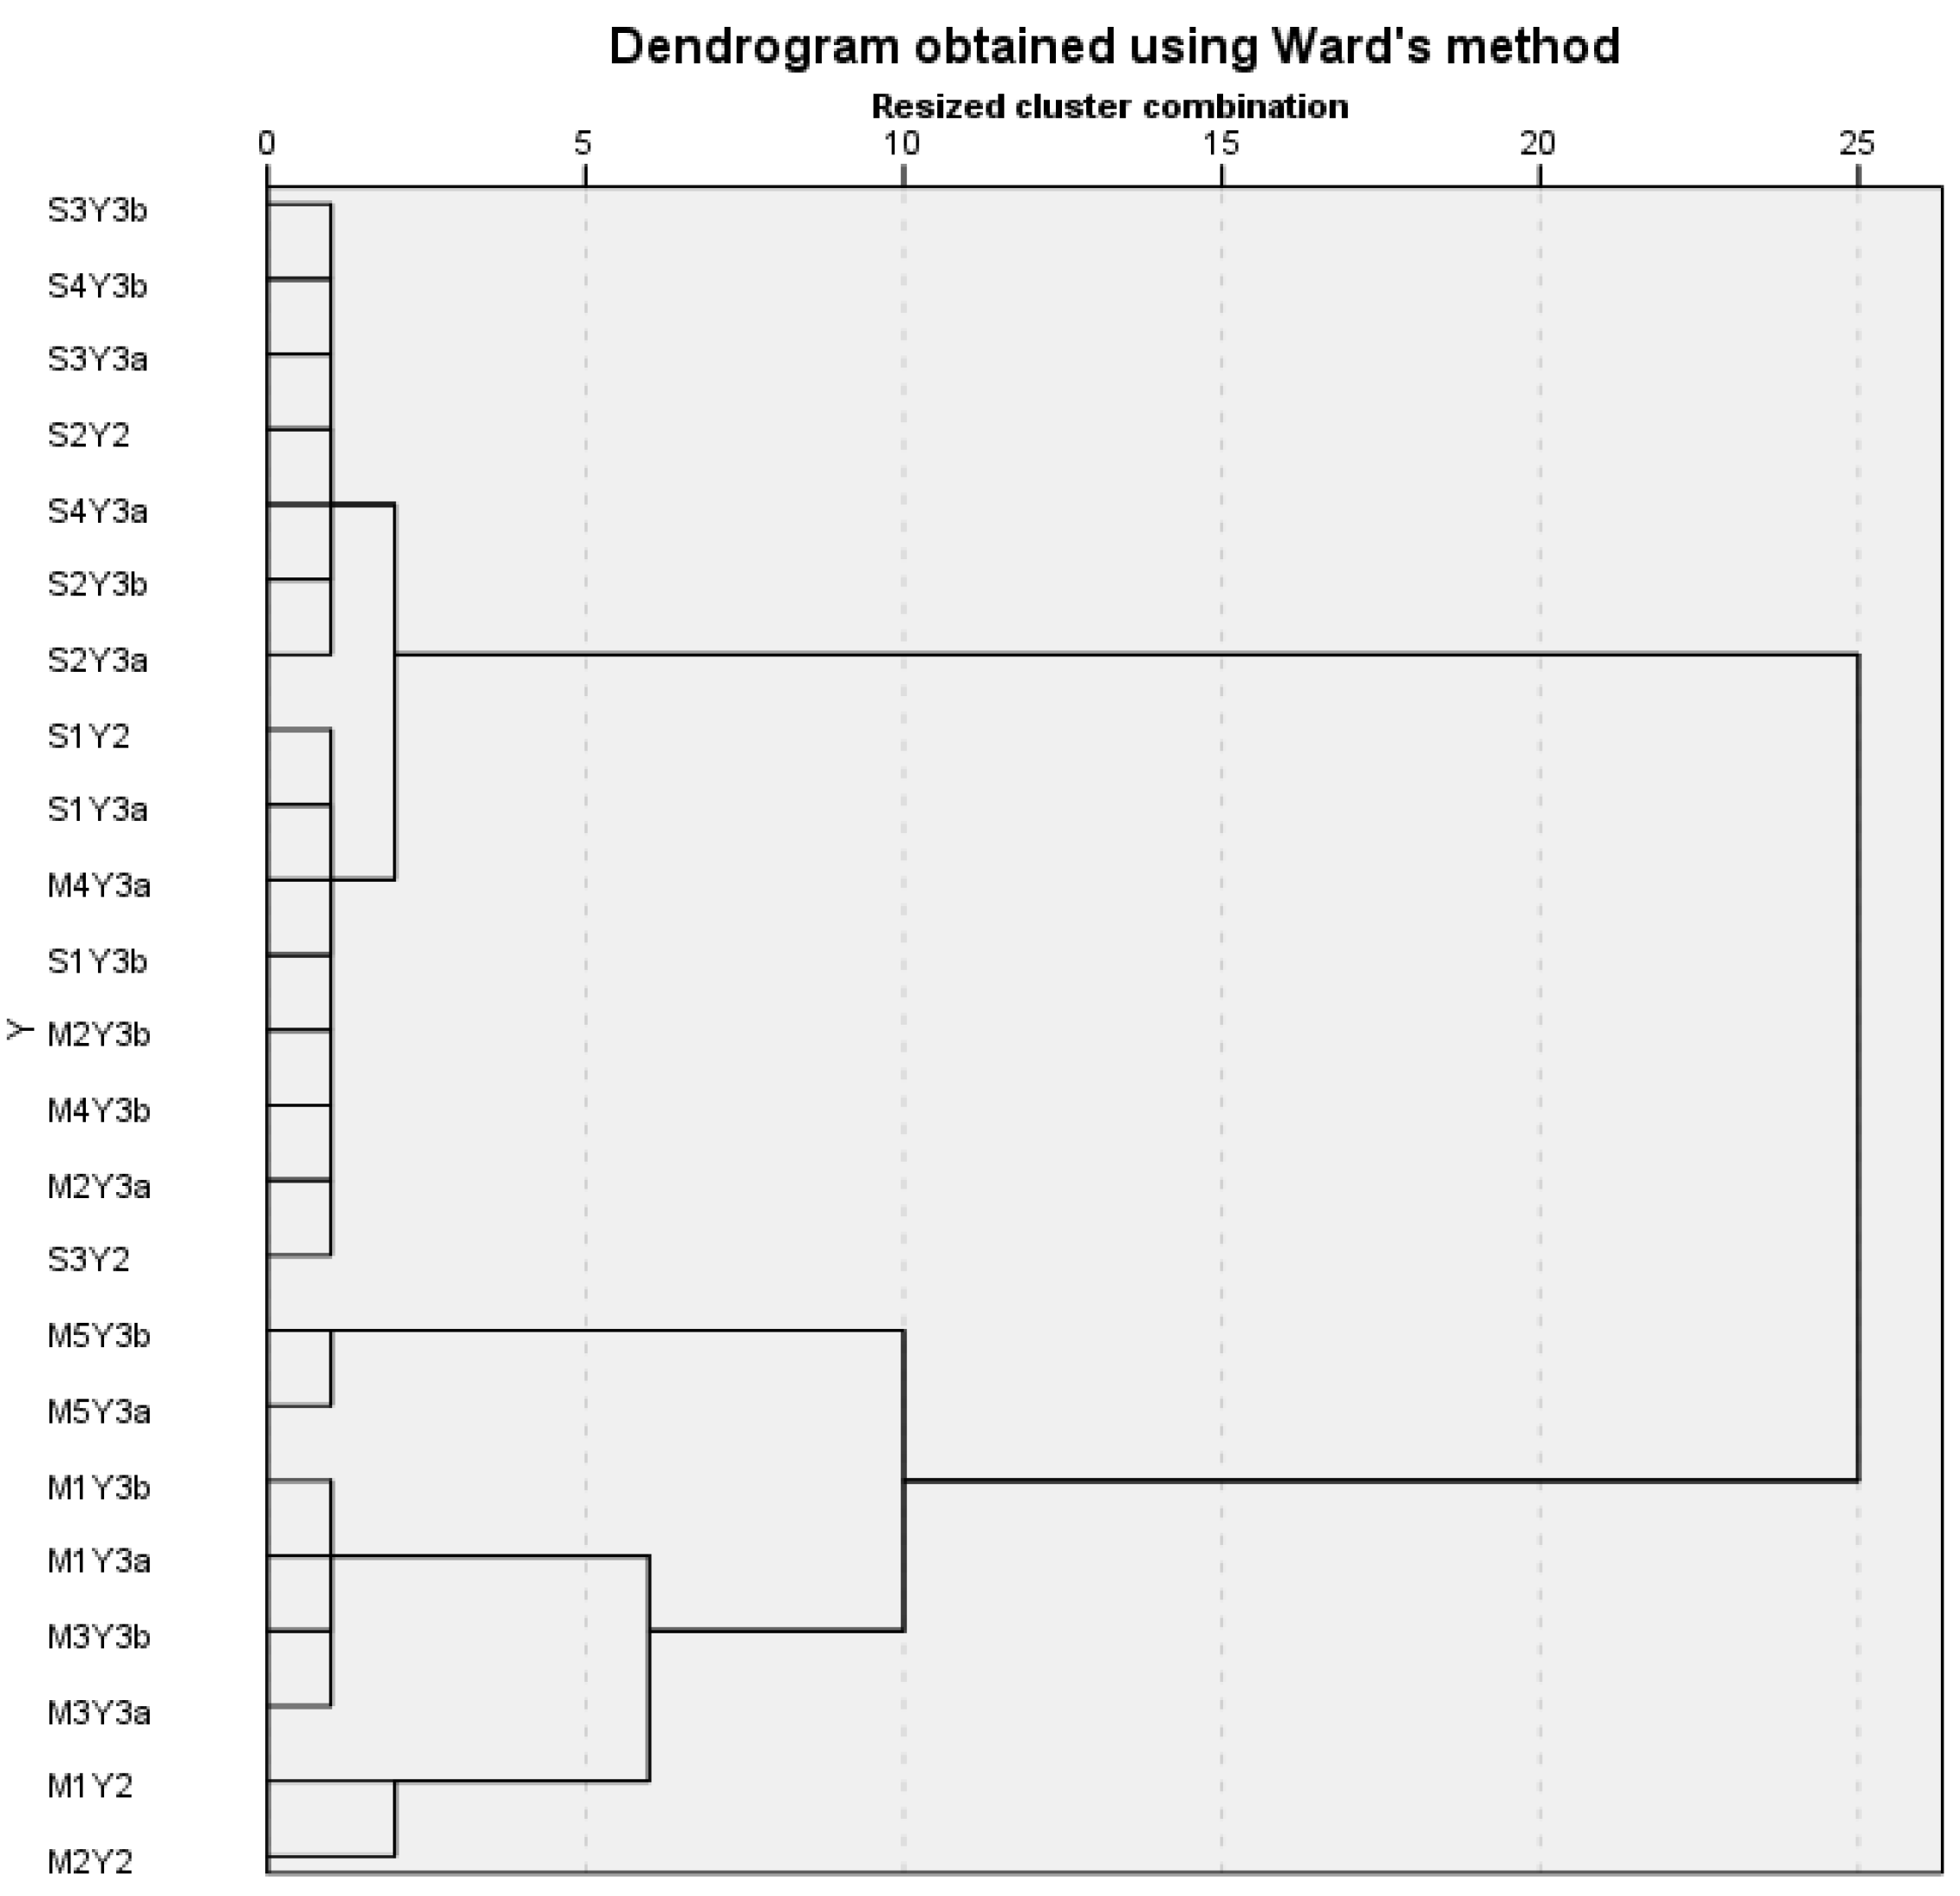
The soil preparation and agronomical chemical analysis were performed as previously described [11]. The metals were analysed within the TerrAttesT package by inductively coupled plasma mass spectrometry (ICP-MS) at Eurofins Analytico B.V., according to the NEN-EN-ISO 17294-2 reference method.

2.4. Data Analysis

The multivariate analysis of the data obtained 23 agronomical chemical characteristics and eight heavy metals and was implemented separately with SPSS® version 28.0.1.0 statistical package from IBM® company (Armonk, NY, USA). An unsupervised hierarchical cluster analysis (HCA) and a discriminant analysis (DA) were performed to explore and understand the clustering and dimensionality of the data. For the HCA, we used the non-standardised or Z-score-standardised by variable between-groups linkage and Ward’s methods. The distance or similarity measure used in clustering was the squared Euclidean distance. With this analysis, it is possible to verify the characteristics of each cluster, understand the data structure, and identify distinct clusters [27]. The DA was used stepwise with Wilk’s lambda method. The discriminant analysis was based on the previous results found by cluster analysis. The DA is complementary to HCA, allowing for the verification of linear relations between the data variables and the identification of which variables contribute more to the separation of the clusters [28].

3. Results and Discussion

3.1. Agronomical Property Classification

Table S2 shows the results of the physical–chemical analysis of the five soils sampled in the three campaigns (2021/2022, 2022/2023, and 2023/2024) plus four more soils sampled in the last campaign (2023/2024), and Figure S1 shows some trends found in these soils. The analysis of this table, and as previously discussed [11], shows that all the soils are extremely to strongly acidic (pH ranging from 4.5 to 5.6. with an average of 5.0 ± 0.3), have no salinity problems (conductivity ranging from 4.2 to 11.8 mS/m), have negative charge, are cation exchangers, and are characterised by a low amount of soil organic matter (SOM) ranging from 0.67% to 1.83% with an average 1.3 ± 0.3%. Generally, the soils of the Manica district have higher concentrations of macronutrients (Na, Ca, and Mg) and micronutrients (Mn and Fe). Attending to the texture properties evaluated, it is possible to say that for the Manica district, the soils M1 and M3 are clay loam soils, the soils M2 and M4 are sandy loam soils, and the soil M5 is a slit clay soil. It is important to stress that soils M1, M3, M2, and M4 are geographically near the Manica district. The M5 soil is isolated from the other four. The Sussundenga S1 and S4 soils are sandy loam soils, and S2 and S3 are loamy sand soils. For the soils of the Sussundenga district, both soils S1 and S2 and S3 and S4 are geographically near each other. The Sussundenga district S1 and S2 soils are geographically distant from the soils S3 and S4. It is also possible to see that for all the soils of the Sussundenga district, the percentage of sand is higher, and that for these soils, the percentage of sand is much higher than the percentage of clay and silt. Indeed, except for the soils M1Y2, M1Y3, M3Y3, and M5Y3, the percentage of sand is higher than that of clay and silt.
Also, these soils have non-measurable concentrations of the micronutrient boron and exchangeable aluminium. For this reason, these two variables will not be considered in the analysis, and the other 23 variables will be used for the multivariate classification. Boron is an essential plant nutrient and, since the beginning of the 20th century, it has been found that its application has increased crop production yields [29]. Besides the quantity, boron deficiency may affect the quality of products [29]. The boron deficiency in the soil from Manica and Sussundenga can be dealt with by choosing more boron-tolerant crops or varieties or using boron fertiliser [29].
The multivariate hierarchical cluster analysis of the agronomical properties of the soil data in Table S2 resulted in the dendrogram shown in Figure 2—dendrograms obtained using other clustering strategies have a similar result. Four clusters of soils are observed (clusters A1, A2, A3, and A4), whose compositions are described in Table 1. Also, cluster number two may be divided into two sub-clusters (sub-clusters A2A and A2B).
The analysis of the composition of the observed clusters (Table 1) shows that the origin of the soils, Manica or Sussundenga, is the main factor that determines the classification, suggesting that the soils of the two districts are agronomically different.
Table 2 shows the average values and corresponding errors for the measured variables in the four detected clusters. The analysis of this table shows increasing concentration values for those that are most discriminating as the number of the cluster increases. Also, comparing the concentration values in Table 2 and the plots of the samples into the discrimination functions (Figure S3) shows that clusters A1 and A2 are more similar than the other two. This indicates that the soils from Sussundenga (cluster A1 and A2) are more comparable, and the soils from Manica are more dissimilar among themselves (cluster A3 and A4) and from the soils from Sussundenga.
The clusters described in Table 1 and Table 2 result from the different properties of the nine soils under analysis. Indeed, the following agronomical properties are characteristic of the clusters:
Cluster A1: This cluster is constituted by impoverished soils from the Sussundenga district that are characterised by a loamy sand texture, with deficiencies in calcium, magnesium, boron, manganese, copper, phosphorus, potassium, and zinc.
Cluster A2A: This sub-cluster is constituted by soils from the Manica district that have a sandy loam texture, with deficiencies in calcium and boron, and an excess of manganese and iron.
Cluster A2B: This sub-cluster is constituted by soils from the Sussundenga district that are characterised by a sandy loam and sandy loam textures, with deficiencies in phosphorus, calcium, boron, and zinc, and an excess of manganese, potassium, and iron.
Cluster A3: This cluster is constituted by Manica soils from the first year (2021/2022) with a sandy clay loam texture, a boron deficiency, and an excess of potassium, magnesium, calcium, manganese, and iron.
Cluster A4: This cluster is constituted by Manica soils with clay loam and silty clay textures, a deficiency of phosphorus and boron, and an excess of potassium, magnesium, calcium, and manganese.
A Linear Discriminant Analysis (LDA) was performed to analyse the discriminatory capacity variables among the detected clusters, and the Wilks Lambda and Fisher’s F statistical parameters were obtained (Table S3). The analysis of Table S3 shows that the main discriminatory variables (the lower Wilks Lambda and higher F parameters) are the extractable and exchangeable calcium and magnesium (which correlate with the CEC), the extractable manganese and the clay texture percentage. These elements are almost always present in the particular characteristics of the clusters. The analysis of the linear discriminant plot in Figure S3 shows that the clusters are indeed dissimilar with different specific properties. It is possible to see that cluster H3 is isolated from the other clusters, which are more dissimilar, and clusters H1, H2, and H4 are relatively more similar.
All the clusters correspond to agronomically unbalanced soils and require correction to improve production yields and quality. Deficiencies in macronutrients are detected, for example, in calcium in the soils of clusters A1 and A2; phosphorus in clusters A1, A2B, and soil M3Y3 of cluster A4; and potassium in the soils of cluster A1. Also, several deficiencies in trace minerals are detected, which may contribute even further to lower crop yields, such as the defects of zinc in the soils of clusters A1, A2B, and A4, and the deficiencies of manganese and copper in soils from cluster A1. Besides the impact on agricultural productivity, these micronutrient soil deficiencies may be reflected in the low nutritional values of the food produced in these fields, impacting the local populations’ human health [30]. Contrary to the soils of clusters A1 and A2, in the soils of clusters A3 and A4, the generally higher values of the macronutrient’s potassium, calcium, and magnesium show that the soil M1, the soil M2 sampling in the first year, and the soils M3 and M5 sampling in the third campaign are the more fertile soils. Besides this, the soils of cluster A3 have a higher concentration of phosphorus, and the soils of cluster A4 have a higher concentration of nitrogen.
The pH and amount of organic matter of all the soils may substantially impact the macronutrient and micronutrient composition of the soils of Manica and Sussundenga. Indeed, the acidity of the soils and low organic matter contribute to the speciation of the chemical element distribution, and should be corrected by liming and organic correction to improve the basic soil properties to support subsequent fertilisation.

3.2. Metal Pollutant Soil Classification

Table S4 shows the total concentrations of the metals Ba, Cr, Co, Cu, Pb, Ni, V, and Zn found in the five mixed soils sampled before and after the rainy season in the 2022/2023 campaign, and in the eighteen soils sampled in the 2023/2024 campaign on nine farms before and after the rainy season. Also, in Figure S2, some trends regarding the metal concentrations in all the soils are shown. The following elements were not detected: As, Sb, Be, Cd, Hg, Mo, Se, and Sn. Generally, the soils of the Manica district are where the higher concentrations of the metal analysed were evaluated, namely the M1, M3, and M5 soils. The heavy metal was found in the M5 soils before and after the rainy season above the reference value at a 16 and 18 mg/Kg concentrations. For all the soils of the Sussundenga district, the concentration of the different metals analysed is below the indicated reference values. Generally, for the soils of the Manica district, and depending on the soils, the different metal concentrations could be above or below the reference concentration. Only for all the soils of the Manica district are the concentrations of Ba, Pb, and Zn below the reference value, and the concentration of Cr is above the reference value. For the other four metals in the soils of the Manica district, the metal concentration is above the reference value concentration for Co in the M1, M3, and M5 soils; for Cu in the M5 soil; for Ni in the M1, M2, M3, and M5 soils; and for V in the M3 and M5 soils. Generally, the higher concentrations of the metals analysed are found for the M5 soil of the Manica district before and after the rainy season. Indeed, higher concentrations of Ba, Cu, Pb, V, and Zn metals are found in this soil and all the soils of the Manica and Sussundenga districts.
The multivariate hierarchical cluster analysis of the metal composition of the soils data in Table S4 resulted in the dendrogram shown in Figure 3—dendrograms obtained using other clustering strategies have a similar result. Five clusters of soils are observed (clusters H1, H2, H3, H4, and H5), whose compositions are described in Table 3. The reference values for agricultural soils accordingly to the Portuguese Environmental Agency [31] are included in Table S4.
The analysis of the composition of the observed clusters (Table 3) shows that no difference in similarity is observed for all the soil samples before and after the rainy season because both samples fall in the same cluster. All the soils of the Manica and Sussundenga districts are found in neighbouring clusters. The soils of the Sussundenga district are in the clusters H1 and H2, and most of the Manica district soils are in the H3, H4, and H5 soils. The exceptions are for the Manica district, which has soils M2 and M4, before and after the rainy season, in cluster H2.
Cluster H1—This cluster corresponds to pristine soils with no metal concentration above the reference value and is only constituted by soils from the Sussundenga district.
Cluster H2—This cluster is characterised by a relatively high average concentration of chromium and a high standard deviation (102 ± 95 mg/kg). This high error results from the relatively high concentration of chromium in the Manica soils M2 and M4 and the relatively low concentration of chromium in the Sussundenga soils S1 and S3Y2. Nevertheless, these Manica soils show the lowest chromium concentration of all the Manica soils under study and the other metal concentrations are below the reference values. This cluster H2 contains soils with higher concentrations of metals than cluster H1, but are below the reference values, except for chromium from the Manica soils.
Cluster H3—This cluster, constituted by soils from the M5 farm, is characterised by relatively high concentrations, above the reference values, for the metals chromium, cobalt, copper, nickel, and vanadium.
Cluster H4—This cluster, constituted by soils from the third campaign of the M1 and M3 farms, is characterised by relatively high concentrations, above the reference values, for the metals chromium, cobalt, nickel, and vanadium.
Cluster H5—This cluster, constituted by soils from the second campaign of the M1 and M2 farms, is characterised by relatively high concentrations, above the reference values, for the metals chromium, cobalt, and nickel. However, the errors in the concentrations of Cr, Co, and Ni of this cluster are very high, which results from the relatively lower concentration of metals in the soil of the M2 farm.
This analysis shows that the soils from the Manica district have environmental quality issues that should be studied in more detail, particularly the bioavailability/bioaccumulation of these toxic metals in the food produced from those farms. Indeed, relatively high levels of chromium, cobalt, copper, nickel, and vanadium, or parts of these, can be detected in the soils of Manica. In the opposite situation, the soils from the Sussundenga district are pristine.
The H3 cluster that corresponds to the soil of the Manica farm M5 constitutes an outlier that results from a geological anomaly. Indeed, this farm is expected to be abandoned, and a mining operation will be installed in the area.
The average concentrations of the metals in the clusters are shown in Table 4, resulting from the different levels of metallic pollutants. The analysis of this table shows that for some clusters, the concentration of some metals is higher than the recommended levels for agricultural soils (bold values). The composition of the five clusters is as follows:
The discriminating capacity of the metal concentration was analysed. As presented in Table S5, all the metals have a statistically discriminating capacity. However, copper and vanadium have the highest discriminating potential (lower Wilks Lambda and F tests) (Table S5). Also, the linear discriminant plot analysis in Figure S4 shows that the clusters are dissimilar with different specific properties considering their heavy metal composition. The clusters H3 and H5 are more dissimilar, and H1, H2, and H4 are relatively more similar.
The relatively high concentration of heavy metals in the soil of the Manica district, namely the elements Cr, Co, V, and Ni, is of geogenic origin [11,32,33,34,35,36,37]. Anthropogenic soil pollution of Cu, Pb, and Zn was not detected.

4. Conclusions

Agricultural soils must be continuously monitored to allow their agro-environmental management and to increase the quantity and quality of food production. In developing countries, this is particularly important because food production can increase due to the increase in arable land, which results from uncontrolled or illegal deforestation, and not due to an increase in crop yields.
The soils from the Manica and Sussundenga districts in Mozambique constitute a typical case study of sub-Saharan African soils, where the production yields are low, resulting from very unhealthy soils with a dramatic macronutrient and micronutrient shortage. This work allowed us to define clusters of similar quality soils and to identify their specific deficiencies and problems concerning the chemical and physical properties of the soils and the metals found in the soils.
A general evaluation of the physical–chemical properties analysis of all the soils allows us to see that the micronutrient boron and, except for the Manica district soil M5 in the third campaign, exchangeable aluminium are absent (below the limit of detection of the analytical method). A greater acidity of the soils and a low organic matter were found. Even so, and considering the difference in the concentrations of some macronutrients and micronutrients of the Manica and Sussundenga districts, it is possible to conclude that the soils of the Manica district are more fertile than the soils of the Sussundenga district. Indeed, we observed a greater concentration of some macronutrients, such as potassium, magnesium, calcium, and phosphorus and, except for boron, a greater concentration of all of the micronutrients included in this study.
The more fertile soils are the soils of clusters A3 and A4 of the Manica district. Clusters A1 and A2, which group the soils of the Sussundenga district, only contain soils from the Manica district, one soil of the second campaign (M2), and two soils of the third campaign (M2 and M4) in cluster A2. Considering the characteristics of all the soils, the soils of the Manica district in clusters A3, M1, and M2 of the first campaign are the most dissimilar.
Some heavy metals, namely chromium for all the Manica district soils, are found in higher concentrations above the reference value. Also, only for the soils of the Manica district, for some soils and some campaigns, some metals such as cobalt, copper, nickel, and vanadium are above the reference value concentration. A clear distinction between the soil of the Manica (clusters H3, H4, and H5) and the Sussundenga districts (clusters H1 and H2) is found. The exceptions are the soils of the Manica district M2 and M4 for the third campaign, before and after the rainy season. For all the soils, and considering the metal concentration, are the soils of the Manica district included in clusters H3 and H5, which are the most dissimilar soils? This information can guide future corrective measures under a strategic plan to restore and improve the fertility of the local soils. However, technical support must be granted for the soil restoration of the pH, organic matter, and the sustainable utilisation of fertilisers. National and regional governments should lead this process mainly because, besides soil health care, other critical fundamental problems must be solved, like infrastructure for product transportation.
Enough information supports the idea that populations will thrive if agricultural production is of good quality and quantity. Once the diagnosis is made, as demonstrated in this paper, it is possible to define priorities so that populations will work to eliminate the poverty traps where they are embedded, and ensure environmental, social, and economic sustainability.

Supplementary Materials

The following supporting information can be downloaded at: https://www.mdpi.com/article/10.3390/environments12080265/s1, Figure S1: Linear trend of physical-chemical properties in soils: 1 - M1Y1; 2 - M1Y2; 3 - M1Y3; 4 - M2Y1; 5 - M2Y2; 6 - M2Y3; 7 - M3Y3; 8 - M4Y3; 9 - M5Y3; 10 - S1Y1; 11 - S1Y2; 12 - S1Y3; 13 - S2Y1; 14 - S2Y2; 15 - S2Y3; 16 - S3Y1; 17 - S3Y2; 18 - S3Y3; 19 - S4Y3; Figure S2: Linear trend of metal concentrations in soils: 1 - M1Y2; 2 - M1Y3a; 3 - M1Y3b; 4 - M2Y2; 5 - M2Y3a; 6 - M2Y3b; 7 - M3Y3a; 8 - M3Y3b; 9 - M4Y3a; 10 - M4Y3b; 11 - M5Y3a; 12 - M5Y3b; 13 - S1Y2; 14 - S1Y3a; 15 - S1Y3b; 16 - S2Y2; 17 - S2Y3a; 18 - S2Y3b; 19 - S3Y2; 20 - S3Y3a; 21 - S3Y3b; 22 - S4Y3a; 23 - S4Y3b; Figure S3: Discriminant plot.; Figure S4: Discriminant plot; Table S1: GPS coordinates and date of the soil sampling; Table S2: Characteristics of the soil samples in campaigns 2021/2022 (first row – Y1). 2022/2023 (second row – Y2) and 2023/2024 (third row – Y3); Table S3: Statistical tests about the discriminating capacity of the agronomical variables; Table S4: Metal concentration (in mg/kg) in the Manica soils in the 2022/2023 (Y2) and 2023/2024 (Y3) seasons before (Y3b) and after the rainy season (Y3a); Table S5: Statistical tests about the discriminating capacity of the metals concentartion variables. The reference [38] was cited in the Supplementary Materials.

Author Contributions

Conceptualisation, M.J.S.L.P., J.M.M.L. and J.E.d.S.; writing—original draft preparation, M.J.S.L.P., J.M.M.L. and J.E.d.S.; writing—review and editing, M.J.S.L.P., J.M.M.L. and J.E.d.S.; supervision, J.E.d.S.; funding acquisition, J.E.d.S. All authors have read and agreed to the published version of the manuscript.

Funding

We acknowledge FCT for funding the R&D Unit CIQUP (UIDB/000081/2020) and the Associated Laboratory IMS (LA/P/0056/2020).

Data Availability Statement

The data presented in this study are available on request from the corresponding author.

Conflicts of Interest

The authors declare no conflicts of interest.

References

  1. Barrett, C.; Bevis, L. The self-reinforcing feedback between low soil fertility and chronic poverty. Nat. Geosci. 2015, 8, 907–912. [Google Scholar] [CrossRef]
  2. Kim, K.; Bevis, L. Soil Fertility and Poverty in Developing Countries. Choices 2019, 34, 1–8. [Google Scholar]
  3. Government of Mozambique. Voluntary National Review of Agenda 2030 for Sustainable Development; Government of Mozambique: Maputo, Mozambique, 2020.
  4. Marassiro, M.J.; Romarco de Oliveira, M.L.; Pereira, G.P. Family farming in Mozambique: Characteristics and challenges. Res. Soc. Dev. 2021, 10, e22110615682. [Google Scholar] [CrossRef]
  5. Panagos, P.; Jones, A.; Lugato, E.; Ballabio, C. A Soil Monitoring Law for Europe. Glob. Chall. 2025, 9, 2400336. [Google Scholar] [CrossRef] [PubMed]
  6. Chianu, J.N.; Chianu, J.N.; Mairura, F. Mineral fertilisers in the farming systems of sub-Saharan Africa. A review. Environ. Resour. Econ. 2019, 74, 1239–1271. [Google Scholar]
  7. Maria, R.M.; Yost, R. A Survey of Soil Fertility Status of Four Agroecological Zones of Mozambique. Soil Sci. 2006, 171, 902–914. [Google Scholar] [CrossRef]
  8. Chichongue, O.; van Tol, J.; Ceronio, G.; Preez, C.D. Effects of Tillage Systems and Cropping Patterns on Soil Physical Properties in Mozambique. Agriculture 2020, 10, 448. [Google Scholar] [CrossRef]
  9. Serrani, D.; Cocco, S.; Cardelli, V.; D’Ottavio, P.; Rafael, R.B.A.; Feniasse, D.; Vilanculos, A.; Fernández-Marcos, M.L.; Giosué, C.; Tittarelli, F.; et al. Soil fertility in slash-and-burn agricultural systems in central Mozambique. J. Environ. Manag. 2022, 322, 116031–116043. [Google Scholar] [CrossRef]
  10. Folmer, E.C.R.; Geurts, P.M.H.; Francisco, J.R. Assessment of soil fertility depletion in Mozambique. Agric. Ecosyst. Environ. 1998, 71, 159–167. [Google Scholar] [CrossRef]
  11. Pereira, M.J.S.L.; Esteves da Silva, J. Assessment of the Quality of Agricultural Soils in Manica Province (Mozambique). Environments 2024, 11, 67. [Google Scholar] [CrossRef]
  12. Tittonella, P.; Gillerb, K.E. When yield gaps are poverty traps: The paradigm of ecological intensification in African smallholder agriculture. Field Crops Res. 2013, 143, 76–90. [Google Scholar] [CrossRef]
  13. Morris, M.; Kelly, V.A.; Kopicki, R.J.; Byerlee, D. Fertiliser Use in African Agriculture: Lessons Learned and Good Practice Guidelines; The World Bank: Washington, DC, USA, 2007; Available online: https://documents.worldbank.org/pt/publication/documents-reports/documentdetail/498591468204546593/fertilizer-use-in-african-agriculture-lessons-learned-and-good-practice-guidelines (accessed on 19 June 2025).
  14. Denning, G.; Kabambe, P.; Sanchez, P.; Malik, A.; Flor, R.; Harawa, R.; Nkhoma, P.; Zamba, C.; Banda, C.; Magombo, C.; et al. Input Subsidies to Improve Smallholder Maize Productivity in Malawi: Toward an African Green Revolution. PLoS Biol. 2009, 7, e1000023. [Google Scholar] [CrossRef]
  15. Sanchez, P.A.; Swaminathan, M.S. Hunger in Africa: The link between unhealthy people and unhealthy soils. Lancet 2005, 365, 442–444. [Google Scholar] [CrossRef]
  16. Bevis, L.; Kim, K.; Guerena, D. Soil zinc deficiency and child stunting: Evidence from Nepal. J. Health Econ. 2023, 87, 102691–102709. [Google Scholar] [CrossRef]
  17. Morton, C.M.; Pullabhotla, H.; Bevis, L.; Lobell, D.B. Soil micronutrients linked to human health in India. Sci. Rep. 2023, 13, 13591–13602. [Google Scholar] [CrossRef]
  18. Priya, A.K.; Muruganandam, M.; Ali, S.S.; Kornaros, M. Clean-Up of Heavy Metals from Contaminated Soil by Phytoremediation: A Multidisciplinary and Eco-Friendly Approach. Toxics 2023, 11, 422. [Google Scholar] [CrossRef] [PubMed]
  19. Wuana, R.A.; Okieimen, F.E. Heavy Metals in Contaminated Soils: A Review of Sources. Chemistry. Risks and Best Available Strategies for Remediation. ISRN Ecol. 2011, 2011, 402647. [Google Scholar] [CrossRef]
  20. Xin, X.; Shentu, J.; Zhang, T.; Yang, X.; Baligar, V.C.; He, Z. Sources. Indicators. and Assessment of Soil Contamination by Potentially Toxic Metals. Sustainability 2022, 14, 15878. [Google Scholar] [CrossRef]
  21. Zhao, H.; Wu, Y.; Lan, X.; Yang, Y.; Wu, X.; Du, L. Comprehensive assessment of harmful heavy metals in contaminated soil in order to score pollution level. Sci. Rep. 2022, 12, 3552–3565. [Google Scholar] [CrossRef]
  22. Rashid, A.; Schutte, B.J.; Ulery, A.; Deyholos, M.K.; Sanogo, S.; Lehnhoff, E.A.; Beck, L. Heavy Metal Contamination in Agricultural Soil: Environmental Pollutants Affecting Crop Health. Agronomy 2023, 13, 1521. [Google Scholar] [CrossRef]
  23. Mitra, S.; Chakraborty, J.C.; Tareq, A.M.; Emran, T.B.; Nainu, F.; Khusro, A.; Idris, A.M.; Khandaker, M.U.; Osman, H.; Alhumaydhi, F.A.; et al. Impact of heavy metals on the environment and human health: Novel therapeutic insights to counter the toxicity. J. King Saud. Univ. Sci. 2022, 34, 101865–101886. [Google Scholar] [CrossRef]
  24. Yanga, S.; Suna, L.; Suna, Y.; Songa, K.; Qina, Q.; Zhu, Z.; Xue, Y. Towards an integrated health risk assessment framework of soil heavy metals pollution: Theoretical basis, conceptual model, and perspectives. Environ. Pollut. 2013, 316, 120596–120603. [Google Scholar] [CrossRef]
  25. Sarker, A.; Kim, J.E.; Islam, A.; Bilal, M.; Rakib, R.; Nandi, R.; Rahman, M.M.; Islam, T. Heavy metals contamination and associated health risks in food webs—A review focuses on food safety and environmental sustainability in Bangladesh. Environ. Sci. Pollut. Res. Int. 2022, 29, 3230–3245. [Google Scholar] [CrossRef]
  26. Pereira, M.J.S.L.; Esteves da Silva, J. Environmental Stressors of Mozambique Soil Quality. Environments 2024, 11, 125. [Google Scholar] [CrossRef]
  27. Seaton, F. Soil health cluster analysis based on national monitoring of soil indicators. Eur. J. Soil Sci. 2021, 72, 2414–2429. [Google Scholar] [CrossRef]
  28. Webster, R.; Burrough, P.A. Multiple discriminant analysis in soil survey. Eur. J. Soil Sci. 1974, 25, 120–134. [Google Scholar] [CrossRef]
  29. Rerkasem, B.; Jamjod, S.; Pusadee, T. Productivity limiting impacts of boron deficiency, a review. Plant Soil 2020, 455, 23–40. [Google Scholar] [CrossRef]
  30. Rojas, R.V.; Taboada, M.; Santillán, V.S.; Cardoso, C.; Olivera, C. Soils for Nutrition: State of the Art; Food and Agriculture Organization (FAO) of the United Nations Organization (ONU): Rome, Italy, 2022; pp. 1–96. [Google Scholar]
  31. Solos Contaminados—Guia Técnico. Valores de Referência. Para o Solo, 3rd Revision–2022; Agência Portuguesa do Ambiente (APA): Amadora, Portugal, 2019. [Google Scholar]
  32. Raso, E.F.; Savaio, S.S.; Mulima, E.P. Impact of artisanal gold mining on agricultural soils: Case of the district of Manica. Mozambique. Rev. Verde 2022, 17, 44–50. [Google Scholar] [CrossRef]
  33. Leuenberger, A.; Winkler, M.S.; Cambaco, O.; Cossa, H.; Kihwele, F.; Lyatuu, I.; Zabre, H.R.; Farnham, A.; Macete, E.; Munguambe, K. Health impacts of industrial mining on surrounding communities: Local perspectives from three sub-Saharan African countries. PLoS ONE 2021, 16, e0252433. [Google Scholar] [CrossRef] [PubMed]
  34. Dondeyne, S.; Ndunguru, E.; Rafael, P.; Bannerman, J. Artisanal mining in central Mozambique: Policy and environmental issues of concern. Resour. Policy 2009, 34, 45–50. [Google Scholar] [CrossRef]
  35. Shahbazi, K.; Marzi, M.; Rezaei, H. Heavy metal concentration in the agricultural soils under the different climatic regions: A case study of Iran. Environ. Earth Sci. 2020, 79, 324–336. [Google Scholar] [CrossRef]
  36. Daulta, R.; Prakash, M.; Goyal, S. Metal content in soils of Northern India and crop response: A review. Int. J. Environ. Sci. Technol. 2023, 20, 4521–4548. [Google Scholar] [CrossRef]
  37. Li, R.; Wang, J.; Zhou, Y.; Zhang, W.; Feng, D.; Su, X. Heavy metal contamination in Shanghai agricultural soil. Heliyon 2023, 9, e22824. [Google Scholar] [CrossRef] [PubMed]
  38. Contaminated Soils—Technical Guide. Available online: https://sniambgeoviewer.apambiente.pt/GeoDocs/geoportaldocs/AtQualSolos/Guia_Tecnico_Valores%20de%20Referencia_2019_01.pdf (accessed on 20 June 2025).
Figure 1. The map of Mozambique (with its provinces) (a) with the amplification of the Manica province (extracted from Google map) (b), in the Manica and Sussundenga districts, where the soil samples were collected.
Environments 12 00265 g001
Figure 2. Dendrogram obtained by unsupervised hierarchical cluster analysis using the between-group linkage method.
Environments 12 00265 g002
Figure 3. Dendrogram obtained by unsupervised hierarchical cluster analysis using Ward’s method with Z-score standardisation.
Environments 12 00265 g003
Table 1. Clusters detected and their compositions found by unsupervised hierarchical cluster analysis of the results found in the physical-chemical soils analysis.
ClusterSamples in the ClustersSub-ClusterSamples in the Sub-ClustersOrigin of the Soils
Cluster A1S2Y1. S2Y2. S2Y3
S3Y1. S3Y2. S3Y3
Sussundenga
Cluster A2M2Y2. M2Y3
M4Y3
S1Y1. S1Y2. S1Y3
S4Y3
Cluster A2AM2Y2. M2Y3
M4Y3
Manica
Cluster A2BS1Y1. S1Y2. S1Y3
S4Y3
Sussundenga
Cluster A3M1Y1
M2Y1
Manica
Cluster A4M1Y2. M1Y3
M3Y3
M5Y3
Manica
Table 2. Average and standard deviation of the agronomic variables in the four clusters of soil samples observed by unsupervised hierarchical clustering.
PropertyCluster A1Cluster A2Cluster A3Cluster A4
Extractable K (K2O). mg/kg59 (26)155 40)204 (45)254 (66)
Extractable Mg. mg/kg52 (13)111 (10)327 (41)586 (3)
Extractable Ca. mg/kg404 (95)565 81)1053 (113)1462 194)
Micronutrient Fe. mg/kg65 (23)121 (69)206 (11)91 (33)
Micronutrient Mn. mg/kg31 (17)172 (12)285 (80)409 (31)
Micronutrient Zn. mg/kg2.2 (0.6)1.4 (0.6)1.9 (0.3)2.2 (0)
Micronutrient Cu. mg/kg0.45 (0.08)2 (1)3.6 (0.5)5.6 (0.1)
Exchangeable Na. cmol(+)/kg0.043 (0.008)0.07 (0.03)0.13 (0.03)0.16 (0.04)
Exchangeable K. cmol(+)/kg0.14 (0.02)0.32 (0.04)0.38 (0)0.50 (0.08)
Exchangeable Ca. cmol(+)/kg2.0 (0.5)2.8 (0.4)5.2 (0.6)7.3 (0.9)
Exchangeable Mg. cmol(+)/kg0.4 (0.1)0.90 (0.07)2.8 (0.4)4.8 (0.8)
CEC. cmol(+)/kg2.7 (0.5)4.2 (0.4)8.5 (0.9)13 (2)
pH(KCl) 1:54.9 (0.3)5.0 (0.3)5.3 (0.1)5.3 (0.1)
pH(H2O) 1:55.6 (0.3)5.9 (0.3)6.0 (0)6.4 (0.1)
Extractable P (P2O5). mg/kg41 (7)89 (87)119 (24)48 (18)
Organic Carbon (%)0.68 (0.07)0.7 (0.2)0.7 (0.2)0.9 (01)
Organic Matter (%)1.2 (0.1)1.2 (0.4)1.2 (0.4)1.5 (0.2)
Nitrogen Kjeldahl. g/kg0.8 (0.7)0.6 (0.2)1.10(0.03)13.0 (0.2)
Nitrate (N-NO3). mg/kg12 (7)7 (4)21 (12)9 (3)
Conductivity. mS/m5.7 (0.9)6 (2)11 (1)6 (1)
Sand (%)79 (4)69 (2)59 (4)27 (5)
Clay (%)11 (1)16 (2)24 (1)38 (3)
Silt (%)10 (4)15 (2)17 (5)35 (2)
Table 3. Clusters detected and their compositions found by unsupervised hierarchical cluster analysis of the results found in the physical-chemical soils analysis.
ClusterSamples in the ClustersOrigin of the Soils
Cluster H1S2Y2, S2Y3a, S2Y3b
S3Y3a, S3Y3b
S4Y3a, S4Y3b
Sussundenga
Cluster H2M2Y3a, M2Y3b
M4Y3a, M4Y3b
S1Y2, S1Y3a, S1Y3b
S3Y2
Manica/Sussundenga
Cluster H3M5Y3a, M5Y3bManica
Cluster H4M1Y3a, M1Y3b
M3Y3a, M3Y3b
Manica
Cluster H5M1Y2
M2Y2
Manica
Table 4. Average and standard deviation of the metal concentration (mg/kg) in the five clusters of soil samples observed by unsupervised hierarchical clustering.
Cluster H1Cluster H2Cluster H3Cluster H4Cluster H5
Ba18 (3)33 (12)110 (14)63 (2)50 (24)
Cr4 (4)102 (95)315 (7)1700 (355)840 (791)
Co1 (1)11 (7)59 (4)101 (13)48 (44)
Cu1 (2)9 (5)115 (7)34 (4)22 (13)
Pb4 (1)8 (4)18 (1)9 (1)76 (16)
Ni1 (2)34 (32)120 (14)715 (84)379 (425)
V5 (3)27 (10)280 (0)96 (16)61 (35)
Zn0 (0)13 (2)53 (11)30 (2)24 (9)
Disclaimer/Publisher’s Note: The statements, opinions and data contained in all publications are solely those of the individual author(s) and contributor(s) and not of MDPI and/or the editor(s). MDPI and/or the editor(s) disclaim responsibility for any injury to people or property resulting from any ideas, methods, instructions or products referred to in the content.

