Article

Evaluation of Standardised (ISO) Leaching Tests for Assessing Leaching and Solid–Solution Partitioning of Perfluoroalkyl Substances (PFAS) in Soils

by
Dan B. Kleja
1,2,*,
Hugo Campos-Pereira
2,3,
Johannes Kikuchi-McIntosh
1,4,
Michael Pettersson
1,
Oksana Golovko
5 and
Anja Enell
1
1
Swedish Geotechnical Institute (SGI), SE-581 93 Linköping, Sweden
2
Department of Soil and Environment, Swedish University of Agricultural Sciences (SLU), P.O. Box 7014, SE-750 07 Uppsala, Sweden
3
Swedish Chemicals Agency, P.O. Box 2, SE-172 66 Sundbyberg, Sweden
4
Department of Thematic Studies (TEMA), Linköping University, SE-581 83 Linköping, Sweden
5
Department of Aquatic Sciences and Assessment, Swedish University of Agricultural Sciences (SLU), P.O. Box 7050, SE-750 07 Uppsala, Sweden
*
Author to whom correspondence should be addressed.
Environments 2025, 12(6), 179; https://doi.org/10.3390/environments12060179
Submission received: 10 April 2025 / Revised: 21 May 2025 / Accepted: 23 May 2025 / Published: 29 May 2025

Abstract

:
The spread of per- and polyfluoroalkyl substances (PFAS) in the environment poses a severe threat to soil organisms, aquatic life, and human health. Many PFAS compounds are mobile and easily transported from soils to groundwater and further to surface waters. Leaching tests are valuable tools for assessing the site-specific leaching behaviour of contaminants. Here, we report the results of an evaluation of two standardized leaching tests for PFAS-contaminated soil materials: the batch test (ISO 21268-2:2019) using either demineralized water or 1 mM CaCl2 as leachants (liquid-to-solid (L/S) ratio of 10) and the up-flow percolation test (ISO 21268-3:2019) using 1 mM CaCl2 as leachant. One field-contaminated soil and three spiked (12 PFAS compounds) soils (aged 5 months) were included in the study. Desorption kinetics in the batch test were fast and equilibrium was obtained for all PFAS compounds within 24 h, the prescribed equilibration time. The same solubility was obtained for short-chain PFAS (PFBA, PFHxA, PFHpA, PFBS) in demineralized water and 1 mM CaCl2, whereas significantly lower solubility was often observed for long-chain PFAS in CaCl2 than in water, probably due to decreased charge repulsion between soil surfaces and PFAS compounds. In the up-flow percolation test, concentrations of short-chain PFAS in leachates decreased rapidly with increasing L/S, in contrast to long-chain PFAS, where concentrations decreased gradually or remained constant. Solid–solution partitioning coefficients (Kd), calculated from the data of the batch and percolation tests (1 mM CaCl2), were generally in agreement, although differing by more than three orders of magnitude between different PFAS compounds. Uncertainties and pitfalls when calculating Kd values from leaching test data are also explored.

1. Introduction

Per- and polyfluorinated substances (PFAS) are a large, diverse group of chemicals that are widely spread in soils, waters, and sediments across the globe [1,2,3]. Major sources of PFAS include fire training areas with repeated use of aqueous film-forming foam (AFFF) [2,4], landfills, and sewage treatment plants [5]. PFAS compounds are characterized by a C-F backbone and a functional (charged) headgroup such as carboxylate, sulfonate, or amide, giving them exceptional surface-active properties and high chemical stability [6]. Due to their environmental persistence and apparent toxicity [7], the wide occurrence of PFAS in the environment is of major concern. The mobility of PFAS in soils and sediments varies significantly due to their chemical structure. It is now well established that the per-fluorocarbon chain length in PFAS molecules, which reflects the intrinsic hydrophobicity, is closely related to the overall sorption of the substance, i.e., sorption strength increases with chain length [8,9,10]. In addition, the molecular charge might vary (negative, neutral, cationic, or zwitterionic), which also affects mobility [10,11]. Besides chemical structure, the mobility of individual PFAS compounds is also affected by soil and sediment properties. In many studies, organic matter (measured as organic carbon, OC) has been found to be an important sorbent for PFAS (e.g., [10,12]). The OC concentration alone seems to be a better predictor of the solid–solution partitioning coefficients (Kd) for long-chained PFAS compared to short-chained PFAS [13]. However, a recent study by Campos-Pereira et al. [14] showed that OC alone was a poor predictor of the partitioning for six investigated PFAS, except for FOSA, in a study including 11 mineral soils having a wide range of expected key soil properties (OC, Al/Fe (hydr)oxides and texture). Other soil constituents, like Al/Fe (hydr)oxides [15,16] and silicate minerals [17], which contribute to surface area and charge, might also contribute significantly to the binding of PFAS in mineral soils. Thus, the solubility of PFAS seems to be controlled by a complex interaction between different soil constituents, in ways not yet fully understood. Consequently, there are yet no validated geochemical models available to quantitatively predict the solubility of PFAS in various types of soils [16], although experimental data indicate that PFAS solubility can differ greatly between soils [14,18]. Thus, validated standardized practical tools are essential in site-specific risk assessments of the mobility of PFAS in soils and groundwaters at contaminated sites.
Various standard protocols have been developed to assess the potential leaching and mobility of contaminants from soils, wastes, and other materials, e.g., the Australian Standard Leaching Procedure AS 4439.3 [19]; the US EPA’s leaching environmental assessment framework (LEAF) methods 1311 [20], 1320 [21], and 1314 [22]; and the standards published by the International Organization for Standardization, such as ISO 21268-2:2019 [23] and ISO 21268-3:2019 [24]. Leaching tests are either performed in batch mode, where a portion of the solid material is being equilibrated with a solution (leachant), or in column mode, where leachant is added continuously to a column packed with the solid material of interest. Batch leaching tests are simple and require short operational time, although they may be subjected to experimental artefacts due to mechanical agitation, resulting in enhanced release of particulate and colloidal associated contaminants (e.g., [25]). Column leaching tests, or percolation tests, are more time-consuming but are expected to provide leaching results that more closely mimic field situations. Standardised leaching tests have so far mainly been applied and tested on inorganic contaminants [25,26]. However, in a recent study, Kabiri et al. [27] evaluated three standardised leaching tests for PFAS—the Australian Standard Leaching Procedure AS 4439.3 [19], the U.S. EPA Multiple Extraction Procedure (Method 1320) [21], and the U.S. EPA Up-Flow Percolation Column Procedure (Method 1314) [22]—to assess the leaching and desorption behaviour of PFAS in 12 contaminated soils. The three methods provided similar results for leaching behaviour and accumulated leached amounts of PFAS. However, the focus of this comparison was to evaluate the leaching tests with respect to long-term leaching potential, i.e., total leachable amounts of PFAS.
Van Glubt et al. [28] compared batch and column methods for determining sorption of PFOS and PFOA and calculating Kd values in two soils and one quartz sand. The experiments were performed with uncontaminated soil and the PFAS compounds were added to both systems. An extensive data analysis of the results showed a good correspondence between Kd values obtained with the two experimental approaches. This contrasts with the results obtained in the study by Aly et al. [29], where Kd values obtained for PFOA and PFOS in batch experiments were significantly lower than those obtained in column experiments. A key issue when determining Kd values for contaminants in soils and sediments is whether equilibrium between the solid and solution phases has been established or not. The batch test ISO 21268-2 is “based on the assumption that equilibrium or near-equilibrium is achieved between the liquid and solid phases during the test period”. Similarly, in the up-flow percolation test ISO 21268-3, it is “intended and assumed that conditions approach local equilibrium between the material and the leachant throughout the test”. Further, the ion composition of the leachant is also a factor to consider when evaluating the leaching behaviour of PFAS. Previous research has shown that high concentrations of divalent and trivalent cations will favour the binding of PFAS [30,31]. In the batch test, ISO 21268-2 [23], either deionized water or 0.001 M CaCl2 can be used, which might, dependent on choice, affect PFAS solubility (and the Kd) obtained.
In this work, we evaluated the performance of the batch leaching test ISO 21268-2 [23] and the up-flow percolation test ISO 21268-3 [24] to assess the solubility of PFAS in four contaminated soils with diverse physico–chemical properties. Three of the soils were spiked with a suite of twelve PFAS compounds followed by ageing, whereas the fourth soil was obtained from an AFFF-impacted fire training site. The specific aims were as follows: (1) to investigate the desorption kinetics of PFAS compounds in the batch test and evaluate the assumption of equilibrium between liquid and solid phases during the specified test period of 24 h, (2) to quantify the effect of leachant composition (deionized water and 1 mM CaCl2) on the solubility of various PFAS compounds, and (3) to evaluate the applicability of the batch and up-flow percolation tests in determining Kd values for PFAS compounds in soils.

2. Materials and Methods

2.1. Chemicals

Twelve PFAS were included in this study: perfluorobutanoate (PFBA), perfluorohexanoate (PFHxA), perfluoroheptanoate (PFHpA), perfluorooctanoate (PFOA), perfluorononanoate (PFNA), perfluorodecanoate (PFDA), perfluoroundecanoate (PFUnDA), perfluorododecanoate (PFDoDA), perfluorobutane sulfonate (PFBS), perfluorohexane sulfonate (PFHxS), perfluorooctane sulfonate (PFOS), and perfluorooctane sulfonamide (FOSA). Analytical grade PFAS compounds (purities ≥ 98%) were purchased from Sigma Aldrich (Saint Louis, MO, USA), and the associated isotopically labelled internal standards (purities > 98%) were obtained from Wellington Laboratories (Guelph, ON, USA). All solvents that were used for extractions and analysis, including MeOH (LiChrosolv hypergrade®, Merck, Darmstadt, Germany), were of analytical grade. Percolation and batch tests were performed with either 1 mM CaCl2 solution (CaCl2-dihydrate, VWR Chemicals AnalaR NORMAPUR) or Milli-Q water.

2.2. Soils

Four soils (Table 1 and Table 2) were used in the evaluation of the up-flow percolation test (column test) according to ISO 21268-3:2019 and the static leaching test (batch test) according to ISO 21268-2:2019. The soils were collected in central Sweden (Västmanland county), sieved < 2 mm, homogenized, and stored field-moist in darkness at +4 °C until use. Paskalampa E (Soil 1) and Paskalampa Bs (Soil 2) are sandy loams both sampled from the same Spodosol profile (approximate WGS84 coordinates: 59°46′24.3″ N 14 °58′12.8″ E). The Arboga soil (Soil 3) is a clay soil sampled directly adjacent to an AFFF-impacted site (approximate WGS84 coordinates: 59°23′47.5″ N 15°50′30.4″ E). The field-contaminated Arboga soil (Soil 4) was collected in the AFFF-impacted area at the same site, with total concentrations of PFOS and PFHxS of 63 and 6.0 µg kg–1, respectively (Table 3). Apart from the PFAS spiking step (see below), all four soils were handled according to the same analytical protocol (see below). All experiments were conducted with sieved (2 mm) soils within 9 months of sampling.

2.3. Spiking and Aging of Soils

The homogenized soils 1, 2, and 3 (2.8–4.5 kg field moist soil) were added to plastic (HDPE) containers and spiked dropwise, with intermittent mixing, with a mix of PFAS dissolved in MeOH. This yielded an average total soil concentration of ca. 130 and 290 µg kg–1 for short-chained and long-chained PFCAs, respectively, 580 µg kg–1 for PFSAs, and 380 µg kg–1 for FOSA in each of the spiked soils (Table 3). The containers were sealed, and the soils were left to age for five months in darkness (+4 °C) before the start of the experiments. On a few occasions during the time of ageing, the containers were shaken by hand to mix the soil. Immediately before usage in the experiments, the material was thoroughly mixed again in the containers.

2.4. Rinsing of Equipment

All larger-sized materials (bottles, centrifuge tubes, etc.) in contact with samples or sample solutions were acid-washed (0.1 M HNO3, Nitric Acid 68%, Primar Plus™, Fisher Chemical™, Fisher Scientific, Göteborg, Sweden) for 24 h and rinsed with Milli-Q (Merck Millipore) water for a total of three times, followed by rinsing with methanol (GPR RECTAPUR®, VWR International AB, Stockholm, Sweden) three times before use. The only equipment in contact with samples or sample solutions that were excluded from acid washing was the high-pressure silicone tubing (Advantasil High Pressure Silicone, AdvantaPure, Southampton, PA, USA) used for connecting leachant tanks with the columns and collection flasks—these were only rinsed with Milli-Q and methanol. After methanol rinsing, the equipment was left to dry in a fume hood. Smaller equipment (Luer-connectors, lids, and caps) was acid-washed as previously described and then sonicated in methanol for 15 min with one solvent exchange.

2.5. Test Set-Up

The up-flow percolation test set-up consisted of soils packed in HDPE-flash columns (330g PureFlash™ Empty Solid Load Cartridge, length 272 mm, i.d. 60 mm, Hawach Scientific, Xi’an, China) connected at the outlet to an HDPE-collection bottle through high-pressure silicone tubing (Advantasil High Pressure Silicone, AdvantaPure, Southampton, PA, USA) via PP-luer tube connectors (Watson-Marlow, Falmouth, Cornwall, UK) (see Figure S1 for experimental setup). The inlet of the column was connected to a peristaltic pump (Gilson Minipuls 3), which was further connected to a 5 L HDPE bottle. Leachant and collection bottles were made airtight by pushing the PP Luer-connectors through drilled holes fitted with silicone septa in the bottle caps. To mitigate excessive oxidation of the collected leachant, water locks were constructed on the collection bottles by creating a second airtight Luer-connection and connecting it, through an N-shaped piece of tubing, to the end of an empty 50 mL-plastic syringe filled with Milli-Q water. In this way, the headspace of the collection vessel was never in direct contact with the surrounding atmosphere, and this set-up also prevented excessive pressure build-up in the collection bottle during the execution of the percolation test.
All batch tests were performed in 250 mL Nalgene centrifuge bottles (Nalgene™ PPCO Centrifuge Bottles with Sealing Closure, Nalge Nunc International Corporation, Rochester, NY, USA), and sample solutions were stored in 15 mL centrifuge tubes (Corning™ Polypropylene Centrifuge Tubes, Sterile, Corning, NY, USA), all rinsed as previously described.

2.6. Up-Flow Percolation Test (ISO 21268-3:2019)

Columns were packed in triplicates for each soil according to the procedure outlined in ISO 21268-3:2019 [24]. Each column was weighed empty, after which a 1-cm layer of natural quartz sand (Ottawa sand, 20–30 mesh, Fisher Scientific, Göteborg, Sweden—acid washed and methanol-rinsed 3 times) was introduced. Soil was then packed in sections of 3 cm, where each section was introduced in sub-layers of 1 cm. The packing of each section was made by a rammer with a brass rod, brass weight (180 g), and a bottom plate consisting of a HDPE cylinder (diameter 5.8 cm). The weight of the rammer was allowed to fall (drop height approx. 25 cm) on the cylinder bottom 3 times for each soil section. Sections were introduced and packed to a final average bed height of 18.5 cm after which another 1 cm layer of quartz sand was introduced. The bed height was somewhat lower than that stipulated in ISO 21268-3:2019 (30 ± 5 cm). However, the bed dimensions in the standard are set such that plug-flow can be achieved through the column during the test. Annex B of ISO 21268-3:2019 states that plug-flow can be assumed when the length of the bed is 3–4 times the diameter of the bed under prescribed flow rates. These requirements were met with our set-up. The weights of quartz sand at the top and bottom of each column and the weight of the soil were registered for all triplicates (average dry weight (dw)): Soil 1; 563 g, Soil 2; 412 g, Soil 3; 482 g, Soil 4; 246 g). Due to the high clay content in Soil 4 (50%, Table 2), the soil had to be mixed with an aliquot of quartz sand to increase permeability and prevent clogging. This was carried out by a thorough manual homogenisation with a large stainless-steel spoon such that the final proportion of Soil 4 in each column after packing was 38% dw.
Columns were saturated with an average flow rate of 17 mL/h. The direction of the flow was from the bottom to the top. When leachant was visible in the top tube of the column outlet, the peristaltic pumps were stopped, and clamps were put in place to close the inlet tube at the bottom. Columns were then allowed to equilibrate for 24 h before the start of the test, which is in line with the recommendations in ISO 21268-3:2019 (16–72 h) [24].
Samples were collected from the column tests at cumulative L/S-ratios of 0.1, 2, 5, and 10. This procedure is a slight modification compared to the procedure outlined in ISO 21268-3:2019 [24], where eluate fractions also should be sampled at accumulated L/S of 0.2, 0.5, and 1.0. For the soil mixed with quartz sand (Soil 4), L/S were adjusted to correspond to the weight of the soil (L per kg soil). The aimed flow rate throughout the percolation tests was 17 mL/h, corresponding to a linear flow rate of 14.4 cm d−1, which is in line with recommended flow rates in ISO 21268-3:2019 (15 ± 2 cm d−1) [24]. However, over time, the tubing in the peristaltic pump became worn, and flow rates fluctuated somewhat, which made regular monitoring of flow rates and daily adjustments of the pump settings necessary. Collected eluates were centrifuged in 50 mL high-speed centrifuge tubes (Nalgene™ Oak Ridge High-Speed PPCO Centrifuge Tubes, Nalge Nunc International Corporation, Rochester, NY, USA) and centrifuged at 20,000× g for 30 min (Sigma 6K15, Sigma Laborzentrifugen GmbH, Osterode am Harz, Germany). The supernatant was then transferred with Pasteur pipettes (pre-combusted at 450 °C for 2 h) to 15 mL PP-tubes (Corning™ Polypropylene Centrifuge Tubes, Sterile, Corning, NY, USA) and stored cold (+4 °C) until analysis of PFAS. Within 24 h of each sampling event, an unfiltered aliquot of the centrifuged sample was also analyzed for pH (Hach Lange HQ440d Multi, Hach Lange GmbH, Düsseldorf, Germany) and conductivity (CDM210 Conductivity Meter, Radiometer Copenhagen, Brønshøj, Denmark).

2.7. Batch Test ISO 21268-2:2019

According to the procedure described in ISO 21268-2:2019 [23], either a solution of 1 mM CaCl2 or demineralized water can be used as a leachant. To investigate the effect of leachant on PFAS solubility, both leachants were tested at the standardized liquid-to-solid ratio (10 L/kg) and equilibration time (24 h). In addition, we investigated the solubility of PFAS as a function of equilibration time (1, 8, 24, 48, 96, and 240 h) using 1 mM CaCl2 as leachant. All experiments were made in triplicate. In all tests, the amount of soil corresponding to 20 g dry weight was weighed into 250 mL Nalgene centrifuge bottles, followed by an addition of leachant corresponding to a total volume of 200 mL. According to the standard test protocol, 100 ± 5 g dw of soil and 1000 mL leachant are recommended [23]. The reduction in sample size and leachant volume was made for practical reasons and might have affected the variability of test results to some extent. However, in a majority of research studies on PFAS sorption by soil materials using batch tests, small sample amounts (0.5–5 g) have been used with acceptable variability [10,11,12,14,18,30,34]. No addition of quartz sand to Soil 4 was needed in these tests. Following the addition of leachant, bottles were sealed and shaken vigorously before being placed on the end-over-end shaker (Gerhardt Laboshake, Gerhardt GmbH, Königswinter, Germany) with a rotational speed of 10 rpm, which is within the range specified in the standard protocol (5–10 rpm). At each designated sampling time, bottles were removed from the shaker and centrifuged at 20,000× g for 30 min, after which an aliquot of the supernatant was transferred with a Pasteur pipette to a 15 mL PP-tube (Corning) and stored cold (+4 °C) until analysis of PFAS. One portion of each sample was filtered through 0.45 µm syringe filters (Sartorius Minisart hydrophilic regenerated cellulose filter) for analysis of supporting parameters (DOC, Al, Si, Fe, Na, K, Ca, Mg, Mn, Cl, SO42−). The remaining solution was analyzed for pH and conductivity, as described above. Dissolved organic carbon (DOC) was determined by combustion and detection by infrared spectrophotometry (EN 1484:1997) [35], cations and Si by ICP-OES according to ISO 11885:2007 [36], and anions (Cl and SO42−) by ion chromatography according to ISO 10304-1:2007 [37].
In parallel with the batch tests, four blanks (two deionized water and two 1 mM CaCl2) without any soil were run for each series of experiments. Altogether, twelve blanks were run, six per leachant. The average concentrations of PFAS compounds in all the twelve blanks were less than the limits of quantification, except for PFBS, which was not detected in any blank, and PFOS, which had an average blank concentration of 0.016 µg L−1 (Table S1).

2.8. PFAS Analysis

PFAS concentrations in eluates were quantified using ultrahigh-performance liquid chromatography (UPLC) [14]. In brief, 5 ng of each of the mass-labelled internal standards (ISs) was added to sample aliquots (500 µL aqueous sample) prior to vortexing and filtration (0.45 μm, Sartorius Minisart hydrophilic regenerated cellulose filter [38,39]. PFAS concentrations were measured using IS isotope dilution with direct injection into a Dionex UltiMate 3000 ultrahigh-performance liquid chromatography system (Thermo Fisher Scientific, Waltham, MA, USA) coupled to a triple-quadrupole tandem mass spectrometer (MS/MS) (TSQ Quantiva, Thermo Fisher Scientific, Waltham, MA, USA). The ionization source was electrospray ionization (ESI), which was operating in a negative mode. The injected volume (10 μL) was separated on an Acquity UPLC BEH-C18 analytical column (1.7 μm, 50 mm, Waters Corporation, Manchester, UK) using an eluent gradient of 12 min. Mobile phases were Milli-Q water and 5 mM ammonium acetate with 2% (v/v) acetonitrile. Aqueous limits of quantification (LoQ) ranged from 0.01 to 0.1 µg L−1 (Table S2), as defined as the lowest calibration point for which the response factor did not deviate more than ±30% from the average response factor of the calibration curve [40].
The analytical scheme for PFAS in soil materials followed the method by Ahrens et al. [41], which is based on a two-step alkaline extraction procedure. In short, 0.1 g of freeze-dried soil was extracted with a mixture of 0.1 M NaOH in 20% Milli-Q water and 80% methanol in two subsequent steps. The supernatants were pooled and neutralized with HCl and centrifuged at 3000 rpm for 5 min. A portion of pooled supernatants was reduced in volume in a gentle stream of N2-gas and further cleaned by adding ENVI-Carb and glacial acetic acid. Following vortexing and centrifugation, the supernatants were analyzed for PFAS using UPLC, as described above. The method detection limit (MDL) for the analytical procedure for each compound was set to the lowest calibration point of the calibration curve with relative residuals < 15 %. If target compounds were detected in the method blanks, the MDL was set to the average concentration of the blanks plus three times the standard deviation of the blanks [42]. Except for PFHxA (42 µg kg−1), MDLs were ≤6 µg kg−1 (Table S2).

2.9. Data Analysis

2.9.1. Calculations

Batch Test

Mass PFAS released per mass soil is given by:
M e = C e × L / S
where
Me = mass of PFAS in eluate per mass dw soil (µg kg−1)
Ce = concentration of PFAS in eluate (µg L−1)
L/S = liquid-to-solid ratio (L kg−1)
Solid–solution partitioning coefficient (Kd) is defined as:
K d = C s C e
where Cs is the solid-phase concentration after leaching (µg kg−1), which is given by the mass balance:
C s = C s , i n i t i a l M e
and Cs,initial denotes the initial concentration of PFAS in the soil (µg kg−1).

Percolation Test

The cumulative mass release of PFAS per mass of soil (dw) as a function of L/S was calculated as follows:
Σ M e , i = i = 1 4 [ C e , i × ( Σ L / S i Σ L / S i 1 ) ]
where
Σ M e , i = the cumulative mass of PFAS released through interval i per mass dw soil (µg kg−1)
C e , i = the concentration of PFAS in the eluate collected during the interval i (µg L−1)
Σ L / S i = the cumulative L/S of eluate collected through the interval i (L kg−1)
Σ L / S i 1 = the cumulative L/S of eluate collected through the interval i − 1 (L kg−1)
In order to calculate the solid–solution partitioning coefficient ( K d , i ) for PFAS compounds at a certain L/S interval, we relate the concentration in eluate i ( C e , i ) to the average concentration of the solid phase in the interval i − 1 to i ( C s , i * ) according to:
K d , i = C s , i * C e , i .
Here, C s , i * is given by:
C s , i * = C s , i 1 1 2 × Σ M e , i
Thus, we assume a linear leaching behaviour in the L/S interval of interest. In the first eluate at L/S 0.1 (i = 1), C s , i 1 is equivalent to the initial concentration of PFAS in the sample (µg kg−1).

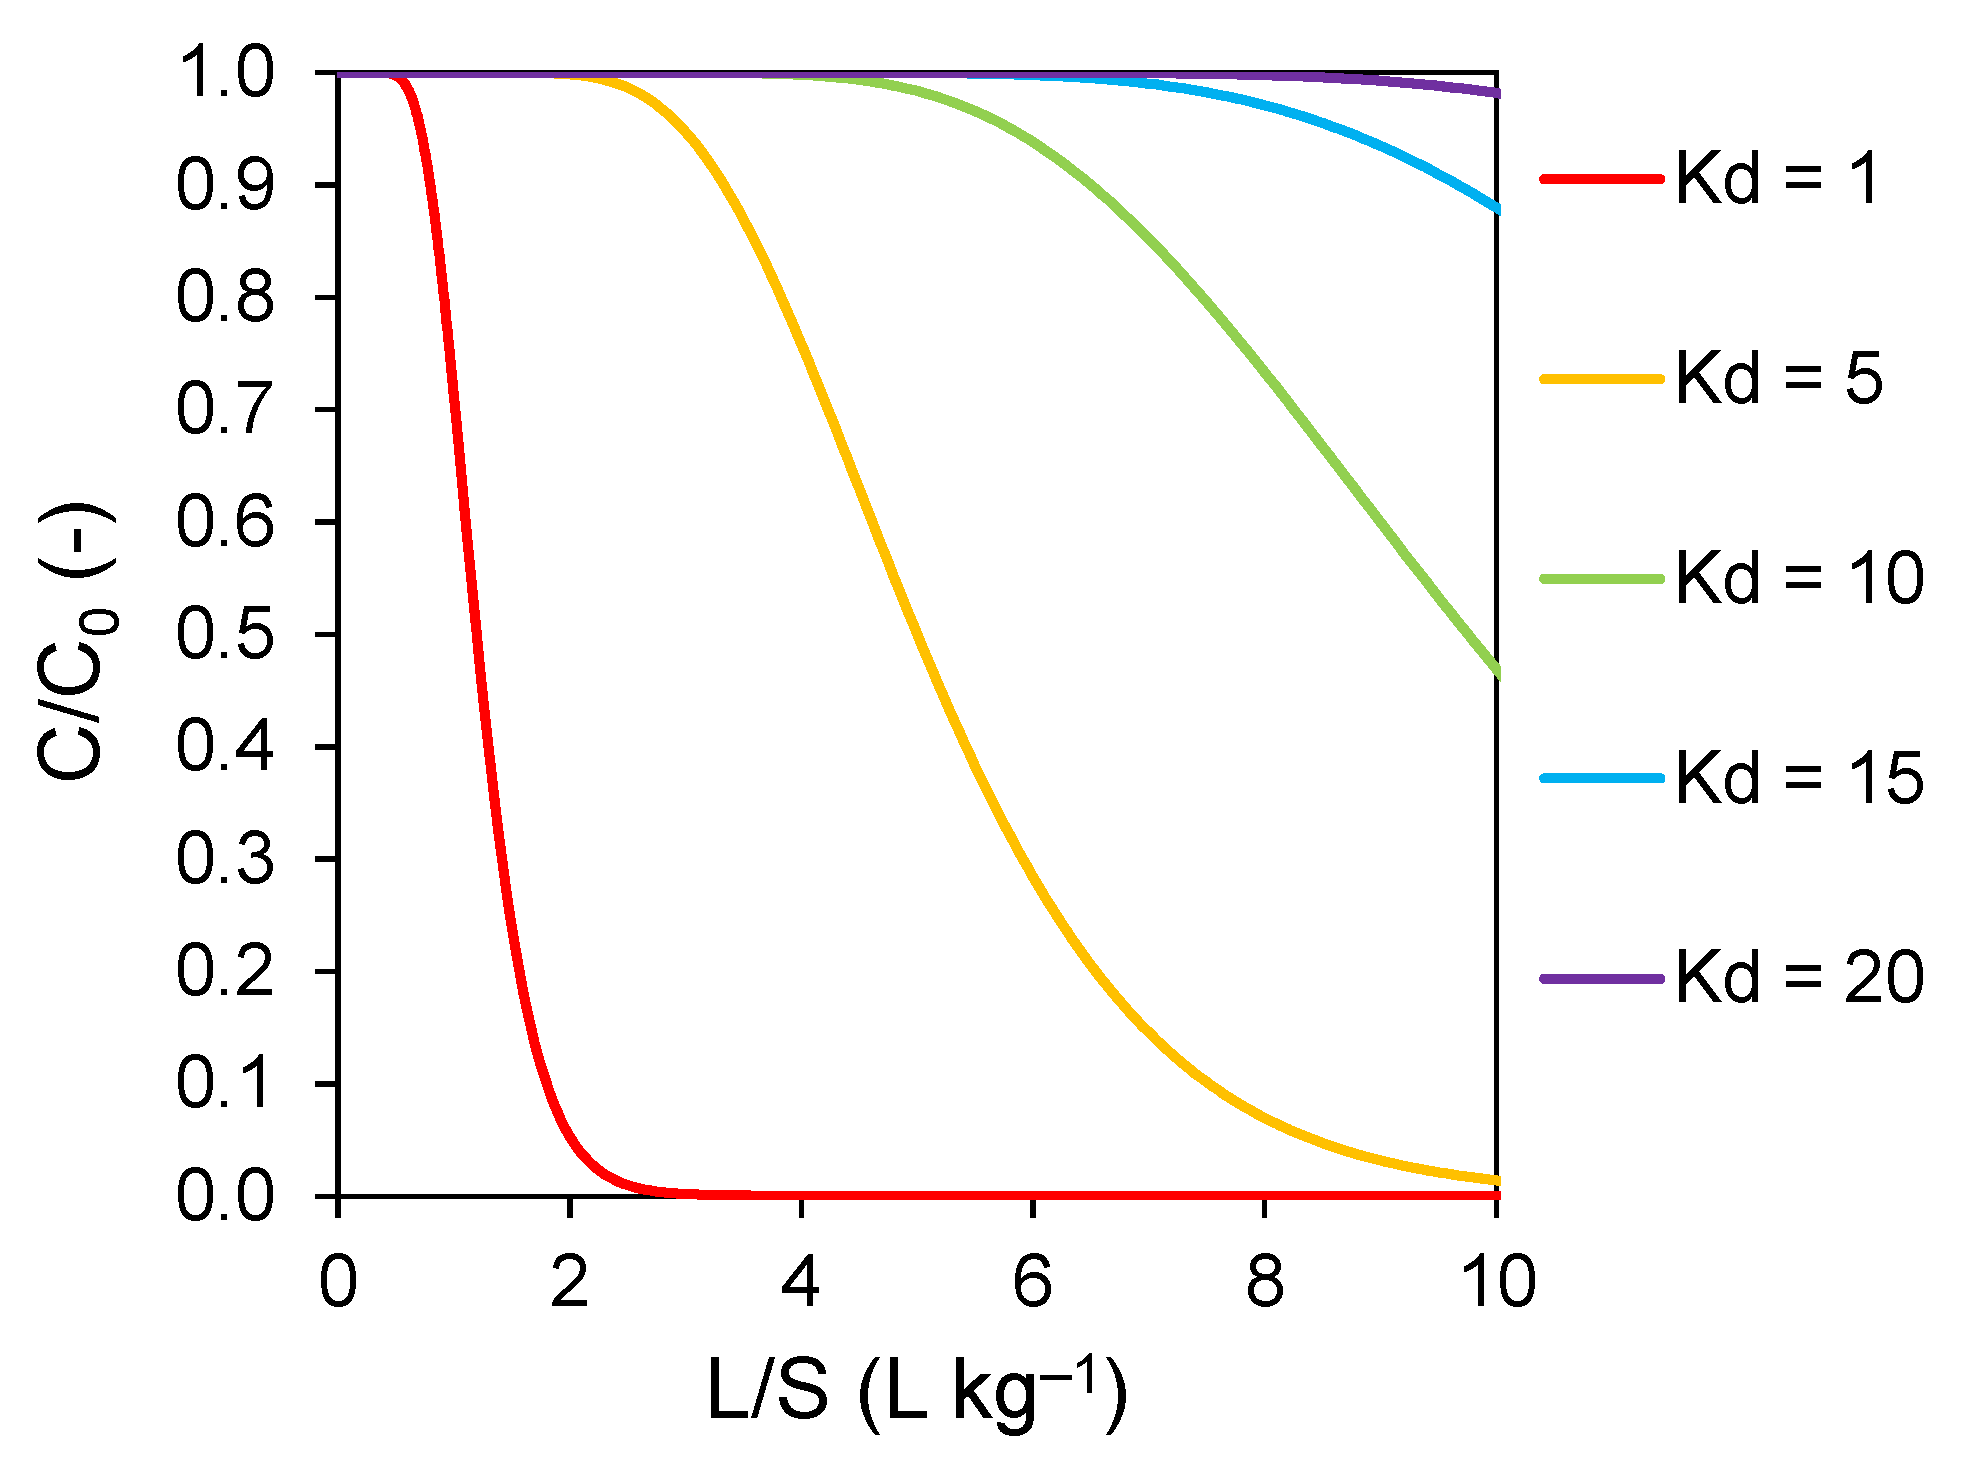
2.9.2. Modelling Leaching Behaviour of PFAS in Percolation Tests

To evaluate the leaching behaviour of PFAS in the percolation test, reference simulations were made using the basic advection–dispersion model. For one-dimensional (1-D) flow in a homogenous, isotropic porous media, the following equation holds [43,44,45]:
R C t = D 2 C x 2 v C x
where C is the solute concentration, t is time, x is the distance in the flow direction, D is the longitudinal dispersion coefficient, ν is the average fluid velocity through the porous media, and R is the retardation factor, as defined as follows:
R = 1 + K d ρ ε
Here, Kd is the partitioning coefficient between the solid and aqueous phase, ρ is the dry bulk density, and ε the porosity of the porous medium. This model is based on the assumption that local equilibrium exists between the liquid and solid phases, defined by Kd. Röhler et al. [46] showed that percolation test data for PFOS and PFOA in a German agricultural soil could be reasonably well described with the advection–dispersion model, lending some support for this approach.
In this work, we used the advection–dispersion model for illustrative purposes and to evaluate the magnitude of uncertainties introduced by the assumptions made when calculating Kd from percolation test data using Equation (5). The initial and boundary conditions, as well as all input data used in the calculations, are given in the Supplementary Materials Section.

3. Results and Discussion

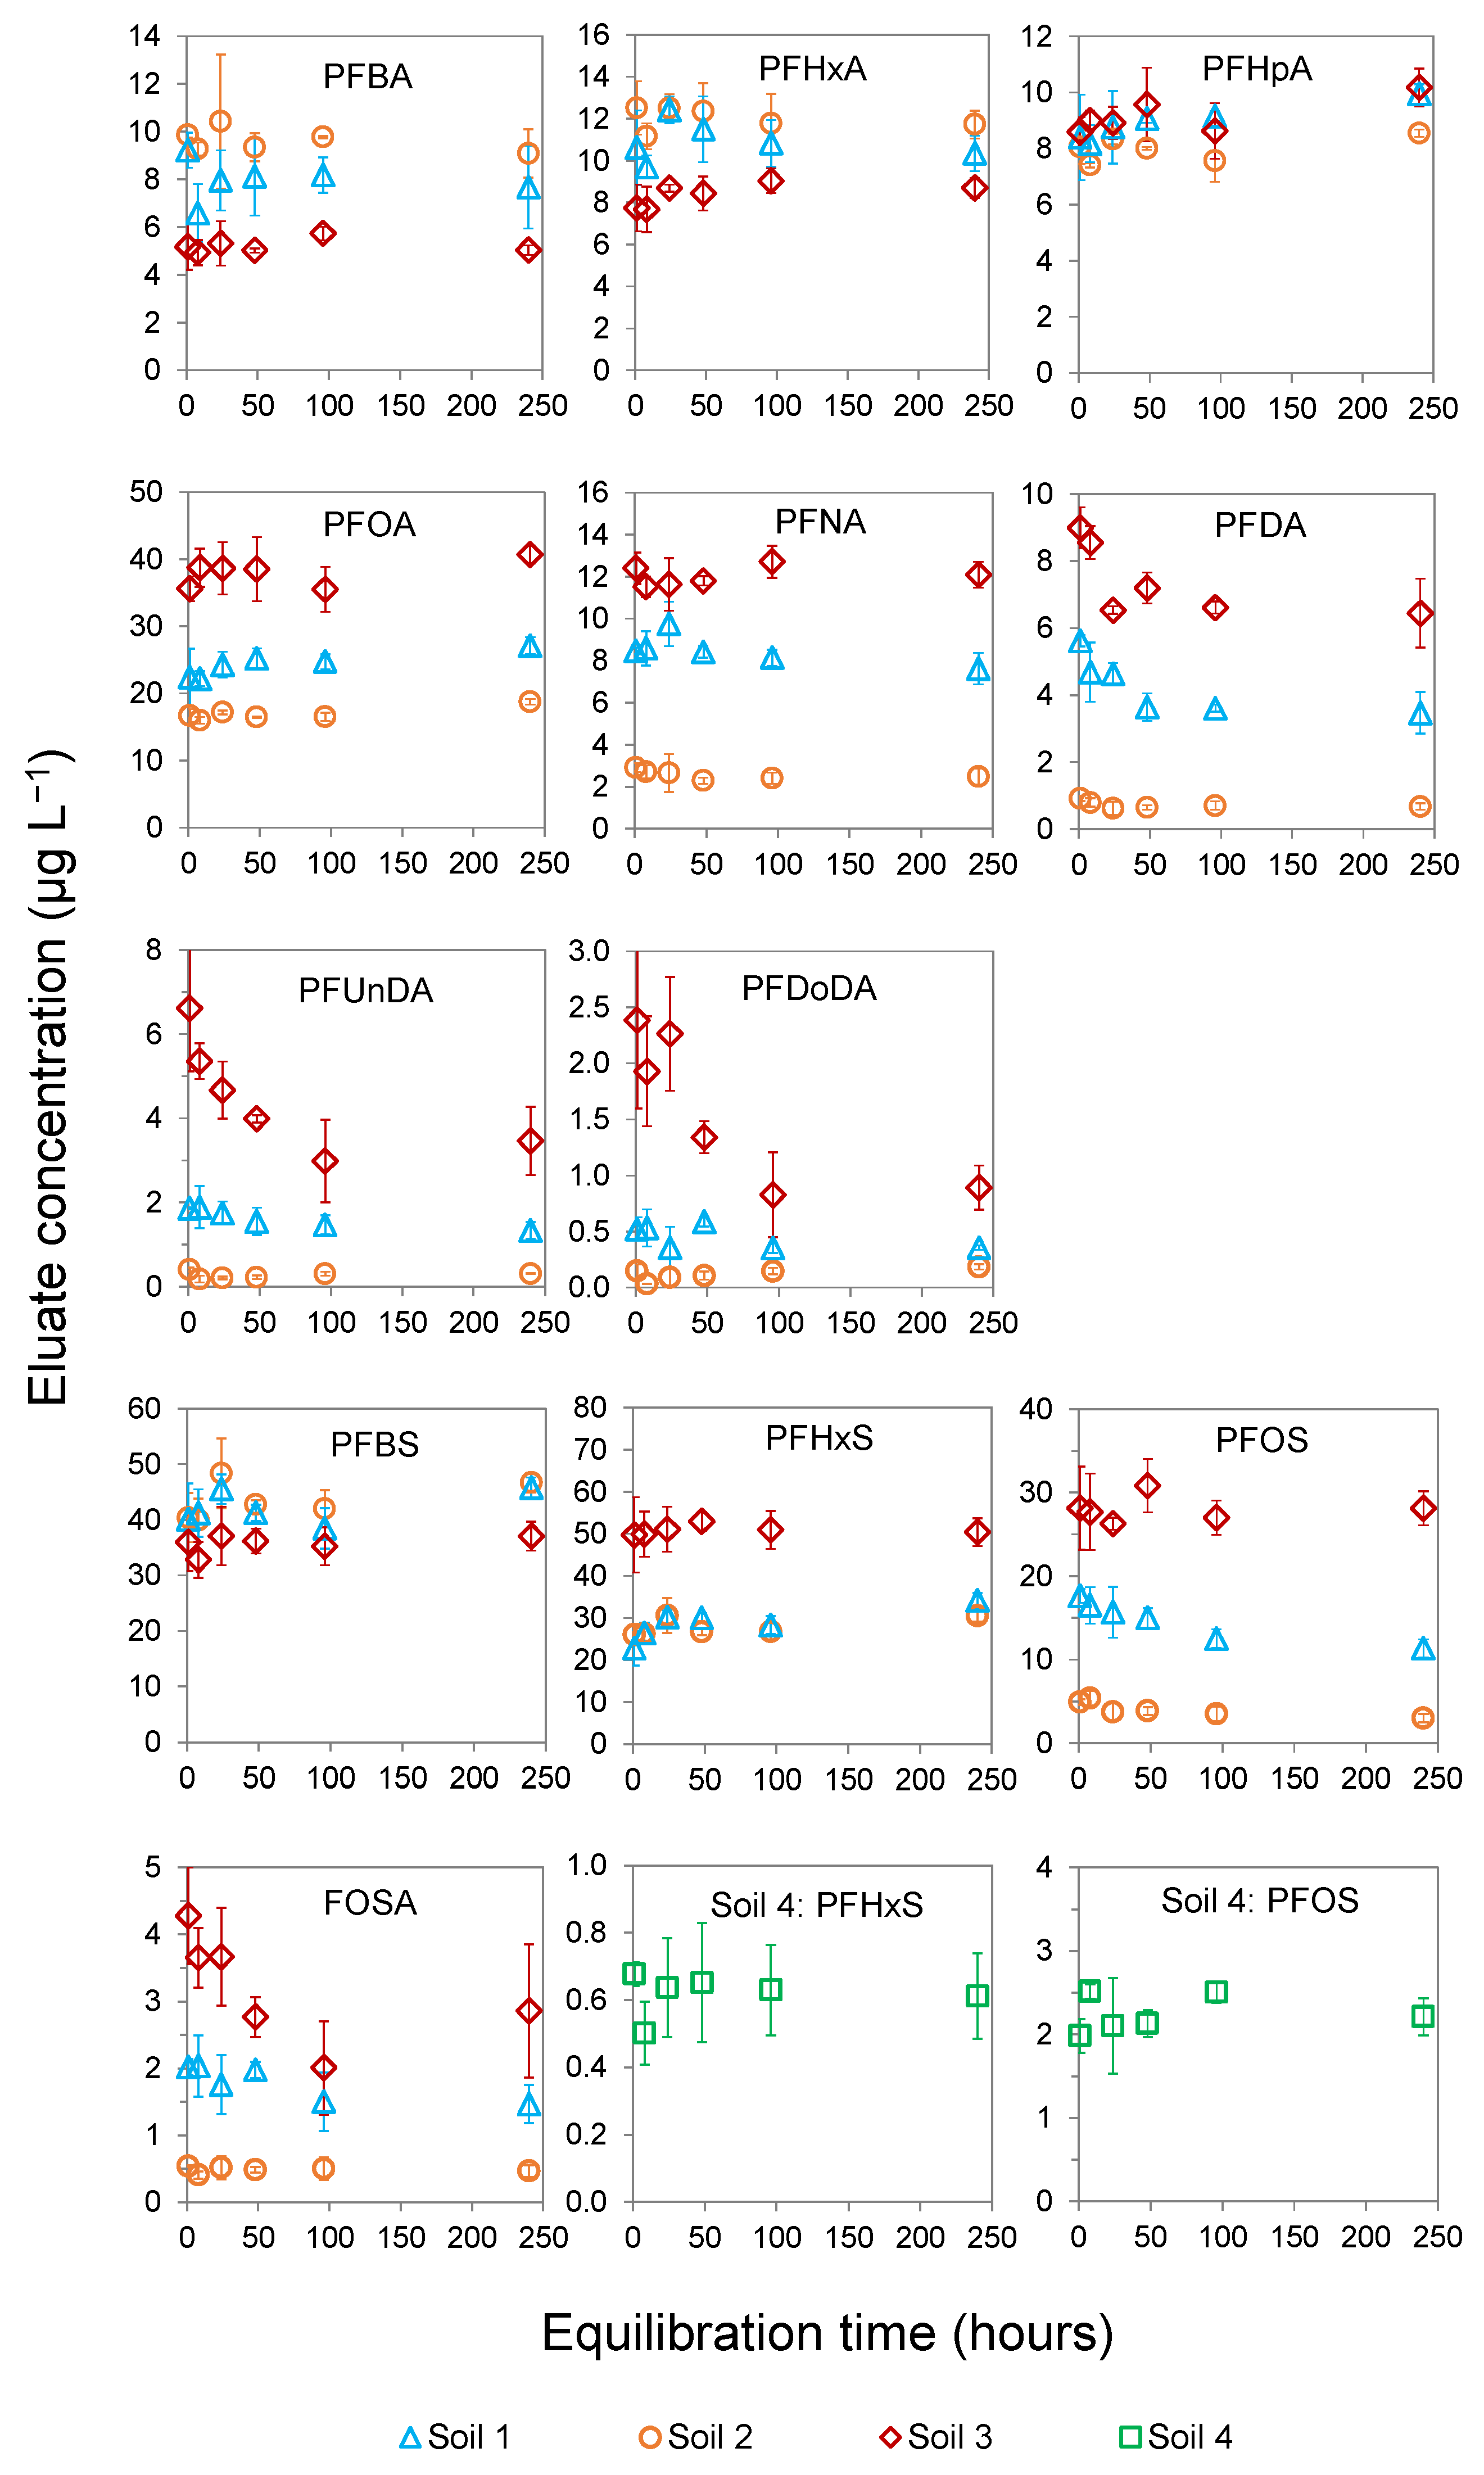
3.1. Desorption Kinetics of PFAS in Batch Test ISO 21268-2:2019

The four soils included in the study represent a wide variation in soil properties known to be important for PFAS sorption. Organic matter, measured as organic carbon (OC), is generally an important sorbent for PFAS in many soils [12,13,30], although other soil constituents like Fe and Al (hydr)oxides and clay minerals might contribute to sorption [18,34]. Soil 1 was low in OC and clay, as well as Fe and Al (hydr)oxides (Table 2). The latter is indicated by the low concentrations of oxalate extractable Fe and the small difference between oxalate and pyrophosphate extractable Al [47]. Soil 2 also had a low clay content, but was higher in OC and much higher in Fe and Al (hydr)oxides. The two soils from Arboga (Soil 3 and 4), both had a high clay content, but were intermediate in terms of OC and the content of Fe and Al (hydr)oxides.
Desorption kinetics were generally fast for all twelve PFAS compounds investigated in the batch test (Figure 1, Table S2), despite the variability in soil properties between the soils. All twelve compounds are perfluorinated and are generally considered extremely resistant to environmental and metabolic degradation [48]. It is therefore highly unlikely that any significant degradation and/or conversion of individual compounds had occurred during the experimental period (1–240 h). For most PFAS compounds, eluate concentrations remained constant already after one hour of equilibration. For the most hydrophobic long-chain PFAS, PFUnDA and PFDoDA, there was a trend of decreasing concentration with time in the spiked clay soil (Soil 3), although the difference between 24 h and 240 h equilibration time was only significant for PFDoDA (Table S5). A decreasing trend in concentration with time cannot be explained by constrained desorption kinetics. Possibly, this could be an artefact due to physical abrasion at longer equilibration times, which might increase the surface area of soil particles. Notably, the desorption kinetics of PFHxS and PFOS in the field-contaminated Arboga soil (Soil 4) was similar to the spiked and aged counterpart (Soil 3), indicating that the spiking and ageing procedure used provided field-realistic data. Reports on the desorption kinetics of PFAS compounds in batch experiments with soil materials are surprisingly scarce in the literature. To date, most studies have been made on adsorption kinetics by soils, sediments, and various sorbents. In an early study, Higgins and Luthy [30] found that it took up to eight days to reach equilibrium for PFOS and PFDA added to sediment materials. In a later study, equilibrium was attained after less than 18 h for PFOS, PFOA, and PFDA in a study with loam soil [11], which is in line with the rapid desorption kinetics that was found in the present study. In addition, sorption studies with PFOS and individual soil constituents like goethite and kaolinite showed that equilibrium was attained within 24 h [15]. Furthermore, in a study with a peat material, Zhi and Liu [49] found that desorption kinetics for PFOS and PFOA were comparable with adsorption kinetics.

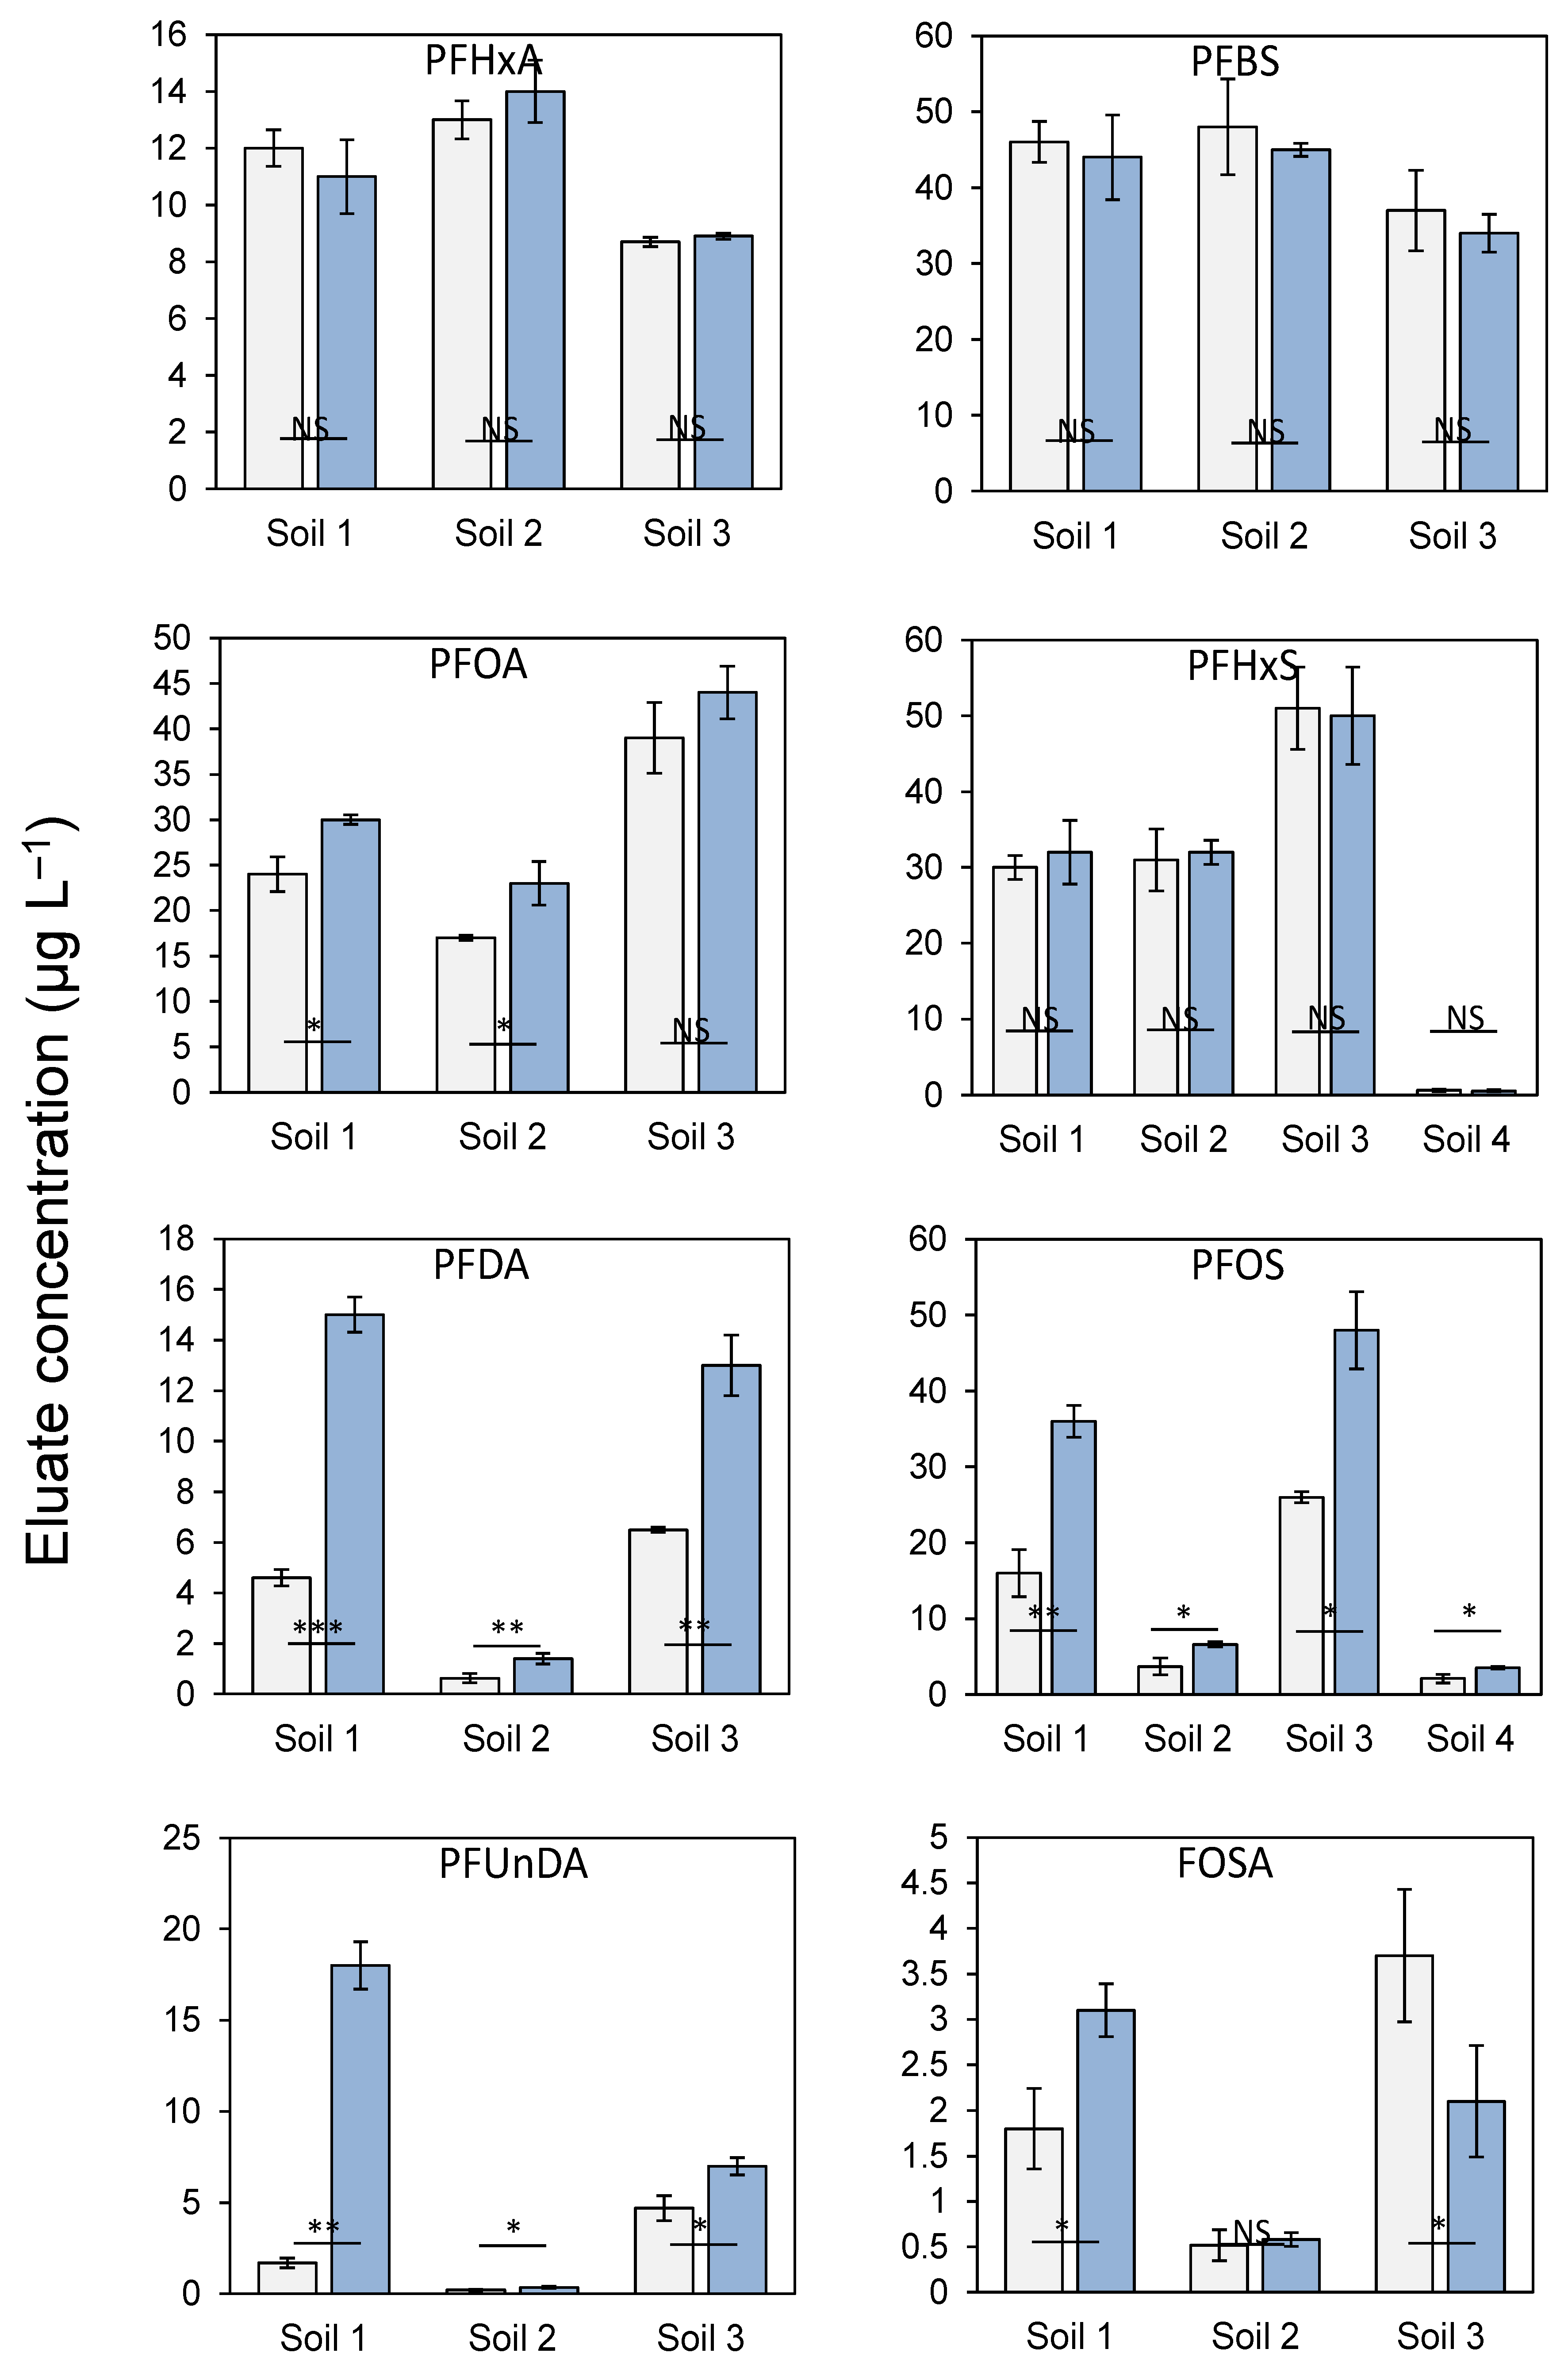
3.2. Comparing Deionized Water and 1 mM CaCl2 as Leachants in Batch Tests

Following the procedure in ISO 21268-2:2019 [23], either deionized water or 1 mM CaCl2 can be used as a leachant (duration 24 h). As illustrated in Figure 2, there was no significant difference in PFAS leaching between the two leachants for short-chain PFAS with perfluorinated carbon chains ≤ 6. For PFAS with longer chain lengths, eluate concentrations were generally significantly higher in deionized water than in 1 mM CaCl2. Previous studies have shown that deionized water as a leachant might mobilize colloids to a higher extent than 1 mM CaCl2 [25], which potentially could mobilize longer-chained PFAS [50]. Increased colloidal mobilization in deionized water was observed in the clay soils (Soil 3 and 4), but not in the Spodosol samples (Soil 1 and 2), as indicated by measured concentrations of DOC, Al, Si, and Fe in the eluates (Table S4). Since the leachant effect was consistent for all soils, differences in solubility of longer-chained PFAS due to colloidal mobilization can be ruled out. Instead, there is evidence that both pH and the concentration of di- or trivalent cations influence PFAS solubility [30,31]. Adding di- or trivalent cations or lowering pH resulted in increased sorption of PFAS, which was explained by a decrease in the net negative charge of the soil particles [30,31]. Hence, the increased sorption of the long-chained PFAS in 1 mM CaCl2 compared to deionized water found in the present study was probably an effect of a decreased (negative) surface charge due to the binding of added Ca2+. The stronger effect observed for long-chained PFAS is consistent with the stronger contribution of electrostatic interactions between the electronegative fluorines of the tail part of the molecules and the soil particles [51,52]. A similar effect of chain length has previously been observed for the pH-dependent sorption of PFAS by mineral soil materials, where the effect of pH was much more pronounced for long-chain PFAS than for short-chain PFAS [14]. The explanation given above of the leachant-dependent behaviour of PFAS is valid for negatively charged PFAS compounds, i.e., all the investigated PFAS, except FOSA, which has a pH-dependent charge within the pH range of the present study (3.5–6.5). The pKa of FOSA has been estimated to be 6.24 [53], i.e., FOSA will mainly exist as a neutral molecule below this pH and as a negatively charged molecule above this pH. This might explain the lower solubility of FOSA found in deionized water compared to that in 1 mM CaCl2 for the Arboga soil since the pH was lower in the former leachant (4.7) than in the latter (6.4) (Table S3).

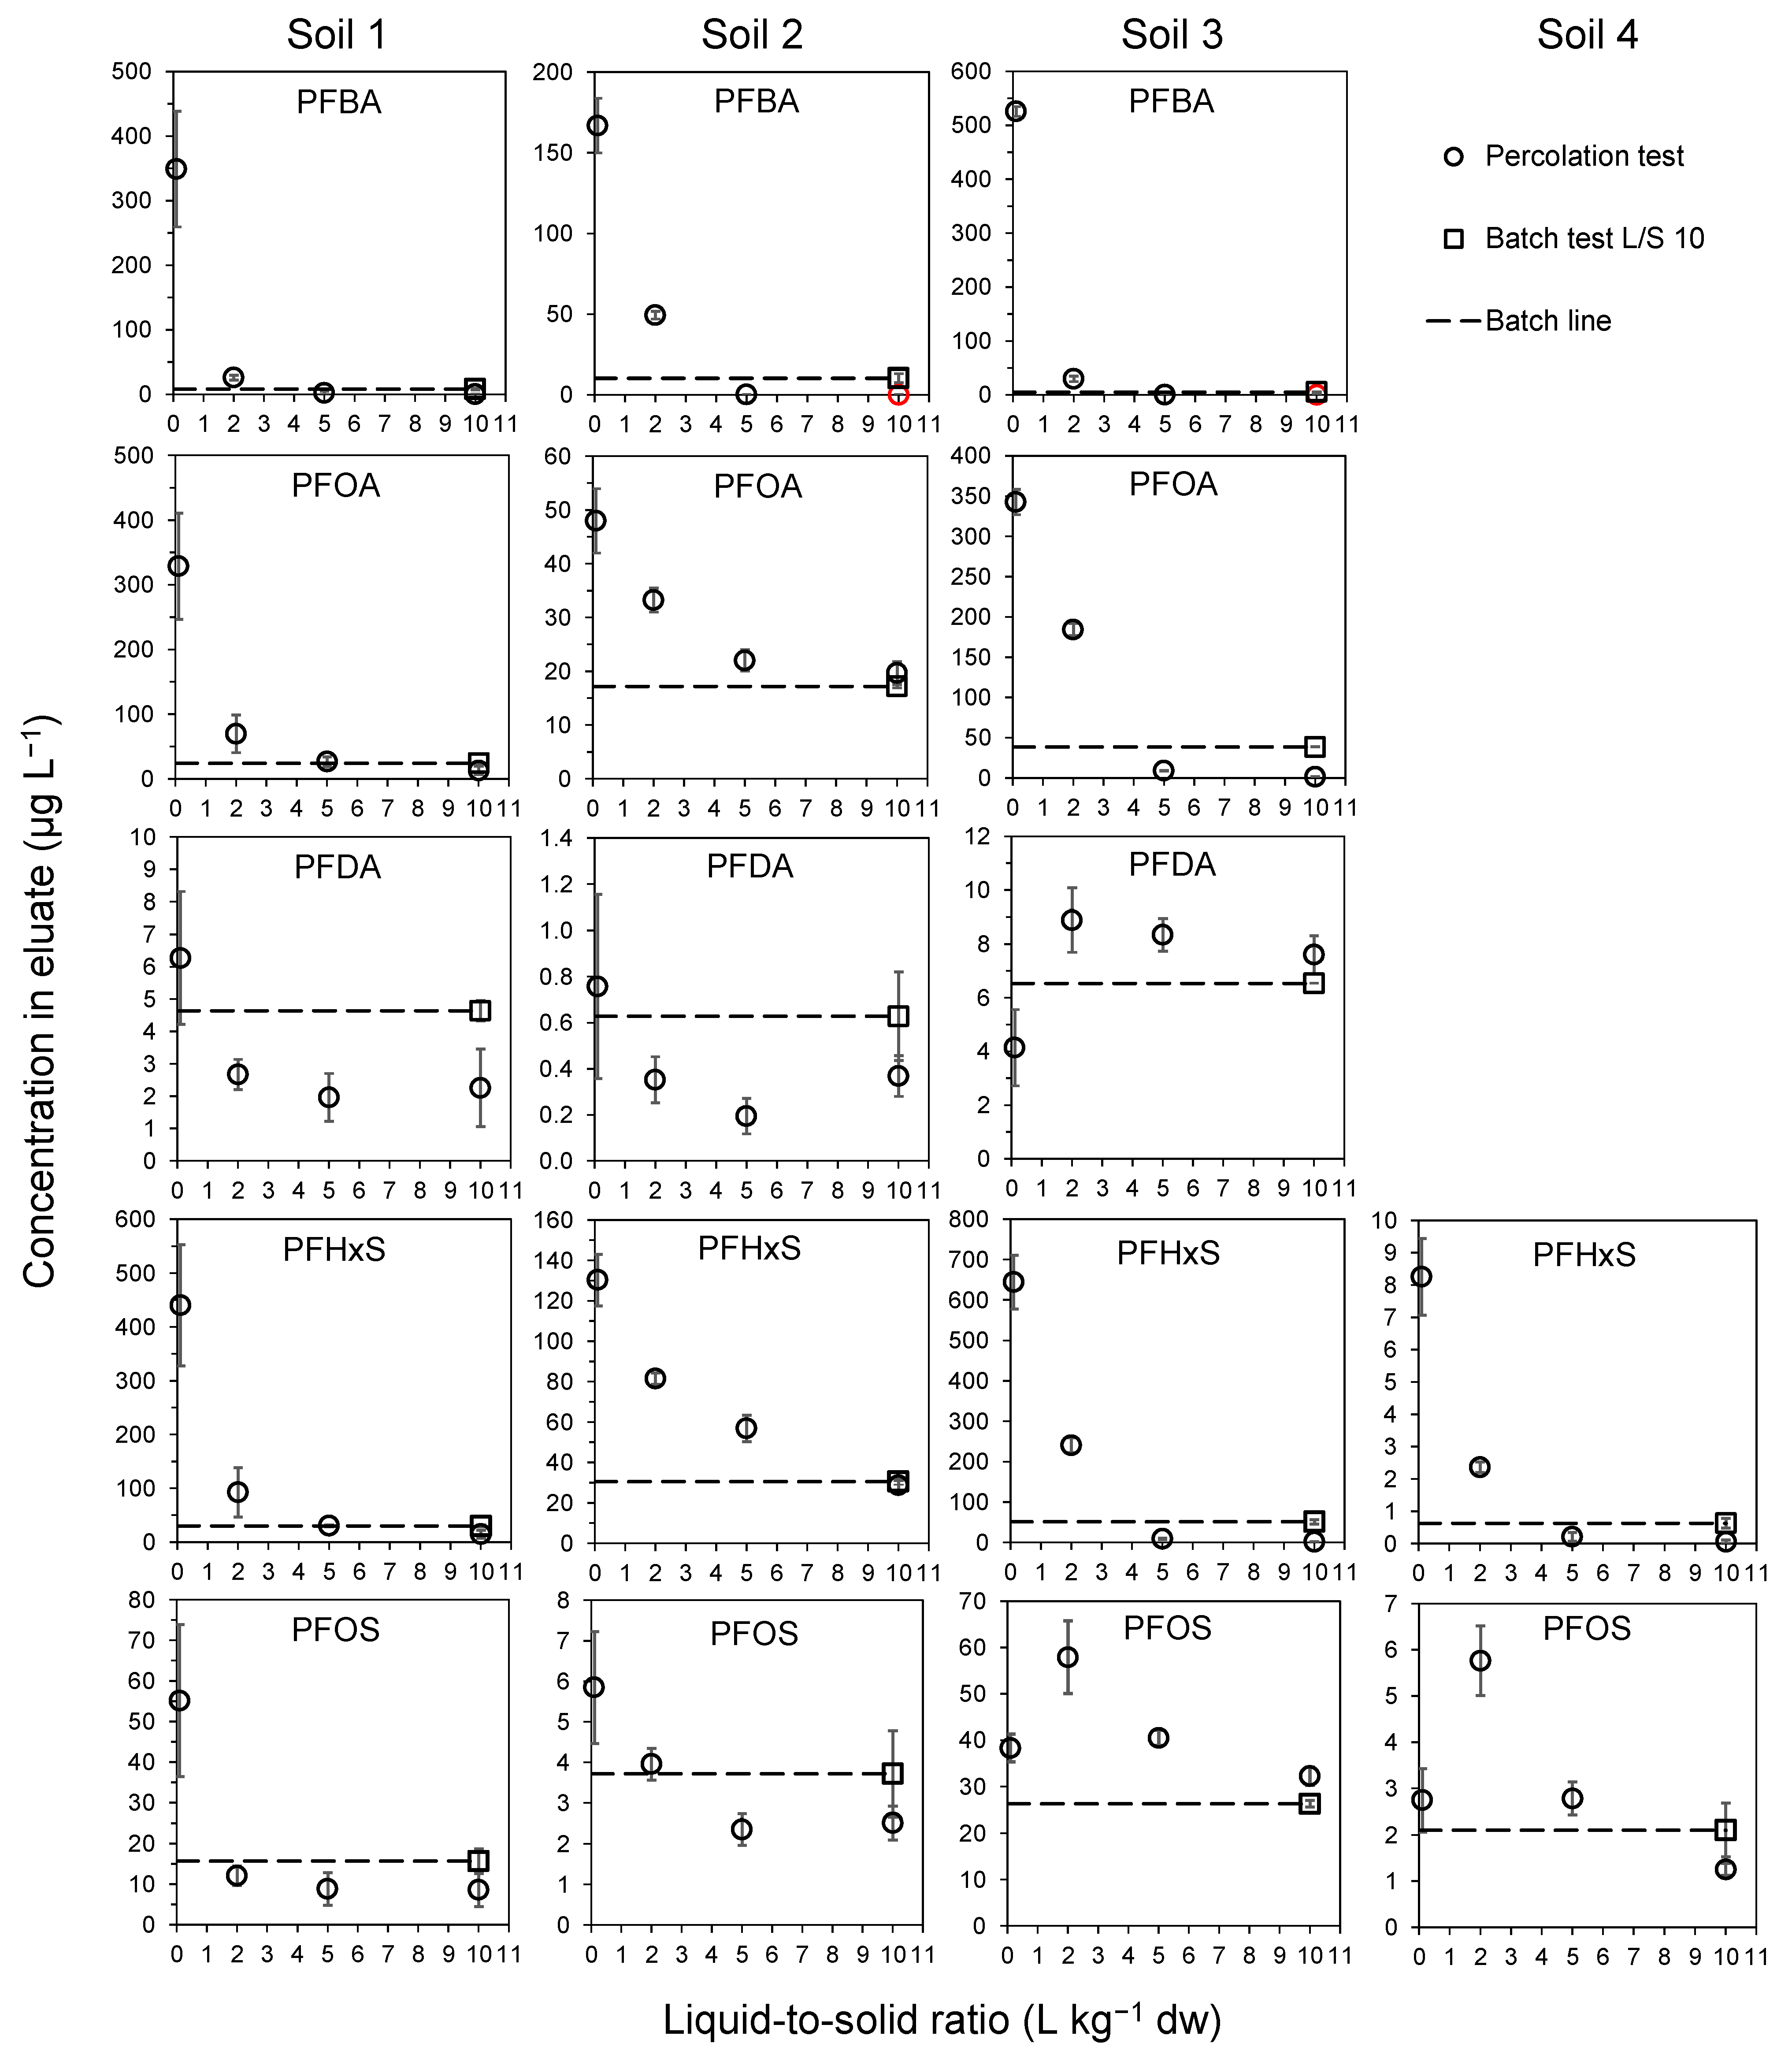
3.3. Up-Flow Percolation Test ISO 21268-3

The leaching behaviour differed markedly between different PFAS compounds and varied between the different soils (Figure 3 and Figure S3). The concentrations of short-chained PFAS, such as PFBA, PFHxA, PFHpA, and PFBS, decreased rapidly between L/S 0.1 and 2. For these four compounds, more than 92, 87, 76, and 82%, respectively, of the total mass leached at L/S 10 was already leached at L/S 2. In comparison, the corresponding amount of PFOS leached at L/S 2 ranged between 29 and 38% for the four samples. The rapid decline in concentrations of short-chain PFAS in column leaching tests is in accordance with what has been found in other studies [27,54,55], which is consistent with low Kd values that have been found for these compounds [8,10,31]. In Figure 4, the leaching behaviour of compounds with different Kd values is illustrated using the one-dimensional advection–dispersion model, assuming local equilibrium in columns. These simulations indicate that concentrations in eluates would approach zero at L/S 10 for Kd = 5 L kg−1 or less. Simulations also showed that concentration in eluates is expected to be constant up to L/S 10 for Kd > ~15 L kg−1. Thus, the general leaching behaviour of PFAS compounds observed in the percolation test is consistent with what could be expected from the modelling outcome, with less strong concentration dependency with L/S for more strongly adsorbed PFAS, such as PFOS (except Soil 1), PFDA, PFNA, PFUnDA, and PFDoDA (Figure 3 and Figure S3). However, the slight increase in PFOS concentration at L/S 0.1–2 for the two Arboga soils (Soils 3 and 4) cannot be explained with equilibrium chemistry. Notably, the two soils behaved similarly, although one of them was field-contaminated and mixed with quartz sand (38 wt% soil) prior to leaching, and the other was laboratory-spiked and leached without mixing of quartz sand. Both soils were clay soils, with the field-contaminated soil being slightly higher in clay (50%) than the laboratory-spiked soil (29%). A similar increase in the concentration of PFOS in the second eluate fraction was observed by Høisæter and Breedveld [54] in an up-flow percolation test with two Norwegian sandy soils. The phenomenon is hard to explain, but could possibly be related to some initial disturbance caused by sample pretreatment and packing of columns, which could be more critical for some soils than others. However, the general interpretation of data was not affected by this phenomenon in our study.
As illustrated in Figure 5a, the cumulative amount of PFAS in the soils that leached at L/S 10 decreased with increasing perfluorinated chain length, whereas PFAS with a chain length ≤ 6 were leached almost completely. The unexpectedly low leached fraction of PFBS in Soil 1 (60%) was probably caused by an overestimate of the initial soil concentration. This is supported by the uncertainties shown in Table 3 for the analysis of soil concentrations of PFAS, which sometimes were high. For PFBS in Soil 1, the range was 63% of the average value. Values >100% are obviously erroneous and can also be ascribed to analytical uncertainties [56]. For less mobile PFAS with leached fractions less than ~50%, the up-flow percolation test and batch test leached approximately the same amount of PFAS at L/S 10. However, for compounds with higher mobility, more PFAS was leached in the percolation test (Figure 5b). This behaviour is consistent with behaviour based on equilibrium chemistry, as illustrated by modelled leached fractions in the percolation test and calculated theoretical eluate concentrations in the batch test (Table 4). In the percolation test, fresh solution is continuously pumped through the column, whereas in the batch test, the leched amount is governed by equilibrium solid–solution partitioning at L/S 10. As a result, the continuous leaching will have a greater impact on the low-Kd compounds as compared to the ones with high Kd values. In contrast to the results obtained in our study, Kalbe et al. [55] found that the batch test released more shorter-chain PFAS than in the percolation test in a study comparing the leaching of PFAS from four field contaminated soils. The higher release in the batch test in that study was ascribed to artefacts related to the agitation step, such as colloidal mobilisation and possible friction between soil particles.

3.4. Determining Solid–Solution Partitioning (Kd) of PFAS in Percolation and Batch Tests

All calculated Kd values are summarised in Table 5, and a comparison between Kd values obtained in the up-flow percolation test (1 mM CaCl2) and the batch test (1 mM CaCl2) is given in Figure 6. The PFAS included in the study represented a wide range of Kd values, spanning more than three orders of magnitude (<1–2800). Log Kd values increased linearly with perfluoroalkyl chain length for PFCAs C6–C11 (Figure S4) and PFSAs C4, C6, and C8 (Figure S5), indicating that van der Waals effects, such as hydrophobic interactions, governed their overall partitioning. In contrast, for short-chained PFAS, there was no evident relationship between chain length and log Kd values, which suggests that other types of interactions (e.g., ion exchange) may be relatively more important for the retention of these compounds [8,13].
In general, there was good correspondence between the Kd values obtained from the two leaching tests (Figure 6 and Table 5). One trend observed was that lower Kd values were obtained from the up-flow percolation test than from the batch test for short-chain PFAS with Kd < 1 (percolation test). Since this phenomenon was restricted to short-chain PFAS, it is unlikely that it could be related to a longer duration for equilibrium adjustment due to the pre-equilibration time (24 h). More likely, it was due to overestimation of the concentration of PFAS in the first eluate (L/S 0–0.1). As shown by Liu et al. [57], using model simulations of initial concentration profiles in the up-flow percolation test, the concentration of very soluble compounds with Kd < 1, will be enriched in the top of the column caused by the upward movement of these compounds during the initial water saturation of the column. Hence, for PFAS compounds with Kd < 1, the batch test would, at least in theory, give more accurate estimates of Kd for these compounds. However, care must be taken when interpreting Kd data for weakly adsorbing compounds in batch experiments due to the low adsorbed concentrations. Assuming a linear adsorption isotherm (Kd), and equilibrium conditions, the fraction of PFAS sorbed by soil particles is given as follows:
C s C s , i n i t i a l = K d L S + K d
where Cs is the sorbed concentration (µg kg−1) at equilibrium and Cs,initial is the initial concentration of PFAS in the soil (µg kg−1) (see Equation (3)). According to Equation (9), a Kd value of 10 will give a fraction of sorbed PFAS of 0.5 at L/S 10. The corresponding figure for Kd = 1 is 0.09 and for Kd = 0.5, only 0.05. Hence, for PFAS with low Kd values, a low L/S is recommended when assessing Kd values in batch tests, e.g., ISO 21268-1:2019 [58], where L/S 2 is used, or U.S. EPA Method 1316 [59], where a range of L/S in the interval 0.5 to 10 is used.
In the column test, the accuracy of Kd calculations is affected by uncertainties in the mass balance calculations of sorbed PFAS concentrations in each leaching step. However, one advantage of this test procedure is that a wide range of L/S is obtained in one test run. As illustrated in Figure 6, fewer data are being reported for PFAS compounds with low Kd values at L/S > 2, either because eluate concentrations were less than LoQ, or mass balance calculations resulted in negative solid-phase concentrations (Table 5). Another potential source of error in Kd calculations is caused by overestimating the initial soil concentration of PFAS. This will particularly affect the group of PFAS with high mobility (≤C6), where a large fraction of the initial concentration (amount) will be leached during the test. In such a situation, the sorbed concentration (or rather the concentration resident in the column) obtained from mass balance calculation will asymptotically reach a value that is equal to the difference between the analytically determined (too high) value and the true value. At the same time, the concentration in the eluate will gradually decrease and approach the LoQ. As a result, the calculated Kd values will become increasingly overestimated with increasing L/S. Values judged to be substantially affected by this source of error are indicated in bold in Table 4 and are excluded from Figure 6. Notably, the variation observed in calculated average Kd values reported in Table 5 is mainly due to uncertainties in measured individual eluate concentrations of PFAS, since the same (average) soil concentration was used as input in calculations of the individual Kd values (Equation (6)).
As shown in the kinetic batch test, desorption kinetics was fast for all the investigated PFAS compounds and equilibrium was attained within 24 h (Figure 1). Based on the generally good agreement between the Kd values derived from batch test and percolation test data (Figure 6 and Table 5), it is reasonable to assume that local equilibrium also was attained in the percolation test columns. As a reference, the calculated contact time in columns ranged between 12 h (L/S 2–5 and 5–10) and 25 h (L/S 0–0.1), assuming a porosity of 40% [54]. The assumption of local equilibrium in percolation tests, at standard conditions, is also supported by results obtained by Röhler et al. [46], who successfully fitted percolation test data for PFOA and PFOS with an advection–dispersion model based on local equilibrium.
In calculating Kd values from the percolation test data, we assumed that the eluate concentration of PFAS in one L/S interval could be related to the average total concentration of PFAS in the columns (as an estimate of the average concentration of sorbed PFAS) in that interval, according to Equation (5). To test this assumption, we performed model simulations of hypothetical up-flow percolation test experiments using the advection–dispersion model for different Kd values and L/S intervals. The output data from these simulations were used in a subsequent step as input to Equation (5) to calculate model-generated Kd values. A comparison between the Kd values used as input in the simulations and the calculated Kd values is shown in Table 6. Only data for Kd > 1 are being reported, because the initial condition adopted (constant concentration of PFAS with depth in column) is not valid for compounds with Kd < 1 [57]. In general, the modelling exercise gives support to the assumptions made in Equation (5) to calculate Kd values from percolation test data. For the first two leached fractions (0–0.1 and 0.1–2), the calculated Kd values corresponded well with the “real” Kd values for all the examined Kd values. For strongly sorbing PFAS (Kd ≥ 50), this was true for all leached fractions, which can be explained by constant eluate concentrations (Figure 4) and relatively small changes in the concentration of PFAS in the column.

4. Conclusions

For all four soils investigated, our results showed that equilibrium conditions were achieved in both the batch test ISO 21268-2:2019 [23] and in the up-flow percolation test ISO 21268-3:2019 [24], at conditions specified in the two standard protocols. The PFAS compounds included in this study represented compounds with solid–solution partitioning coefficients (Kd) covering a range of more than three orders of magnitude.
In the batch test ISO 21268-2:2019, either deionized water or 1 mM CaCl2 can be used as a leachant. Both leachants provided the same solubility for short-chain PFAS with a perfluorinated carbon chain ≤ 6. For PFAS with longer chain length, 1 mM CaCl2 resulted in a slightly lower solubility, probably due to charge neutralization by Ca2+ binding to soil particles. Hence, in risk assessments, deionized water might be preferred for conservative estimates of PFAS solubility. However, 1 mM CaCl2 probably gives the most field-relevant estimate of PFAS solubility. Notably, leaching tests in general give information on solid–solution partitioning of PFAS, i.e., the mobility at saturated conditions. At unsaturated conditions, sorption to the air–water interface might also contribute to the retention of PFAS (e.g., Ref. [60])
Calculation of Kd values for PFAS from batch leaching data is straightforward and has been made in numerous published studies (e.g., [10,12,30,31]). In contrast, there is no established procedure to calculate Kd values from percolation test data. The approach proposed in this work is supported both by the generally good correspondence with Kd values calculated from batch test data and by a theoretical evaluation using dynamic modelling. However, for very soluble PFAS with Kd < 1, the up-flow percolation test is probably not suitable for calculating Kd values due to erroneously high estimates of the concentrations in the initial eluate and the rapid depletion of these compounds in the column. We recommend Kd calculation using the proposed methodology to be included as part of a standard evaluation of data obtained from up-flow percolation tests. This will provide information on possible changes in solubility (Kd) with the degree of leaching, which would be of importance when forecasting future leaching behaviour in risk assessments of PFAS leaching and transport.
In standard risk assessment protocols, the batch leaching test is expected to be the most commonly used method for site-specific risk assessments of PFAS leaching. To accurately estimate Kd values using this method, the L/S must be adapted to the expected Kd values of the compounds and samples of interest. For weakly adsorbing compounds (Kd < 1), an L/S of 2 or lower is recommended.

Supplementary Materials

The following supporting information can be downloaded at: https://www.mdpi.com/article/10.3390/environments12060179/s1, Description of the modelling using the one-dimensional advection–dispersion model; Figure S1: Comparison of batch tests with 1 mM CaCl2 and deionized water as leachates; Figure S2: Concentration of PFAS in eluates obtained in the percolation test at different L/S, as compared to eluate concentrations obtained in the batch test at L/S 10; Figure S3: Calculated Kd values for perfluorinated carboxylic acids as a function of perfluoroalkyl chain length using batch test and percolation test data; Figure S4: Calculated Kd values for perfluorinated sulfonates (and FOSA) as a function of perfluoroalkyl chain length using batch test and percolation test data; Table S1: The level of quantification (LoQ) for PFAS in eluates; Table S2: Average pH, conductivity, and PFAS concentrations in the kinetic batch test eluates; Table S3: Average pH, conductivity, and PFAS concentrations in the kinetic batch test eluates; Table S4: Average pH, conductivity, and PFAS concentrations in percolation test eluates.

Author Contributions

D.B.K.: conceptualization, formal analysis, writing—original draft preparation; H.C.-P.: conceptualization, methodology, investigation, writing—review and editing; J.K.-M.: conceptualization, methodology, investigation, writing—review and editing; M.P.: conceptualization, formal analysis, software, writing—review and editing; O.G.: methodology, writing—review and editing; A.E.: conceptualization, formal analysis, funding acquisition, project administration, writing—review and editing. All authors have read and agreed to the published version of the manuscript.

Funding

This research was funded by the Swedish Geotechnical Institute (project no: 10061-300044).

Data Availability Statement

Original data are available from the Swedish National Data Service’s (SND) research data catalogue (Researchdata.se) or from https://doi.org/10.5878/x1xj-8a46.

Acknowledgments

Björn Bonnet at the Department of Aquatic Sciences and Assessment, SLU, is acknowledged for analysing PFAS concentrations in soil samples; Matilda Johansson at the Swedish Geotechnical Institute for assistance with figure preparation; and Mark Elert at Kemakta konsult AB for helpful advice on modelling the leaching behaviour of solutes in percolation tests.

Conflicts of Interest

The authors declare no conflicts of interest.

References

  1. Rankin, K.; Mabury, S.A.; Jenkins, T.M.; Washington, J.W. A North American and Global Survey of Perfluoroalkyl Substances in Surface Soils: Distribution Patterns and Mode of Occurrence. Chemosphere 2016, 161, 333–341. [Google Scholar] [CrossRef] [PubMed]
  2. Brusseau, M.L.; Anderson, R.H.; Guo, B. PFAS Concentrations in Soils: Background Levels versus Contaminated Sites. Sci. Total Environ. 2020, 740, 140017. [Google Scholar] [CrossRef] [PubMed]
  3. Grunfeld, D.A.; Gilbert, D.; Hou, J.; Jones, A.M.; Lee, M.J.; Kibbey, T.C.G.; O’Carroll, D.M. Underestimated Burden of Per- and Polyfluoroalkyl Substances in Global Surface Waters and Groundwaters. Nat. Geosci. 2024, 17, 340–346. [Google Scholar] [CrossRef]
  4. Filipovic, M.; Woldegiorgis, A.; Norström, K.; Bibi, M.; Lindberg, M.; Österås, A.H. Historical Usage of Aqueous Film Forming Foam: A Case Study of the Widespread Distribution of Perfluoroalkyl Acids from a Military Airport to Groundwater, Lakes, Soils and Fish. Chemosphere 2015, 129, 39–45. [Google Scholar] [CrossRef] [PubMed]
  5. Gobelius, L.; Hedlund, J.; Dürig, W.; Tröger, R.; Lilja, K.; Wiberg, K.; Ahrens, L. Per-and Polyfluoroalkyl Substances in Swedish Groundwater and Surface Water: Implications for Environmental Quality Standards and Drinking Water Guidelines. Environ. Sci. Technol. 2018, 52, 4340–4349. [Google Scholar] [CrossRef]
  6. Glüge, J.; Scheringer, M.; Cousins, I.T.; Dewitt, J.C.; Goldenman, G.; Herzke, D.; Lohmann, R.; Ng, C.A.; Trier, X.; Wang, Z. An Overview of the Uses of Per-And Polyfluoroalkyl Substances (PFAS). Environ. Sci. Process. Impacts. 2020, 22, 2345–2373. [Google Scholar] [CrossRef]
  7. Li, S.; Oliva, P.; Zhang, L.; Goodrich, J.A.; McConnell, R.; Conti, D.V.; Chatzi, L.; Aung, M. Associations between Per-and Polyfluoroalkyl Substances (PFAS) and County-Level Cancer Incidence between 2016 and 2021 and Incident Cancer Burden Attributable to PFAS in Drinking Water in the United States. J. Expo. Sci. Environ. Epidemiol. 2025, 35, 425–436. [Google Scholar] [CrossRef]
  8. Guelfo, J.L.; Higgins, C.P. Subsurface Transport Potential of Perfluoroalkyl Acids at Aqueous Film-Forming Foam (AFFF)-Impacted Sites. Environ. Sci. Technol. 2013, 47, 4164–4171. [Google Scholar] [CrossRef]
  9. Guelfo, J.L.; Korzeniowski, S.; Mills, M.A.; Anderson, J.; Anderson, R.H.; Arblaster, J.A.; Conder, J.M.; Cousins, I.T.; Dasu, K.; Henry, B.J.; et al. Environmental Sources, Chemistry, Fate, and Transport of Per- and Polyfluoroalkyl Substances: State of the Science, Key Knowledge Gaps, and Recommendations Presented at the August 2019 SETAC Focus Topic Meeting. Environ. Toxicol. Chem. 2021, 40, 3234–3260. [Google Scholar] [CrossRef]
  10. Nguyen, T.M.H.; Bräunig, J.; Thompson, K.; Thompson, J.; Kabiri, S.; Navarro, D.A.; Kookana, R.S.; Grimison, C.; Barnes, C.M.; Higgins, C.P.; et al. Influences of Chemical Properties, Soil Properties, and Solution PH on Soil-Water Partitioning Coefficients of Per- And Polyfluoroalkyl Substances (PFASs). Environ. Sci. Technol. 2020, 54, 15883–15892. [Google Scholar] [CrossRef]
  11. Mejia-Avendaño, S.; Zhi, Y.; Yan, B.; Liu, J. Sorption of Polyfluoroalkyl Surfactants on Surface Soils: Effect of Molecular Structures, Soil Properties, and Solution Chemistry. Environ. Sci. Technol. 2020, 54, 1513–1521. [Google Scholar] [CrossRef] [PubMed]
  12. Milinovic, J.; Lacorte, S.; Vidal, M.; Rigol, A. Sorption Behaviour of Perfluoroalkyl Substances in Soils. Sci. Total Environ. 2015, 511, 63–71. [Google Scholar] [CrossRef] [PubMed]
  13. Brusseau, M.L. Differential Sorption of Short-Chain versus Long-Chain Anionic Per- and Poly-Fluoroalkyl Substances by Soils. Environments 2023, 10, 175. [Google Scholar] [CrossRef]
  14. Campos-Pereira, H.; Kleja, D.B.; Ahrens, L.; Enell, A.; Kikuchi, J.; Pettersson, M.; Gustafsson, J.P. Effect of PH, Surface Charge and Soil Properties on the Solid–Solution Partitioning of Perfluoroalkyl Substances (PFASs) in a Wide Range of Temperate Soils. Chemosphere 2023, 321, 138133. [Google Scholar] [CrossRef] [PubMed]
  15. Johnson, R.L.; Anschutz, A.J.; Smolen, J.M.; Simcik, M.F.; Penn, R.L. The Adsorption of Perfluorooctane Sulfonate onto Sand, Clay, and Iron Oxide Surfaces. J. Chem. Eng. Data 2007, 52, 1165–1170. [Google Scholar] [CrossRef]
  16. Campos-Pereira, H.; Kleja, D.B.; Sjöstedt, C.; Ahrens, L.; Klysubun, W.; Gustafsson, J.P. The Adsorption of Per- and Polyfluoroalkyl Substances (PFASs) onto Ferrihydrite Is Governed by Surface Charge. Environ. Sci. Technol. 2020, 54, 15722–15730. [Google Scholar] [CrossRef]
  17. Shafique, U.; Dorn, V.; Paschke, A.; Schüürmann, G. Adsorption of Perfluorocarboxylic Acids at the Silica Surface. Chem. Commun. 2017, 53, 589–592. [Google Scholar] [CrossRef]
  18. Knight, E.R.; Janik, L.J.; Navarro, D.A.; Kookana, R.S.; McLaughlin, M.J. Predicting Partitioning of Radiolabelled 14C-PFOA in a Range of Soils Using Diffuse Reflectance Infrared Spectroscopy. Sci. Total Environ. 2019, 686, 505–513. [Google Scholar] [CrossRef]
  19. AS 4439-3:2019; Wastes, Sediments and Contaminated Soils, Part 3. Preparation of Leachates-Bottle Leaching Procedure. Standards Australia: Sydney, Australia, 2019.
  20. USEPA. Method 1311: Toxicity Characteristic Leaching Procedure; United State Environmental Protection Agency (USEPA): Washington, DC, USA; Research Triangle Park: Durham, NC, USA, 1992.
  21. USEPA. Method 1320: Multiple Extraction Procedure. EPA SW-846: Test Methods for Evaluating Solid Waste, Physical/Chemical Methods; United State Environmental Protection Agency (USEPA): Washington, DC, USA; Research Triangle Park: Durham, NC, USA, 1992.
  22. USEPA. Method 1314: Liquid-Solid Partitioning as a Function of Liquid-Solid Ratio for Constituents in Solid Materials Using an Up-Flow Percolation Column Procedure; United State Environmental Protection Agency (USEPA): Washington, DC, USA; Research Triangle Park: Durham, NC, USA, 2017.
  23. ISO 21268-2:2019; Soil Quality—Leaching Procedures for Subsequent Chemical and Ecotoxicological Testing of Soil and Soil-like Materials Part 2: Batch Test Using a Liquid to Solid Ratio of 10 l/Kg Dry Matter. The International Organization for Standardization: Geneva, Switzerland, 2019.
  24. ISO 21268-3:2019; Soil Quality—Leaching Procedures for Subsequent Chemical and Ecotoxicological Testing of Soil and Soil-like Materials Part 3: Up-Flow Percolation Test. The International Organization for Standardization: Geneva, Switzerland, 2019.
  25. Löv, Å.; Larsbo, M.; Sjöstedt, C.; Cornelis, G.; Gustafsson, J.P.; Kleja, D.B. Evaluating the Ability of Standardised Leaching Tests to Predict Metal(Loid) Leaching from Intact Soil Columns Using Size-Based Elemental Fractionation. Chemosphere 2019, 222, 453–460. [Google Scholar] [CrossRef]
  26. Grathwohl, P.; Susset, B. Comparison of Percolation to Batch and Sequential Leaching Tests: Theory and Data. Waste Manag. 2009, 29, 2681–2688. [Google Scholar] [CrossRef]
  27. Kabiri, S.; Tucker, W.; Navarro, D.A.; Bräunig, J.; Thompson, K.; Knight, E.R.; Nguyen, T.M.H.; Grimison, C.; Barnes, C.M.; Higgins, C.P.; et al. Comparing the Leaching Behavior of Per- and Polyfluoroalkyl Substances from Contaminated Soils Using Static and Column Leaching Tests. Environ. Sci. Technol. 2022, 56, 368–378. [Google Scholar] [CrossRef] [PubMed]
  28. van Glubt, S.; Brusseau, M.L.; Yan, N.; Huang, D.; Khan, N.; Carroll, K.C. Column versus Batch Methods for Measuring PFOS and PFOA Sorption to Geomedia. Environ. Pollut. 2021, 268, 115917. [Google Scholar] [CrossRef] [PubMed]
  29. Aly, Y.H.; McInnis, D.P.; Lombardo, S.M.; Arnold, W.A.; Pennell, K.D.; Hatton, J.; Simcik, M.F. Enhanced Adsorption of Perfluoro Alkyl Substances for in Situ Remediation. Environ. Sci. Water Res. Technol. 2019, 5, 1867–1875. [Google Scholar] [CrossRef]
  30. Higgins, C.P.; Luthy, R.G. Sorption of Perfluorinated Surfactants on Sediments. Environ. Sci. Technol. 2006, 40, 7251–7256. [Google Scholar] [CrossRef]
  31. Campos Pereira, H.; Ullberg, M.; Kleja, D.B.; Gustafsson, J.P.; Ahrens, L. Sorption of Perfluoroalkyl Substances (PFASs) to an Organic Soil Horizon—Effect of Cation Composition and pH. Chemosphere 2018, 207, 183–191. [Google Scholar] [CrossRef] [PubMed]
  32. ISO 10390:2021; Soil, Treated Biowaste and Sludge—Determination of pH. The International Organization for Standardization: Geneva, Switzerland, 2021.
  33. ISO 11277:2020; Soil Quality—Determination of Particle Size Distribution in Mineral Soil Material—Method by Sieving and Sedimentation. The International Organization for Standardization: Geneva, Switzerland, 2020.
  34. Martz, M.; Heil, J.; Marschner, B.; Stumpe, B. Effects of Soil Organic Carbon (SOC) Content and Accessibility in Subsoils on the Sorption Processes of the Model Pollutants Nonylphenol (4-n-NP) and Perfluorooctanoic Acid (PFOA). Sci. Total Environ. 2019, 672, 162–173. [Google Scholar] [CrossRef]
  35. EN 1484:1997; Water Analysis—Guidelines for the Determination of Total Organic Carbon (TOC) and Dissolved Organic Carbon (DOC). CEN, The European Committee for Standardization: Brussels, Belgium, 1997.
  36. ISO 11885:2007; Water Quality—Determination of Selected Elements by Inductively Coupled Plasma Optical Emission Spectrometry (ICP-OES). The International Organization for Standardization: Geneva, Switzerland, 2007.
  37. ISO 10304-1:2007; Water Quality—Determination of Dissolved Anions by Liquid Chromatography of Ions Part 1: Determination of Bromide, Chloride, Fluoride, Nitrate, Nitrite, Phosphate and Sulfate. The International Organization for Standardization: Geneva, Switzerland, 2007.
  38. Lath, S.; Knight, E.R.; Navarro, D.A.; Kookana, R.S.; McLaughlin, M.J. Sorption of PFOA onto Different Laboratory Materials: Filter Membranes and Centrifuge Tubes. Chemosphere 2019, 222, 671–678. [Google Scholar] [CrossRef]
  39. Sörengård, M.; Franke, V.; Tröger, R.; Ahrens, L. Losses of Poly- and Perfluoroalkyl Substances to Syringe Filter Materials. J Chromatogr A 2020, 1609, 460430. [Google Scholar] [CrossRef]
  40. Higgins, C.P.; Field, J.A.; Criddle, C.S.; Luthy, R.G. Quantitative Determination of Perfluorochemicals in Sediments and Domestic Sludge. Environ. Sci. Technol. 2005, 39, 3946–3956. [Google Scholar] [CrossRef]
  41. Ahrens, L.; Yamashita, N.; Yeung, L.W.Y.; Taniyasu, S.; Horii, Y.; Lam, P.K.S.; Ebinghaus, R. Partitioning Behavior of Per- and Polyfluoroalkyl Compounds between Pore Water and Sediment in Two Sediment Cores from Tokyo Bay, Japan. Environ. Sci. Technol. 2009, 43, 6969–6975. [Google Scholar] [CrossRef]
  42. Sörengård, M.; Kikuchi, J.; Wiberg, K.; Lutz, A. Spatial Distribution and Load of Per- and Polyfluoroalkyl Substances (PFAS) in Background Soils in Sweden. Chemosphere 2022, 295, 133944. [Google Scholar] [CrossRef]
  43. van Genuchten, M.T.; Leij, F.J.; Skaggs, T.H.; Toride, N.; Bradford, S.A.; Pontedeiro, E.M. Exact Analytical Solutions for Contaminant Transport in Rivers 1. The Equilibrium Advection-Dispersion Equation. J. Hydrol. Hydromech. 2013, 61, 146–160. [Google Scholar] [CrossRef]
  44. Ramírez-Sabag, J.; López-Falcón, D.A. How To Use Solutions of Advection-Dispersion Equation to Describe Reactive Solute Transport Through Porous Media. Geofis. Int. 2021, 60, 229–240. [Google Scholar] [CrossRef]
  45. van Genuchten, M.T.; Alves, W.J. Analytical Solutions of the One-Dimensional Convective-Dispersive Solute Transport Equation. In Technical Bulletin Number 1661 United States Department of Agriculture; USDA: Washington, DC, USA, 1982. Available online: https://www.ars.usda.gov/arsuserfiles/20361500/pdf_pubs/P0753.pdf (accessed on 20 May 2025).
  46. Röhler, K.; Haluska, A.A.; Susset, B.; Liu, B.; Grathwohl, P. Long-Term Behavior of PFAS in Contaminated Agricultural Soils in Germany. J. Contam. Hydrol. 2021, 241, 103812. [Google Scholar] [CrossRef] [PubMed]
  47. Parfitt, R.L.; Childs, C.W. Estimation of Forms of Fe and Al—A Review, and Analysis of Contrasting Soils by Dissolution and Mossbauer Methods. Soil Res. 1988, 26, 121–144. [Google Scholar] [CrossRef]
  48. Cousins, I.T.; Dewitt, J.C.; Glüge, J.; Goldenman, G.; Herzke, D.; Lohmann, R.; Ng, C.A.; Scheringer, M.; Wang, Z. The High Persistence of PFAS Is Sufficient for Their Management as a Chemical Class. Environ. Sci. Process. Impacts 2020, 22, 2307–2312. [Google Scholar] [CrossRef] [PubMed]
  49. Zhi, Y.; Liu, J. Sorption and Desorption of Anionic, Cationic and Zwitterionic Polyfluoroalkyl Substances by Soil Organic Matter and Pyrogenic Carbonaceous Materials. Chem. Eng. J. 2018, 346, 682–691. [Google Scholar] [CrossRef]
  50. Borthakur, A.; Olsen, P.; Dooley, G.P.; Cranmer, B.K.; Rao, U.; Hoek, E.M.V.; Blotevogel, J.; Mahendra, S.; Mohanty, S.K. Dry-Wet and Freeze-Thaw Cycles Enhance PFOA Leaching from Subsurface Soils. J. Hazard. Mater. Lett. 2021, 2, 100029. [Google Scholar] [CrossRef]
  51. Erkoç, Ş.; Erkoç, F. Structural and Electronic Properties of PFOS and LiPFOS. J. Mol. Struct. Theochem. 2001, 549, 289–293. [Google Scholar] [CrossRef]
  52. Xiao, F.; Zhang, X.; Penn, L.; Gulliver, J.S.; Simcik, M.F. Effects of Monovalent Cations on the Competitive Adsorption of Perfluoroalkyl Acids by Kaolinite: Experimental Studies and Modeling. Environ. Sci. Technol. 2011, 45, 10028–10035. [Google Scholar] [CrossRef]
  53. Rayne, S.; and Forest, K. A New Class of Perfluorinated Acid Contaminants: Primary and Secondary Substituted Perfluoroalkyl Sulfonamides Are Acidic at Environmentally and Toxicologically Relevant pH Values. J. Environ. Sci. Health Part A 2009, 44, 1388–1399. [Google Scholar] [CrossRef] [PubMed]
  54. Høisæter, Å.; Breedveld, G.D. Leaching Potential of Per- and Polyfluoroalkyl Substances from Source Zones with Historic Contamination of Aqueous Film Forming Foam—A Surfactant Mixture Problem. Environ. Adv. 2022, 8, 100222. [Google Scholar] [CrossRef]
  55. Kalbe, U.; Piechotta, C.; Bandow, N. Comparing PFAS Analysis in Batch Leaching and Column Leaching Tests. Environ. Sci. Pollut. Res. 2024, 31, 65233–65251. [Google Scholar] [CrossRef]
  56. Capitain, C.; Schüßler, M.; Bugsel, B.; Zweigle, J.; Vogel, C.; Leube, P.; Zwiener, C. Implementation of Matrix-Matched Semiquantification of PFAS in AFFF-Contaminated Soil. Environ. Sci. Technol. 2025, 59, 7338–7347. [Google Scholar] [CrossRef] [PubMed]
  57. Liu, B.; Finkel, M.; Grathwohl, P. Mass Transfer Principles in Column Percolation Tests: Initial Conditions and Tailing in Heterogeneous Materials. Materials 2021, 14, 4708. [Google Scholar] [CrossRef]
  58. ISO 21268-1:2019; Soil Quality—Leaching Procedures for Subsequent Chemical and Ecotoxicological Testing of Soil and Soil-like Materials Part 1: Batch Test Using a Liquid to Solid Ratio of 2 l/Kg Dry Matter. The International Organization for Standardization: Geneva, Switzerland, 2019.
  59. USEPA. Method 1316—Liquid-Solid Partitioning as a Function of Liquid-Solid Ratio Using a Parallel Batch Extraction Procedure; United State Environmental Protection Agency (USEPA): Washington, DC, USA; Research Triangle Park: Durham, NC, USA, 2017.
  60. Brusseau, M.L.; Yan, N.; Van Glubt, S.; Wang, Y.; Chen, W.; Lyu, Y.; Dungan, B.; Carroll, K.C.; Holguin, F.O. Comprehensive Retention Model for PFAS Transport in Subsurface Systems. Water Res. 2019, 148, 41–50. [Google Scholar] [CrossRef]
Figure 1. Desorption kinetics of different PFAS compounds in the batch test (1 mM CaCl2). Error bars represent one standard deviation (n = 3).
Environments 12 00179 g001
Figure 2. Comparison of batch tests with 1 mM CaCl2 (grey bars) and deionized water (blue bars) with 24 h equilibration time (see Figure S2 in the Supplementary Materials Section for compounds not shown here). Error bars represent standard deviation, and asterisks indicate statistical significance (No significance (NS), p < 0.05 *, p < 0.01 **, p < 0.005 ***) from paired t-tests (n = 3).
Environments 12 00179 g002
Figure 3. Concentration of selected PFAS compounds in eluates obtained in the percolation test (1 mM CaCl2) at different L/S. Although not directly comparable, eluate concentrations obtained in the batch test (1 mM CaCl2) at L/S 10 are given as reference values (see Figure S3 in the Supplementary Materials Section for compounds not shown here). Error bars indicate the standard deviation (n = 3). Values < LoQ (red circles) were set to LoQ/2 before the calculation of means.
Environments 12 00179 g003
Figure 4. Normalised concentration in eluates (relative initial concentration) of compounds with different Kd values as a function of L/S, obtained using the one-dimensional advection–dispersion model. See the Supplementary Materials Section for model assumptions and input data.
Environments 12 00179 g004
Figure 5. (a) Cumulatively leached amount (% of total initial amount) at L/S 10 in the percolation test (1 mM CaCl2), as a function of perfluoroalkyl chain length and PFAS subclass (average values, n = 3). (b) A comparison between the cumulative amount leached at L/S 10 in the percolation test (1 mM CaCl2) and the amount leached in the batch test at L/S 10 (24 h, 1 mM CaCl2) (average values, n = 3).
Environments 12 00179 g005
Figure 6. Relationships between Kd values obtained using the percolation test ISO 21268-3:2019 at four different L/S (0–0.1, 0.1–2, 2–5, and 5–10 L kg–1) and the batch test ISO 21268-2:2019 at L/S 10 (L kg–1). Both tests were conducted with 1 mM CaCl2. The solid line represents a 1:1 relationship. All data are given in Table 5.
Environments 12 00179 g006
Table 1. Soil samples and treatments.
SoilSiteSoil Type/HorizonTreatment
1PaskalampaSpodosol/ESpiking and aging
2PaskalampaSpodosol/BsSpiking and aging
3ArbogaCambisol/ASpiking and aging
4ArbogaCambisol/ANone (field contaminated)
Table 2. Selected soil properties.
SoilTOC (%) apH (H2O) bFeox c
(mmol kg−1)
Alox − Alp d
(mmol kg−1)
CEC e
(cmol+ kg–1)
Sand f (%)Silt f
(%)
Clay f
(%)
Textural
Class
11.14.62.51.91.853407Sandy loam
22.25.51305001.754424Sandy loam
31.35.5110318.6274429Clay
41.76.91304213242650Clay
a Organic carbon content determined by combustion and detection by infrared spectrophotometry; b Determined according to ISO 10390:2021 [32] at a liquid-to-soil ratio of 5 mL g−1 dw; c Oxalate-extractable iron (0.2 M oxalate, pH 3.0); d Difference between oxalate-extractable aluminium (0.2 M oxalate, pH 3.0) and pyrophosphate-extractable (0.1 M) aluminium; e Cation exchange capacity, determined with the hexaamminecobalt(III) chloride (CoHex) method, with correction for organic matter absorbance; f Determined according to ISO 11277:2020 [33] by laser diffraction.
Table 3. Mean total initial soil concentrations ± range (µg kg–1, n = 2). ND = not detected.
SoilSoil 1Soil 2Soil 3Soil 4
Compound
PFBA98 ± 68109 ± 27126 ± 71ND
PFHxA153 ± 23145 ± 31115 ± 43ND
PFHpA160 ± 81103 ± 9.7136 ± 10ND
PFOA521 ± 294323 ± 22452 ± 88ND
PFNA253 ± 89166 ± 44144 ± 174.1 ± 0.9
PFDA297 ± 87256 ± 66187 ± 1043.8 ± 3.3
PFUnDA394 ± 140295 ± 38356 ± 214ND
PFDoDA293 ± 89163 ± 121259 ± 142ND
PFBS681 ± 431415 ± 153597 ± 331ND
PFHxS676 ± 427405 ± 46568 ± 1226.0 ± 1.1
PFOS631 ± 238540 ± 72678 ± 2863 ± 8.1
FOSA445 ± 120316 ± 31373 ± 78ND
Table 4. Theoretically leached fractions of PFAS in the batch test at L/S 10 and percolation test at L/S 0–10. Values for the batch test were obtained using Equations (1)–(3), and the fraction of PFAS leached in the percolation test was obtained by the 1D advection–dispersion model (Supplementary Materials Section).
KdBatch (L/S 10)
(%)
Percolation (L/S 0–10)
(%)
191100
567100
105086
203349
501720
Table 5. Average Kd values ± one standard deviation (n = 3) calculated for each eluate fraction (L/S: 0–0.1, 0.1–2, 2–5 and 5–10) in the percolation test (ISO 21268-3) and the eluate at L/S 10 in the batch test (ISO 21268-2). “<0” indicates a negative calculated mass balance for the solid-phase concentration; “<LoQ” indicates a value in the eluate less than the limit of quantification. Figures in bold indicate uncertain values due to error propagation as a result of likely overestimated total initial soil concentrations of PFAS (see text for explanation).
SoilL/S
(L kg−1)
PFBAPFHxAPFHpAPFOAPFNAPFDAPFUnDAPFDoDAPFBSPFHxSPFOSFOSA
Soil 10–0.10.25 ± 0.090.40 ± 0.160.64 ± 0.251.6 ± 0.56.5 ± 1.651.7 ± 20.3368 ± 154729 ± 3060.77 ± 0.211.6 ± 0.512.3 ± 3.81826 ± 1065
0.1–21.6 ± 0.72.0 ± 1.33.6 ± 2.67.4 ± 4.826.8 ± 11.1112 ± 21479 ± 1081314 ± 7713.5 ± 1.58.0 ± 6.452.2 ± 11.9765 ± 324
2–510.7 ± 11.511.5 ± 5.812.1 ± 3.113.4 ± 7.941.7 ± 30.0167 ± 79672 ± 1463149 ± 105530.3 ± 20.213.7 ± 4.080.8 ± 48.6854 ± 553
5–10<LoQ29.7 ± 7.232.4 ± 14.520.5 ± 3.732.8 ± 17.9164 ± 1151037 ± 81<LoQ110 ± 4823.9 ± 4.682.8 ± 58.1715 ± 180
Batch (10)2.5 ± 2.22.3 ± 0.68.5 ± 2.511.5 ± 1.716.1 ± 2.754.2 ± 4.4219 ± 33952 ± 3925.0 ± 0.912.4 ± 1.231.3 ± 8.0256 ± 77
Soil 20–0.10.61 ± 0.070.84 ± 0.061.8 ± 0.26.8 ± 0.950.1 ± 13.3395 ± 1613468 ± 1140<LoQ0.89 ± 0.043.1 ± 0.395.6 ± 21.6<LoQ
0.1–2<01.0 ± 0.21.70.28.7 ± 0.776.7 ± 7.6761 ± 1872647 ± 802<LoQ1.0 ± 0.13.9 ± 0.2136 ± 14<LoQ
2–5<LoQ<0<010.2 ± 1.1106 ± 121466 ± 588<LoQ<LoQ<02.7 ± 0.5228 ± 34<LoQ
5–10<LoQ<0<07.1 ± 1.5103 ± 9721 ± 203<LoQ<LoQ<0<0210 ± 32<LoQ
Batch (10)<01.6 ± 0.62.4 ± 0.38.8 ± 0.356.8 ± 19.0423 ± 1261423 ± 2472792 ± 1884<03.4 ± 1.8143 ± 41.3645 ± 202
Soil 30–0.10.19 ± 0.000.20 ± 0.000.46 ± 0.031.3 ± 0.15.0 ± 0.248.7 ± 15.6892 ± 2171589 ± 930.44 ± 0.070.84 ± 0.117.7 ± 1.3<LoQ
0.1–21.4 ± 0.40.83 ± 0.231.3 ± 0.11.2 ± 0.12.8 ± 0.220.2 ± 2.7178 ± 39752 ± 921.9 ± 0.3<010.7 ± 1.71587
2–539.8 ± 37.6<0<0<0<018.8 ± 1.6179 ± 7725 ± 28466.8 ± 24.4<012.3 ± 0.51011
5–10<LoQ<0<0<0<016.7 ± 1.5138 ± 25384 ± 78288 ± 133<011.2 ± 0.5393
Batch (10)14.2 ± 4.13.2 ± 0.25.3 ± 1.01.8 ± 1.32.5 ± 1.318.6 ± 0.567.3 ± 12.2109 ± 316.3 ± 2.41.2 ± 1.215.8 ± 0.794.9 ± 23.2
Soil 40–0.1---------0.68 ± 0.123.8 ± 5.4-
0.1–2---------1.3 ± 0.210.2 ± 1.5-
2–5---------5.5 ± 3.017.8 ± 2.7-
5–10---------<033.0 ± 2.8-
Batch (10)---------<021.6 ± 9.4-
Table 6. Kd values calculated from output data obtained with the advection–dispersion model using Equation (5). See the Supplementary Materials Section for model parameters and assumptions.
Kd Used as Input in Simulations
L/S151015203050
0–0.11.25.21015203050
0.1–21.04.29.214192949
2–51.32.56.812172747
5–10-2.64.38.1132343
Disclaimer/Publisher’s Note: The statements, opinions and data contained in all publications are solely those of the individual author(s) and contributor(s) and not of MDPI and/or the editor(s). MDPI and/or the editor(s) disclaim responsibility for any injury to people or property resulting from any ideas, methods, instructions or products referred to in the content.

