Review

Hidden Contaminants: The Presence of Per- and Polyfluoroalkyl Substances in Remote Regions

by
Kuok Ho Daniel Tang
Department of Environmental Science, The University of Arizona, Tucson, AZ 85721, USA
Environments 2025, 12(3), 88; https://doi.org/10.3390/environments12030088
Submission received: 12 February 2025 / Revised: 9 March 2025 / Accepted: 12 March 2025 / Published: 13 March 2025

Abstract

:
Per- and polyfluoroalkyl substances (PFAS) are increasingly detected in remote environments. This review aims to provide a comprehensive overview of the types and concentrations of PFAS found in the air, water, soil, sediments, ice, and precipitation across different remote environments globally. Most of the recent studies on PFAS remote occurrence have been conducted for the Arctic, the Antarctica, and the remote regions of China. Elevated perfluorooctane sulfonate (PFOS) in Meretta and Resolute Lakes reflects the impact of local sources like airports, while PFAS in lakes located in remote regions such as East Antarctica and the Canadian High Arctic suggest atmospheric deposition as a primary PFAS input. Long-chain PFAS (≥C7) accumulate in sediments, while short-chain PFAS remain in water, as shown in Hulun Lake. Oceanic PFAS are concentrated in surface waters, driven by atmospheric deposition, with PFOA and PFOS dominating across oceans due to current emissions and legacy contamination. Coastal areas display higher PFAS levels from local sources. Arctic sediment analysis highlights atmospheric deposition and ocean transport as significant PFAS contributors. PFAS in Antarctic coastal areas suggest local biological input, notably from penguins. The Tibetan Plateau and Arctic atmospheric data confirm long-range transport, with linear PFAS favoring gaseous states, while branched PFAS are more likely to associate with particulates. Climatic factors like the Indian monsoon and temperature fluctuations affect PFAS deposition. Short-chain PFAS are prevalent in snowpacks, serving as temporary reservoirs. Mountainous regions, such as the Tibetan Plateau, act as cold traps, accumulating PFAS from atmospheric precursors. Future studies should focus on identifying and quantifying primary sources of PFAS.

1. Introduction

Since the 1950s, PFAS have been widely produced and utilized around the globe. Their usage has seen a significant rise over the years [1]. PFAS are notable for their unique amphiphilic characteristics, which make them beneficial for a range of applications, including aqueous film-forming foams, non-stick cookware, food packaging, personal care products, semiconductors, and the aerospace and automotive industries [2]. The extensive manufacturing and use of PFAS have led to their widespread occurrence in water bodies, sediments, and the atmosphere due to their exceptional durability and mobility [3]. For instance, according to Ao et al., the average levels of six common PFAS found in indoor dust in Shandong and Shanghai, China, ranged from 15.1 to 491.1 ng/g, and those in drinking water were between 0.31 and 4.14 ng/L [4]. In France, PFAS were found in 86% of surface sediment samples, with the total PFAS levels ranging from below the detection limit to 23 ng/g of dry weight [5]. The air at a remote location in the heart of the Amazon rainforest was found to contain a restricted PFAS called PFOA, with levels recorded as high as 0.002 ng/m3 [6].
The prevalence of PFAS in the environment has led to their entry into food chains. PFAS have been detected in crops and animals. A study carried out at a farm using spray irrigation with wastewater found that the total concentrations of PFAS detected in monitoring wells varied from undetectable levels up to 155 ng/L, with higher concentrations observed in the direction of groundwater flow [7]. Livestock consuming crops from sites contaminated with PFAS ingested an estimated 2.46 to 7.67 mg of PFAS annually. High PFAS levels, including PFHxS and PFOS, were found in water consumed by cattle on a polluted farm, and significant amounts were detected in the cattle’s serum [8]. A study identified FBSA, a type of PFAS, in fish samples. In a flounder muscle sample from the Netherlands, FBSA concentration was 80.1 ng/g, just below PFOS. Additionally, FBSA was found in 32 of 33 freshwater fish samples from Canada collected between 2009 and 2010 [9].
The detection of PFAS in crops, animals, and drinking water indicates that humans have possibly been exposed to PFAS through food and water consumption. In 2015, a study found PFHxS, PFOS, PFOA, PFNA, and PFDA to be present in human plasma samples taken from 616 blood donors of both sexes aged 20 to 69, collected at six blood donation centers run by the American Red Cross [10]. A study in Tianjin, China, analyzed PFOS and PFOA levels in 81 paired blood and urine samples from adults and pregnant women. Results showed PFOS in 48% and PFOA in 76% of adult urine samples [11]. A study in China analyzed 54 human placental samples for PFAS presence. PFOS, PFOA, and PFNA were detected in all samples, with PFOS and PFOA averaging 0.457 and 0.242 ng/g wet weight, respectively. The emerging compound 6:2 Cl-PFESA was also found in all samples at 0.104 ng/g wet weight [12].
Like microplastics, PFAS have permeated various environmental compartments and food chains [13,14]. They are likely detected in remote regions of the world. However, few review papers discuss the presence of PFAS in remote regions. Most of the current reviews focus on the occurrences of PFAS in surface water, wastewater, and the atmosphere, predominantly in urban centers [15,16,17]. Reviews on the presence of PFAS in animals, such as wildlife in general [18], fish [19], livestock, and game species [20] have been recently published. There is also growing interest in the remediation of PFAS using novel technologies [21], phytoremediation, bioremediation [22,23], and electrochemical methods [24]. However, with persistent PFAS being increasingly pervasive in the environment, very few reviews present their presence in various remote regions globally. Insights into the occurrences and distribution of PFAS in remote environments are crucial for understanding their long-range transport and assessing global contamination.
Therefore, this review aims to comprehensively present the types and concentrations of PFAS in the air, water, soil, sediments, ice, and precipitation of different remote environments globally. Doing so provides a better picture of the severity of global PFAS contamination and their potential long-distance travel through the environment. Data from remote locations could also provide strong evidence for international regulatory actions, such as global bans or restrictions under agreements like the Stockholm Convention.

2. Review Methodology

This review is characterized by a narrative approach. It included a comprehensive literature search conducted through established scientific databases such as Web of Science, Scopus, and ScienceDirect. The search utilized a variety of keywords and phrases, including combinations of perfluorochemicals, per- and polyfluoroalkyl substances, remote, areas, regions, PFAS, air, water, soil, and sediments. Boolean operators (AND/OR) were used to narrow the search results. The following are examples of the combinations utilized: (1) (“perfluorochemicals” OR “PFAS”) AND (“remote”) AND (“area” OR “region”), (2) (“poly-fluoroalkyl” AND “remote” AND “water”), and (3) (“PFAS” AND “remote” AND “soil”).
The criteria for inclusion are as follows: (1) articles should be peer-reviewed and available in English; (2) articles need to have been published in the past decade; (3) the articles must state the types and concentrations of PFAS in remote environments; a remote environment is typically a geographic area that is isolated, largely uninhabited, and difficult to access due to its location or extreme environmental conditions; (4) the articles must detail the PFAS in the waters, soil, sediments, air or precipitation in these environments. Additionally, the studies selected should demonstrate methodological rigor. Where laboratory detection of PFAS was involved, validated analytical methods, particularly LC-MS/MS, GC-MS, or high-resolution mass spectrometry, should be used. The procedures should include procedural blanks to assess contamination from laboratory equipment, reagents, and field handling. The use of 13C- or 18O-labeled internal standards to correct matrix effects and instrument variability should preferentially be included. The recovery rates for labeled standards should be within acceptable limits, e.g., 70–130%.

3. Remote Occurrences of PFAS

PFAS have been detected in various environmental compartments in remote regions comprising lakes, oceans, sediments, soils, ice, snow, and air. This signifies their global transport, persistence, and potential ecological risks. This raises concerns about contamination in regions far from direct human activity.

3.1. Lakes and Associated Sediments

PFAS concentrations in six lakes on Cornwallis Island, Canada, varied significantly between locally contaminated lakes and those affected by atmospheric deposition. Concentrations ranged from 1.9 ng/L in 9 Mile Lake to 153 ng/L in Meretta Lake (Figure 1) [25]. Mean PFAS levels in atmospherically influenced lakes were similar to previous findings in the Canadian High Arctic, which reported levels between 0.027 and 0.754 ng/L [26]. In contrast, PFOS concentrations in Resolute Lake (26 ng/L) and Meretta Lake (41 ng/L) were much higher than in Lake Ontario in Ontario, Canada (5.51 ng/L) [27]. These results show that PFOS levels were significantly influenced by point source contamination from the nearby airport (Table 1). In Meretta Lake, closest to the airport, PFOS comprised 27% of the total PFAS concentration (total PFAS here comprised 9 PFCA and 10 PFSA) (Table 1). As the distance from the source increased, PFOS decreased, comprising less than 1% in North and 9 Mile Lakes, located furthest from the airport [25]. Research indicates that longer-chain PFAS with over seven carbon atoms exhibit a significant tendency to adhere to sediments, leading to the displacement of shorter-chain PFAS into nearby water [28,29]. Consequently, it is not unexpected that longer-chain PFAS were found in greater abundance and at higher levels in sediments than in the water of the lakes. For instance, the compound 8:2 FTS was identified in the majority of sediment samples from the lakes (with concentrations from 0.002 ng/g in North Lake to 13 ng/g in Meretta Lake), whereas it was only found in water samples from Resolute (0.01 ng/L) and Meretta (0.20 ng/L) Lakes [25].
Sediments from Lake Hazen in Ellesmere Island, Nunavut, Canada, contained thirteen types of PFAS, including FOSA, C4, C6, C8 PFSAs, C6-C13 PFCAs, and PFECHS. Among these, PFDA, PFBS, PFOA, and PFOS were the most frequently found PFAS across all sediment samples [30]. In contrast, the presence of other PFAS, such as FOSA, PFECHS, PFHpA, PFHxA, and PFHxS was sporadic and occurred at low levels in the sediments. A total of seven PFAS were found in the sediments of Lake B35 in central Nunavut, including C7–C11 PFCAs and C4 and C8 PFSAs. PFNA and PFOA were present in nearly all sediment samples within the 0.25–3.75 cm depth range, while PFDA, PFHpA, and PFUnDA were identified in most samples from depths of 0.25–2.75 cm [30]. The total concentrations of PFAS varied between 0.044 and 1.52 ng/g dry weight (Figure 1). The concentration of total PFCAs constituted 96% of all PFAS detected in the sediment core. The PFAS profiles from Lake Hazen and Lake B35 sediments revealed that the two areas were affected by different sources of emissions. For instance, PFSAs appeared more often in the sediments of Lake Hazen compared to those of Lake B35, suggesting that sources based on electrochemical fluorination have a greater impact on the Lake Hazen region [30].
A study was conducted to analyze the levels of 30 types of PFAS in the surface water and sediments of Hulun Lake, Inner Mongolia, China, along with its tributary rivers. The predominant substances found in the water samples were short-chain PFCAs, accounting for 33.6% in Hulun Lake and 30.5% in the feeding rivers [31]. Nonetheless, long-chain PFCAs and PFSAs made up over 50% of the overall PFAS levels in sediment. The total concentrations of 30 PFAS were observed to range between 3.67 and 8.84 ng/L in water and 0.97 to 1.73 μg/kg in sediment (Figure 1). Noticeable variations in water and sediment samples were observed between Hulun Lake and the rivers that feed into it [31]. Analysis indicated that the main contributors to PFAS contamination included aqueous film-forming foams, cosmetics, paper products, paper-based food packaging, textiles, and wastewater (Table 1) [31,32].
Four alpine lakes in the Sierra Nevada mountains, USA, exhibited PFAS levels at or close to the detection threshold (under 1 ng/L for the majority of species) (Figure 1) [33]. This indicates that headwater regions that lack any identified direct sources of PFAS maintain low levels of these substances [33,34]. An exception worth noting was Lake Tahoe, where the Tahoe Keys Marina exhibited the highest levels of PFAS among all alpine lakes studied (Figure 1). This marina experiences significantly more human impact compared to the other sites, as it collects runoff from South Lake Tahoe City (Table 1). Additionally, water mixing at the sampling site within the marina is restricted. The next highest PFAS levels were observed in Lake Tahoe, specifically near the area where the Upper Truckee River flows into it [33].
In lake water samples collected from Deception Island, Antarctica, the total concentrations of PFAAs varied from 0.28 to 3.9 ng/L, averaging 1.8 ng/L (Figure 1) [35]. These levels fell below those in lakes on King George Island, which had concentrations ranging from 2.1 to 4.8 ng/L (Figure 1) [36]. PFBA was identified as the predominant compound in lake water, making up over 80% of the total PFAAs (comprising 24 PFSAs and PFCAs), with a mean level of 1.5 ng/L. The lakes seem to obtain their water solely from atmospheric deposition (Table 1) [35]. A total of 21 PFAS compounds, including several novel ones, were analyzed for the surface waters sourced from 21 lakes with melting ice adjacent to the research facilities in the Larsemann Hills region of East Antarctica [37]. The median concentration of all PFAS was below 0.027 ng/L (Figure 1), indicating background levels in East Antarctica. Contamination levels of PFAS in East Antarctica typically fell below those in West Antarctica, potentially because fewer human activities occur in East Antarctica compared to West Antarctica. PFOA was the most prevalent contaminant in the lakes with melting ice, with concentrations reaching as high as 0.46 ng/L in various lakes near the research stations in East Antarctica [37]. Cl-PFESA, a new alternative to PFOS, was identified in multiple samples. Source apportionment revealed that the PFAS found in the melting lakes of East Antarctica primarily originated from airborne sources. However, local discharges could also play a role in the presence of PFOA in certain lakes [37].

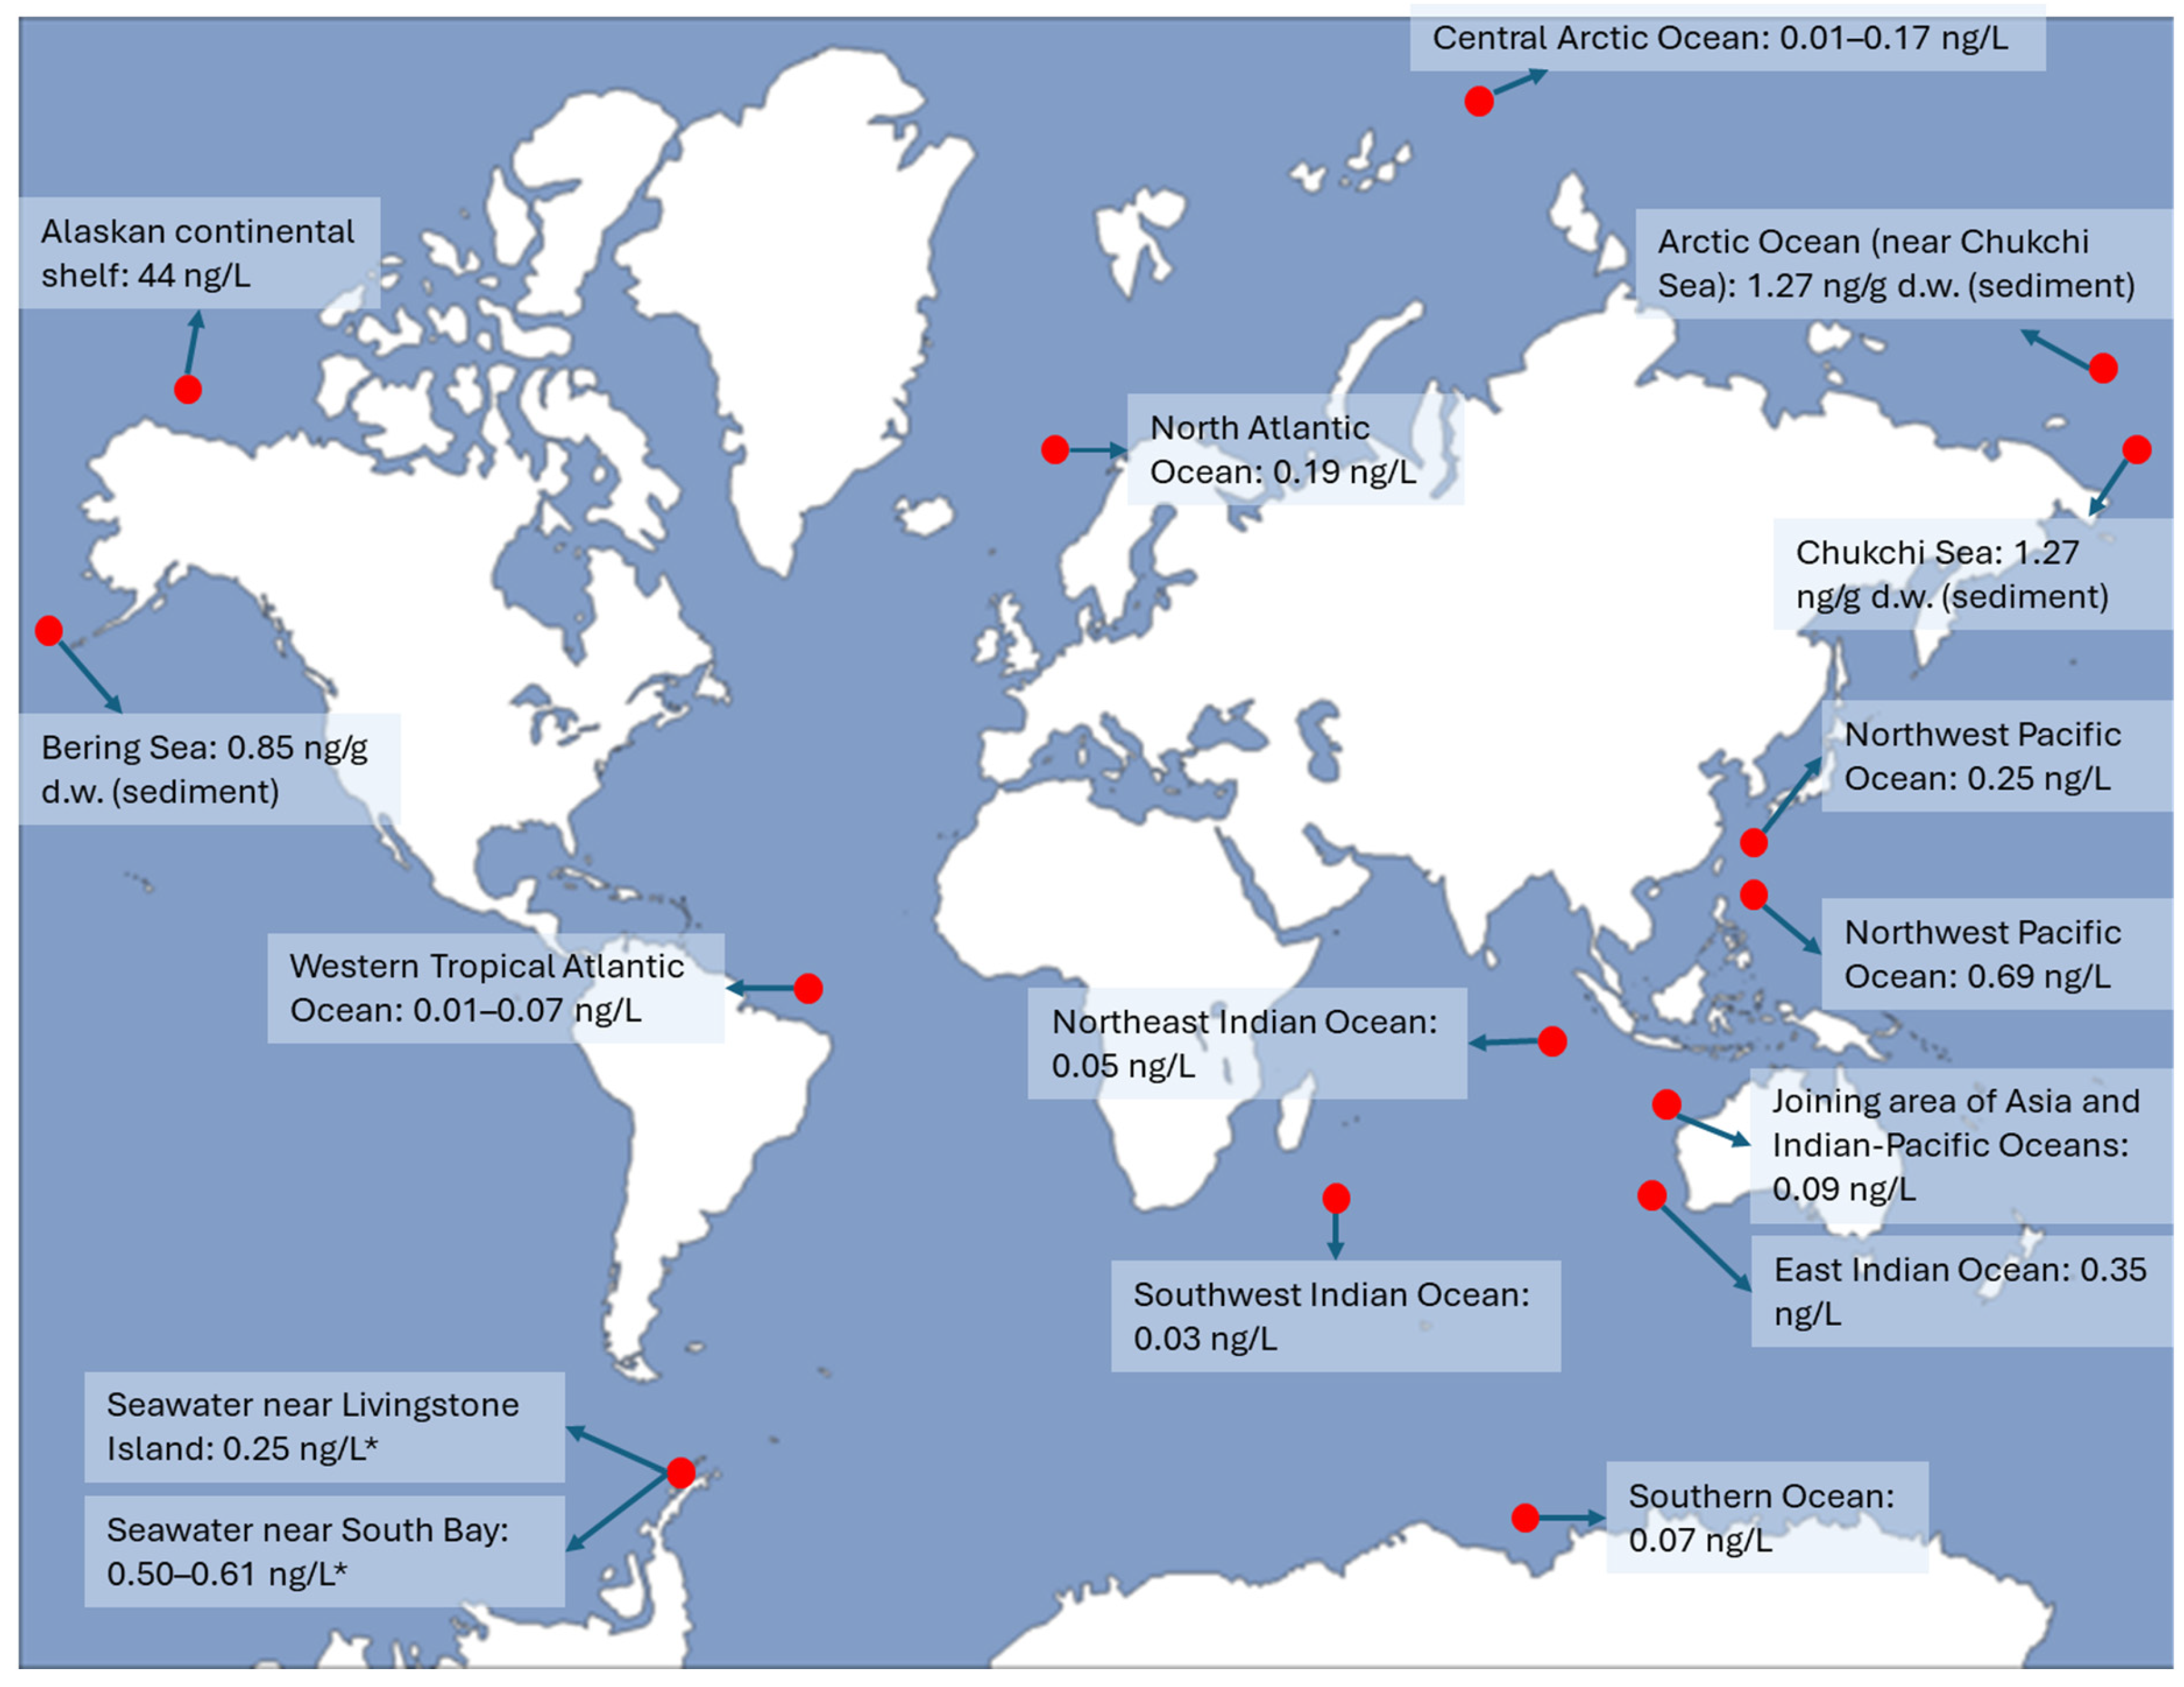
3.2. Oceans and Associated Sediments

Yeung et al. analyzed EtFOSAA, FOSA, MeFOSAA, C6–C12 PFCAs, and C4–C10 PFSAs in the Arctic Ocean, encompassing both deep ocean and shelf waters [38]. The study found that PFAS compounds were typically only detectable in the polar mixed layer at depths shallower than 150 m. Vertical assessments conducted at four sites in the Amundsen and Nansen Basins revealed that PFOA (0.05 ng/L) and PFOS (0.047 ng/L) were the main types of PFAS found [38]. Other PFAS compounds, such as PFBS (0.04 ng/L), PFHpA (0.035 ng/L), PFHxA (0.037 ng/L), and PFNA (0.039 ng/L), were also commonly detected. The levels of PFAS in the Alaskan continental shelf waters were comparable to those in the ocean, with PFOA being the most prevalent in nearly all samples (average concentration: 44 ng/L). A broader variety of PFAS compounds, including PFUnDA, FOSA, and EtFOSAA, were found in melt pond water gathered from various locations across the Nansen and Amundsen Basins. These concentrations were higher than those detected in seawater from the Arctic shelf and central basin, highlighting the significant role that atmospheric deposition plays in influencing surface waters [38]. Notably, PFAS levels in coastal waters off Greenland were generally greater than those measured in the open ocean within the northern North Atlantic [26]. This discrepancy may be due to the impact of freshwater inflow on these nearshore areas.
Lin et al. examined the presence of nine PFAS in a sediment core dated 1945 to 2014, as well as in 29 surface sediment samples taken from the Bering Sea to the western Arctic [39]. The total concentrations of PFAS in the surface sediments, measured between 0.06 and 1.73 ng/g dry weight, were primarily composed of PFBS, PFOS, and PFNA. Notably, higher concentrations were observed in the slope of the Bering Sea and the northeastern Chukchi Sea. The historical patterns of PFAS levels varied, with a decrease in PFOS observed at the start of the 2000s, while an upward trend in PFNA was noted [39,40]. A positive matrix factorization model analysis revealed that the primary sources of PFAS in the sediment core were largely attributed to the airborne oxidation of products that use PFOS precursors, accounting for 45.0% of the sources [39,41]. Meanwhile, the oceanic transport of PFAS related to the production of polyvinylidene fluoride (primarily PFNA) showed a rising trend, ultimately becoming the predominant source in surface sediments at 42.8%. In addition, the contribution of potential aqueous fire-fighting foams, primarily PFOS and PFBS, has served as a significant source both presently (30.1%) and in the past (34.9%) [39].
A total of twenty different legacy PFAS were methodically analyzed in the surface waters of three distinct regions in the Indian Ocean and the nearby Northwest Pacific Ocean (Figure 2) [42]. The compounds include C4–14, 16, and 18 PFCAs, as well as C4, 6, 8, and 10 PFSAs, along with EtFOSAA, MeFOSAA, and PFOSA. The most detected PFAS in the area where Asia and the Indian-Pacific Oceans converge were PFHpA and PFOA, accounting for 78.4% of the findings. In the Northeast Indian Ocean and the Southwest Indian Ocean, PFHpA, PFNA, and PFOA were the most prevalent PFAS compounds, making up 77.1% and 80.9% of the total, respectively [42]. Among these, PFOA emerged as the most common PFAS in the regions where Asia and the Indian-Pacific Oceans intersect, with a concentration of 0.05 ± 0.048 ng/L (or 48.9% ± 16.3% of the total PFAS). It was also found in the Northeast Indian Ocean at 0.016 ± 0.009 ng/L and in the Northwest Pacific Ocean at 0.108 ± 0.09 ng/L, contributing to 28.6% ± 4.33% and 37.3% ± 14.8% of the total PFAS concentration in each respective area. In the Southwest Pacific Ocean, PFHpA was found to be the most abundant compound, representing 34.1% ± 2.30% (0.01 ± 0.001 ng/L) of the total PFAS concentration [42]. Conversely, PFOS, which has raised significant alarm, constituted only about 5.24%, with an average level of 0.001 ng/L—substantially lower than previously reported levels in the same region and further north or south [37,43].
According to Shan et al., the total PFAS concentration diminished in the following sequence: the Northwest Pacific Ocean (average 0.69 ng/L), the East Indian Ocean (average 0.35 ng/L), and the Southern Ocean (average 0.70 ng/L) (Figure 2). The predominant compound was PFOA (20–48% of the total PFAS), with PFOS (5–20% of the total PFAS) following [37]. The concentration of PFOA decreased significantly as the distance from the shore increased, whereas a similar pattern was not clearly observed for PFOS and other older PFAS compounds [37,44]. This indicates that PFOA is primarily associated with current land-based emissions, while PFOS is largely a result of past residues. Additionally, 6:2 Cl-PFESA was detected in ocean waters, ranging from <0.01 to 0.17 ng/L, with notably higher levels found near the Australian sites [37].
The total concentrations of eight measurable PFAS found in the surface waters of the Western Tropical Atlantic Ocean were between 0.01 and 0.07 ng/L (Figure 2), indicating lower levels compared to earlier findings in the same region and areas further north [45]. In the Western Tropical Atlantic Ocean, PFCAs were found to be the most prevalent PFAS. Analysis of 16 surface samples revealed diverse distributions of PFAS, highlighting the dominance of PFOA, which constituted 67% of the findings, with an average concentration of 0.01 ± 0.008 ng/L. Additionally, PFSAs were only detected in the Southern Tropical Atlantic Ocean [45]. Research conducted in the waters stretching from the European continent to the Arctic and in the Fram Strait showed that the concentration of PFAS was notably higher in the cold surface waters with lower salinity leaving the Arctic (0.26 ng/L) than in the warmer waters with higher salinity from the North Atlantic flowing into the Arctic (0.190 ng/L) [46]. The greater proportion of PFHpA relative to PFNA found in the water leaving the Arctic indicates a larger influence from atmospheric deposition compared to ocean circulation. The reason is that PFHpA is a marker for long-range atmospheric transport and is more commonly associated with atmospheric deposition because it remains in the air longer before settling in remote environments. On the other hand, PFNA is more strongly associated with direct discharges from industrial sites and wastewater treatment plants rather than atmospheric transport.
In a study by Kahkashan et al., the total concentrations of fourteen PFAS in the surface sediments of the Chukchi Sea and the nearby Arctic Ocean were found to be higher than those in the Bering Sea, at 1.27 ng/g and 0.85 ng/g, respectively (Figure 2) [47]. In these regions, PFBS and PFOA were the most prevalent PFAS. An observed rise in surface sediment PFAS levels beginning at the Bering Sea to the Arctic Ocean suggests that these substances are being transported through ocean currents [47]. The average total PFAA level in surface seawater collected from Livingston Island, Antarctica, was 0.25 ± 0.21 ng/L, with values varying between 0.03 and 1.02 ng/L [35]. During the 2018 austral summer, the mean concentration of total PFAAs at Johnson Glacier Station (st-28) was 0.19 ± 0.14 ng/L, which is consistent with the levels observed at the same location earlier (0.19 ± 0.10 ng/L) [35,48]. The levels of individual and total PFAAs did not exhibit notable spatial variations between the South and False Bays. However, the coastal waters sampled from stations st-25 and st-26 exhibited higher levels of PFAAs, averaging 0.61 ± 0.58 ng/L and 0.5 ± 0.5 ng/L, respectively [35]. These sites are situated near two separate penguin communities in the South Bay (Figure 2), which is located to the east of the Hurd Peninsula. The high PFAA levels support the theory that penguin droppings could enhance PFAS levels in the coastal regions of Antarctica, as penguins forage in nearby waters and then excrete waste either in their community or in surrounding waters [35,49]. As the snow melts, runoff containing excreta-bound PFAAs carries the PFAAs from the droppings to the neighboring waters.

3.3. Air

In a study by Wang et al., the presence of linear PFAS in the air over Tibet was analyzed using passive atmospheric sampling. Their research revealed that the total concentrations of FTOHs, FOSAs, and FOSEs ranged between 0.07 and 0.22, 0.001 and 0.01, and 0.0003 and 0.001 ng/m3, respectively [50]. They also observed elevated levels of linear PFAS, specifically in the Yarlung Tsangpo Grand Canyon transport channel, along with increased amounts of 4:2 FTOH [50]. These findings suggest not only long-range atmospheric transportation but also a transition in production from long-chain to short-chain PFAS in areas around Tibet.
The total concentrations of linear PFAS in the air were found to vary between 0.08 and 0.17 ng/m3 above the Bohai Sea, 0.16 and 0.22 ng/m3 above the northern Yellow Sea, and 0.19 and 4.53 ng/m3 above the southern Yellow Sea [51]. The majority of the linear PFAS (>90%) existed in the gaseous phase rather than in the airborne particulate matter. Among these, FTOHs, particularly 8:2 FTOH and 10:2 FTOH, were the most prevalent, contributing to more than 90% of the total PFAS. In comparison to urban air, the linear PFAS composition in the air from remote areas was comparable, with 8:2 FTOH being the most dominant, followed by 10:2 FTOH [51]. This similarity may be attributed to the relatively greater potential for long-range atmospheric transport and a longer residence time of these substances in the atmosphere.
Fang et al. studied the presence of branched and linear PFAS in the atmosphere over the Bohai and Yellow Seas. Their results indicated that total branched PFAS and linear PFAS concentrations varied between 0.04 and 0.11 ng/m3 and 0.007 and 1.7 ng/m3, respectively [52]. It was observed that branched PFAS were predominantly found in airborne particulate matter, while linear PFAS primarily existed in the gaseous state. Additionally, the contributions from C4- and C6-branched PFAS exceeded those from C8-branched PFAS, with C2 PFCA being the most prevalent among the branched PFAS compounds. In terms of linear PFAS, 8:2 and 10:2 FTOHs were the most common [52]. Furthermore, a study by Lai et al. measured linear PFAS levels in the air above the northern South China Sea, which aligned with the findings of Fang et al. [52,53]. In their research, Lai et al. identified 8:2 and 10:2 FTOH as the main types of linear PFAS. Moreover, they observed that the majority of the linear PFAS (over 95%) was present in the gaseous state, with levels ranging from 0.002 to 0.11 ng/m3 [53]. These levels were found to be lower than those reported above the Yellow and Bohai Seas by Fang et al. [52,53].
In Ny-Ålesund, located on the remote Spitsbergen Island, the total levels of twelve neutral PFAS were found to vary between 0.007 and 0.04 ng/m3 in the atmosphere and between 0.33 and 0.69 ng/L in the snow [54]. For FTAs and FTOHs, the fluxes of air-snow exchange were positive, suggesting a net evaporation from the snow to the air. Conversely, Me/EtFOSEs showed net deposition into the snow during the winter and spring of 2012. When FTOHs and FTAs accumulate in snow, they can readily evaporate into the atmosphere. In contrast, the net release of FOSEs and FOSAs from snow happens solely during periods of rising temperatures or snowmelt. Consequently, the levels of FOSEs and FOSAs in the air are greatly affected by temperature changes [54].
A temporal analysis has been conducted on the long-term patterns of air pollutants at eight different monitoring sites in the Arctic using the Digital Filtration technique [55]. This signal-processing technique is used to extract specific information from digital signals, such as images, audio, or environmental data. It involves applying mathematical algorithms to remove noise, enhance certain features, or isolate desired signal components. Therefore, concentration changes were not reported here. Stations in Alert, Zeppelin, and Andøya recorded a decline in the concentrations of PFOA and PFOS, contrasting the higher PFOS levels in Alert and Alaska revealed by the passive air samples collected in 2015 when compared to those from 2009 and 2013, as noted by Rauert et al. [55,56]. Conversely, PFHxS, 6:2 FTOH, and C9–C11 PFCAs either remained stable or showed an upward trend. Rauert et al. also observed that PFHxS levels in worldwide passive air samples had been on the rise based on samples taken in 2009, 2013, and 2015. In Alert, PFNA levels remained stable, whereas PFDA and PFUnDA exhibited upward trends. Meanwhile, these substances were found to be undetectable at the Zeppelin and Andøya locations [56]. Despite the temporal variations, it is clear that PFAS have been detected in the Arctic and have persisted over time.
Between 2006 and 2014, atmospheric observations indicated that FTOHs, along with PFOA and PFBA, were the leading PFAS detected in the Arctic atmosphere [26]. Concentrations of these substances increased at Alert; however, PFOA levels decreased at the Zeppelin Station in Svalbard. Analysis of ice cores revealed a generally rising deposition of PFCAs on the Canadian Arctic Devon Ice Cap, while a reduction in fluxes was observed in a glacier located on Svalbard [26]. The presence of sea spray aerosol near the Norwegian locations may lead to elevated levels of PFOA at Zeppelin. Since 2008, the levels of C6–C12 PFCA and PFOS in snow have been monitored at Station Nord in Greenland, with samples taken three times annually. The most detected PFAS substances were PFOA and PFNA, showing average concentrations of 0.53 ng/L and 0.45 ng/L, respectively [26]. Furthermore, Bossi et al. found that the total concentration of the seven analyzed neutral PFAS compounds varied between 0.002 and 0.03 ng/m3 at Station Nord in Greenland. The primary component identified was 8:2 FTOH, making up 44% of the total PFAS, followed by 10:2 FTOH and 6:2 FTOH [57]. Meanwhile, FOSA and FOSE were also observed, but they were present in significantly lower amounts than the FTOHs. The average ratio of 6:2 FTOH, 8:2 FTOH, and 10:2 FTOH was found to be 1.7:3.1:1.8. This finding aligns with ratios documented in other Arctic studies [54,57,58], suggesting that the FTOH concentrations detected in northern Greenland primarily resulted from long-range transport.

3.4. Ice and Snow

PFCAs ranging from C2 to C11 were consistently found in the Svalbard ice core in the Arctic, with their flux values varying between 2.5 and 8200 ng/m2 per year (equivalent to 0.01–16.5 ng/L) [59]. In the ice core samples, TFA accounted for 71% of the overall mass of C2–C11 PFCAs, showing an upward trend in deposition over time. The observed PFCA distribution indicated that FTOHs were probably the atmospheric precursors of C8–C11 PFCAs, while C2–C6 PFCAs originated from other sources, including hydrofluorocarbons and other compounds that replaced chlorofluorocarbons [59,60]. PFOS was found in 82% of the ice core subsections examined, and the profile of its isomers, predominantly linear at 81%, suggests it originated from the electrochemical fluorination production process regionally, which typically produces PFSAs, particularly PFOS [59].
Miner et al. analyzed samples of meltwater and snow from the Khumbu Glacier on Mt. Everest for PFAS. Among the 14 PFAS compounds evaluated, they detected PFOS, PFOA, and PFHxA in the snow and meltwater [61]. The highest levels of PFOS (26.14 ng/L and 10.34 ng/L) were recorded at two camp locations. In all areas where sampling was conducted, PFAS compounds were detected at concentrations varying by 1 to 2 orders of magnitude, indicating a potentially widespread occurrence on the mountain [61]. The buildup of snow at lower elevations and the movement of meltwater from the glacier could explain some of the elevated PFAS levels observed at the two camp locations. Over the last five decades, the increased activity of trekkers and climbers in the Mt. Everest area has heightened the risk of direct PFAS deposition onto the Khumbu Glacier [61,62].
A study by MacInnis et al. revealed that PFBA was the most prevalent PFAS in the snowpacks of Lake Hazen on Ellesmere Island, Canada, with an average concentration of 2.70 ± 3.22 ng/L in 2013 and 2.66 ± 0.68 ng/L in 2014, respectively [63]. The release of PFAS from snowpacks suggests that yearly atmospheric deposition plays a significant role in the sourcing of PFAS, which experiences intricate cycling processes in the High Arctic [63]. PFAS found in snowpacks exhibit concentration ratios that alternate between odd and even numbers, which is indicative of their journey through the atmosphere and their conversion from volatile precursors. Analysis of major ions in the snowpacks indicates that the presence of combustion particles, sea spray, and mineral dust plays a significant role in determining the behavior of PFAS within the Lake Hazen watershed [63].
In a separate study, MacInnis et al. found that the concentrations of PFOA in snow samples taken from the Devon Ice Cap, Nunavut, Canada ranged from 0.07 to 0.68 ng/L, while PFNA concentrations varied from 0.030 to 1.42 ng/L, and PFDA levels were between 0.01 and 0.23 ng/L [64]. These findings were comparable to those observed at Station Nord in northeastern Greenland [26]. PFBA emerged as the most significant PFCA, with concentrations varying between 0.12 and 2.00 ng/L, accounting for 7 to 70% of the total C4–C12-chain PFCAs. Its levels showed no relationship with other PFCAs, indicating an alternative source not linked to the atmospheric breakdown of fluorotelomer compounds. The authors proposed that the probable source of PFBA was non-fluorotelomer gases, encompassing hydrofluorocarbons, which potentially convert into PFBA [64]. The levels of PFOA, PFNA, PFDA, and PFOS found in the snow from the Lake A catchment were comparable to those recorded during the spring and summer periods in the accumulated snow from the Devon Ice Cap, located south of Lake A, which was collected in the spring of 2015 (<detection limit to 141 ng/m2/yr) [64,65]. These levels were also similar to those noted in “light” snow that was gathered at Lake Hazen during the 2013–2014 period [30,64].
During three months from December 2014 to February 2015 at Livingston Island, Antarctica, the accumulation of fresh snow, surface snow, and streams from melted snow indicated that local sources of PFAS were particularly prominent for PFSAs and C7–14 PFCAs in the snow [48]. However, these sources were confined to areas traversed by the research station. The levels of 14 ionizable PFAS found in recently fallen snow (ranging from 0.76 to 3.60 ng/L) were 10 times greater compared to those observed in background surface snow (ranging from 0.08 to 0.43 ng/L) [48]. This indicates that long-distance air movement is significant in delivering PFAS to Livingston Island. Snowmelt PFAS levels varied between 0.46 and 0.64 ng/L, which is approximately 10 times lower than the levels found in snowmelt and lakes (2.10–4.80 ng/L) on King George Island [36,48]. This finding aligns with the absence of significant local sources beyond the station’s boundaries. The levels of individual PFAS found in snowmelt were generally less than those in newly fallen snow, yet they surpassed the PFAS levels observed in the surface layer of snow.
Precipitation in the form of snow and rain carries PFAS into the atmosphere, which is a significant PFAS source in the maritime regions of Antarctica. This process could lead to increased concentrations of PFAS in seawater [48,66]. The total PFAA concentrations in snow samples collected from Deception Island varied between 0.24 and 20.0 ng/L, primarily influenced by PFBA, which accounted for over 50% of the overall PFAA concentration. This was succeeded by PFOA, which made up 13%, and PFOS at 8% [35]. The average concentration of total PFAAs in surface snow samples from areas traversed by the Juan Carlos I research station at Livingstone Island was found to be 1.30 ng/L. This elevated level could be associated with the expansion of the station. PFBA exhibited the highest level among PFCAs, making up over 70% of the entire snow samples collected from Livingston Island, followed by PFOA and PFPeA [35]. Conversely, PFSAs contributed minimally to the total PFAA concentration, accounting for less than 1%. The average concentrations of total PFAAs in snowmelt varied between 1.20 and 6.70 ng/L on Livingston Island, while at Deception Island, concentrations ranged from 1.20 to 4.40 ng/L. In terms of concentration, PFBA consistently ranked as the compound with the highest levels, contributing more than 80% on Livingston Island and over 60% on Deception Island. PFOA and PFOS came after it [35].
Surface snow samples obtained from Dome C on the Antarctic Plateau revealed that PFOA was the most prevalent PFAS, with an average concentration of 0.36 ± 0.07 ng/L [67]. This was followed by PFHxA at 0.22 ± 0.1 ng/L, PFHpA at 0.18 ± 0.06 ng/L, and PFPeA at 0.18 ± 0.11 ng/L. Additionally, HFPO-DA was also detected with a mean concentration of 0.01 ± 0.003 ng/L. A strong positive relationship was found between HFPO-DA and the short-chain PFAS, suggesting that they likely share common sources of emission and have the potential for long-distance transport [67].
Rainfall data collected across the Tibetan Plateau from May to October 2017 revealed that the average concentrations of PFAA ranged between 0.21 ng/L and 0.55 ng/L. PFCAs represented 87% of the total PFAAs measured [68]. Most PFCAs showed strong positive correlations in the southeast Tibetan Plateau, suggesting they likely originated from similar sources. The deposition flux of PFAAs over a month varied between 12.6 and 68.9 ng/m2/month, showing a decline from the east to the west [68]. This trend is largely influenced by the Indian monsoon, which is the primary climatic factor affecting the eastern Tibetan Plateau, highlighting the significant role the monsoon has in transporting PFAAs to this region.
A shallow 10 m firn core extracted from a glacier at Mount Ortles in the eastern Italian Alps was analyzed for PFAS. The study identified 12 out of 18 PFAS present, including PFBA, PFPA, PFHxA, PFHpA, PFOA, PFNA, PFDA, PFUnDA, PFDoDA, PFTrDA, PFTeDA, and PFOS. The levels of these PFAS varied between 1 ng/L and 5.8 ng/L [69]. The most common PFAS detected were PFBA, PFOA, and PFNA, with concentrations of 0.3 to 1.7 ng/L, 0.1 to 0.9 ng/L, and below the limit of quantification to 2.1 ng/L., respectively. PFOS, PFTrDA, and PFTeDA were consistently found to be below the limit of quantification. The PFAS levels found in the Ortles firn core were comparable to those detected in snowpack samples from a remote location in Sweden [70]. However, the PFAS concentrations measured in snow along ski tracks in Sweden were significantly higher, by as much as 1 to 4 orders of magnitude, than those in the Ortles samples. This discrepancy is likely due to the direct pollution stemming from heavy skiing activities [71].

3.5. Water and Sediments Generally

In the isolated coastal and inland regions of Spitsbergen, northern Norway, the mean concentration of total PFAS in meltwater was found to be the highest at 6.5 ng/L. This was followed by surface snow at 2.5 ng/L, freshwater at 2.3 ng/L, and seawater at 1.05 ng/L. Lake and marine sediments had PFAS levels at 0.084 ng/g dry weight and from below the method detection limit to 0.46 ng/g dry weight, respectively [72]. PFCAs were found to be the most abundant in both water and sediment samples from the remote coastal and inland areas of Svalbard [26,36]. The composition profiles of PFAS detected in remote regions suggested that transport through the atmosphere and the oxidation of volatile precursors play a significant role in the presence of PFCAs in Svalbard. In freshwater systems, shorter-chain PFAS like PFBA were found to be the most common, indicating a shift from C8-chain PFAS to shorter-chain alternatives. The relatively high concentrations of PFAS, particularly PFBA, in meltwater, demonstrated that melting snow and ice in the Arctic spring is a critical diffuse source of local PFAS contamination [72].

3.6. Soil

A study conducted on the Tibetan Plateau assessed the presence of PFAS and revealed that only PFBA and three types of PFSAs exceeded the minimum detection level in soil samples, with detection frequencies ranging between 22.2 and 66.7% [73]. In the Nam Co Basin, the total concentrations of PFAS in the soil were found to be between 0.130 and 1.507 ng/g on a dry weight basis (mean = 0.427 ng/g), which is consistent with findings from other remote regions globally, where concentrations ranged from 0.055 to 2.081 ng/g [74]. A separate study revealed that the concentrations of PFAS in soil samples from the Tibetan Plateau ranged between 0.814 and 4.51 ng/g [75]. The study also identified several new types of PFAS, such as Cl-PFESA, HFPO, and FTS. In general, PFAS levels showed a rising trend from west to east and tended to increase with higher altitudes, indicating the influences of human activities and cold-trapping effects in mountainous areas.
Out of 20 PFAS analyzed, 18 were found in soil samples taken from 11 locations across four regions in Svalbard, specifically Longyearbyen, London Island, Ny-Ålesund, and Storholmen. The overall concentrations of these PFAS varied between 0.12 and 4.84 ng/g, with an average of 1.08 ± 1.38 ng/g [76]. This resembles the background PFAS levels in the soil samples of the forests in Sweden, which had values ranging from 0.40 to 6.6 ng/g dry weight (with a median of 2.3 ± 1.3 ng/g) [77]. It was also comparable to soils from the Tibetan Plateau that showed a range of 0.13 to 1.51 ng/g dry weight (with a mean of 0.427 ng/g) [73]. However, these figures are lower than those reported for coastal soils in China, which range from 2.67 to 22.1 ng/g dry weight (averaging 6.7 ng/g) [78], as well as soils from Asan Lake in Korea, which vary from not detected up to 12.9 ng/g dry weight [79]. According to Dai et al., PFCAs were notably more abundant in soil compared to PFSAs. PFCAs represented 72.2% of the total PFAS, with PFBA, PFNA, and PFOA collectively making up 66% of the total PFCAs [76].
The concentrations of total PFCAs (C4 to C13) found in soils on Melville Island in the eastern Timor Sea varied between 0.20 and 2.05 ng/g dry weight [80]. The soil samples contained primarily PFBA, PFNA, and PFOA, which collectively accounted for as much as 60% of the total PFCAs. Overall, the concentrations of PFCAs with odd-numbered carbon chain lengths were higher than those of the corresponding PFCAs with one fewer carbon (for instance, PFNA surpassed PFOA, PFUnDA exceeded PFDA, and PFTrDA outstripped PFDoDA) [80]. This trend corresponds to the impact of atmospheric movement and the oxidation of PFCA precursors, like FTOHs, which play a major role in the presence of PFCAs found in Arctic soil samples.
A study carried out in South Korea found that the total concentrations of 15 PFAS in farmland soils ranged from 0.52 to 2.10 ng/g dw, with a median of 1.36 ng/g dw [81]. These levels were comparable to those found in mountain soils, which had concentrations between 0.18 and 3.01 ng/g dw (median 1.12 ng/g dw), and in woodland soils, where the values ranged from 0.52 to 2.14 ng/g dw (median 1.19 ng/g dw) [81]. This research revealed that the PFAS levels were either comparable to or less than those observed in suburban or remote areas of China and the Republic of Korea, where PFOA ranged from 0.16 to 62.5 ng/g and not detected—0.469 ng/g, and PFOS ranged from not detected—1.56 ng/g and not detected—0.95 ng/g, respectively [82,83]. In the three land types examined in the study, PFDA, PFOA, PFNA, and PFUnDA were the most prevalent contaminants, while PFOS levels in the mountains were higher than in the other two land types.

4. Implications

4.1. Lakes and Associated Sediments

The elevated PFOS concentrations in Meretta and Resolute Lakes highlight the influence of localized point sources, such as airports [25]. Proximity to such sources results in higher PFAS levels, especially for longer-chain compounds like PFOS. Lakes far from direct human activity, such as those in East Antarctica and the Canadian High Arctic, demonstrate atmospheric deposition as a primary source of PFAS, implicating global transport of these substances through air and precipitation (Figure 3) [30,84]. Long-chain PFAS (≥C7) tend to accumulate in sediments due to their higher hydrophobicity and stronger adsorption to particles, while short-chain PFAS are more mobile and remain in the water, as evidenced by Hulun Lake sediments (Figure 3) [31].
The PFAS profiles of lake sediments can be source-specific, as demonstrated by Lake Hazen and Lake B23, where higher PFSAs in the sediments of Lake Hazen imply regional electrochemical fluorination as a potential source in the area (not local to the lake) [30]. This is because electrochemical fluorination produces a mixture of linear and branched isomers of PFAS. PFSAs, such as PFOS, are major byproducts of electrochemical fluorination. Lake B35 contains more PFCAs at a greater sediment depth, suggesting historical atmospheric deposition. Atmospheric deposition contributes to the detection of PFAS in remote Antarctic and high-Arctic Lakes, e.g., North Lake and 9 Mile Lake [25]. Since the remote regions are scattered, the predominant PFAS often vary depending on localized contamination that permeates these areas.

4.2. Oceans and Associated Sediments

In oceans, the detection of PFAS primarily in the polar mixed layer (depths < 150 m) suggests that surface waters are significantly influenced by atmospheric deposition, while deep ocean waters have minimal PFAS presence [38]. PFOA and PFOS are the most prevalent PFAS across many regions, including the Arctic Ocean, the Indian Ocean, and the Atlantic [37,45,47]. This indicates their widespread persistence and mobility, with current land-based emissions (for PFOA) and legacy contamination (for PFOS) being the primary contributors. Compared to open ocean areas, elevated concentrations in coastal waters (e.g., Greenland and Australia) suggest significant local sources, such as freshwater inflows, runoff, and industrial or municipal discharge. The sediment analysis in the Arctic (Bering Sea, Chukchi Sea, and western Arctic) revealed that airborne deposition and ocean transport are key contributors to PFAS accumulation, with PFAS coming from different sources such as polyvinylidene fluoride production and aqueous fire-fighting foams [39].
PFOS levels have declined since the early 2000s, while PFNA levels have increased, possibly linked to polyvinylidene fluoride production, as PFNA is used as a processing aid [39]. This could alter toxicity risks. Generally, long-chain PFAS have higher bioaccumulation potential, leading to increased exposure of marine mammals and seabirds. In Antarctica, PFAS levels are generally low, with notable local increases near penguin colonies, indicating that biological processes (e.g., excretion by penguins) can contribute to PFAS input in coastal areas [35]. The presence of PFAS in penguins’ excreta also indicates the bioaccumulation of PFAS in them due to exposure to environmental media and food contaminated with PFAS. Additionally, it reveals that the Arctic and Antarctic regions, previously considered pristine, are becoming major PFAS sinks, affecting polar wildlife and indigenous communities that rely on marine resources.

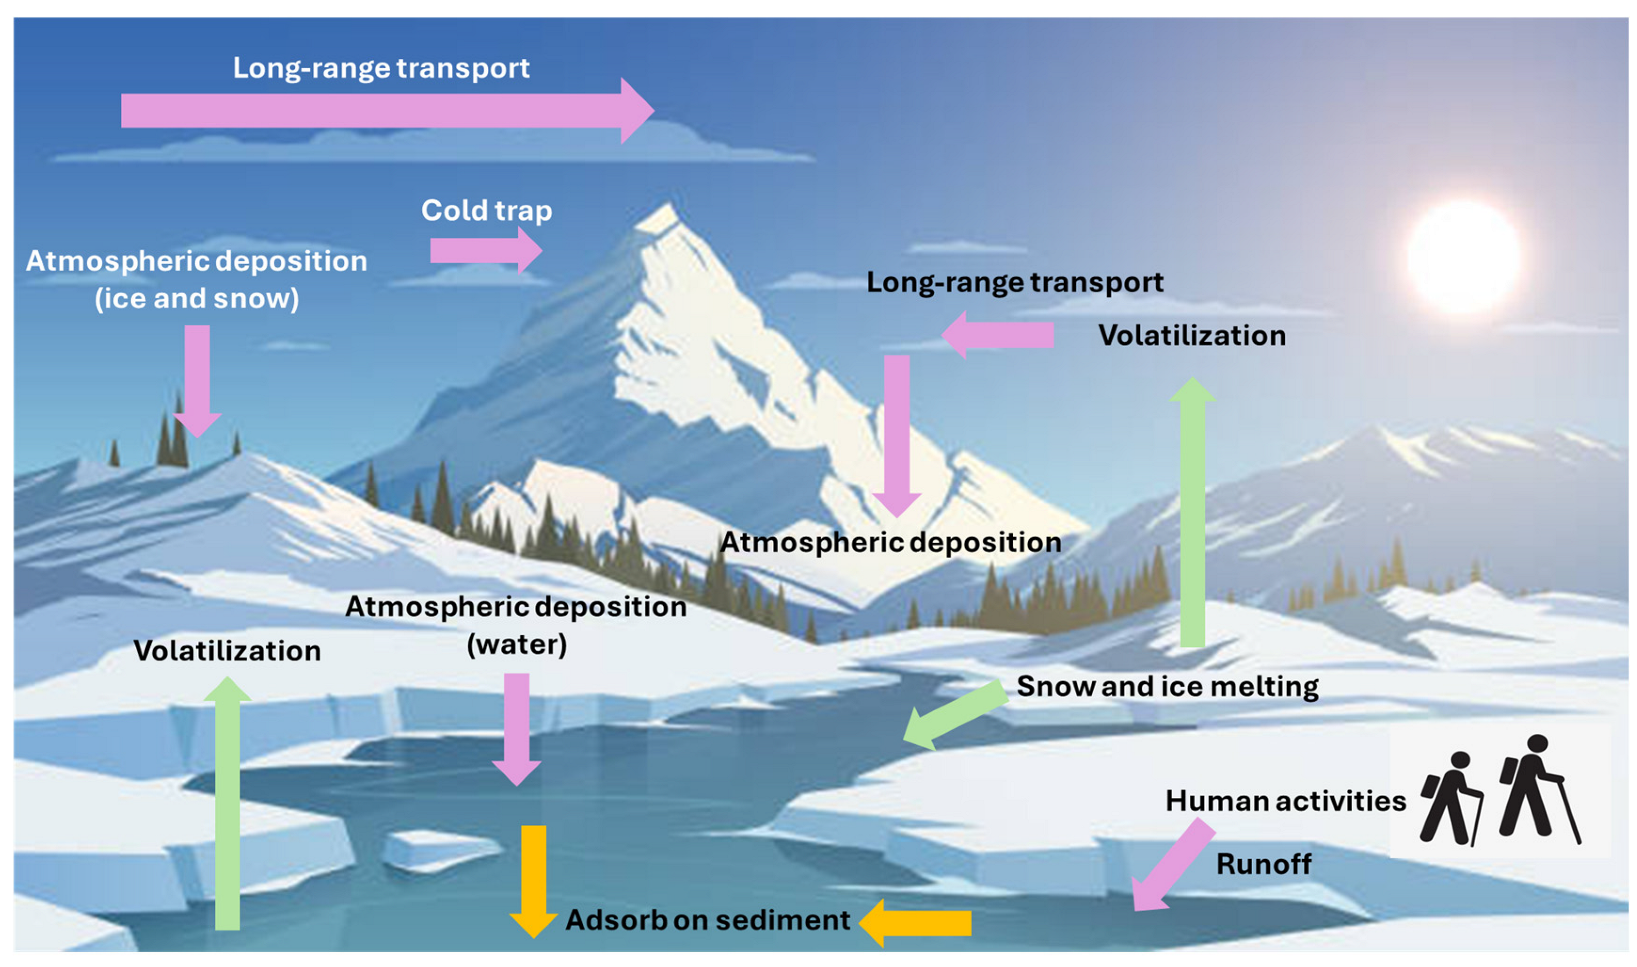
4.3. Air, Ice and Snow

The presence of linear and branched PFAS in the atmosphere of the Tibetan Plateau, Arctic, and remote oceanic areas also confirms their ability to undergo long-range atmospheric transport. PFAS precursors like FTOHs, FOSA, and FOSE are volatile and exist mostly in the gaseous phase rather than being bound to particles. The high volatility of 8:2 FTOH and 10:2 FTOH allows them to travel thousands of kilometers from their sources before undergoing degradation or deposition (Figure 3) [57,58]. Additionally, linear PFAS predominantly exist in the gaseous state (>90%) in marine environments, facilitating long-range transport due to their longer atmospheric residence time.
Branched PFAS are more likely to associate with particulate matter, potentially leading to localized deposition in certain areas. This is because branched PFAS have a bulkier, less compact molecular structure than their linear counterparts. This structure leads to a higher molecular surface area and steric hindrance, which can enhance their interaction with airborne particulate matter [85]. Branched PFAS generally exhibit lower volatility. Since branched PFAS are more likely to be bound to particulate matter, they settle more quickly, leading to higher concentrations in specific regions rather than being evenly distributed via long-range atmospheric transport [56].
The temporal increase in PFAS fluxes in Arctic ice cores and snowpack, especially for PFOA and PFNA, indicates continuous environmental input, either from atmospheric deposition or oceanic sources. Net evaporation of FTOHs and FTAs from snow indicates that snow can be a temporary reservoir, re-releasing these compounds into the atmosphere during warmer periods (Figure 3) [60].
Regional climatic phenomena influence PFAS deposition patterns. For instance, the Indian monsoon plays a major role in transporting PFAAs to the eastern Tibetan Plateau, while temperature fluctuations affect snow-to-air exchange in the Arctic [68,75]. Short-chain PFCAs (especially PFBA) are frequently the most prevalent, particularly in Antarctic and Arctic snow, reflecting a shift toward shorter-chain PFAS in global production and environmental occurrence. This shift toward shorter-chain PFAS is probably due to regulatory restrictions of more persistent longer-chain PFAS. PFBA concentrations accounted for over 70% of the total PFAAs in Antarctic samples, consistent with the findings of high PFBA levels in other global regions. Glacial snowpacks act as temporary reservoirs for PFAS, releasing them seasonally into the surrounding environment. Meltwater from glaciers and snow contributes to the redistribution of PFAS (Figure 3), as observed in the Khumbu Glacier and Lake Hazen [30,61]. The elevated PFAS levels near research stations in Antarctica and trekking activities on Mt. Everest support local contamination sources in addition to long-range atmospheric transport.

4.4. Soil

In soil, PFBA, PFNA, and PFOA are the most abundant PFCAs across multiple regions (e.g., Svalbard and Melville Island), suggesting common atmospheric precursors (e.g., FTOHs) and widespread human-derived sources. The oxidation of volatile precursors contributes to the presence of PFCAs. The rising PFAS concentrations at higher altitudes in the Tibetan Plateau indicate that mountainous regions act as cold traps where volatile precursors condense and accumulate in the soil (Figure 3). The identification of newer PFAS, such as Cl-PFESA, HFPO, and FTS, in the Tibetan Plateau indicates the evolving complexity of PFAS contamination. The PFAS concentrations in the Tibetan Plateau and Svalbard (0.12 to 4.84 ng/g) are comparable to other remote regions like Arctic soils and forest soils in Sweden [76,77].

4.5. Limitations and Potential Bioaccumulation

This review, which primarily aims to examine the spatial variation of PFAS in the environmental media in remote regions, is limited in addressing the temporal variation. The presence of PFAS in the abiotic remote environments has raised concerns about their potential bioaccumulation in organisms in these remote areas. While biotic PFAS occurrence in remote areas is outside the scope of this review, a short illustration is provided here in addition to the detection of PFAS in Antarctic penguins’ excreta to highlight the bioaccumulation risk. In the Arctic region, the average and median levels of PFNA detected in thick-billed murres (Uria lomvia) were found to be as low as 0.55 ng/g wet weight [86], while polar bears exhibited much higher levels, reaching up to 38 ng/g [87]. It was observed that PFOS levels exceeded those of PFNA in every plasma and serum sample that was examined. The trends in PFOS concentrations mirrored those of PFNA in plasma and serum samples, with notable exceptions for the Arctic fox (Vulpes lagopus) and walrus (Odobenus rosmarus). Among the species studied, thick-billed murres had the lowest PFOS concentrations at 2.6 ng/g w.w. [86], whereas polar bears had the highest concentrations, which ranged from 111 to 125 ng/g [87].
The PFNA concentrations in liver tissue varied significantly, with mean values spanning from 0.18 ng/g wet weight observed in Atlantic cod (Gadus morhua) to a high of 510 ng/g wet weight in polar bears [88]. In contrast, PFOS concentrations were documented as low as below the detection limit in Arctic char [89] and peaked at 3100 ng/g wet weight in polar bears [90]. The reported average and median PFNA levels in polar bears were found to be 3.8 to 21 times higher than the maximum levels recorded in ringed seals’ livers [91] and between 32 and 176 times higher than those in caribou’s livers [92].
Polar bears, being apex predators, exhibit the highest PFNA and PFOS concentrations in plasma, serum, and liver tissues, indicating strong biomagnification through the marine food web. Polar bears primarily consume seals, which already have elevated PFAS levels, leading to further accumulation. PFAS levels are generally lower in lower trophic-level species. For instance, Atlantic cod had very low PFNA levels (0.18 ng/g wet weight).

5. Conclusions

The global detection of PFAS in soils across remote and high-altitude regions, such as the Tibetan Plateau, Svalbard, Melville Island, and the poles, underscores the pervasive and persistent nature of these pollutants. The dominance of PFCAs—particularly PFBA, PFNA, and PFOA—and the prevalence of newer PFAS reveal the evolving complexity of PFAS contamination. Environmental factors such as cold-trapping effects, long-range atmospheric transport, and regional human activities significantly influence the spatial distribution and concentration patterns of PFAS in soils.
These findings highlight the urgent need for enhanced global monitoring and regulatory measures to mitigate the long-term environmental risks posed by PFAS. The presence of PFAS in soils further emphasizes the potential for bioaccumulation and human exposure, even in remote regions, as PFAS could enter the food chain through water flowing from these remote areas and organisms in these areas. Given the persistence of these compounds and their complex environmental cycling, future research should focus on understanding their fate and transport, as well as identifying effective remediation strategies to reduce their impact on sensitive ecosystems. Particularly, future studies should focus on identifying and quantifying primary sources of PFAS in remote and high-altitude regions. Differentiating between local sources, such as research stations and tourism activities, and long-range atmospheric transport will clarify their origins. Studies should expand beyond legacy PFAS (e.g., PFOA, PFOS) to monitor emerging and lesser-studied compounds like Cl-PFESA, HFPO, and FTS. Understanding the behavior, persistence, and toxicity of these newer compounds is crucial for assessing their long-term environmental impact.

Funding

This research received no external funding.

Data Availability Statement

No new data were created or analyzed in this study. Data sharing is not applicable to this article.

Conflicts of Interest

The author declares no conflict of interest.

Abbreviations

The following abbreviations are used in this manuscript:
Cl-PFESAChlorinated polyfluorinated ether sulfonic acid
EtFOSAAN-ethyl perfluorooctane sulfonamidoacetic acid
FBSAPerfluorobutane sulfonamide
FOSA/PFOSAFluorinated/perfluorooctane sulfonamide
FOSEPerfluorooctane sulfonamidoethanol
FTAFluorotelomer acrylate
FTSFlurorotelomer sulfonate
FTOHFluorotelomer alcohol
HFPOHexafluoropropylene oxide
HFPO-DA2-(Heptafluoropropoxy)propanoic acid
MeFOSAAN-methyl perfluorooctane sulfonamidoacetic acid
PFAAPerfluoroalkyl acid
PFCAPerfluoroalkyl carboxylic acid
PFBAPerfluorobutanoic acid
PFBSPerfluorobutane sulfonate
PFDAPerfluorodecanoic acid
PFDoDAPerfluorododecanoic acid
PFECHSPerfluoroethylcyclohexane sulfonate
PFHpAPerfluoroheptanoic acid
PFHpSPerfluoroheptane sulfonate
PFHxAPerfluorohexanoic acid
PFHxSPerfluorohexane sulfonate
PFOAPerfluorooctanoic acid
PFOSPerfluorooctane sulfonic acid
PFNAPerfluorononanoic acid
PFPeAPerfluoropentanoic acid
PFSAPerfluoroalkyl sulfonic acid
PFTeDAPerfluorotetradecanoic acid
PFTrDAPerfluorotridecanoic acid
PFUnDAPerfluoroundecanoic acid
TFATrifluoroacetic acid

References

  1. Gaines, L.G.T. Historical and current usage of per- and polyfluoroalkyl substances (PFAS): A literature review. Am. J. Ind. Med. 2023, 66, 353–378. [Google Scholar] [CrossRef] [PubMed]
  2. Tang, K.H.D. Per-and polyfluoroalkyl substances (PFAS) in wastewater streams: Occurrence and current treatment. Acad. Eng. 2023, 1. [Google Scholar] [CrossRef]
  3. Manojkumar, Y.; Pilli, S.; Rao, P.V.; Tyagi, R.D. Sources, occurrence and toxic effects of emerging per- and polyfluoroalkyl substances (PFAS). Neurotox. Teratol. 2023, 97, 107174. [Google Scholar] [CrossRef] [PubMed]
  4. Ao, J.; Yuan, T.; Xia, H.; Ma, Y.; Shen, Z.; Shi, R.; Tian, Y.; Zhang, J.; Ding, W.; Gao, L.; et al. Characteristic and human exposure risk assessment of per- and polyfluoroalkyl substances: A study based on indoor dust and drinking water in China. Environ. Pollut. 2019, 254, 112873. [Google Scholar] [CrossRef]
  5. Macorps, N.; Labadie, P.; Lestremau, F.; Assoumani, A.; Budzinski, H. Per- and polyfluoroalkyl substances (PFAS) in surface sediments: Occurrence, patterns, spatial distribution and contribution of unattributed precursors in French aquatic environments. Sci. Total Environ. 2023, 874, 162493. [Google Scholar] [CrossRef]
  6. Kourtchev, I.; Sebben, B.G.; Brill, S.; Barbosa, C.G.G.; Weber, B.; Ferreira, R.R.; D’Oliveira, F.A.F.; Dias-Junior, C.Q.; Popoola, O.A.M.; Williams, J.; et al. Occurrence of a “forever chemical” in the atmosphere above pristine Amazon Forest. Sci. Total Environ. 2024, 944, 173918. [Google Scholar] [CrossRef]
  7. Mroczko, O.; Preisendanz, H.E.; Wilson, C.; Mashtare, M.L.; Elliott, H.A.; Veith, T.L.; Soder, K.J.; Watson, J.E. Spatiotemporal patterns of PFAS in water and crop tissue at a beneficial wastewater reuse site in central Pennsylvania. J. Environ. Qual. 2022, 51, 1282–1297. [Google Scholar] [CrossRef]
  8. Drew, R.; Hagen, T.G.; Champness, D. Accumulation of PFAS by livestock—Determination of transfer factors from water to serum for cattle and sheep in Australia. Food Addit. Contam. Part A 2021, 38, 1897–1913. [Google Scholar] [CrossRef]
  9. Chu, S.; Letcher, R.J.; McGoldrick, D.J.; Backus, S.M. A New Fluorinated Surfactant Contaminant in Biota: Perfluorobutane Sulfonamide in Several Fish Species. Environ. Sci. Technol. 2016, 50, 669–675. [Google Scholar] [CrossRef]
  10. Olsen, G.W.; Mair, D.C.; Lange, C.C.; Harrington, L.M.; Church, T.R.; Goldberg, C.L.; Herron, R.M.; Hanna, H.; Nobiletti, J.B.; Rios, J.A.; et al. Per- and polyfluoroalkyl substances (PFAS) in American Red Cross adult blood donors, 2000–2015. Environ. Res. 2017, 157, 87–95. [Google Scholar] [CrossRef]
  11. Zhang, T.; Sun, H.; Qin, X.; Gan, Z.; Kannan, K. PFOS and PFOA in paired urine and blood from general adults and pregnant women: Assessment of urinary elimination. Environ. Sci. Pollut. Res. 2015, 22, 5572–5579. [Google Scholar] [CrossRef] [PubMed]
  12. Lu, Y.; Meng, L.; Ma, D.; Cao, H.; Liang, Y.; Liu, H.; Wang, Y.; Jiang, G. The occurrence of PFAS in human placenta and their binding abilities to human serum albumin and organic anion transporter 4. Environ. Pollut. 2021, 273, 116460. [Google Scholar] [CrossRef] [PubMed]
  13. Tang, K.H.D. Environmental Co-existence of Microplastics and Perfluorochemicals: A Review of Their Interactions. Biointerface Res. Appl. Chem. 2023, 13, 587. [Google Scholar]
  14. Tang, K.H.D.; Li, R. Aged Microplastics and Antibiotic Resistance Genes: A Review of Aging Effects on Their Interactions. Antibiotics 2024, 13, 941. [Google Scholar] [CrossRef]
  15. Podder, A.; Sadmani, A.H.M.A.; Reinhart, D.; Chang, N.-B.; Goel, R. Per and poly-fluoroalkyl substances (PFAS) as a contaminant of emerging concern in surface water: A transboundary review of their occurrences and toxicity effects. J. Hazard. Mater. 2021, 419, 126361. [Google Scholar] [CrossRef]
  16. Kurwadkar, S.; Dane, J.; Kanel, S.R.; Nadagouda, M.N.; Cawdrey, R.W.; Ambade, B.; Struckhoff, G.C.; Wilkin, R. Per- and polyfluoroalkyl substances in water and wastewater: A critical review of their global occurrence and distribution. Sci. Total Environ. 2022, 809, 151003. [Google Scholar] [CrossRef]
  17. Faust, J.A. PFAS on atmospheric aerosol particles: A review. Environ. Sci. Process. Impacts 2023, 25, 133–150. [Google Scholar] [CrossRef]
  18. Vendl, C.; Taylor, M.D.; Bräunig, J.; Ricolfi, L.; Ahmed, R.; Chin, M.; Gibson, M.J.; Hesselson, D.; Neely, G.G.; Lagisz, M.; et al. Profiling research on PFAS in wildlife: Systematic evidence map and bibliometric analysis. Ecol. Solut. Evid. 2024, 5, e12292. [Google Scholar] [CrossRef]
  19. Langberg, H.A.; Hale, S.E.; Breedveld, G.D.; Jenssen, B.M.; Jartun, M. A review of PFAS fingerprints in fish from Norwegian freshwater bodies subject to different source inputs. Environ. Sci. Process. Impacts 2022, 24, 330–342. [Google Scholar] [CrossRef]
  20. Death, C.; Bell, C.; Champness, D.; Milne, C.; Reichman, S.; Hagen, T. Per- and polyfluoroalkyl substances (PFAS) in livestock and game species: A review. Sci. Total Environ. 2021, 774, 144795. [Google Scholar] [CrossRef]
  21. Kucharzyk, K.H.; Darlington, R.; Benotti, M.; Deeb, R.; Hawley, E. Novel treatment technologies for PFAS compounds: A critical review. J. Environ. Manag. 2017, 204, 757–764. [Google Scholar] [CrossRef] [PubMed]
  22. Tang, K.H.D.; Kristanti, R.A. Bioremediation of perfluorochemicals: Current state and the way forward. Bioprocess Biosyst. Eng. 2022, 45, 1093–1109. [Google Scholar] [CrossRef] [PubMed]
  23. Tang, K.H.D. Phytoremediation of perfluorochemicals: A review of its advances, feasibility and limitations. Environ. Toxicol. Manag. 2023, 3, 1–7. [Google Scholar] [CrossRef]
  24. Sharma, S.; Shetti, N.P.; Basu, S.; Nadagouda, M.N.; Aminabhavi, T.M. Remediation of per- and polyfluoroalkyls (PFAS) via electrochemical methods. Chem. Eng. J. 2022, 430, 132895. [Google Scholar] [CrossRef]
  25. Lescord, G.L.; Kidd, K.A.; De Silva, A.O.; Williamson, M.; Spencer, C.; Wang, X.; Muir, D.C.G. Perfluorinated and Polyfluorinated Compounds in Lake Food Webs from the Canadian High Arctic. Environ. Sci. Technol. 2015, 49, 2694–2702. [Google Scholar] [CrossRef]
  26. Muir, D.; Bossi, R.; Carlsson, P.; Evans, M.; De Silva, A.; Halsall, C.; Rauert, C.; Herzke, D.; Hung, H.; Letcher, R.; et al. Levels and trends of poly- and perfluoroalkyl substances in the Arctic environment—An update. Emerg. Contam. 2019, 5, 240–271. [Google Scholar] [CrossRef]
  27. De Silva, A.O.; Spencer, C.; Scott, B.F.; Backus, S.; Muir, D.C.G. Detection of a Cyclic Perfluorinated Acid, Perfluoroethylcyclohexane Sulfonate, in the Great Lakes of North America. Environ. Sci. Technol. 2011, 45, 8060–8066. [Google Scholar] [CrossRef]
  28. Ahmed, M.B.; Johir, M.A.H.; McLaughlan, R.; Nguyen, L.N.; Xu, B.; Nghiem, L.D. Per- and polyfluoroalkyl substances in soil and sediments: Occurrence, fate, remediation and future outlook. Sci. Total Environ. 2020, 748, 141251. [Google Scholar] [CrossRef]
  29. Hubert, M.; Arp, H.P.H.; Hansen, M.C.; Castro, G.; Meyn, T.; Asimakopoulos, A.G.; Hale, S.E. Influence of grain size, organic carbon and organic matter residue content on the sorption of per- and polyfluoroalkyl substances in aqueous film forming foam contaminated soils—Implications for remediation using soil washing. Sci. Total Environ. 2023, 875, 162668. [Google Scholar] [CrossRef]
  30. MacInnis, J.J.; Lehnherr, I.; Muir, D.C.G.; Quinlan, R.; De Silva, A.O. Characterization of perfluoroalkyl substances in sediment cores from High and Low Arctic lakes in Canada. Sci. Total Environ. 2019, 666, 414–422. [Google Scholar] [CrossRef]
  31. Li, J.; Li, X.; Zhu, Y.; Wang, L.; Ren, S.; An, R.; Zhang, Q.; Wang, G. The first survey of legacy and emerging per- and polyfluoroalkyl substances (PFAS) in Hulun Lake, China: Occurrence, sources, and environmental impacts. Emerg. Contam. 2025, 11, 100431. [Google Scholar] [CrossRef]
  32. Dasu, K.; Xia, X.; Siriwardena, D.; Klupinski, T.P.; Seay, B. Concentration profiles of per- and polyfluoroalkyl substances in major sources to the environment. J. Environ. Manag. 2022, 301, 113879. [Google Scholar] [CrossRef] [PubMed]
  33. DeNicola, M.; Lin, Z.; Quiñones, O.; Vanderford, B.; Song, M.; Westerhoff, P.; Dickenson, E.; Hanigan, D. Per- and polyfluoroalkyl substances and organofluorine in lakes and waterways of the northwestern Great Basin and Sierra Nevada. Sci. Total Environ. 2023, 905, 166971. [Google Scholar] [CrossRef]
  34. Sharma, B.M.; Bharat, G.K.; Tayal, S.; Larssen, T.; Bečanová, J.; Karásková, P.; Whitehead, P.G.; Futter, M.N.; Butterfield, D.; Nizzetto, L. Perfluoroalkyl substances (PFAS) in river and ground/drinking water of the Ganges River basin: Emissions and implications for human exposure. Environ. Pollut. 2016, 208, 704–713. [Google Scholar] [CrossRef]
  35. Casas, G.; Iriarte, J.; D’Agostino, L.A.; Roscales, J.L.; Martinez-Varela, A.; Vila-Costa, M.; Martin, J.W.; Jiménez, B.; Dachs, J. Inputs, amplification and sinks of perfluoroalkyl substances at coastal Antarctica. Environ. Pollut. 2023, 338, 122608. [Google Scholar] [CrossRef]
  36. Cai, M.; Yang, H.; Xie, Z.; Zhao, Z.; Wang, F.; Lu, Z.; Sturm, R.; Ebinghaus, R. Per- and polyfluoroalkyl substances in snow, lake, surface runoff water and coastal seawater in Fildes Peninsula, King George Island, Antarctica. J. Hazard. Mater. 2012, 209–210, 335–342. [Google Scholar] [CrossRef]
  37. Shan, G.; Qian, X.; Chen, X.; Feng, X.; Cai, M.; Yang, L.; Chen, M.; Zhu, L.; Zhang, S. Legacy and emerging per- and poly-fluoroalkyl substances in surface seawater from northwestern Pacific to Southern Ocean: Evidences of current and historical release. J. Hazard. Mater. 2021, 411, 125049. [Google Scholar] [CrossRef]
  38. Yeung, L.W.Y.; Dassuncao, C.; Mabury, S.; Sunderland, E.M.; Zhang, X.; Lohmann, R. Vertical Profiles, Sources, and Transport of PFASs in the Arctic Ocean. Environ. Sci. Technol. 2017, 51, 6735–6744. [Google Scholar] [CrossRef]
  39. Lin, Y.; Jiang, J.-J.; Rodenburg, L.A.; Cai, M.; Wu, Z.; Ke, H.; Chitsaz, M. Perfluoroalkyl substances in sediments from the Bering Sea to the western Arctic: Source and pathway analysis. Environ. Int. 2020, 139, 105699. [Google Scholar] [CrossRef]
  40. Muir, D.; Miaz, L.T. Spatial and Temporal Trends of Perfluoroalkyl Substances in Global Ocean and Coastal Waters. Environ. Sci. Technol. 2021, 55, 9527–9537. [Google Scholar] [CrossRef]
  41. Ali, A.M.; Langberg, H.A.; Hale, S.E.; Kallenborn, R.; Hartz, W.F.; Mortensen, Å.-K.; Ciesielski, T.M.; McDonough, C.A.; Jenssen, B.M.; Breedveld, G.D. The fate of poly- and perfluoroalkyl substances in a marine food web influenced by land-based sources in the Norwegian Arctic. Environ. Sci. Process. Impacts 2021, 23, 588–604. [Google Scholar] [CrossRef]
  42. Han, T.; Chen, J.; Lin, K.; He, X.; Li, S.; Xu, T.; Xin, M.; Wang, B.; Liu, C.; Wang, J. Spatial distribution, vertical profiles and transport of legacy and emerging per- and polyfluoroalkyl substances in the Indian Ocean. J. Hazard. Mater. 2022, 437, 129264. [Google Scholar] [CrossRef] [PubMed]
  43. González-Gaya, B.; Dachs, J.; Roscales, J.L.; Caballero, G.; Jiménez, B. Perfluoroalkylated Substances in the Global Tropical and Subtropical Surface Oceans. Environ. Sci. Technol. 2014, 48, 13076–13084. [Google Scholar] [CrossRef] [PubMed]
  44. Hodgkins, L.M.; Mulligan, R.P.; McCallum, J.M.; Weber, K.P. Modelling the transport of shipborne per-and polyfluoroalkyl substances (PFAS) in the coastal environment. Sci. Total Environ. 2019, 658, 602–613. [Google Scholar] [CrossRef]
  45. Miranda, D.d.A.; Leonel, J.; Benskin, J.P.; Johansson, J.; Hatje, V. Perfluoroalkyl Substances in the Western Tropical Atlantic Ocean. Environ. Sci. Technol. 2021, 55, 13749–13758. [Google Scholar] [CrossRef]
  46. Joerss, H.; Xie, Z.; Wagner, C.C.; von Appen, W.-J.; Sunderland, E.M.; Ebinghaus, R. Transport of Legacy Perfluoroalkyl Substances and the Replacement Compound HFPO-DA through the Atlantic Gateway to the Arctic Ocean—Is the Arctic a Sink or a Source? Environ. Sci. Technol. 2020, 54, 9958–9967. [Google Scholar] [CrossRef]
  47. Kahkashan, S.; Wang, X.; Chen, J.; Bai, Y.; Ya, M.; Wu, Y.; Cai, Y.; Wang, S.; Saleem, M.; Aftab, J.; et al. Concentration, distribution and sources of perfluoroalkyl substances and organochlorine pesticides in surface sediments of the northern Bering Sea, Chukchi Sea and adjacent Arctic Ocean. Chemosphere 2019, 235, 959–968. [Google Scholar] [CrossRef]
  48. Casal, P.; Zhang, Y.; Martin, J.W.; Pizarro, M.; Jiménez, B.; Dachs, J. Role of Snow Deposition of Perfluoroalkylated Substances at Coastal Livingston Island (Maritime Antarctica). Environ. Sci. Technol. 2017, 51, 8460–8470. [Google Scholar] [CrossRef]
  49. Llorca, M.; Farré, M.; Tavano, M.S.; Alonso, B.; Koremblit, G.; Barceló, D. Fate of a broad spectrum of perfluorinated compounds in soils and biota from Tierra del Fuego and Antarctica. Environ. Pollut. 2012, 163, 158–166. [Google Scholar] [CrossRef]
  50. Wang, X.; Schuster, J.; Jones, K.C.; Gong, P. Occurrence and spatial distribution of neutral perfluoroalkyl substances and cyclic volatile methylsiloxanes in the atmosphere of the Tibetan Plateau. Atmos. Chem. Phys. 2018, 18, 8745–8755. [Google Scholar] [CrossRef]
  51. Zhao, Z.; Tang, J.; Mi, L.; Tian, C.; Zhong, G.; Zhang, G.; Wang, S.; Li, Q.; Ebinghaus, R.; Xie, Z.; et al. Perfluoroalkyl and polyfluoroalkyl substances in the lower atmosphere and surface waters of the Chinese Bohai Sea, Yellow Sea, and Yangtze River estuary. Sci. Total Environ. 2017, 599–600, 114–123. [Google Scholar] [CrossRef] [PubMed]
  52. Fang, X.; Wang, Q.; Zhao, Z.; Tang, J.; Tian, C.; Yao, Y.; Yu, J.; Sun, H. Distribution and dry deposition of alternative and legacy perfluoroalkyl and polyfluoroalkyl substances in the air above the Bohai and Yellow Seas, China. Atmos. Environ. 2018, 192, 128–135. [Google Scholar] [CrossRef]
  53. Lai, S.; Song, J.; Song, T.; Huang, Z.; Zhang, Y.; Zhao, Y.; Liu, G.; Zheng, J.; Mi, W.; Tang, J.; et al. Neutral polyfluoroalkyl substances in the atmosphere over the northern South China Sea. Environ. Pollut. 2016, 214, 449–455. [Google Scholar] [CrossRef] [PubMed]
  54. Xie, Z.; Wang, Z.; Mi, W.; Möller, A.; Wolschke, H.; Ebinghaus, R. Neutral Poly-/perfluoroalkyl Substances in Air and Snow from the Arctic. Sci. Rep. 2015, 5, 8912. [Google Scholar] [CrossRef]
  55. Wong, F.; Hung, H.; Dryfhout-Clark, H.; Aas, W.; Bohlin-Nizzetto, P.; Breivik, K.; Mastromonaco, M.N.; Lundén, E.B.; Ólafsdóttir, K.; Sigurðsson, Á.; et al. Time trends of persistent organic pollutants (POPs) and Chemicals of Emerging Arctic Concern (CEAC) in Arctic air from 25 years of monitoring. Sci. Total Environ. 2021, 775, 145109. [Google Scholar] [CrossRef]
  56. Rauert, C.; Shoieb, M.; Schuster, J.K.; Eng, A.; Harner, T. Atmospheric concentrations and trends of poly- and perfluoroalkyl substances (PFAS) and volatile methyl siloxanes (VMS) over 7 years of sampling in the Global Atmospheric Passive Sampling (GAPS) network. Environ. Pollut. 2018, 238, 94–102. [Google Scholar] [CrossRef]
  57. Bossi, R.; Vorkamp, K.; Skov, H. Concentrations of organochlorine pesticides, polybrominated diphenyl ethers and perfluorinated compounds in the atmosphere of North Greenland. Environ. Pollut. 2016, 217, 4–10. [Google Scholar] [CrossRef]
  58. Ahrens, L.; Shoeib, M.; Del Vento, S.; Codling, G.; Halsall, C. Polyfluoroalkyl compounds in the Canadian Arctic atmosphere. Environ. Chem. 2011, 8, 399–406. [Google Scholar] [CrossRef]
  59. Hartz, W.F.; Björnsdotter, M.K.; Yeung, L.W.Y.; Hodson, A.; Thomas, E.R.; Humby, J.D.; Day, C.; Jogsten, I.E.; Kärrman, A.; Kallenborn, R. Levels and distribution profiles of Per- and Polyfluoroalkyl Substances (PFAS) in a high Arctic Svalbard ice core. Sci. Total Environ. 2023, 871, 161830. [Google Scholar] [CrossRef]
  60. Thackray, C.P.; Selin, N.E.; Young, C.J. A global atmospheric chemistry model for the fate and transport of PFCAs and their precursors. Environ. Sci. Process. Impacts 2020, 22, 285–293. [Google Scholar] [CrossRef]
  61. Miner, K.R.; Clifford, H.; Taruscio, T.; Potocki, M.; Solomon, G.; Ritari, M.; Napper, I.E.; Gajurel, A.P.; Mayewski, P.A. Deposition of PFAS ‘forever chemicals’ on Mt. Everest. Sci. Total Environ. 2021, 759, 144421. [Google Scholar] [CrossRef] [PubMed]
  62. Schellenberger, S.; Hill, P.J.; Levenstam, O.; Gillgard, P.; Cousins, I.T.; Taylor, M.; Blackburn, R.S. Highly fluorinated chemicals in functional textiles can be replaced by re-evaluating liquid repellency and end-user requirements. J. Clean. Prod. 2019, 217, 134–143. [Google Scholar] [CrossRef]
  63. MacInnis, J.J.; Lehnherr, I.; Muir, D.C.G.; St. Pierre, K.A.; St. Louis, V.L.; Spencer, C.; De Silva, A.O. Fate and Transport of Perfluoroalkyl Substances from Snowpacks into a Lake in the High Arctic of Canada. Environ. Sci. Technol. 2019, 53, 10753–10762. [Google Scholar] [CrossRef] [PubMed]
  64. MacInnis, J.J.; French, K.; Muir, D.C.G.; Spencer, C.; Criscitiello, A.; De Silva, A.O.; Young, C.J. Emerging investigator series: A 14-year depositional ice record of perfluoroalkyl substances in the High Arctic. Environ. Sci. Process. Impacts 2017, 19, 22–30. [Google Scholar] [CrossRef]
  65. Pickard, H.M.; Criscitiello, A.S.; Spencer, C.; Sharp, M.J.; Muir, D.C.G.; De Silva, A.O.; Young, C.J. Continuous non-marine inputs of per- and polyfluoroalkyl substances to the High Arctic: A multi-decadal temporal record. Atmos. Chem. Phys. 2018, 18, 5045–5058. [Google Scholar] [CrossRef]
  66. Casas, G.; Martinez-Varela, A.; Vila-Costa, M.; Jiménez, B.; Dachs, J. Rain Amplification of Persistent Organic Pollutants. Environ. Sci. Technol. 2021, 55, 12961–12972. [Google Scholar] [CrossRef]
  67. Xie, Z.; Wang, Z.; Magand, O.; Thollot, A.; Ebinghaus, R.; Mi, W.; Dommergue, A. Occurrence of legacy and emerging organic contaminants in snow at Dome C in the Antarctic. Sci. Total Environ. 2020, 741, 140200. [Google Scholar] [CrossRef]
  68. Chen, M.; Wang, C.; Gao, K.; Wang, X.; Fu, J.; Gong, P.; Wang, Y. Perfluoroalkyl substances in precipitation from the Tibetan Plateau during monsoon season: Concentrations, source regions and mass fluxes. Chemosphere 2021, 282, 131105. [Google Scholar] [CrossRef]
  69. Kirchgeorg, T.; Dreyer, A.; Gabrielli, P.; Gabrieli, J.; Thompson, L.G.; Barbante, C.; Ebinghaus, R. Seasonal accumulation of persistent organic pollutants on a high altitude glacier in the Eastern Alps. Environ. Pollut. 2016, 218, 804–812. [Google Scholar] [CrossRef]
  70. Codling, G.; Halsall, C.; Ahrens, L.; Del Vento, S.; Wiberg, K.; Bergknut, M.; Laudon, H.; Ebinghaus, R. The fate of per- and polyfluoroalkyl substances within a melting snowpack of a boreal forest. Environ. Pollut. 2014, 191, 190–198. [Google Scholar] [CrossRef]
  71. Plassmann, M.M.; Berger, U. Perfluoroalkyl carboxylic acids with up to 22 carbon atoms in snow and soil samples from a ski area. Chemosphere 2013, 91, 832–837. [Google Scholar] [CrossRef] [PubMed]
  72. Ahrens, L.; Rakovic, J.; Ekdahl, S.; Kallenborn, R. Environmental distribution of per- and polyfluoroalkyl substances (PFAS) on Svalbard: Local sources and long-range transport to the Arctic. Chemosphere 2023, 345, 140463. [Google Scholar] [CrossRef] [PubMed]
  73. Huang, K.; Li, Y.; Bu, D.; Fu, J.; Wang, M.; Zhou, W.; Gu, L.; Fu, Y.; Cong, Z.; Hu, B.; et al. Trophic Magnification of Short-Chain Per- and Polyfluoroalkyl Substances in a Terrestrial Food Chain from the Tibetan Plateau. Environ. Sci. Technol. Lett. 2022, 9, 147–152. [Google Scholar] [CrossRef]
  74. Bangma, J.T.; Reiner, J.; Fry, R.C.; Manuck, T.; McCord, J.; Strynar, M.J. Identification of an Analytical Method Interference for Perfluorobutanoic Acid in Biological Samples. Environ. Sci. Technol. Lett. 2021, 8, 1085–1090. [Google Scholar] [CrossRef]
  75. Zhou, J.; Zhao, G.; Li, M.; Li, J.; Liang, X.; Yang, X.; Guo, J.; Wang, T.; Zhu, L. Three-dimensional spatial distribution of legacy and novel poly/perfluoroalkyl substances in the Tibetan Plateau soil: Implications for transport and sources. Environ. Int. 2022, 158, 107007. [Google Scholar] [CrossRef]
  76. Dai, S.; Zhang, G.; Dong, C.; Yang, R.; Pei, Z.; Li, Y.; Li, A.; Zhang, Q.; Jiang, G. Occurrence, bioaccumulation and trophodynamics of per- and polyfluoroalkyl substances (PFAS) in terrestrial and marine ecosystems of Svalbard, Arctic. Water Res. 2025, 271, 122979. [Google Scholar] [CrossRef]
  77. Sörengård, M.; Kikuchi, J.; Wiberg, K.; Ahrens, L. Spatial distribution and load of per- and polyfluoroalkyl substances (PFAS) in background soils in Sweden. Chemosphere 2022, 295, 133944. [Google Scholar] [CrossRef]
  78. Meng, J.; Wang, T.; Song, S.; Wang, P.; Li, Q.; Zhou, Y.; Lu, Y. Tracing perfluoroalkyl substances (PFASs) in soils along the urbanizing coastal area of Bohai and Yellow Seas, China. Environ. Pollut. 2018, 238, 404–412. [Google Scholar] [CrossRef]
  79. Lee, Y.-M.; Lee, J.-Y.; Kim, M.-K.; Yang, H.; Lee, J.-E.; Son, Y.; Kho, Y.; Choi, K.; Zoh, K.-D. Concentration and distribution of per- and polyfluoroalkyl substances (PFAS) in the Asan Lake area of South Korea. J. Hazard. Mater. 2020, 381, 120909. [Google Scholar] [CrossRef]
  80. Cabrerizo, A.; Muir, D.C.G.; De Silva, A.O.; Wang, X.; Lamoureux, S.F.; Lafrenière, M.J. Legacy and Emerging Persistent Organic Pollutants (POPs) in Terrestrial Compartments in the High Arctic: Sorption and Secondary Sources. Environ. Sci. Technol. 2018, 52, 14187–14197. [Google Scholar] [CrossRef]
  81. Sim, W.; Park, H.; Yoon, J.-K.; Kim, J.-I.; Oh, J.-E. Characteristic distribution patterns of perfluoroalkyl substances in soils according to land-use types. Chemosphere 2021, 276, 130167. [Google Scholar] [CrossRef] [PubMed]
  82. Chen, S.; Jiao, X.-C.; Gai, N.; Li, X.-J.; Wang, X.-C.; Lu, G.-H.; Piao, H.-T.; Rao, Z.; Yang, Y.-L. Perfluorinated compounds in soil, surface water, and groundwater from rural areas in eastern China. Environ. Pollut. 2016, 211, 124–131. [Google Scholar] [CrossRef] [PubMed]
  83. Seo, S.-H.; Son, M.-H.; Shin, E.-S.; Choi, S.-D.; Chang, Y.-S. Matrix-specific distribution and compositional profiles of perfluoroalkyl substances (PFASs) in multimedia environments. J. Hazard. Mater. 2019, 364, 19–27. [Google Scholar] [CrossRef]
  84. Shan, G.; Xiang, Q.; Feng, X.; Wu, W.; Yang, L.; Zhu, L. Occurrence and sources of per- and polyfluoroalkyl substances in the ice-melting lakes of Larsemann Hills, East Antarctica. Sci. Total Environ. 2021, 781, 146747. [Google Scholar] [CrossRef] [PubMed]
  85. Tang, K.H.D. Interactions of microplastics with persistent organic pollutants and the ecotoxicological effects: A review. Trop. Aquat. Soil Pollut. 2021, 1, 24–34. [Google Scholar] [CrossRef]
  86. Choy, E.S.; Elliott, K.H.; Esparza, I.; Patterson, A.; Letcher, R.J.; Fernie, K.J. Potential disruption of thyroid hormones by perfluoroalkyl acids in an Arctic seabird during reproduction. Environ. Pollut. 2022, 305, 119181. [Google Scholar] [CrossRef]
  87. Herzke, D.; Nikiforov, V.; Yeung, L.W.Y.; Moe, B.; Routti, H.; Nygård, T.; Gabrielsen, G.W.; Hanssen, L. Targeted PFAS analyses and extractable organofluorine—Enhancing our understanding of the presence of unknown PFAS in Norwegian wildlife. Environ. Int. 2023, 171, 107640. [Google Scholar] [CrossRef]
  88. Kowalczyk, J.; Flor, M.; Karl, H.; Lahrssen-Wiederholt, M. Perfluoroalkyl substances (PFAS) in beaked redfish (Sebastes mentella) and cod (Gadus morhua) from arctic fishing grounds of Svalbard. Food Addit. Contam. Part B 2020, 13, 34–44. [Google Scholar] [CrossRef]
  89. Carlsson, P.; Crosse, J.D.; Halsall, C.; Evenset, A.; Heimstad, E.S.; Harju, M. Perfluoroalkylated substances (PFASs) and legacy persistent organic pollutants (POPs) in halibut and shrimp from coastal areas in the far north of Norway: Small survey of important dietary foodstuffs for coastal communities. Mar. Pollut. Bull. 2016, 105, 81–87. [Google Scholar] [CrossRef]
  90. Gebbink, W.A.; Bossi, R.; Rigét, F.F.; Rosing-Asvid, A.; Sonne, C.; Dietz, R. Observation of emerging per- and polyfluoroalkyl substances (PFASs) in Greenland marine mammals. Chemosphere 2016, 144, 2384–2391. [Google Scholar] [CrossRef]
  91. Boisvert, G.; Sonne, C.; Rigét, F.F.; Dietz, R.; Letcher, R.J. Bioaccumulation and biomagnification of perfluoroalkyl acids and precursors in East Greenland polar bears and their ringed seal prey. Environ. Pollut. 2019, 252, 1335–1343. [Google Scholar] [CrossRef]
  92. Roos, A.M.; Gamberg, M.; Muir, D.; Kärrman, A.; Carlsson, P.; Cuyler, C.; Lind, Y.; Bossi, R.; Rigét, F. Perfluoroalkyl substances in circum-ArcticRangifer: Caribou and reindeer. Environ. Sci. Pollut. Res. 2022, 29, 23721–23735. [Google Scholar] [CrossRef]
Figure 1. Total PFAS levels in the water or sediments of remote lakes. The red dots indicate the approximate locations of the remote lakes.
Environments 12 00088 g001
Figure 2. Total PFAS in the water or sediments of oceans. * PFAAs were measured instead of PFAS. PFAS concentrations usually decrease with distance from the shore. The red dots indicate the approximate study sites in the oceans.
Environments 12 00088 g002
Figure 3. Fluxes of PFAS (as shown by the arrows and labels) in remote environments.
Environments 12 00088 g003
Table 1. Effects of local contamination on the PFAS concentrations in lakes.
Lake and LocationTotal PFAS (ng/L for Water and ng/g w.w for Sediment)Source of Contamination
With local contamination
Meretta Lake, Cornwallis Island, CanadaUp to 153 (water); 47 (sediment)Nearby airport contamination
Resolute Lake, Cornwallis Island, Canada26 (water); 64 (sediment)Nearby airport contamination
Hulun Lake, Inner Mongolia, China3.67–8.84 (water); 0.97–1.73 (sediment)Industrial and consumer products
Tahoe Keys Marina, Lake Tahoe, USA10–25 (water)Urban runoff from South Lake Tahoe City
With no local contamination
Canadian Arctic Lakes0.027–0.754 (water)Atmospheric deposition
Sierra Nevada Alpine Lakes, USA<1 ng/L (water)No direct contamination
Deception Island, Antarctica0.28–3.9 (water)Atmospheric deposition
East Antarctica (Larsemann Hills) Lakes<0.027 (water)Mainly atmospheric deposition, possible local discharge
Lake Hazen, Ellesmere Island, Canada0.006–0.161 (sediment)Atmospheric deposition
Lake B35, Central Nunavut, Canada0.044–1.52 (sediment)Historical atmospheric deposition
Disclaimer/Publisher’s Note: The statements, opinions and data contained in all publications are solely those of the individual author(s) and contributor(s) and not of MDPI and/or the editor(s). MDPI and/or the editor(s) disclaim responsibility for any injury to people or property resulting from any ideas, methods, instructions or products referred to in the content.

